|
|||||||||||||||||||||||||||||||||||||||||||||||||||||||||||||||||||||||||||||||||||||||||||||||||||||||||||||||||||||||||||||||||||||||||||||||||||||||||||||||||||||||||||||||||||||||||||||||||||||||||||||||||||||||||||||||||||||||||||||||||||||||||||||||||||||||||||||||||||||||||||||||||||||||||||||||||||||||||||||||||||||||||||||||||||||||||||||||
| |
| Phenotypic Information (metabolism pathway, cancer, disease, phenome) |
| |
| |
| Gene-Gene Network Information: Co-Expression Network, Interacting Genes & KEGG |
| |
|


| Gene Summary for MAT1A |
| Basic gene info. | Gene symbol | MAT1A |
| Gene name | methionine adenosyltransferase I, alpha | |
| Synonyms | MAT|MATA1|SAMS|SAMS1 | |
| Cytomap | UCSC genome browser: 10q22 | |
| Genomic location | chr10 :82031575-82049434 | |
| Type of gene | protein-coding | |
| RefGenes | NM_000429.2, | |
| Ensembl id | ENSG00000151224 | |
| Description | MAT 1MAT-I/IIIS-adenosylmethionine synthase isoform type-1S-adenosylmethionine synthetase isoform type-1adoMet synthase 1adoMet synthetase 1methionine adenosyltransferase 1methionine adenosyltransferase I/III | |
| Modification date | 20141207 | |
| dbXrefs | MIM : 610550 | |
| HGNC : HGNC | ||
| Ensembl : ENSG00000151224 | ||
| HPRD : 02013 | ||
| Vega : OTTHUMG00000018613 | ||
| Protein | UniProt: go to UniProt's Cross Reference DB Table | |
| Expression | CleanEX: HS_MAT1A | |
| BioGPS: 4143 | ||
| Gene Expression Atlas: ENSG00000151224 | ||
| The Human Protein Atlas: ENSG00000151224 | ||
| Pathway | NCI Pathway Interaction Database: MAT1A | |
| KEGG: MAT1A | ||
| REACTOME: MAT1A | ||
| ConsensusPathDB | ||
| Pathway Commons: MAT1A | ||
| Metabolism | MetaCyc: MAT1A | |
| HUMANCyc: MAT1A | ||
| Regulation | Ensembl's Regulation: ENSG00000151224 | |
| miRBase: chr10 :82,031,575-82,049,434 | ||
| TargetScan: NM_000429 | ||
| cisRED: ENSG00000151224 | ||
| Context | iHOP: MAT1A | |
| cancer metabolism search in PubMed: MAT1A | ||
| UCL Cancer Institute: MAT1A | ||
| Assigned class in ccmGDB | C | |
| Top |
| Phenotypic Information for MAT1A(metabolism pathway, cancer, disease, phenome) |
| Cancer | CGAP: MAT1A |
| Familial Cancer Database: MAT1A | |
| * This gene is included in those cancer gene databases. |
|
|
|
|
|
|
| |||||||||||||||||||||||||||||||||||||||||||||||||||||||||||||||||||||||||||||||||||||||||||||||||||||||||||||||||||||||||||||||||||||||||||||||||||||||||||||||||||||||||||||||||||||||||||||||||||||||||||||||||||||||||||||||||||||||||||||||||||||||||||||||||||||||||||||||||||||||||||||||||||||||||||||||||||||||||||||||||||||||||||||||||||||||||
Oncogene 1 | Significant driver gene in | ||||||||||||||||||||||||||||||||||||||||||||||||||||||||||||||||||||||||||||||||||||||||||||||||||||||||||||||||||||||||||||||||||||||||||||||||||||||||||||||||||||||||||||||||||||||||||||||||||||||||||||||||||||||||||||||||||||||||||||||||||||||||||||||||||||||||||||||||||||||||||||||||||||||||||||||||||||||||||||||||||||||||||||||||||||||||||||||
| cf) number; DB name 1 Oncogene; http://nar.oxfordjournals.org/content/35/suppl_1/D721.long, 2 Tumor Suppressor gene; https://bioinfo.uth.edu/TSGene/, 3 Cancer Gene Census; http://www.nature.com/nrc/journal/v4/n3/abs/nrc1299.html, 4 CancerGenes; http://nar.oxfordjournals.org/content/35/suppl_1/D721.long, 5 Network of Cancer Gene; http://ncg.kcl.ac.uk/index.php, 1Therapeutic Vulnerabilities in Cancer; http://cbio.mskcc.org/cancergenomics/statius/ |
| KEGG_CYSTEINE_AND_METHIONINE_METABOLISM KEGG_SELENOAMINO_ACID_METABOLISM REACTOME_SULFUR_AMINO_ACID_METABOLISM REACTOME_METABOLISM_OF_AMINO_ACIDS_AND_DERIVATIVES | |
| OMIM | |
| Orphanet | |
| Disease | KEGG Disease: MAT1A |
| MedGen: MAT1A (Human Medical Genetics with Condition) | |
| ClinVar: MAT1A | |
| Phenotype | MGI: MAT1A (International Mouse Phenotyping Consortium) |
| PhenomicDB: MAT1A | |
| Mutations for MAT1A |
| * Under tables are showing count per each tissue to give us broad intuition about tissue specific mutation patterns.You can go to the detailed page for each mutation database's web site. |
| There's no structural variation information in COSMIC data for this gene. |
| * From mRNA Sanger sequences, Chitars2.0 arranged chimeric transcripts. This table shows MAT1A related fusion information. |
| ID | Head Gene | Tail Gene | Accession | Gene_a | qStart_a | qEnd_a | Chromosome_a | tStart_a | tEnd_a | Gene_a | qStart_a | qEnd_a | Chromosome_a | tStart_a | tEnd_a |
| Top |
| Mutation type/ Tissue ID | brca | cns | cerv | endome | haematopo | kidn | Lintest | liver | lung | ns | ovary | pancre | prost | skin | stoma | thyro | urina | |||
| Total # sample | 1 | |||||||||||||||||||
| GAIN (# sample) | 1 | |||||||||||||||||||
| LOSS (# sample) |
| cf) Tissue ID; Tissue type (1; Breast, 2; Central_nervous_system, 3; Cervix, 4; Endometrium, 5; Haematopoietic_and_lymphoid_tissue, 6; Kidney, 7; Large_intestine, 8; Liver, 9; Lung, 10; NS, 11; Ovary, 12; Pancreas, 13; Prostate, 14; Skin, 15; Stomach, 16; Thyroid, 17; Urinary_tract) |
| Top |
|
 |
| Top |
| Stat. for Non-Synonymous SNVs (# total SNVs=34) | (# total SNVs=20) |
 |  |
(# total SNVs=1) | (# total SNVs=0) |
 |
| Top |
| * When you move the cursor on each content, you can see more deailed mutation information on the Tooltip. Those are primary_site,primary_histology,mutation(aa),pubmedID. |
| GRCh37 position | Mutation(aa) | Unique sampleID count |
| chr10:82034333-82034333 | p.R343Q | 2 |
| chr10:82039973-82039973 | p.R169S | 2 |
| chr10:82034908-82034908 | p.G272G | 2 |
| chr10:82036269-82036269 | p.E211K | 2 |
| chr10:82036311-82036311 | p.P197S | 2 |
| chr10:82036321-82036321 | p.G193G | 2 |
| chr10:82049104-82049104 | p.G26R | 2 |
| chr10:82036179-82036179 | p.V241I | 1 |
| chr10:82043711-82043711 | p.D85N | 1 |
| chr10:82036336-82036336 | p.Y188* | 1 |
| Top |
|
 |
| Point Mutation/ Tissue ID | 1 | 2 | 3 | 4 | 5 | 6 | 7 | 8 | 9 | 10 | 11 | 12 | 13 | 14 | 15 | 16 | 17 | 18 | 19 | 20 |
| # sample | 3 | 1 | 8 | 2 | 1 | 1 | 7 | 2 | 7 | 6 | 1 | 9 | ||||||||
| # mutation | 3 | 1 | 9 | 2 | 1 | 1 | 7 | 2 | 9 | 6 | 1 | 9 | ||||||||
| nonsynonymous SNV | 2 | 1 | 7 | 2 | 1 | 1 | 4 | 1 | 5 | 3 | 1 | 3 | ||||||||
| synonymous SNV | 1 | 2 | 3 | 1 | 4 | 3 | 6 |
| cf) Tissue ID; Tissue type (1; BLCA[Bladder Urothelial Carcinoma], 2; BRCA[Breast invasive carcinoma], 3; CESC[Cervical squamous cell carcinoma and endocervical adenocarcinoma], 4; COAD[Colon adenocarcinoma], 5; GBM[Glioblastoma multiforme], 6; Glioma Low Grade, 7; HNSC[Head and Neck squamous cell carcinoma], 8; KICH[Kidney Chromophobe], 9; KIRC[Kidney renal clear cell carcinoma], 10; KIRP[Kidney renal papillary cell carcinoma], 11; LAML[Acute Myeloid Leukemia], 12; LUAD[Lung adenocarcinoma], 13; LUSC[Lung squamous cell carcinoma], 14; OV[Ovarian serous cystadenocarcinoma ], 15; PAAD[Pancreatic adenocarcinoma], 16; PRAD[Prostate adenocarcinoma], 17; SKCM[Skin Cutaneous Melanoma], 18:STAD[Stomach adenocarcinoma], 19:THCA[Thyroid carcinoma], 20:UCEC[Uterine Corpus Endometrial Carcinoma]) |
| Top |
| * We represented just top 10 SNVs. When you move the cursor on each content, you can see more deailed mutation information on the Tooltip. Those are primary_site, primary_histology, mutation(aa), pubmedID. |
| Genomic Position | Mutation(aa) | Unique sampleID count |
| chr10:82036269 | p.D93N | 2 |
| chr10:82036321 | p.E211K | 2 |
| chr10:82043687 | p.R343Q | 2 |
| chr10:82034333 | p.G193G | 2 |
| chr10:82036222 | p.S293S | 1 |
| chr10:82039978 | p.S170C | 1 |
| chr10:82034380 | p.G63R | 1 |
| chr10:82043734 | p.G284G | 1 |
| chr10:82036235 | p.R169H | 1 |
| chr10:82039990 | p.I37I | 1 |
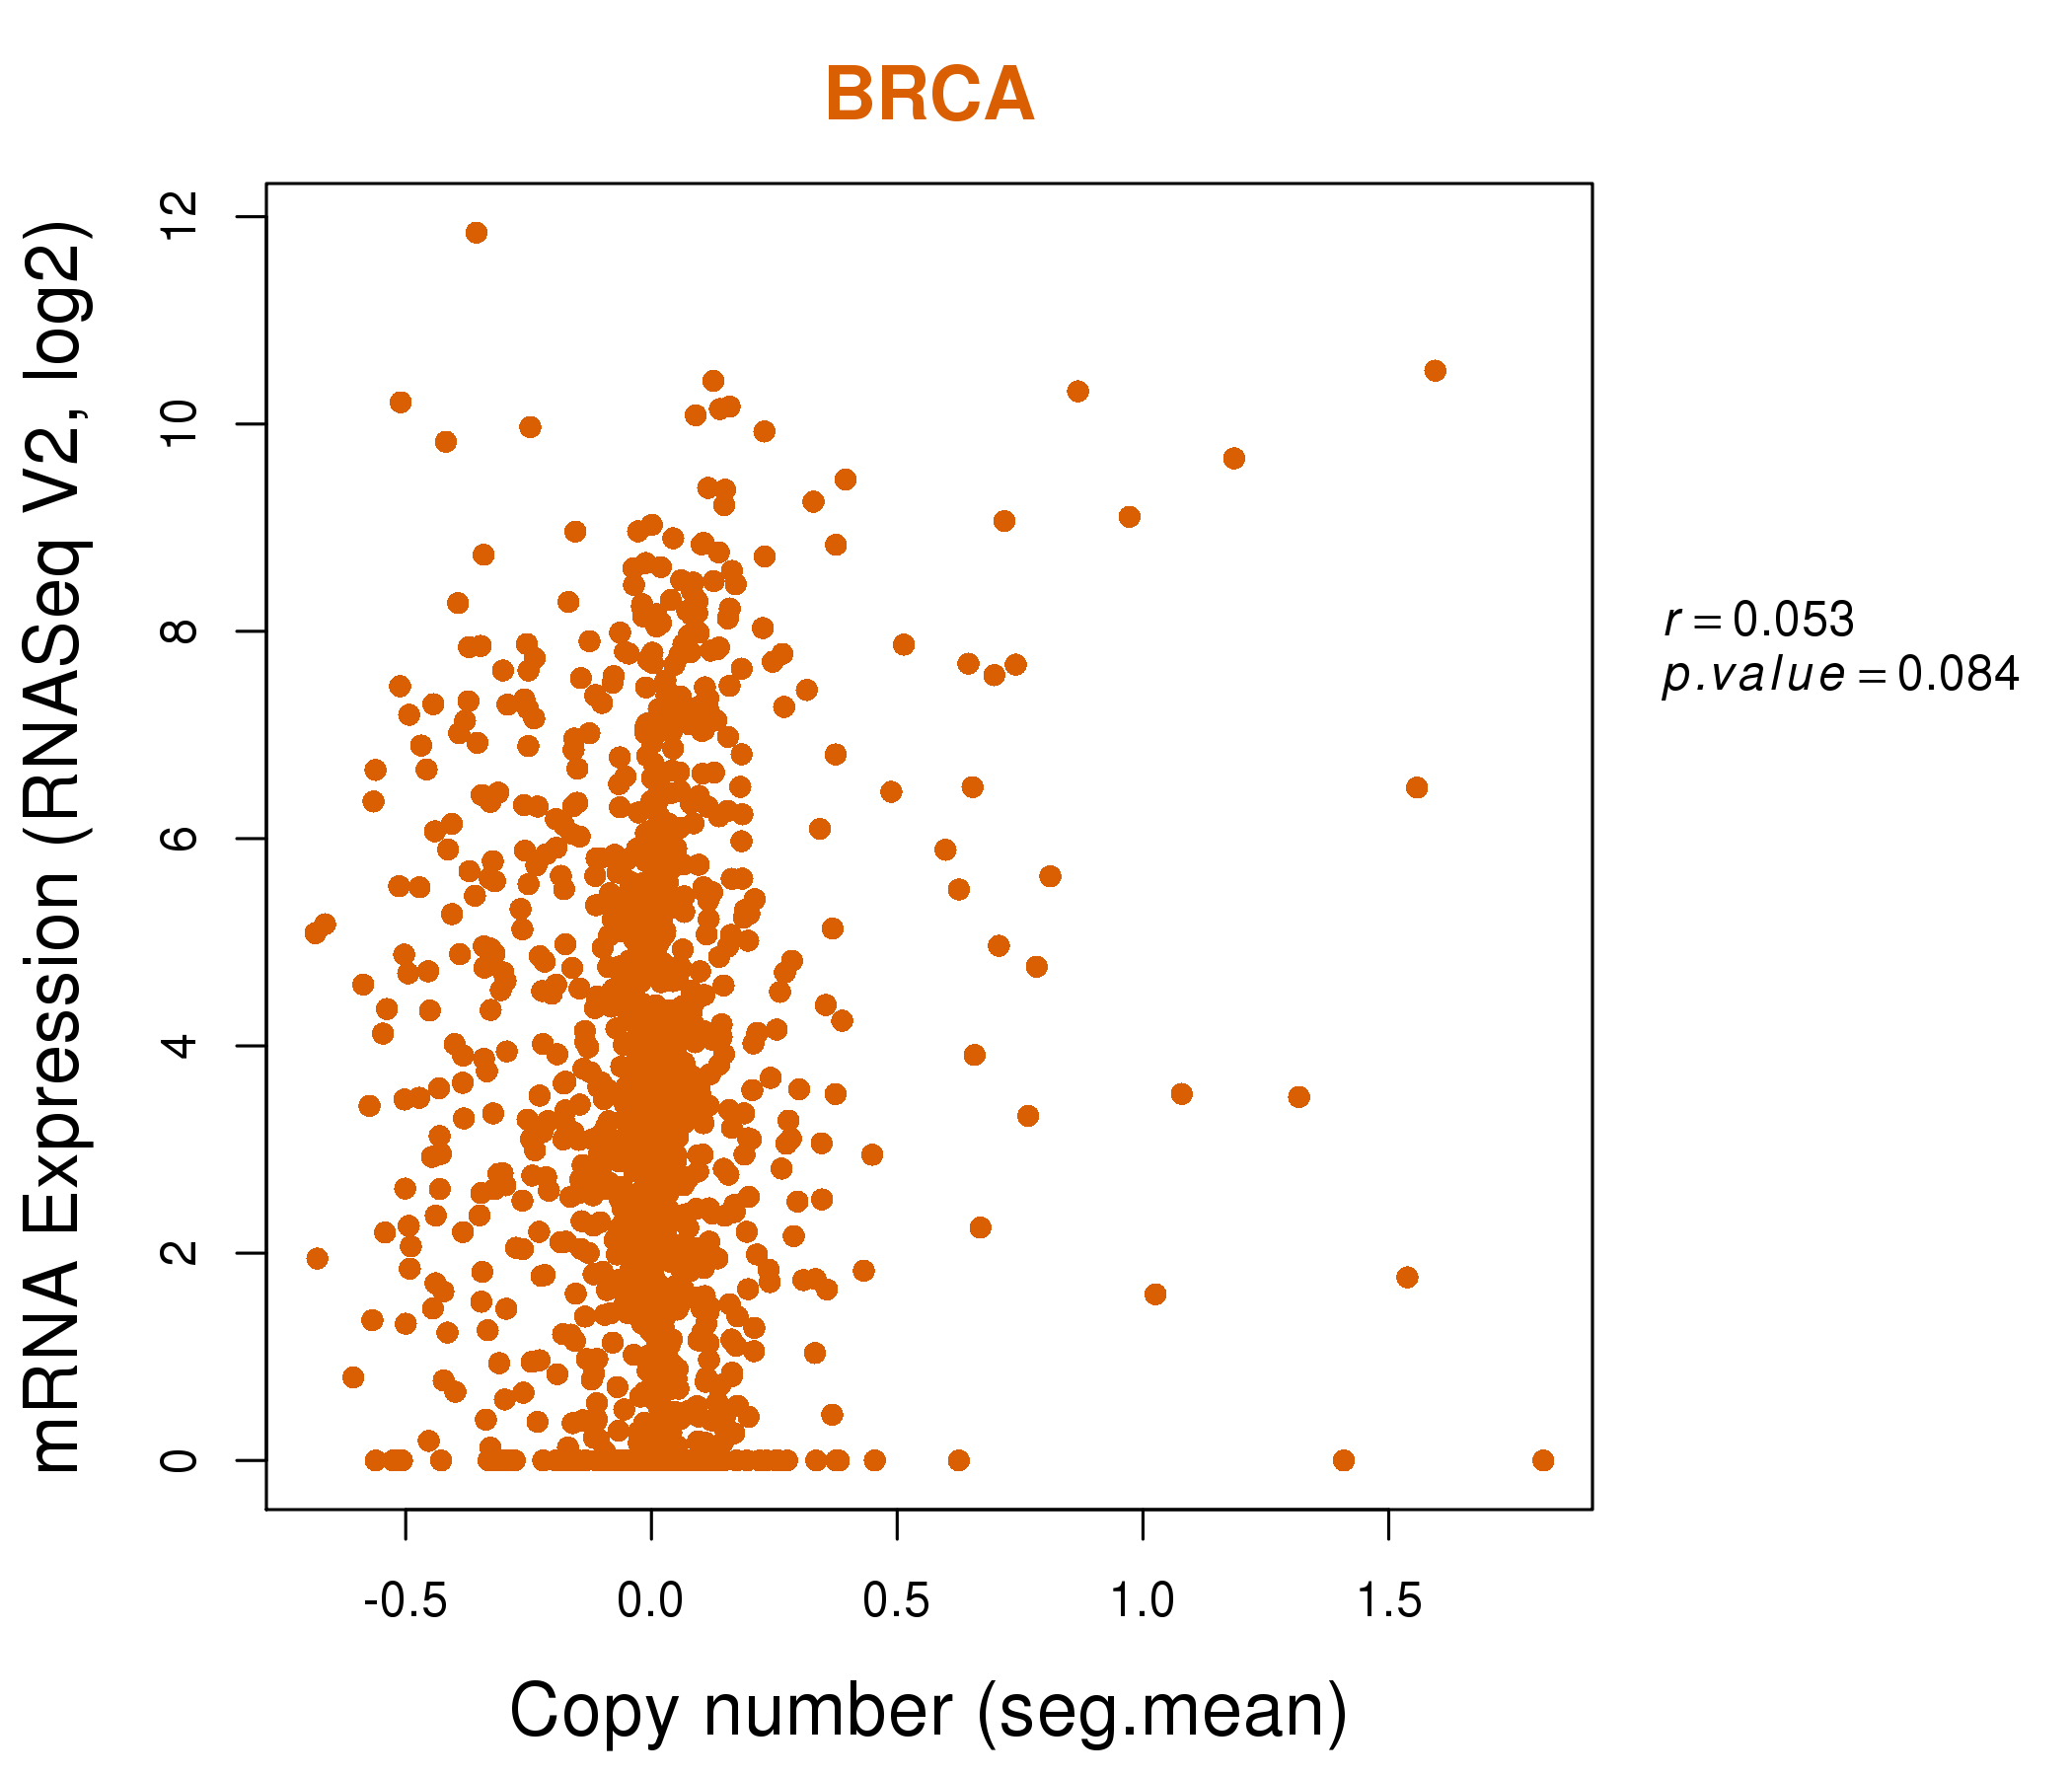
| * Copy number data were extracted from TCGA using R package TCGA-Assembler. The URLs of all public data files on TCGA DCC data server were gathered on Jan-05-2015. Function ProcessCNAData in TCGA-Assembler package was used to obtain gene-level copy number value which is calculated as the average copy number of the genomic region of a gene. |
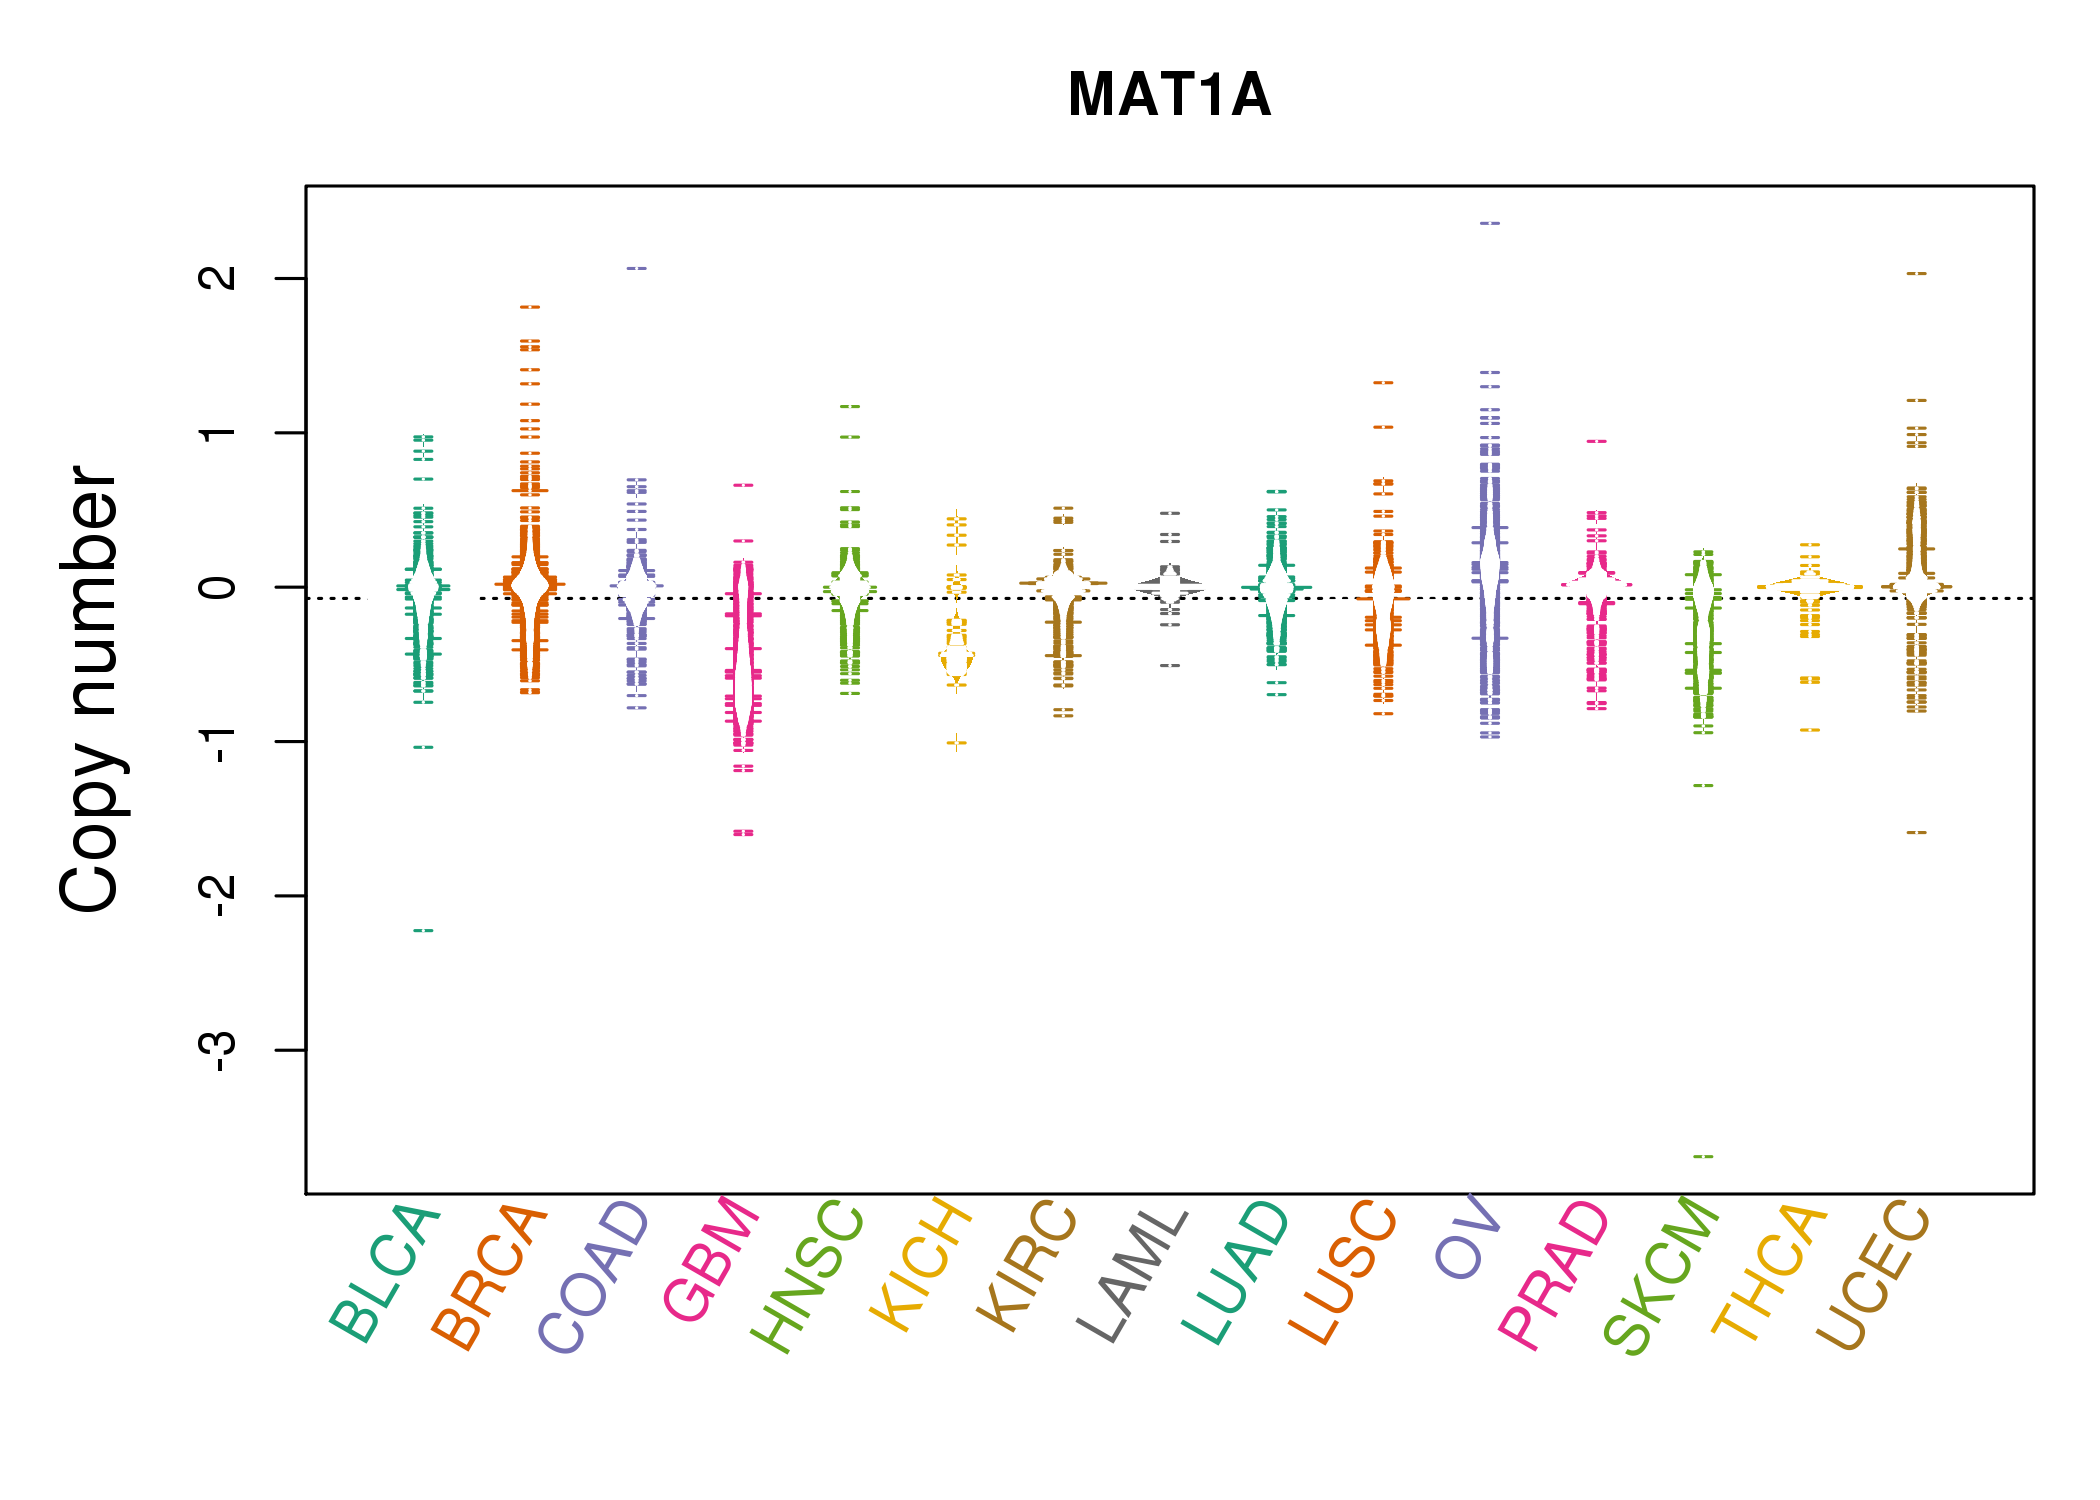 |
| cf) Tissue ID[Tissue type]: BLCA[Bladder Urothelial Carcinoma], BRCA[Breast invasive carcinoma], CESC[Cervical squamous cell carcinoma and endocervical adenocarcinoma], COAD[Colon adenocarcinoma], GBM[Glioblastoma multiforme], Glioma Low Grade, HNSC[Head and Neck squamous cell carcinoma], KICH[Kidney Chromophobe], KIRC[Kidney renal clear cell carcinoma], KIRP[Kidney renal papillary cell carcinoma], LAML[Acute Myeloid Leukemia], LUAD[Lung adenocarcinoma], LUSC[Lung squamous cell carcinoma], OV[Ovarian serous cystadenocarcinoma ], PAAD[Pancreatic adenocarcinoma], PRAD[Prostate adenocarcinoma], SKCM[Skin Cutaneous Melanoma], STAD[Stomach adenocarcinoma], THCA[Thyroid carcinoma], UCEC[Uterine Corpus Endometrial Carcinoma] |
| Top |
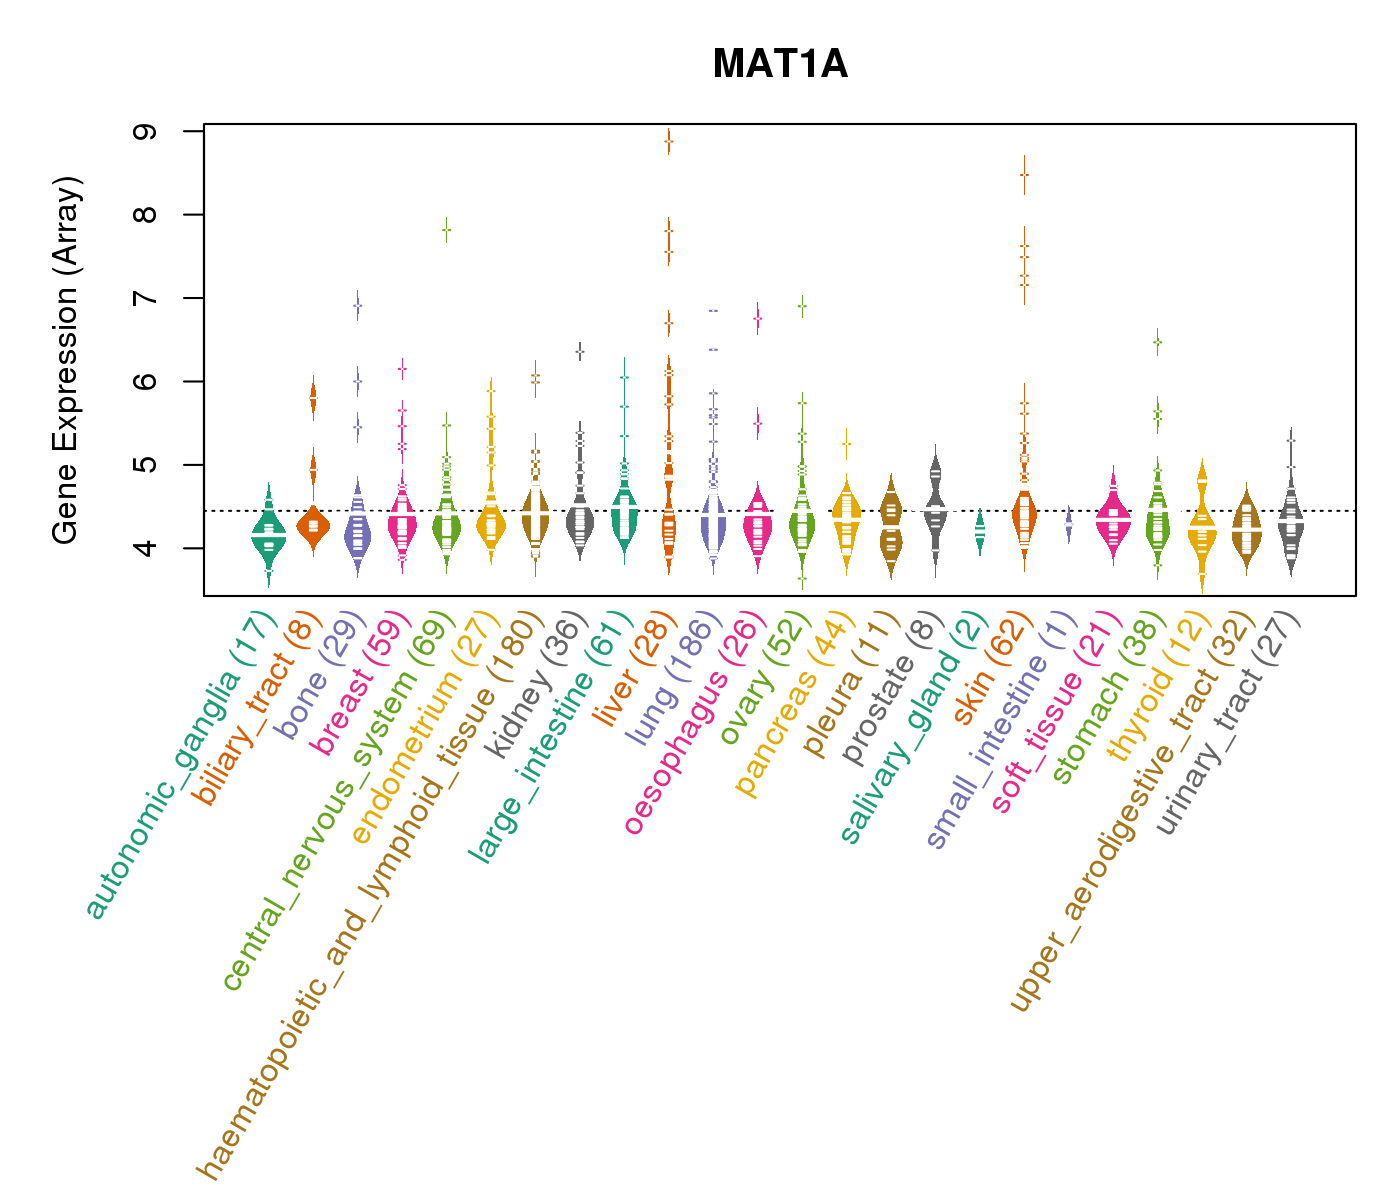
| Gene Expression for MAT1A |
| * CCLE gene expression data were extracted from CCLE_Expression_Entrez_2012-10-18.res: Gene-centric RMA-normalized mRNA expression data. |
 |
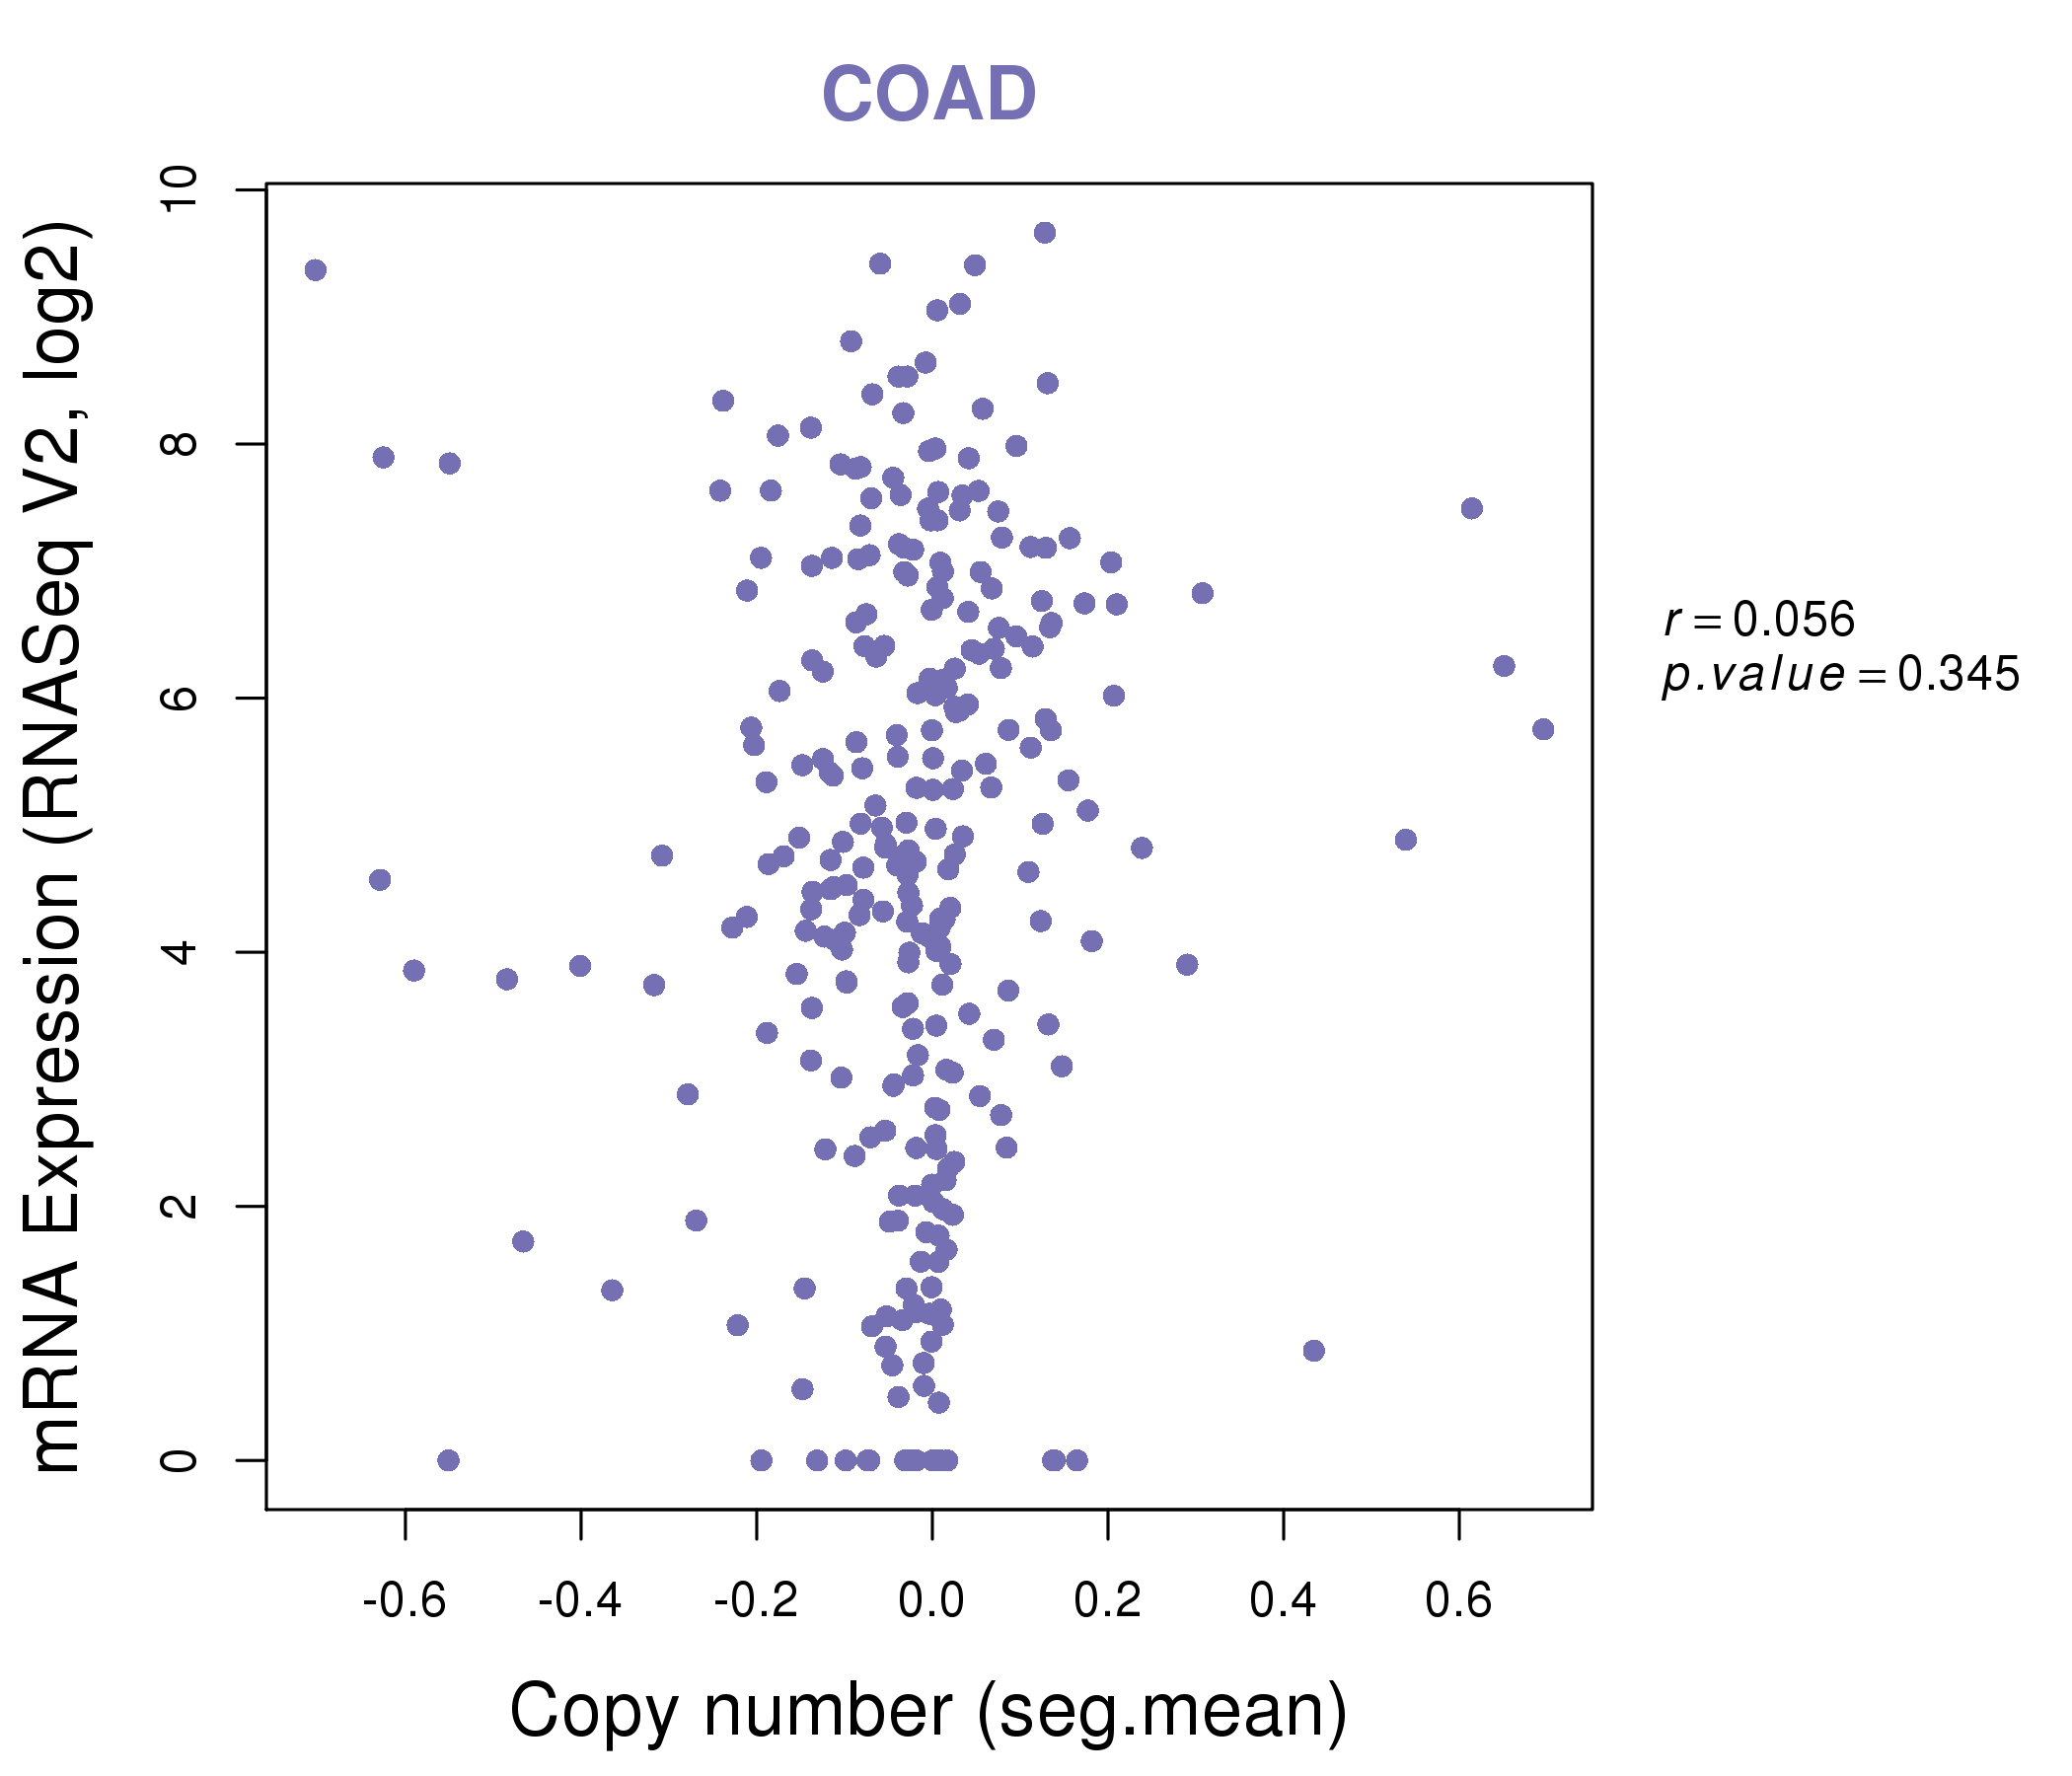
| * Normalized gene expression data of RNASeqV2 was extracted from TCGA using R package TCGA-Assembler. The URLs of all public data files on TCGA DCC data server were gathered at Jan-05-2015. Only eight cancer types have enough normal control samples for differential expression analysis. (t test, adjusted p<0.05 (using Benjamini-Hochberg FDR)) |
 |
| Top |
| * This plots show the correlation between CNV and gene expression. |
: Open all plots for all cancer types
 |
|
 |
|

| Top |
| Gene-Gene Network Information |
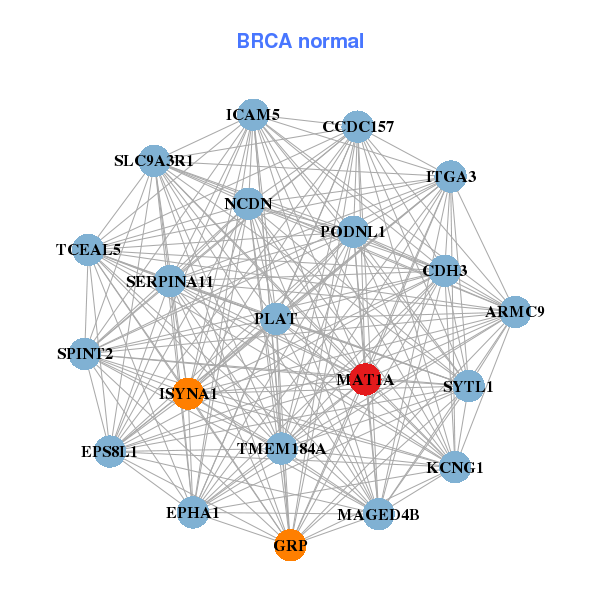
| * Co-Expression network figures were drawn using R package igraph. Only the top 20 genes with the highest correlations were shown. Red circle: input gene, orange circle: cell metabolism gene, sky circle: other gene |
: Open all plots for all cancer types
 |
| ||||
| C12orf29,CFAP54,TSPEAR-AS2,SPATA31E1,CT45A1,CT45A4,FAM47A, SPATA31C1,FLJ30679,H3F3B,HIST1H2AG,HIST1H3F,HIST1H4I,HMX1, KHDRBS2,LLPH,LOC93622,MAT1A,NUP107,TRIM36,YEATS4 | ARMC9,CCDC157,CDH3,EPHA1,EPS8L1,GRP,ICAM5, ISYNA1,ITGA3,KCNG1,MAGED4B,MAT1A,NCDN,PLAT, PODNL1,SERPINA11,SLC9A3R1,SPINT2,SYTL1,TCEAL5,TMEM184A | ||||
 |
| ||||
| ALDH1B1,FABP6,GP9,JSRP1,KIAA1257,KRTAP10-4,MAGEA3, MAGEA6,MAT1A,OR4K17,OXGR1,PCCA,SCN8A,SLC38A11, TAS2R16,TBXAS1,TCP11,TDGF1,TDGF1P3,TDRD5,TTTY2 | ANKRD1,ASB11,C16orf82,LRRC71,CABP1,CCIN,CST6, CTHRC1,CYP24A1,DRD5,DUSP21,COLGALT1,GSPT2,MAT1A, MYEOV,PCCB,POPDC3,SLC37A2,SSX8,TANGO6,TMEM211 |

| * Co-Expression network figures were drawn using R package igraph. Only the top 20 genes with the highest correlations were shown. Red circle: input gene, orange circle: cell metabolism gene, sky circle: other gene |
: Open all plots for all cancer types
| Top |
: Open all interacting genes' information including KEGG pathway for all interacting genes from DAVID
| Top |
| Pharmacological Information for MAT1A |
| DB Category | DB Name | DB's ID and Url link |
| * Gene Centered Interaction Network. |
 |
| * Drug Centered Interaction Network. |
| DrugBank ID | Target Name | Drug Groups | Generic Name | Drug Centered Network | Drug Structure |
| DB00118 | methionine adenosyltransferase I, alpha | approved; nutraceutical | S-Adenosylmethionine | 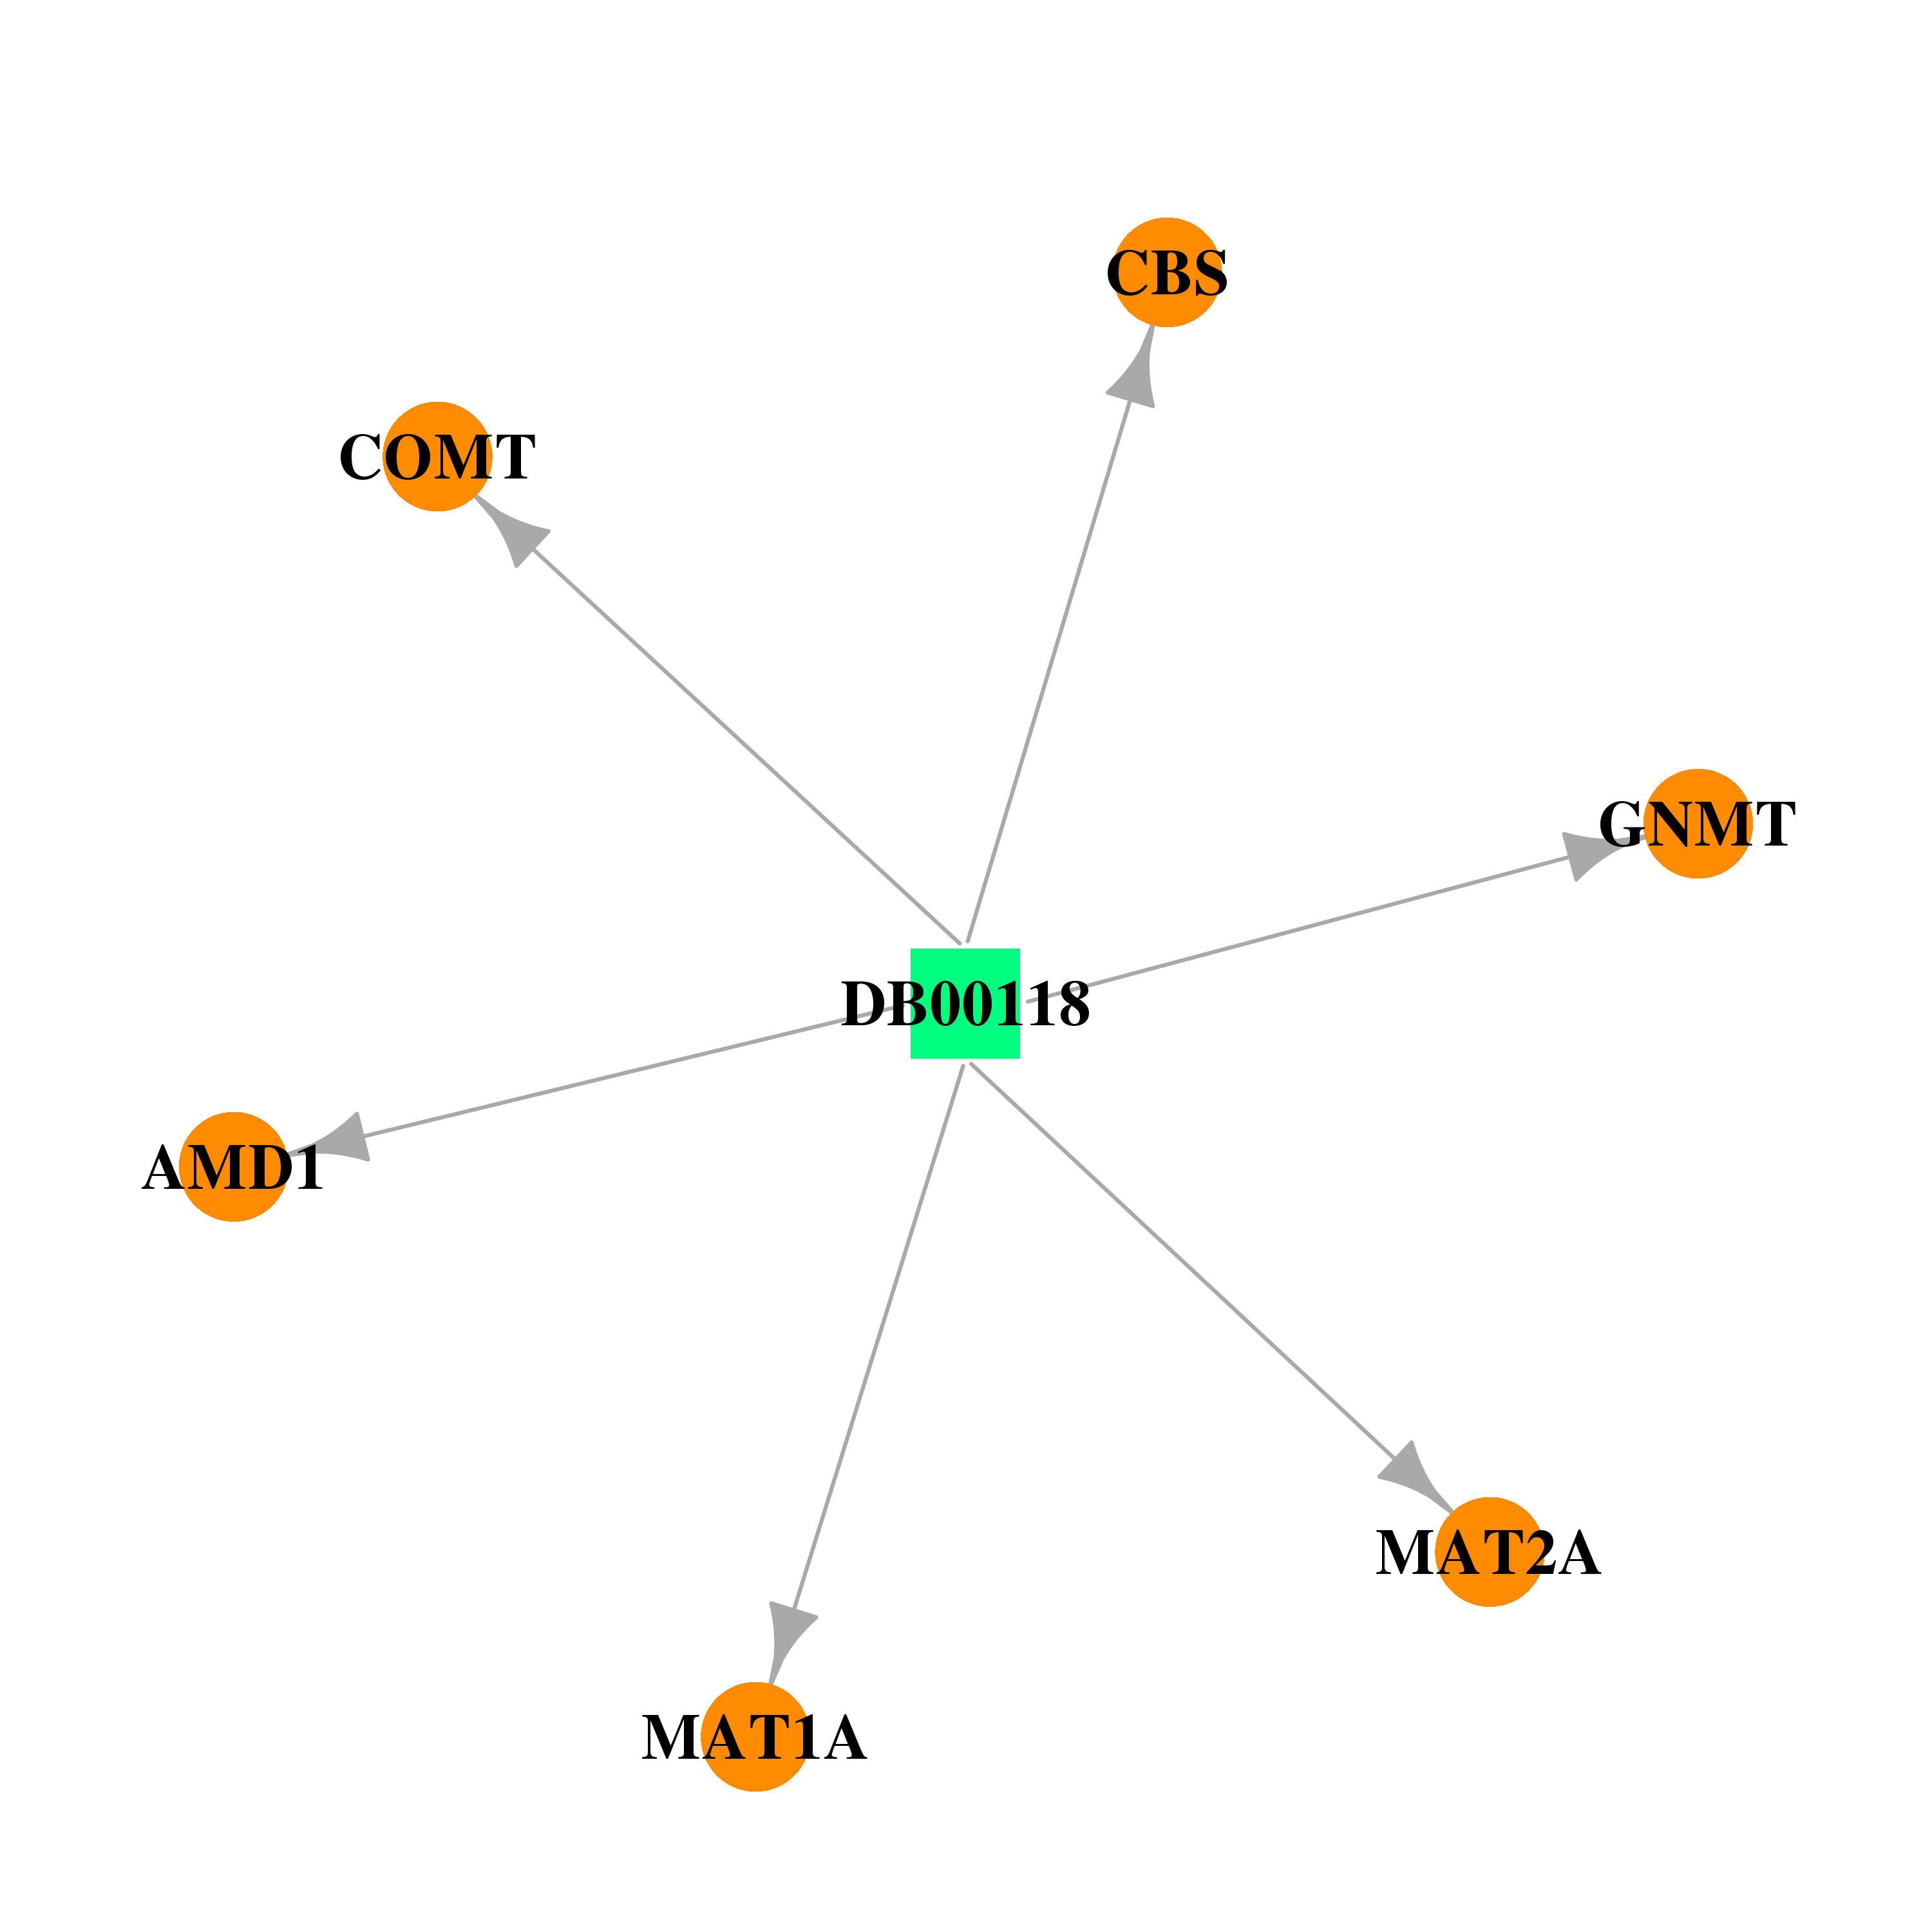 |  |
| DB03191 | methionine adenosyltransferase I, alpha | experimental | 3-Oxiran-2ylalanine | 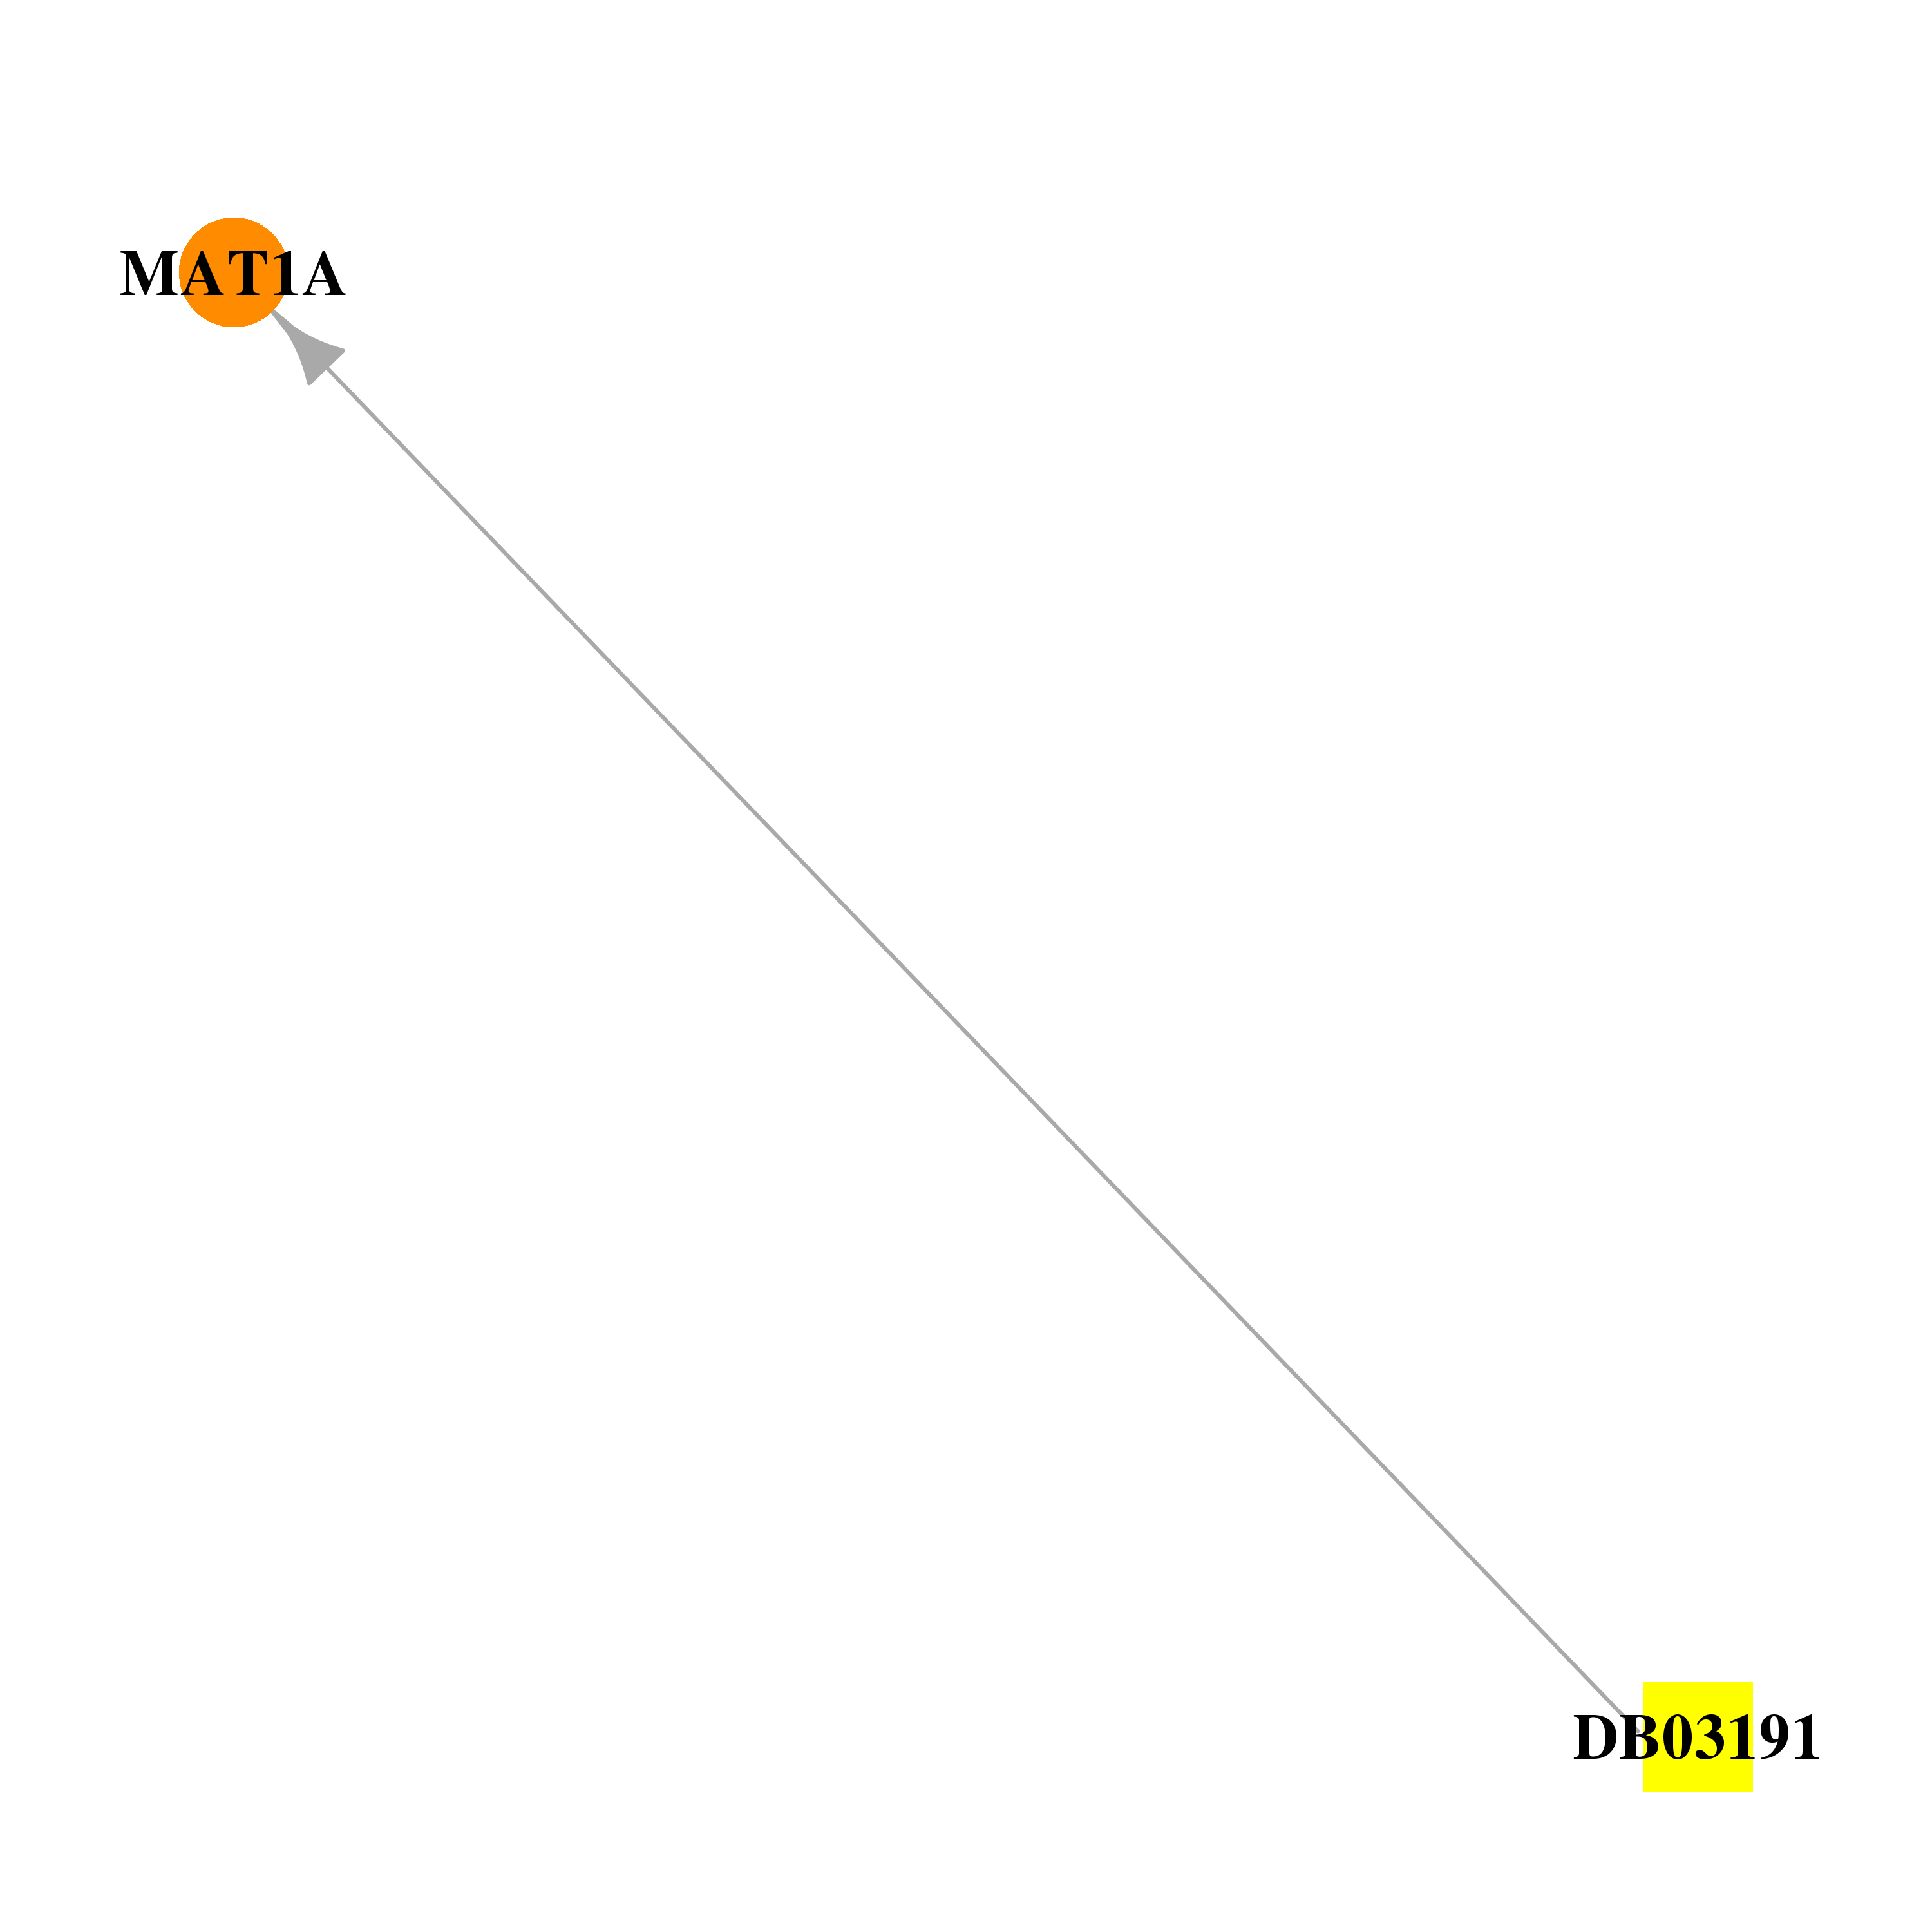 |  |
| DB03431 | methionine adenosyltransferase I, alpha | experimental | Adenosine-5'-Diphosphate | 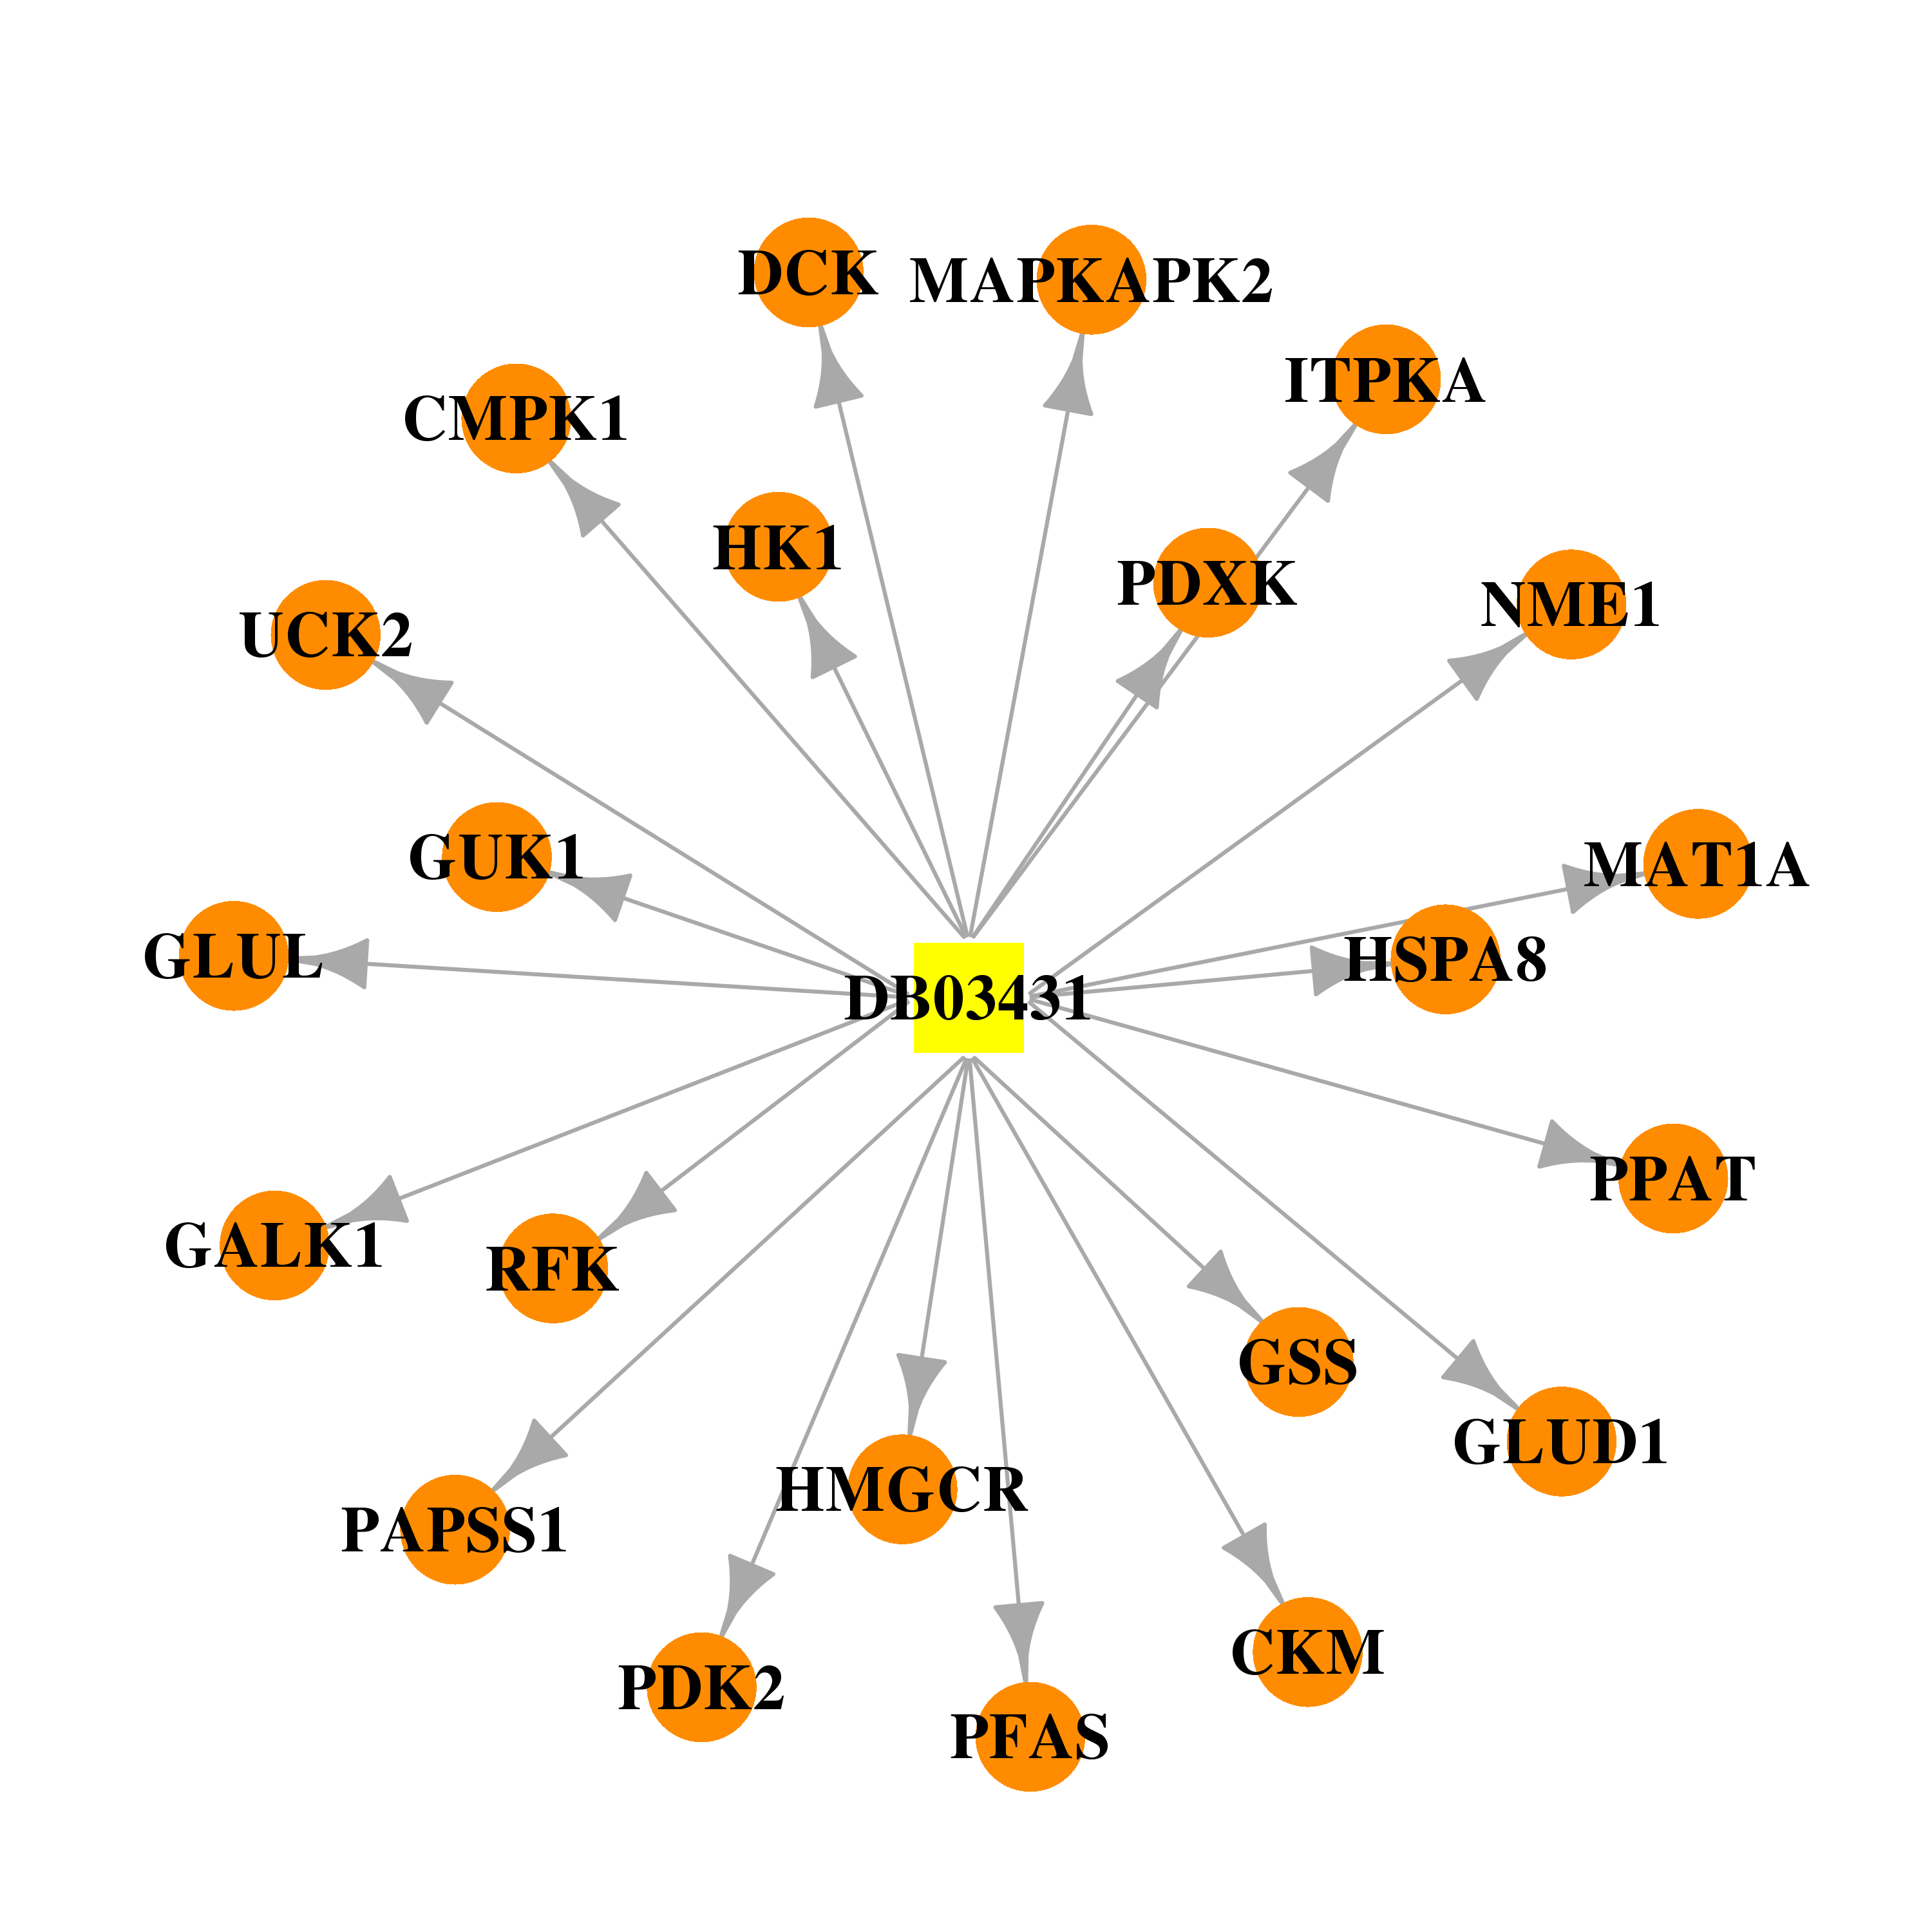 |  |
| DB03611 | methionine adenosyltransferase I, alpha | experimental | L-2-Amino-4-Methoxy-Cis-but-3-Enoic Acid | 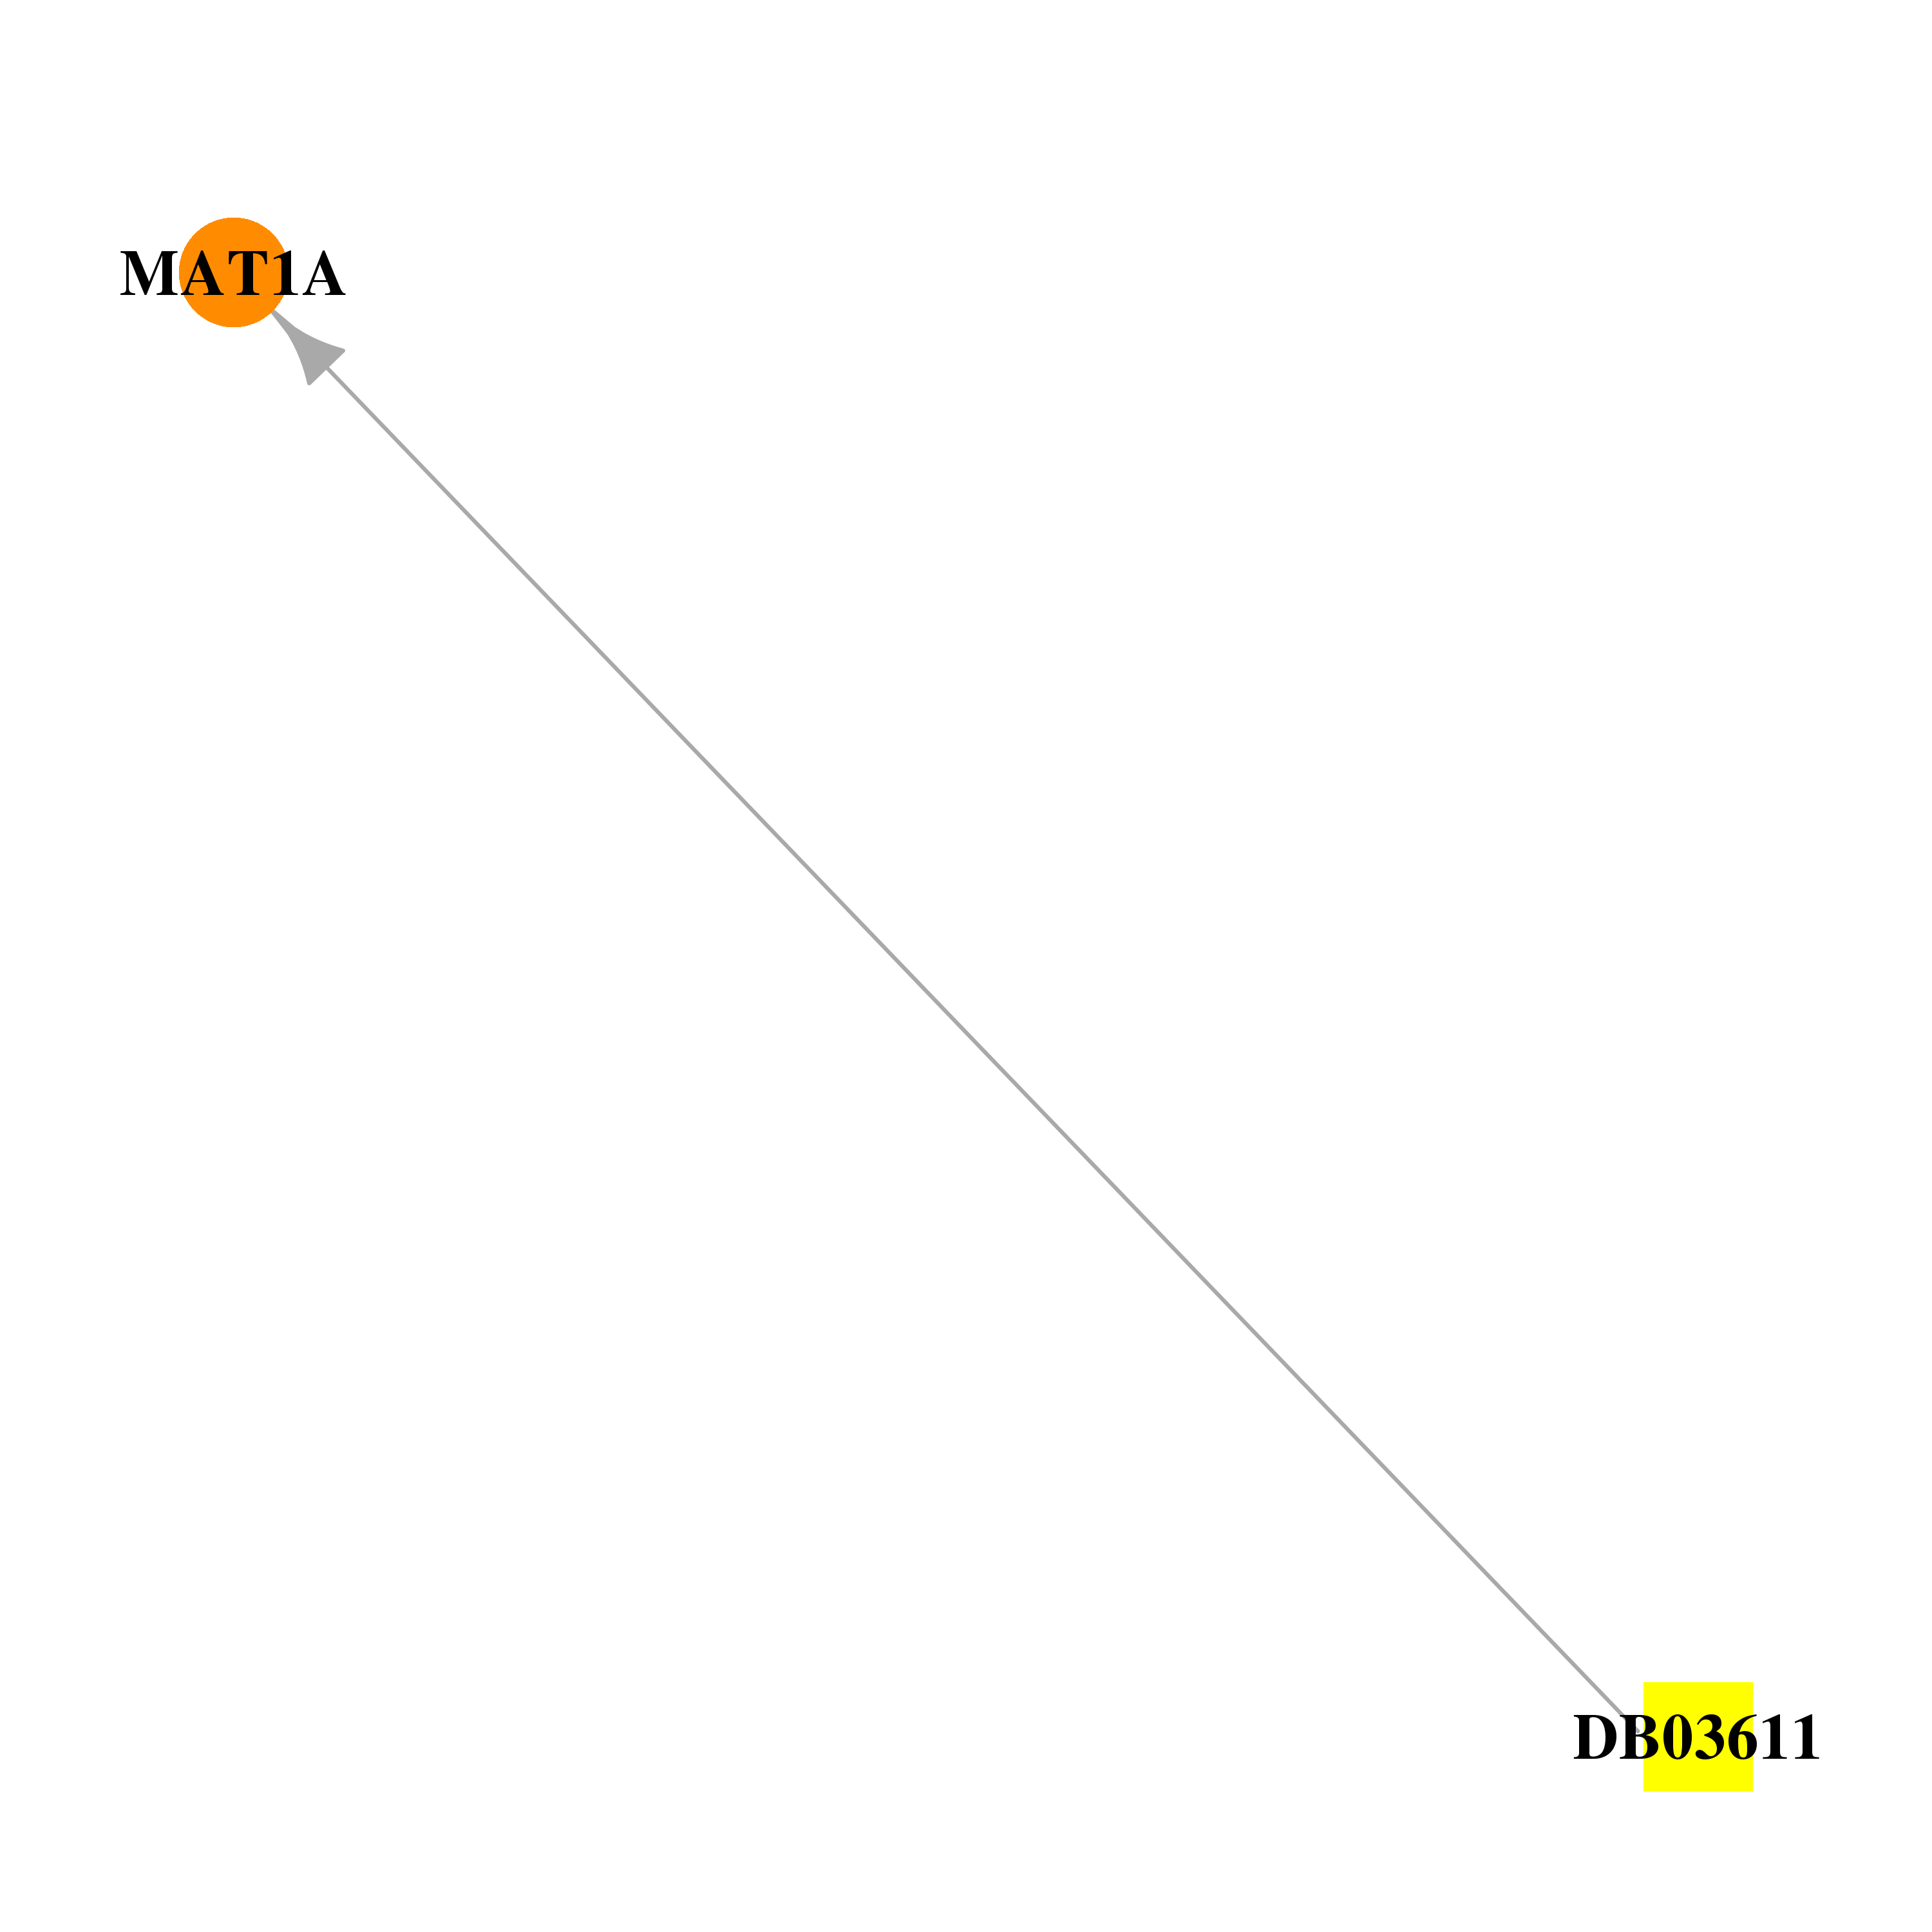 |  |
| Top |
| Cross referenced IDs for MAT1A |
| * We obtained these cross-references from Uniprot database. It covers 150 different DBs, 18 categories. http://www.uniprot.org/help/cross_references_section |
: Open all cross reference information
|
Copyright © 2016-Present - The Univsersity of Texas Health Science Center at Houston @ |