|
||||||||||||||||||||
| |
| Phenotypic Information (metabolism pathway, cancer, disease, phenome) |
| |
| |
| Gene-Gene Network Information: Co-Expression Network, Interacting Genes & KEGG |
| |
|


| Gene Summary for MAT2A |
| Basic gene info. | Gene symbol | MAT2A |
| Gene name | methionine adenosyltransferase II, alpha | |
| Synonyms | MATA2|MATII|SAMS2 | |
| Cytomap | UCSC genome browser: 2p11.2 | |
| Genomic location | chr2 :85766100-85772403 | |
| Type of gene | protein-coding | |
| RefGenes | NM_005911.5, | |
| Ensembl id | ENSG00000168906 | |
| Description | MAT 2MAT-IIS-adenosylmethionine synthase isoform type-2adoMet synthase 2adoMet synthetase 2methionine adenosyltransferase 2 | |
| Modification date | 20141207 | |
| dbXrefs | MIM : 601468 | |
| HGNC : HGNC | ||
| Ensembl : ENSG00000168906 | ||
| HPRD : 03275 | ||
| Vega : OTTHUMG00000130174 | ||
| Protein | UniProt: P31153 go to UniProt's Cross Reference DB Table | |
| Expression | CleanEX: HS_MAT2A | |
| BioGPS: 4144 | ||
| Gene Expression Atlas: ENSG00000168906 | ||
| The Human Protein Atlas: ENSG00000168906 | ||
| Pathway | NCI Pathway Interaction Database: MAT2A | |
| KEGG: MAT2A | ||
| REACTOME: MAT2A | ||
| ConsensusPathDB | ||
| Pathway Commons: MAT2A | ||
| Metabolism | MetaCyc: MAT2A | |
| HUMANCyc: MAT2A | ||
| Regulation | Ensembl's Regulation: ENSG00000168906 | |
| miRBase: chr2 :85,766,100-85,772,403 | ||
| TargetScan: NM_005911 | ||
| cisRED: ENSG00000168906 | ||
| Context | iHOP: MAT2A | |
| cancer metabolism search in PubMed: MAT2A | ||
| UCL Cancer Institute: MAT2A | ||
| Assigned class in ccmGDB | B - This gene belongs to cancer gene. | |
| Top |
| Phenotypic Information for MAT2A(metabolism pathway, cancer, disease, phenome) |
| Cancer | CGAP: MAT2A |
| Familial Cancer Database: MAT2A | |
| * This gene is included in those cancer gene databases. |
|
|
|
|
|
|
| ||||||||||||||
Oncogene 1 | Significant driver gene in | |||||||||||||||||||
| cf) number; DB name 1 Oncogene; http://nar.oxfordjournals.org/content/35/suppl_1/D721.long, 2 Tumor Suppressor gene; https://bioinfo.uth.edu/TSGene/, 3 Cancer Gene Census; http://www.nature.com/nrc/journal/v4/n3/abs/nrc1299.html, 4 CancerGenes; http://nar.oxfordjournals.org/content/35/suppl_1/D721.long, 5 Network of Cancer Gene; http://ncg.kcl.ac.uk/index.php, 1Therapeutic Vulnerabilities in Cancer; http://cbio.mskcc.org/cancergenomics/statius/ |
| KEGG_CYSTEINE_AND_METHIONINE_METABOLISM KEGG_SELENOAMINO_ACID_METABOLISM REACTOME_SULFUR_AMINO_ACID_METABOLISM REACTOME_METABOLISM_OF_AMINO_ACIDS_AND_DERIVATIVES | |
| OMIM | 601468; gene. |
| Orphanet | |
| Disease | KEGG Disease: MAT2A |
| MedGen: MAT2A (Human Medical Genetics with Condition) | |
| ClinVar: MAT2A | |
| Phenotype | MGI: MAT2A (International Mouse Phenotyping Consortium) |
| PhenomicDB: MAT2A | |
| Mutations for MAT2A |
| * Under tables are showing count per each tissue to give us broad intuition about tissue specific mutation patterns.You can go to the detailed page for each mutation database's web site. |
| - Statistics for Tissue and Mutation type | Top |
 |
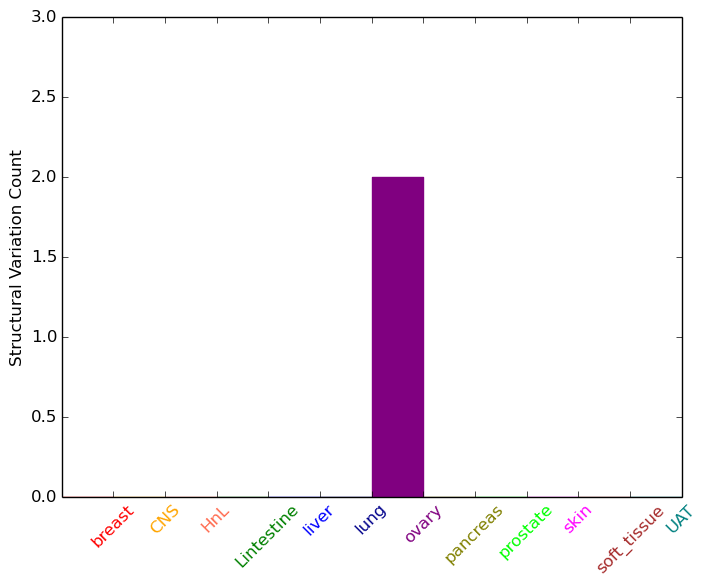
| - For Inter-chromosomal Variations |
| There's no inter-chromosomal structural variation. |
| - For Intra-chromosomal Variations |
| * Intra-chromosomal variantions includes 'intrachromosomal amplicon to amplicon', 'intrachromosomal amplicon to non-amplified dna', 'intrachromosomal deletion', 'intrachromosomal fold-back inversion', 'intrachromosomal inversion', 'intrachromosomal tandem duplication', 'Intrachromosomal unknown type', 'intrachromosomal with inverted orientation', 'intrachromosomal with non-inverted orientation'. |
 |
| Sample | Symbol_a | Chr_a | Start_a | End_a | Symbol_b | Chr_b | Start_b | End_b |
| ovary | MAT2A | chr2 | 85766957 | 85766977 | MAT2A | chr2 | 85768960 | 85768980 |
| ovary | MAT2A | chr2 | 85767414 | 85767434 | MAT2A | chr2 | 85768802 | 85768822 |
| cf) Tissue number; Tissue name (1;Breast, 2;Central_nervous_system, 3;Haematopoietic_and_lymphoid_tissue, 4;Large_intestine, 5;Liver, 6;Lung, 7;Ovary, 8;Pancreas, 9;Prostate, 10;Skin, 11;Soft_tissue, 12;Upper_aerodigestive_tract) |
| * From mRNA Sanger sequences, Chitars2.0 arranged chimeric transcripts. This table shows MAT2A related fusion information. |
| ID | Head Gene | Tail Gene | Accession | Gene_a | qStart_a | qEnd_a | Chromosome_a | tStart_a | tEnd_a | Gene_a | qStart_a | qEnd_a | Chromosome_a | tStart_a | tEnd_a |
| BM823880 | PARP15 | 95 | 117 | 3 | 122305561 | 122305587 | MAT2A | 115 | 359 | 2 | 85769284 | 85769718 | |
| BM749134 | MAT2A | 14 | 119 | 2 | 85766291 | 85766396 | CNOT7 | 116 | 538 | 8 | 17100571 | 17104270 | |
| BG329301 | MAT2A | 2 | 56 | 2 | 85771460 | 85771514 | UBE2O | 54 | 721 | 17 | 74387226 | 74388123 | |
| BP362529 | MAT2A | 1 | 415 | 2 | 85769395 | 85770157 | CNTN2 | 413 | 582 | 1 | 205036226 | 205038635 | |
| AA992625 | ADAMTSL4 | 12 | 321 | 1 | 150533101 | 150533409 | MAT2A | 308 | 429 | 2 | 85769031 | 85769334 | |
| BG620787 | MAT2A | 1 | 463 | 2 | 85767606 | 85768067 | CYP19A1 | 445 | 549 | 15 | 51501673 | 51501777 | |
| BF746473 | MAT2A | 19 | 121 | 2 | 85771560 | 85771663 | GSS | 119 | 244 | 20 | 33533756 | 33533881 | |
| Top |
| There's no copy number variation information in COSMIC data for this gene. |
| Top |
|
 |
| Top |
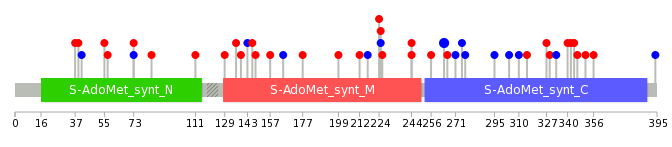
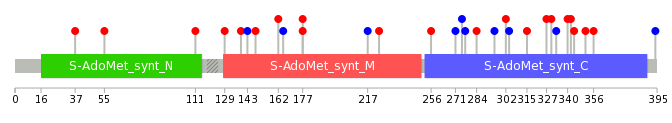
| Stat. for Non-Synonymous SNVs (# total SNVs=22) | (# total SNVs=11) |
 |  |
(# total SNVs=0) | (# total SNVs=1) |
 |
| Top |
| * When you move the cursor on each content, you can see more deailed mutation information on the Tooltip. Those are primary_site,primary_histology,mutation(aa),pubmedID. |
| GRCh37 position | Mutation(aa) | Unique sampleID count |
| chr2:85769711-85769711 | p.R264R | 3 |
| chr2:85769458-85769458 | p.L244V | 1 |
| chr2:85768426-85768426 | p.S73F | 1 |
| chr2:85769846-85769847 | p.L310L | 1 |
| chr2:85769041-85769041 | p.A165A | 1 |
| chr2:85770138-85770138 | p.R356C | 1 |
| chr2:85769459-85769459 | p.L244P | 1 |
| chr2:85768427-85768427 | p.S73S | 1 |
| chr2:85769862-85769862 | p.L315V | 1 |
| chr2:85769075-85769075 | p.R177C | 1 |
| Top |
|
 |
| Point Mutation/ Tissue ID | 1 | 2 | 3 | 4 | 5 | 6 | 7 | 8 | 9 | 10 | 11 | 12 | 13 | 14 | 15 | 16 | 17 | 18 | 19 | 20 |
| # sample | 1 | 3 | 2 | 3 | 3 | 1 | 2 | 1 | 1 | 4 | 3 | 2 | ||||||||
| # mutation | 5 | 3 | 2 | 3 | 3 | 1 | 2 | 1 | 1 | 4 | 3 | 2 | ||||||||
| nonsynonymous SNV | 5 | 1 | 2 | 3 | 1 | 1 | 1 | 1 | 1 | 2 | 2 | |||||||||
| synonymous SNV | 2 | 2 | 1 | 2 | 3 |
| cf) Tissue ID; Tissue type (1; BLCA[Bladder Urothelial Carcinoma], 2; BRCA[Breast invasive carcinoma], 3; CESC[Cervical squamous cell carcinoma and endocervical adenocarcinoma], 4; COAD[Colon adenocarcinoma], 5; GBM[Glioblastoma multiforme], 6; Glioma Low Grade, 7; HNSC[Head and Neck squamous cell carcinoma], 8; KICH[Kidney Chromophobe], 9; KIRC[Kidney renal clear cell carcinoma], 10; KIRP[Kidney renal papillary cell carcinoma], 11; LAML[Acute Myeloid Leukemia], 12; LUAD[Lung adenocarcinoma], 13; LUSC[Lung squamous cell carcinoma], 14; OV[Ovarian serous cystadenocarcinoma ], 15; PAAD[Pancreatic adenocarcinoma], 16; PRAD[Prostate adenocarcinoma], 17; SKCM[Skin Cutaneous Melanoma], 18:STAD[Stomach adenocarcinoma], 19:THCA[Thyroid carcinoma], 20:UCEC[Uterine Corpus Endometrial Carcinoma]) |
| Top |
| * We represented just top 10 SNVs. When you move the cursor on each content, you can see more deailed mutation information on the Tooltip. Those are primary_site, primary_histology, mutation(aa), pubmedID. |
| Genomic Position | Mutation(aa) | Unique sampleID count |
| chr2:85770096 | p.A162V | 1 |
| chr2:85768975 | p.I330V | 1 |
| chr2:85769750 | p.A165A | 1 |
| chr2:85770102 | p.F333F | 1 |
| chr2:85768989 | p.R177C | 1 |
| chr2:85769770 | p.K340M | 1 |
| chr2:85770125 | p.R177H | 1 |
| chr2:85769031 | p.E342K | 1 |
| chr2:85769804 | p.E217E | 1 |
| chr2:85770138 | p.E344Q | 1 |
| * Copy number data were extracted from TCGA using R package TCGA-Assembler. The URLs of all public data files on TCGA DCC data server were gathered on Jan-05-2015. Function ProcessCNAData in TCGA-Assembler package was used to obtain gene-level copy number value which is calculated as the average copy number of the genomic region of a gene. |
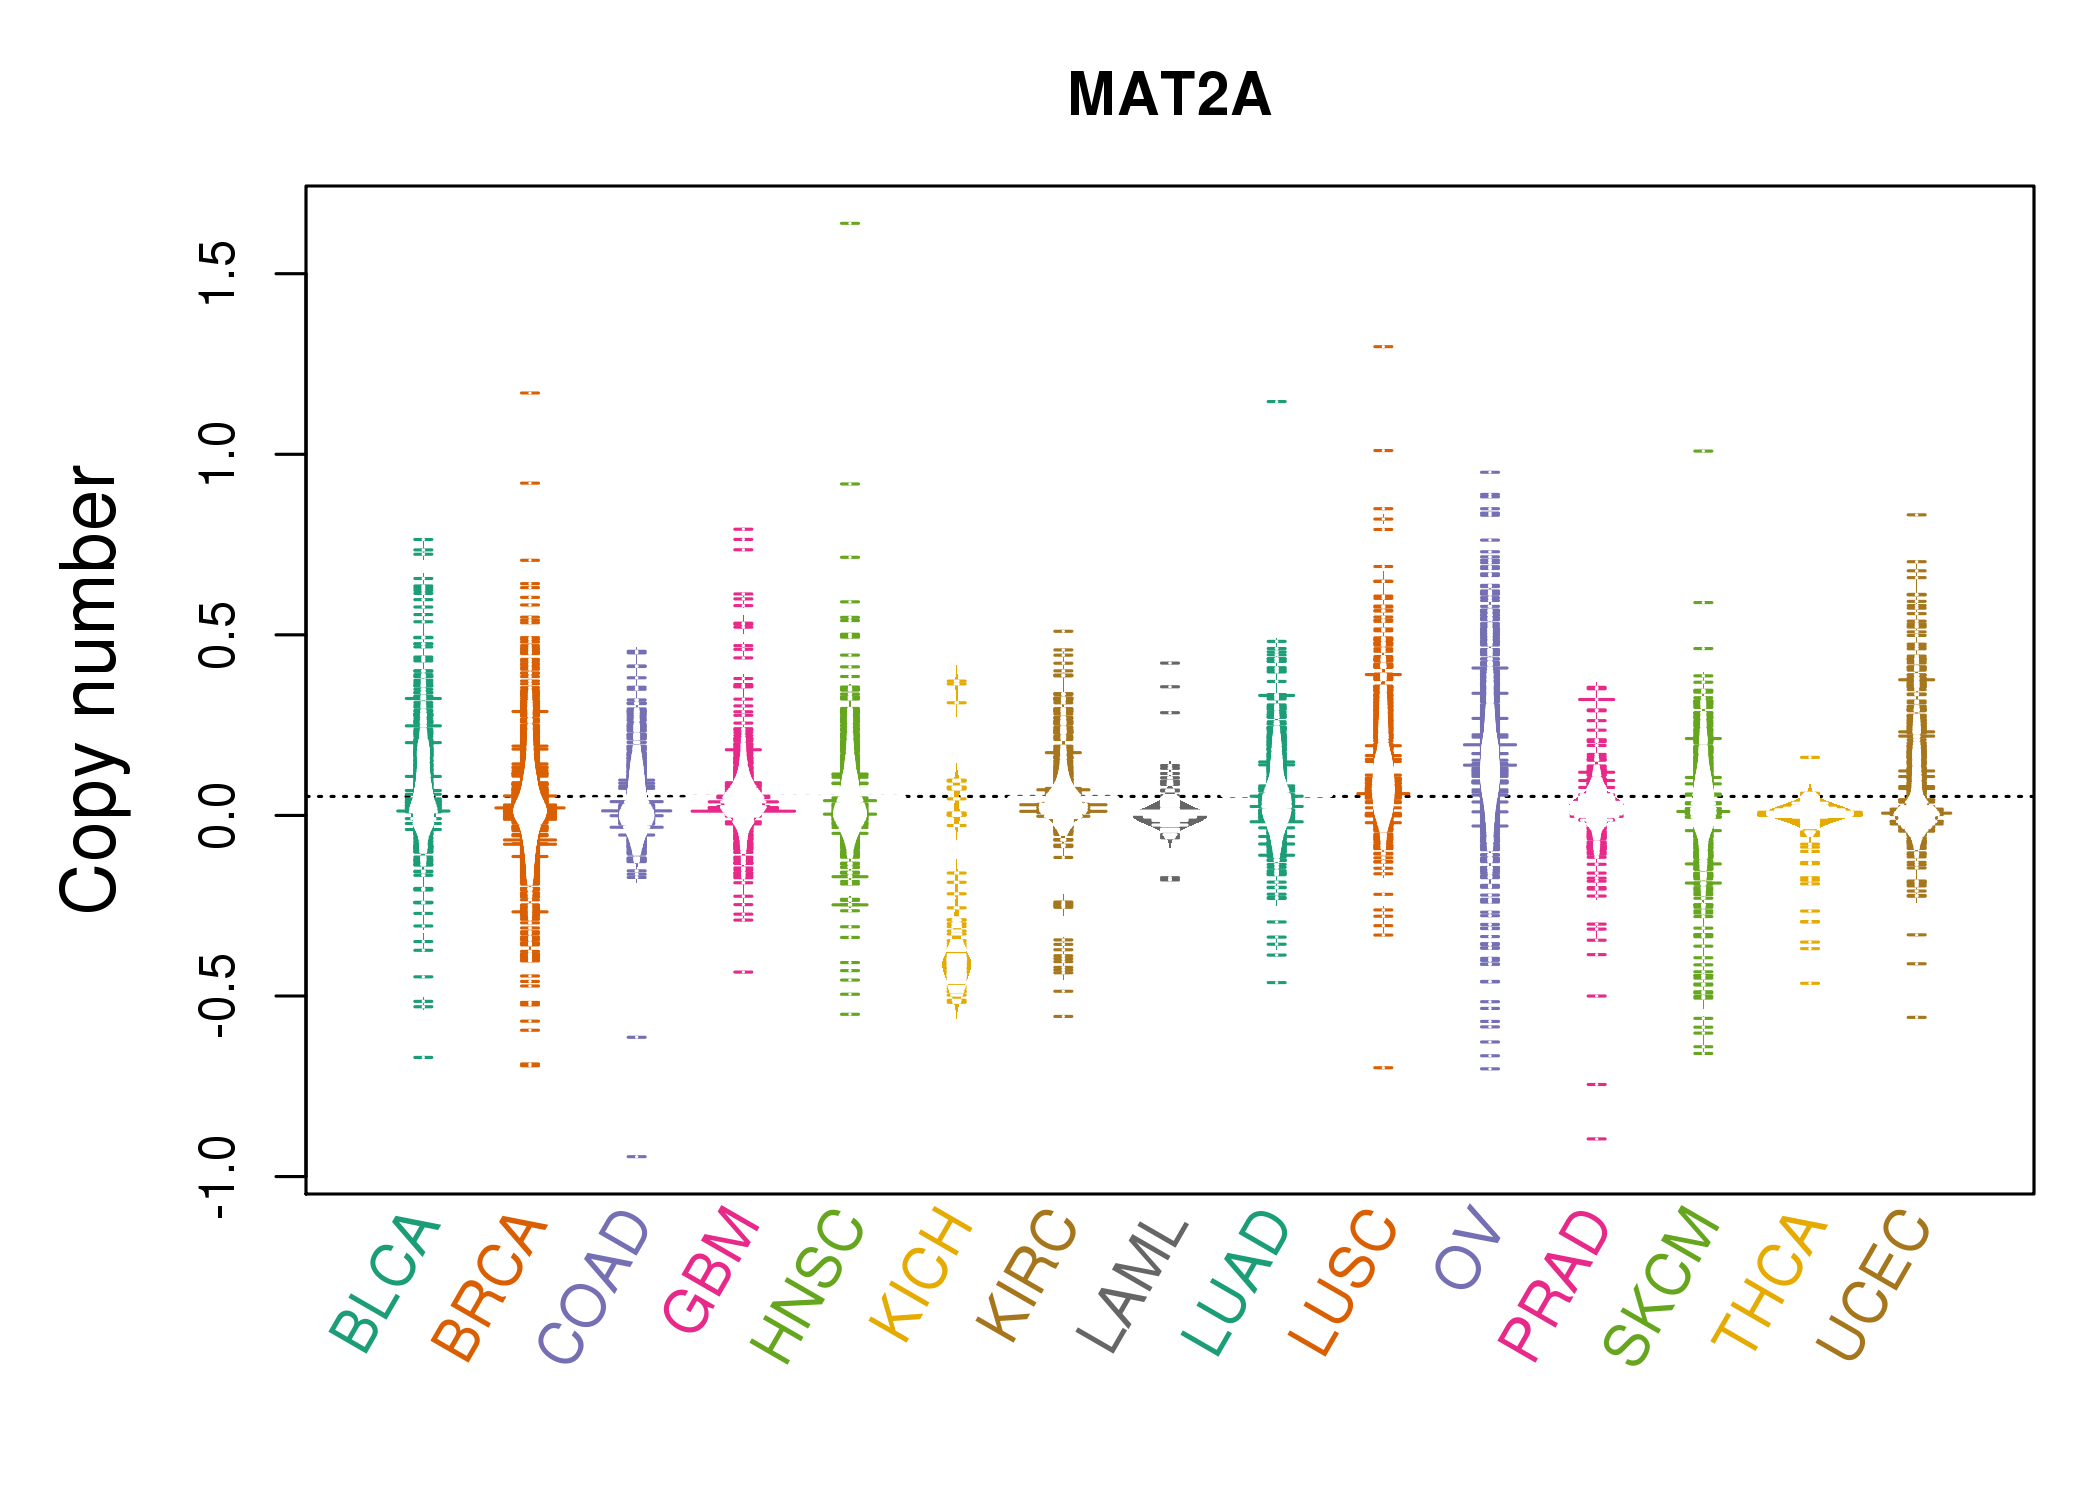 |
| cf) Tissue ID[Tissue type]: BLCA[Bladder Urothelial Carcinoma], BRCA[Breast invasive carcinoma], CESC[Cervical squamous cell carcinoma and endocervical adenocarcinoma], COAD[Colon adenocarcinoma], GBM[Glioblastoma multiforme], Glioma Low Grade, HNSC[Head and Neck squamous cell carcinoma], KICH[Kidney Chromophobe], KIRC[Kidney renal clear cell carcinoma], KIRP[Kidney renal papillary cell carcinoma], LAML[Acute Myeloid Leukemia], LUAD[Lung adenocarcinoma], LUSC[Lung squamous cell carcinoma], OV[Ovarian serous cystadenocarcinoma ], PAAD[Pancreatic adenocarcinoma], PRAD[Prostate adenocarcinoma], SKCM[Skin Cutaneous Melanoma], STAD[Stomach adenocarcinoma], THCA[Thyroid carcinoma], UCEC[Uterine Corpus Endometrial Carcinoma] |
| Top |
| Gene Expression for MAT2A |
| * CCLE gene expression data were extracted from CCLE_Expression_Entrez_2012-10-18.res: Gene-centric RMA-normalized mRNA expression data. |
 |
| * Normalized gene expression data of RNASeqV2 was extracted from TCGA using R package TCGA-Assembler. The URLs of all public data files on TCGA DCC data server were gathered at Jan-05-2015. Only eight cancer types have enough normal control samples for differential expression analysis. (t test, adjusted p<0.05 (using Benjamini-Hochberg FDR)) |
 |
| Top |
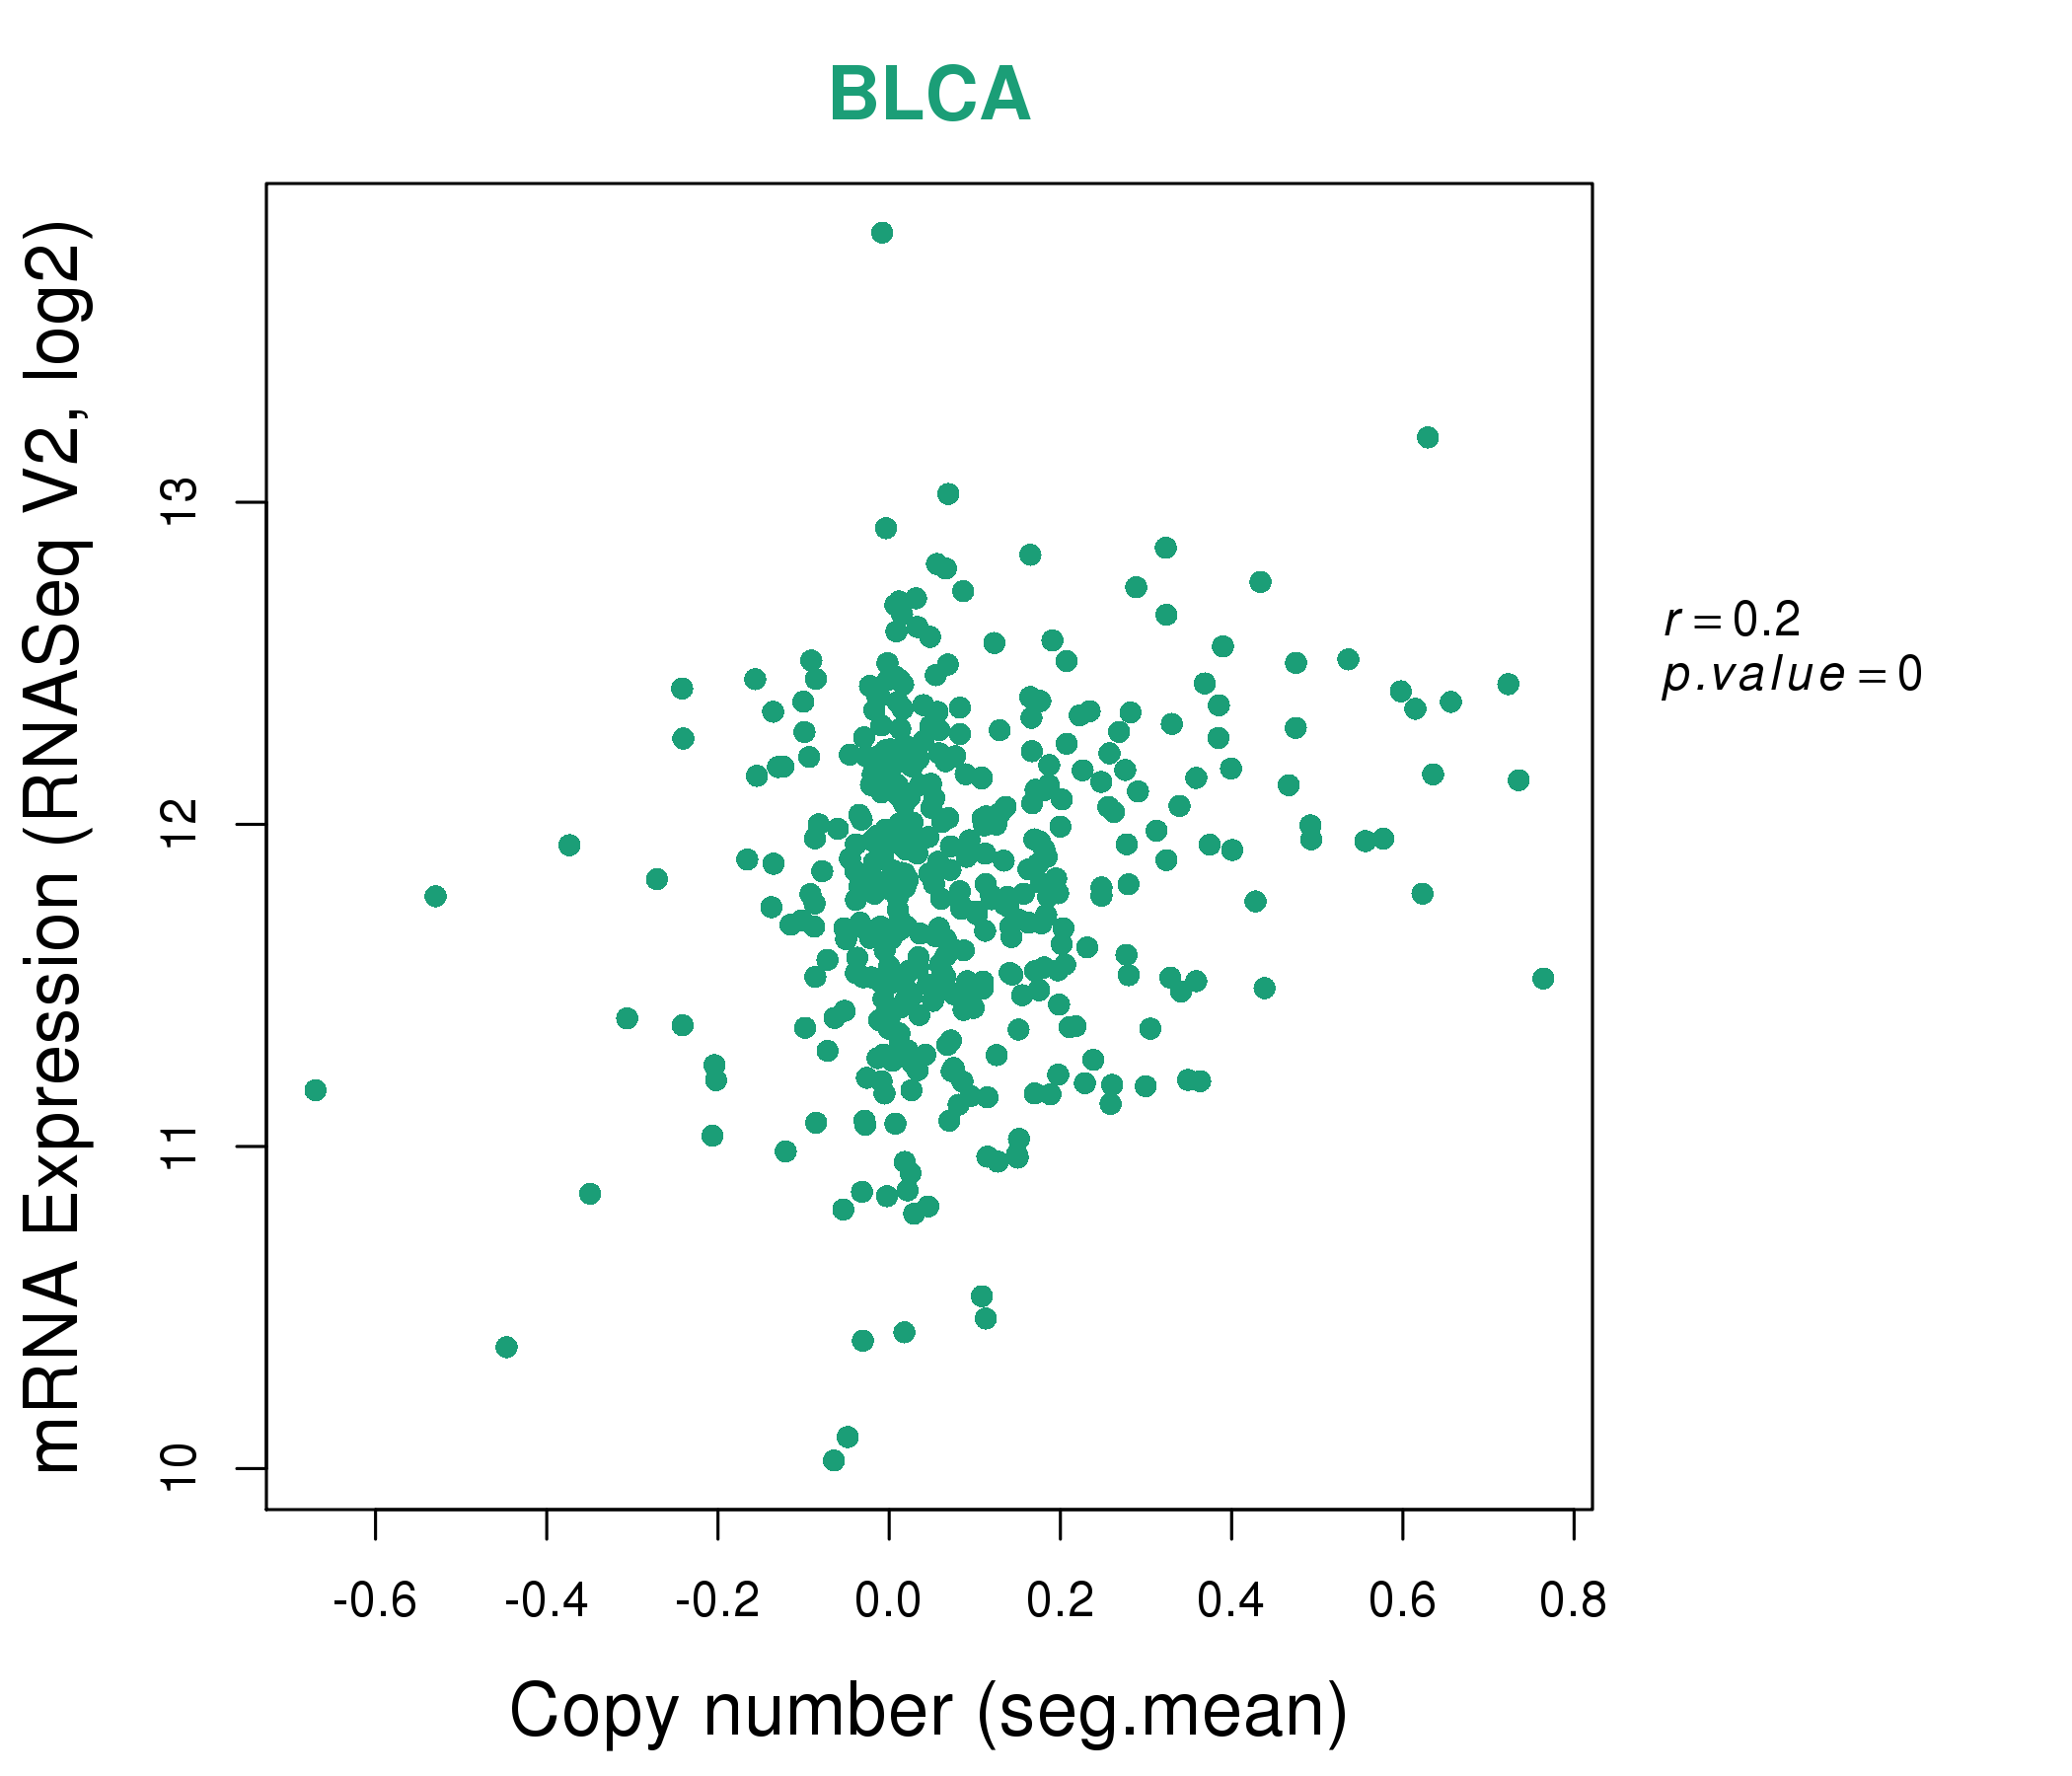
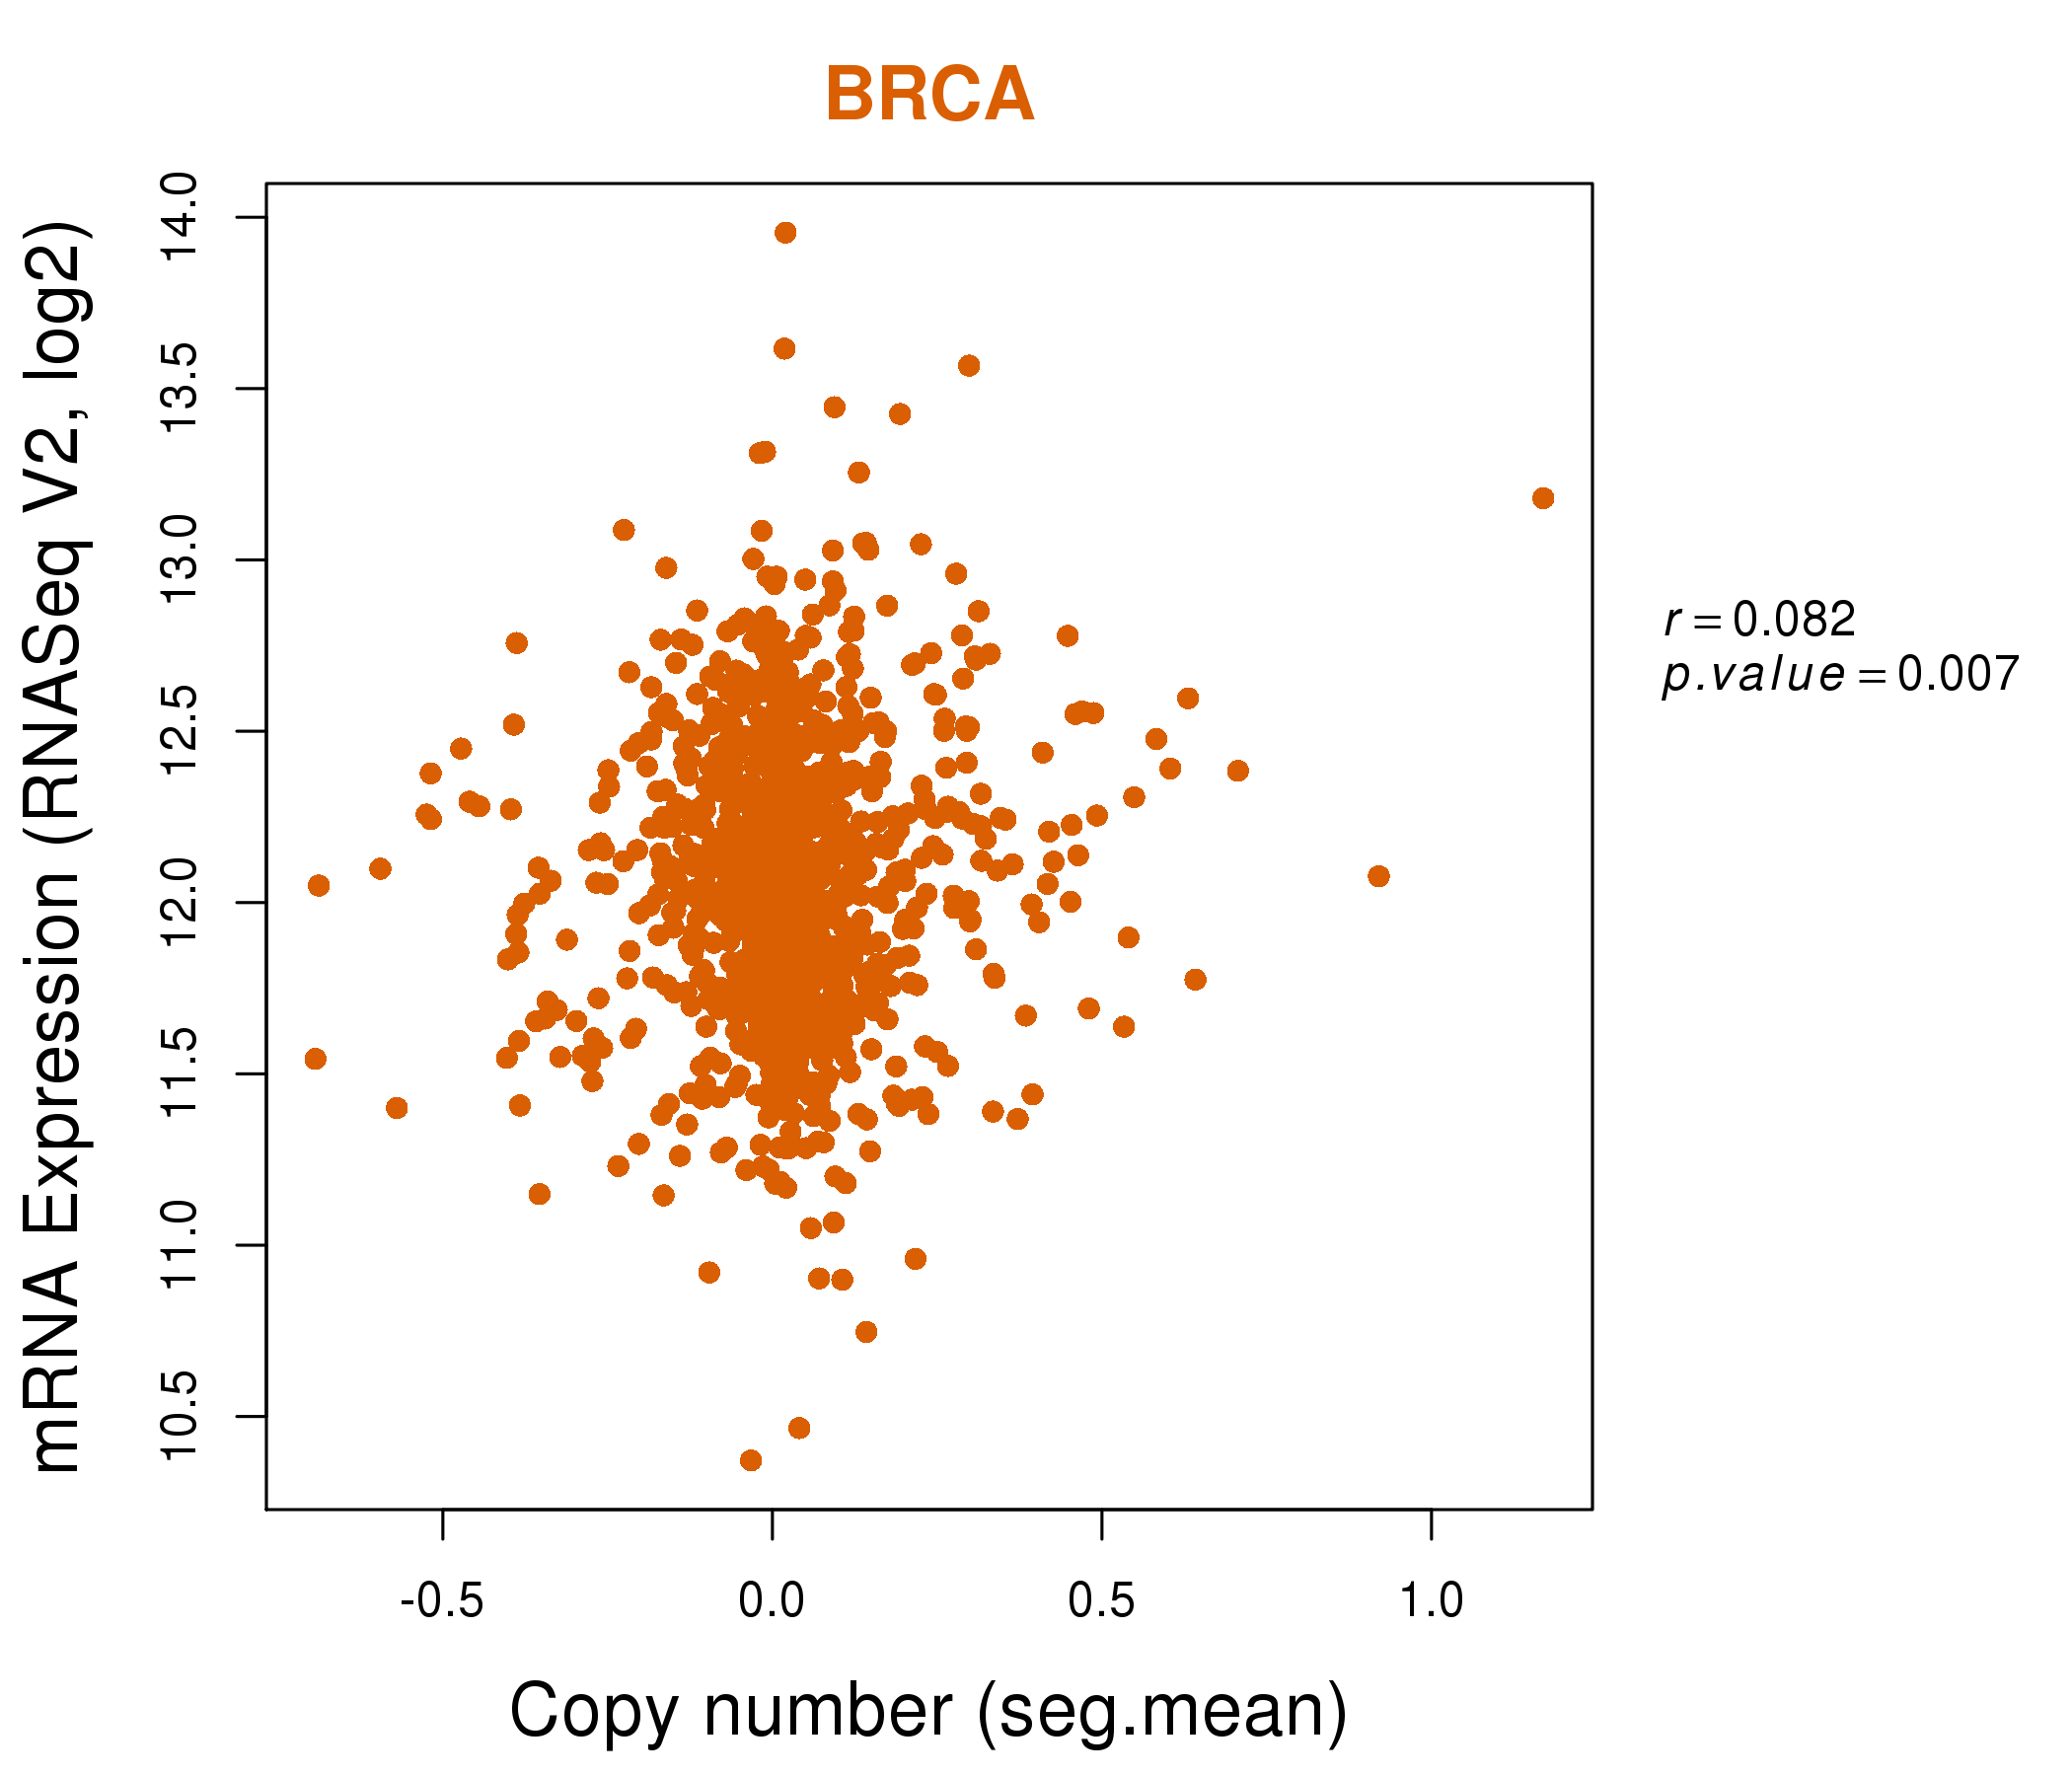
| * This plots show the correlation between CNV and gene expression. |
: Open all plots for all cancer types
 |
|
 |
|

| Top |
| Gene-Gene Network Information |
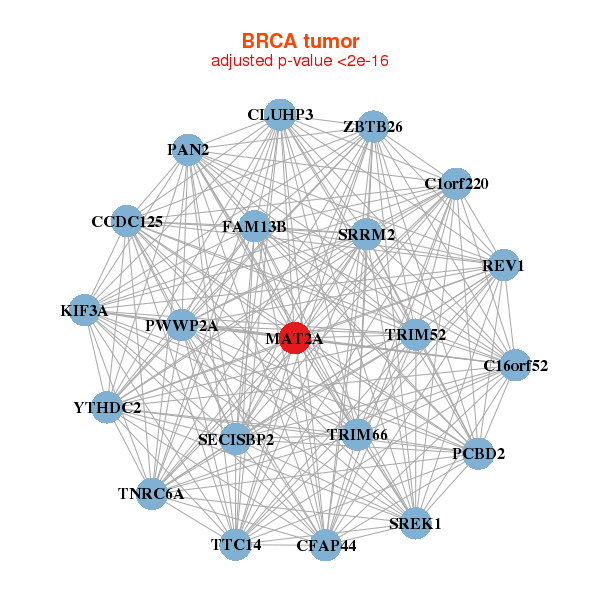
| * Co-Expression network figures were drawn using R package igraph. Only the top 20 genes with the highest correlations were shown. Red circle: input gene, orange circle: cell metabolism gene, sky circle: other gene |
: Open all plots for all cancer types
 |
| ||||
| C16orf52,C1orf220,CCDC125,FAM13B,CLUHP3,KIF3A,MAT2A, PAN2,PCBD2,PWWP2A,REV1,SECISBP2,SREK1,SRRM2, TNRC6A,TRIM52,TRIM66,TTC14,CFAP44,YTHDC2,ZBTB26 | AMD1,AP1S3,ARF6,CDC42SE1,CDK2,CRY1,DDX5, FZD3,MACC1,MAK,MAT2A,NIP7,PNO1,PPP4R1, RBM12,SLC20A1,SPAG1,TMEM185B,UBXN10,WEE1,ZNF35 | ||||
 |
| ||||
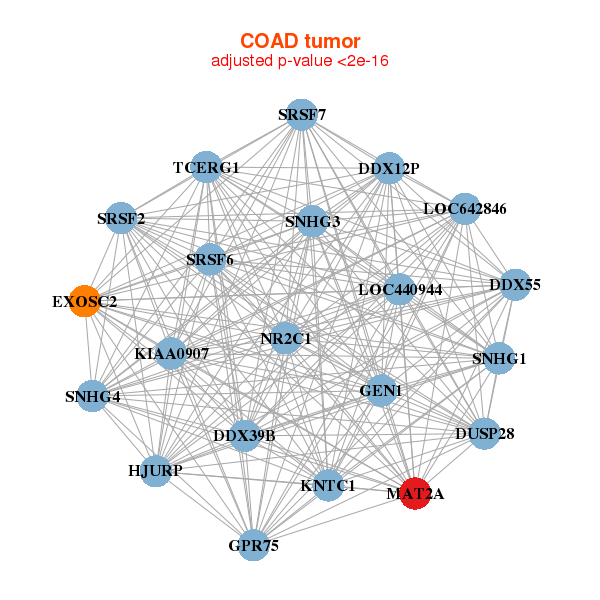
| DDX39B,DDX12P,DDX55,DUSP28,EXOSC2,GEN1,GPR75, HJURP,KIAA0907,KNTC1,LOC440944,LOC642846,MAT2A,NR2C1, SRSF2,SRSF6,SRSF7,SNHG1,SNHG3,SNHG4,TCERG1 | AEN,C1orf100,C6orf141,DDX21,DNAJC2,EFNB2,ETF1, FOSL1,GPR3,MARS2,MAT2A,PDE12,PIGW,PLEKHG1, SEH1L,TNFRSF12A,TRMT6,URB2,UTP15,XIRP1,ZNF562 |

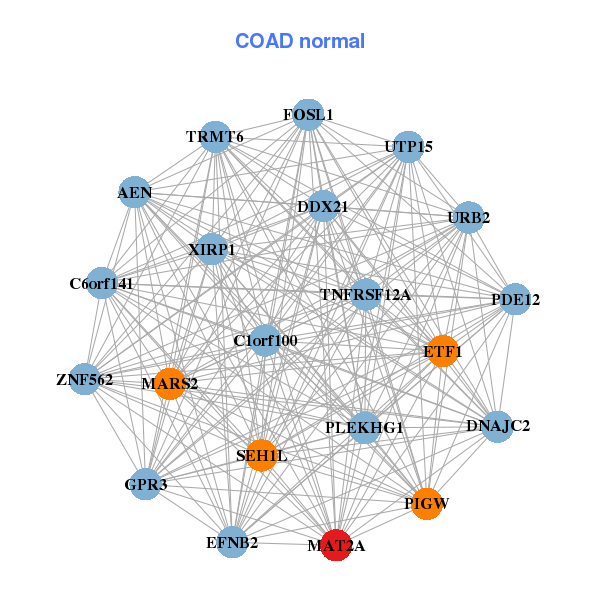
| * Co-Expression network figures were drawn using R package igraph. Only the top 20 genes with the highest correlations were shown. Red circle: input gene, orange circle: cell metabolism gene, sky circle: other gene |
: Open all plots for all cancer types
| Top |
: Open all interacting genes' information including KEGG pathway for all interacting genes from DAVID
| Top |
| Pharmacological Information for MAT2A |
| DB Category | DB Name | DB's ID and Url link |
| Organism-specific databases | PharmGKB | PA30647; -. |
| Organism-specific databases | CTD | 4144; -. |
| * Gene Centered Interaction Network. |
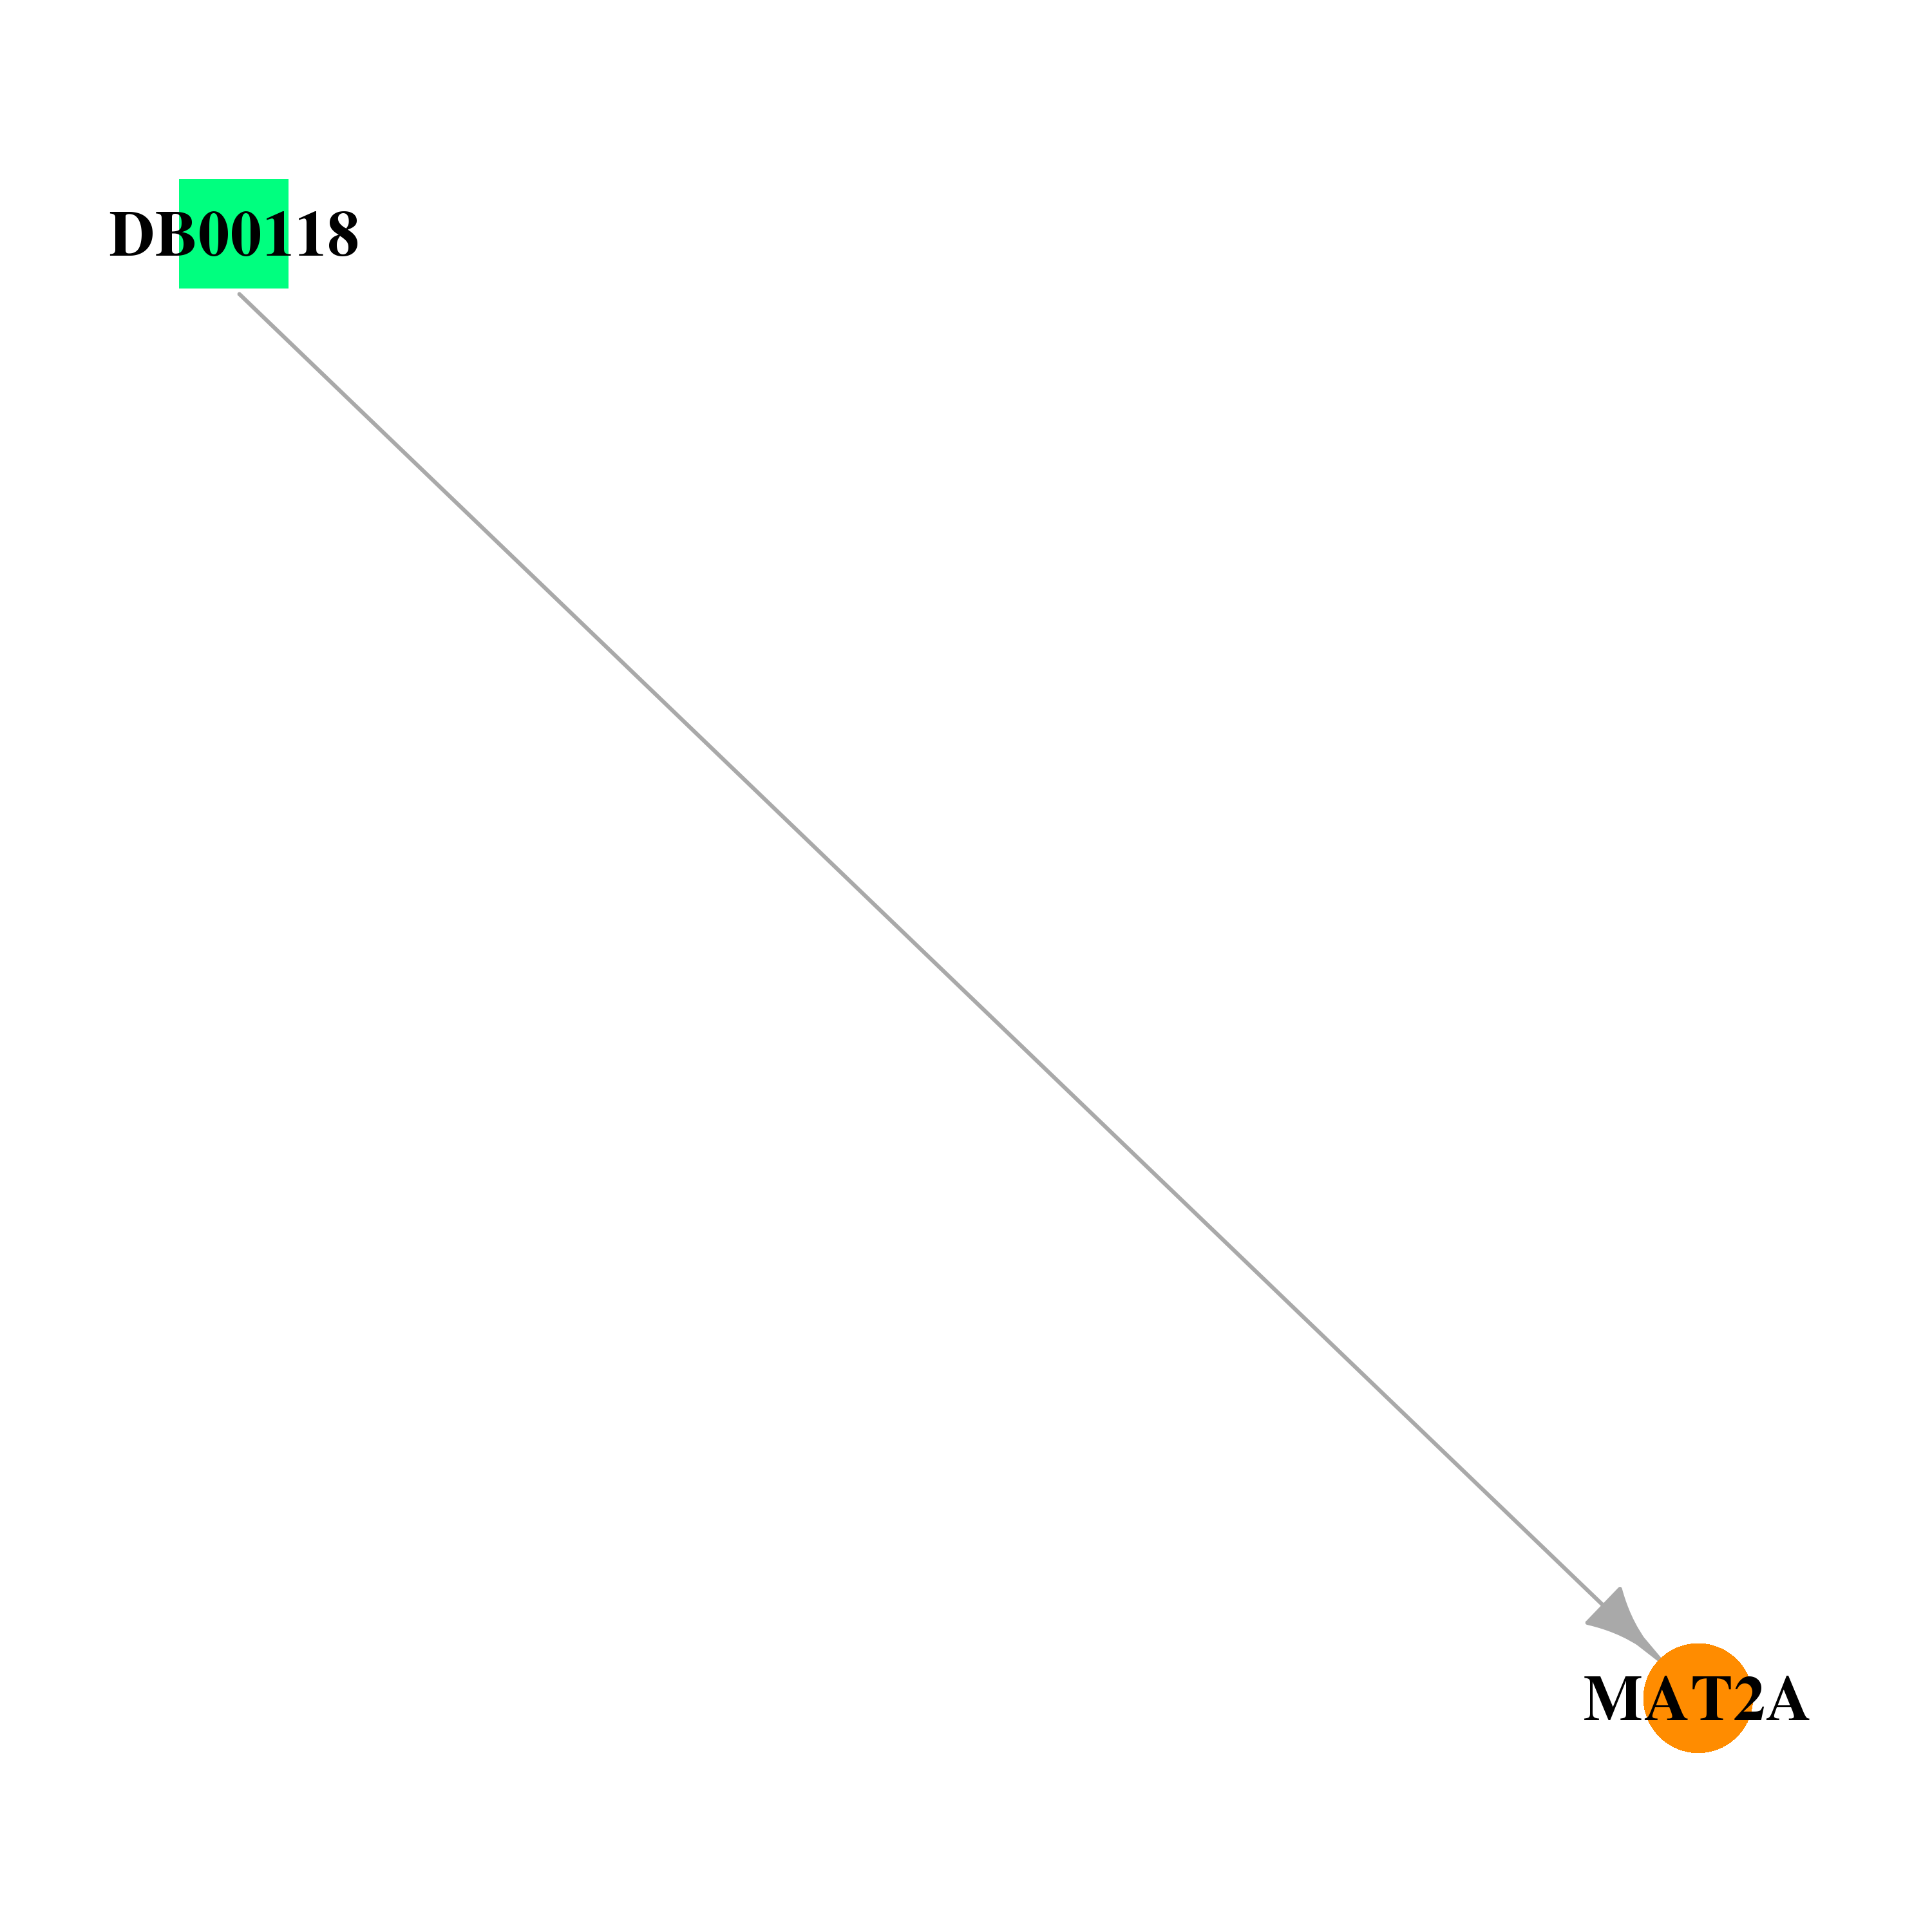 |
| * Drug Centered Interaction Network. |
| DrugBank ID | Target Name | Drug Groups | Generic Name | Drug Centered Network | Drug Structure |
| DB00118 | methionine adenosyltransferase II, alpha | approved; nutraceutical | S-Adenosylmethionine | 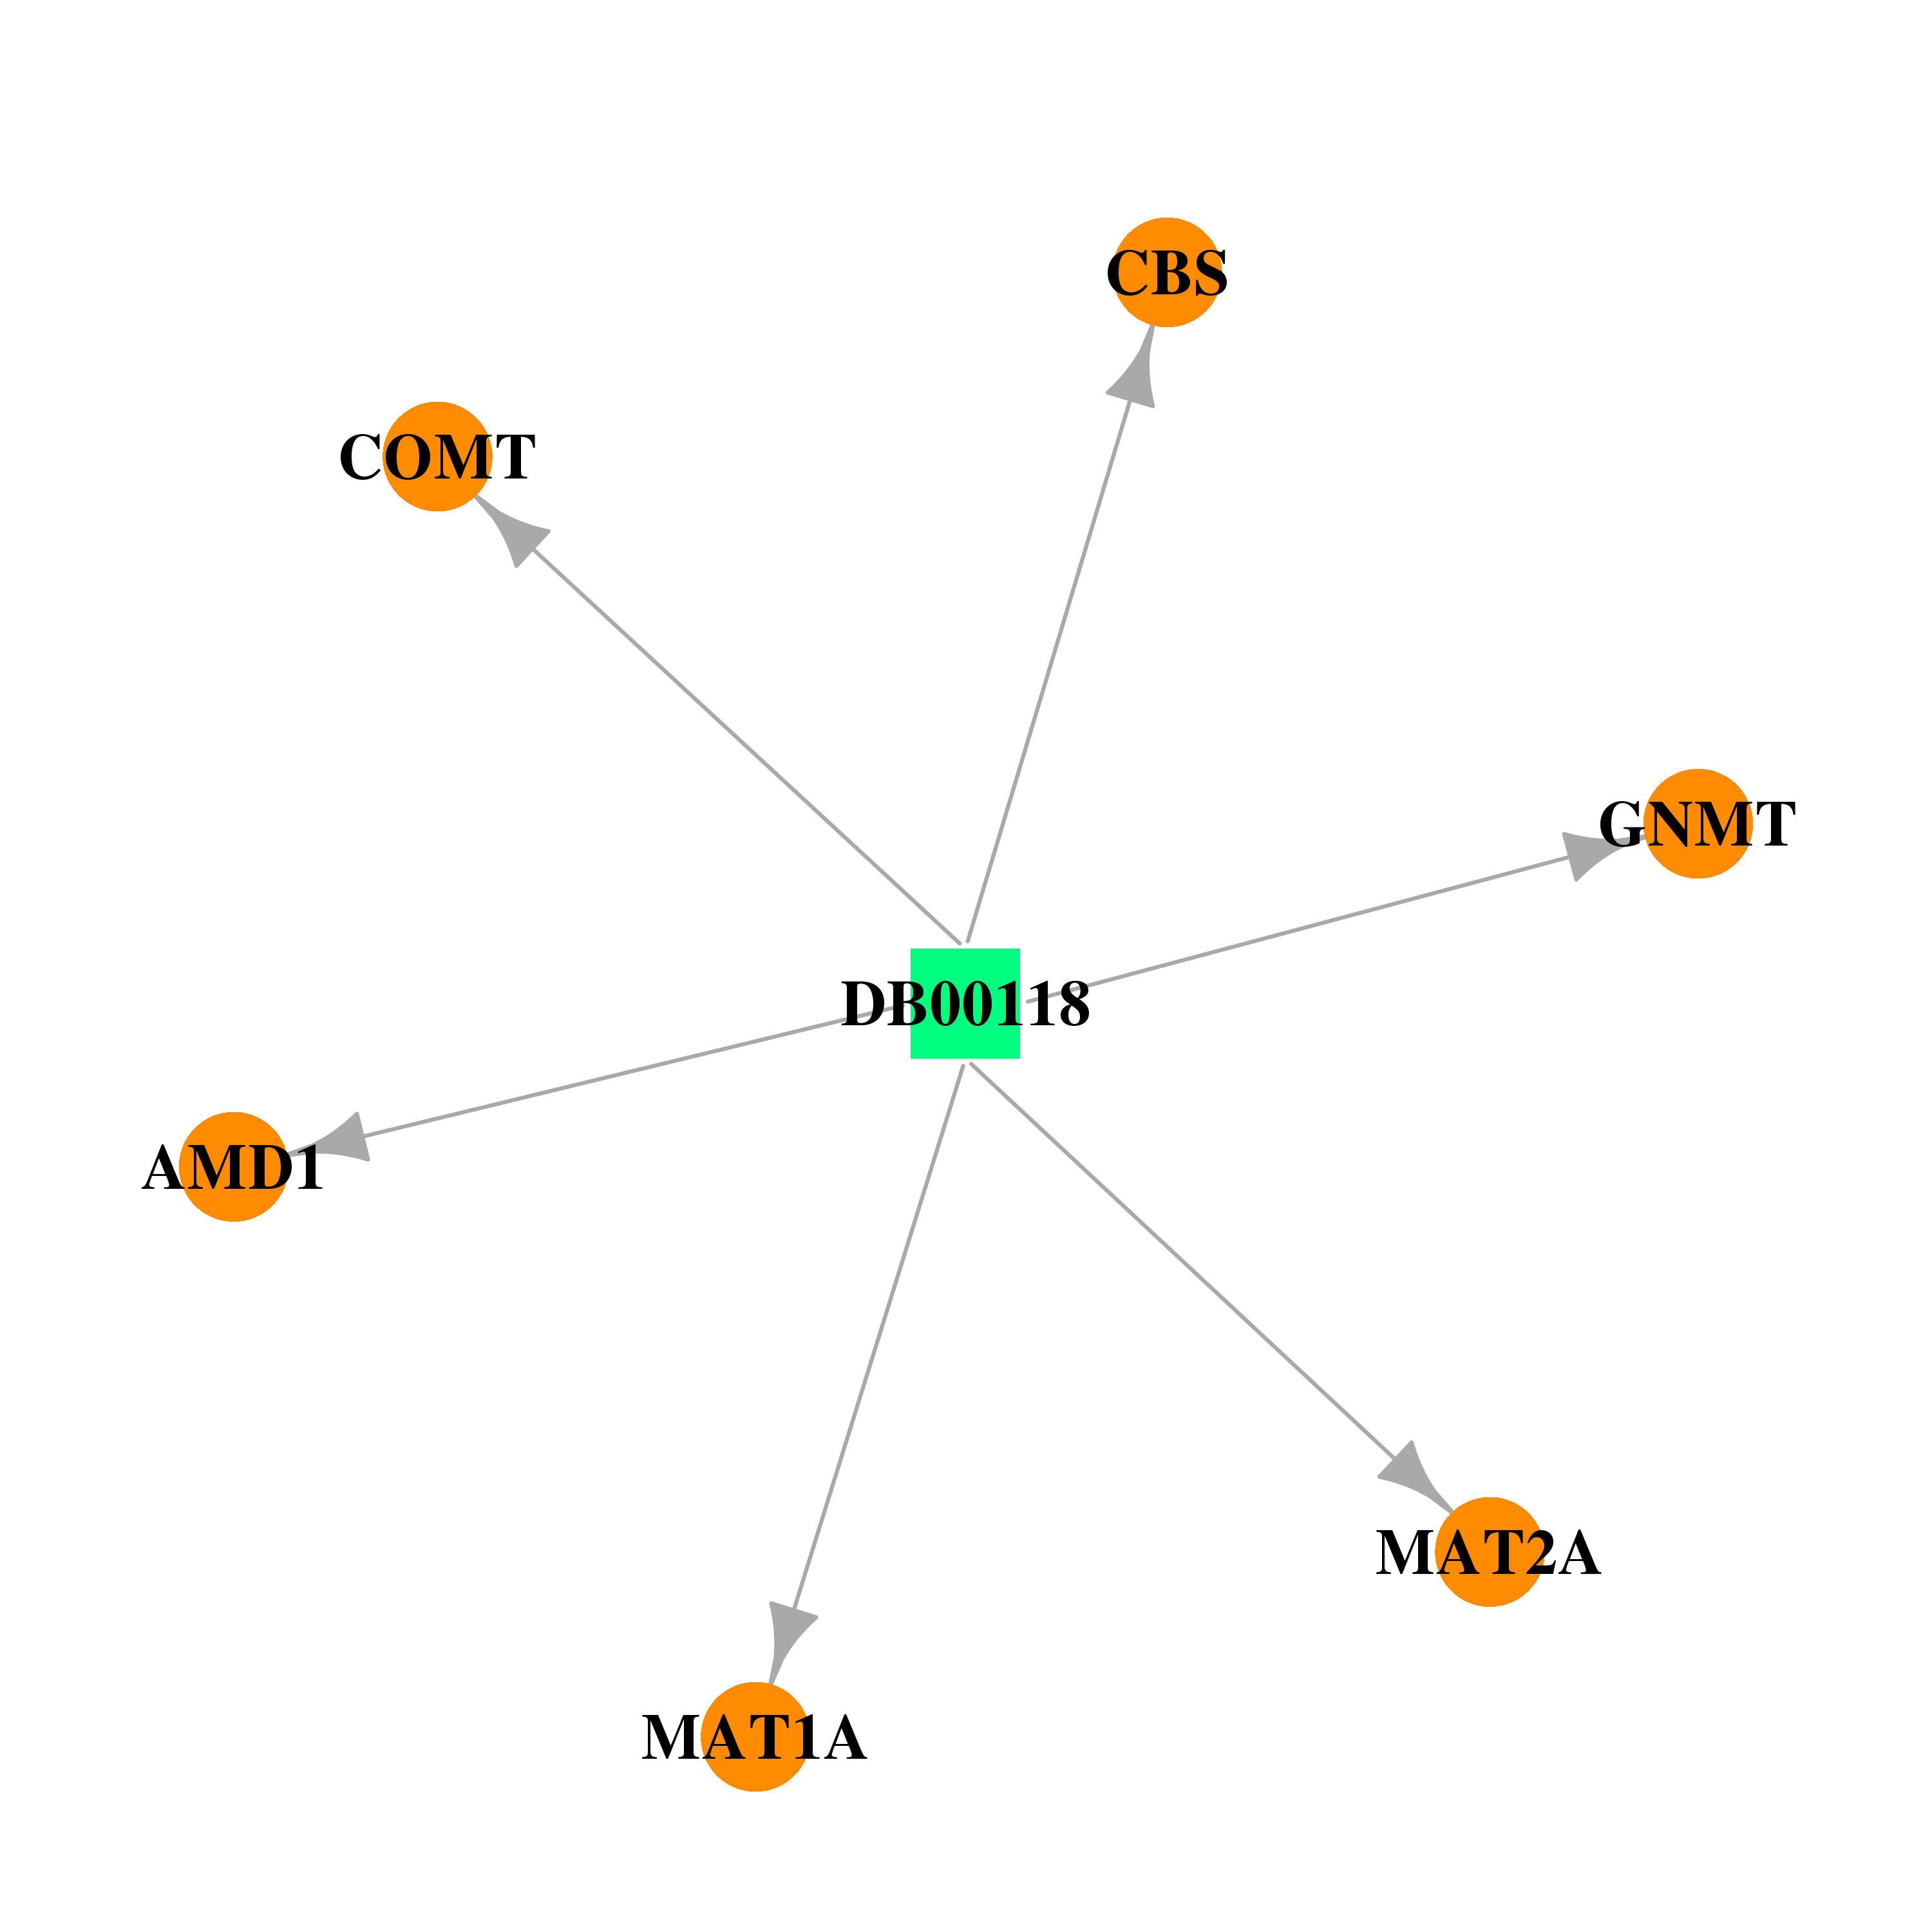 |  |
| Top |
| Cross referenced IDs for MAT2A |
| * We obtained these cross-references from Uniprot database. It covers 150 different DBs, 18 categories. http://www.uniprot.org/help/cross_references_section |
: Open all cross reference information
|
Copyright © 2016-Present - The Univsersity of Texas Health Science Center at Houston @ |