|
||||||||||||||||||||
| |
| Phenotypic Information (metabolism pathway, cancer, disease, phenome) |
| |
| |
| Gene-Gene Network Information: Co-Expression Network, Interacting Genes & KEGG |
| |
|


| Gene Summary for ARSE |
| Basic gene info. | Gene symbol | ARSE |
| Gene name | arylsulfatase E (chondrodysplasia punctata 1) | |
| Synonyms | ASE|CDPX|CDPX1|CDPXR | |
| Cytomap | UCSC genome browser: Xp22.3 | |
| Genomic location | chrX :2852672-2882494 | |
| Type of gene | protein-coding | |
| RefGenes | NM_000047.2, NM_001282628.1,NM_001282631.1, | |
| Ensembl id | ENSG00000157399 | |
| Description | arylsulfatase E | |
| Modification date | 20141219 | |
| dbXrefs | MIM : 300180 | |
| HGNC : HGNC | ||
| Ensembl : ENSG00000157399 | ||
| HPRD : 02171 | ||
| Vega : OTTHUMG00000137358 | ||
| Protein | UniProt: go to UniProt's Cross Reference DB Table | |
| Expression | CleanEX: HS_ARSE | |
| BioGPS: 415 | ||
| Gene Expression Atlas: ENSG00000157399 | ||
| The Human Protein Atlas: ENSG00000157399 | ||
| Pathway | NCI Pathway Interaction Database: ARSE | |
| KEGG: ARSE | ||
| REACTOME: ARSE | ||
| ConsensusPathDB | ||
| Pathway Commons: ARSE | ||
| Metabolism | MetaCyc: ARSE | |
| HUMANCyc: ARSE | ||
| Regulation | Ensembl's Regulation: ENSG00000157399 | |
| miRBase: chrX :2,852,672-2,882,494 | ||
| TargetScan: NM_000047 | ||
| cisRED: ENSG00000157399 | ||
| Context | iHOP: ARSE | |
| cancer metabolism search in PubMed: ARSE | ||
| UCL Cancer Institute: ARSE | ||
| Assigned class in ccmGDB | C | |
| Top |
| Phenotypic Information for ARSE(metabolism pathway, cancer, disease, phenome) |
| Cancer | CGAP: ARSE |
| Familial Cancer Database: ARSE | |
| * This gene is included in those cancer gene databases. |
|
|
|
|
|
| . | ||||||||||||||
Oncogene 1 | Significant driver gene in | |||||||||||||||||||
| cf) number; DB name 1 Oncogene; http://nar.oxfordjournals.org/content/35/suppl_1/D721.long, 2 Tumor Suppressor gene; https://bioinfo.uth.edu/TSGene/, 3 Cancer Gene Census; http://www.nature.com/nrc/journal/v4/n3/abs/nrc1299.html, 4 CancerGenes; http://nar.oxfordjournals.org/content/35/suppl_1/D721.long, 5 Network of Cancer Gene; http://ncg.kcl.ac.uk/index.php, 1Therapeutic Vulnerabilities in Cancer; http://cbio.mskcc.org/cancergenomics/statius/ |
| REACTOME_GLYCOSPHINGOLIPID_METABOLISM REACTOME_PHOSPHOLIPID_METABOLISM REACTOME_METABOLISM_OF_PROTEINS REACTOME_SPHINGOLIPID_METABOLISM REACTOME_METABOLISM_OF_LIPIDS_AND_LIPOPROTEINS | |
| OMIM | |
| Orphanet | |
| Disease | KEGG Disease: ARSE |
| MedGen: ARSE (Human Medical Genetics with Condition) | |
| ClinVar: ARSE | |
| Phenotype | MGI: ARSE (International Mouse Phenotyping Consortium) |
| PhenomicDB: ARSE | |
| Mutations for ARSE |
| * Under tables are showing count per each tissue to give us broad intuition about tissue specific mutation patterns.You can go to the detailed page for each mutation database's web site. |
| There's no structural variation information in COSMIC data for this gene. |
| * From mRNA Sanger sequences, Chitars2.0 arranged chimeric transcripts. This table shows ARSE related fusion information. |
| ID | Head Gene | Tail Gene | Accession | Gene_a | qStart_a | qEnd_a | Chromosome_a | tStart_a | tEnd_a | Gene_a | qStart_a | qEnd_a | Chromosome_a | tStart_a | tEnd_a |
| Top |
| There's no copy number variation information in COSMIC data for this gene. |
| Top |
|
 |
| Top |
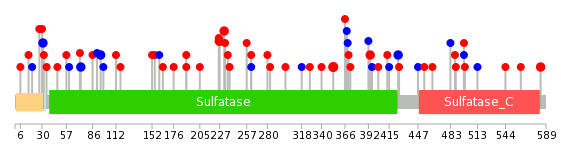
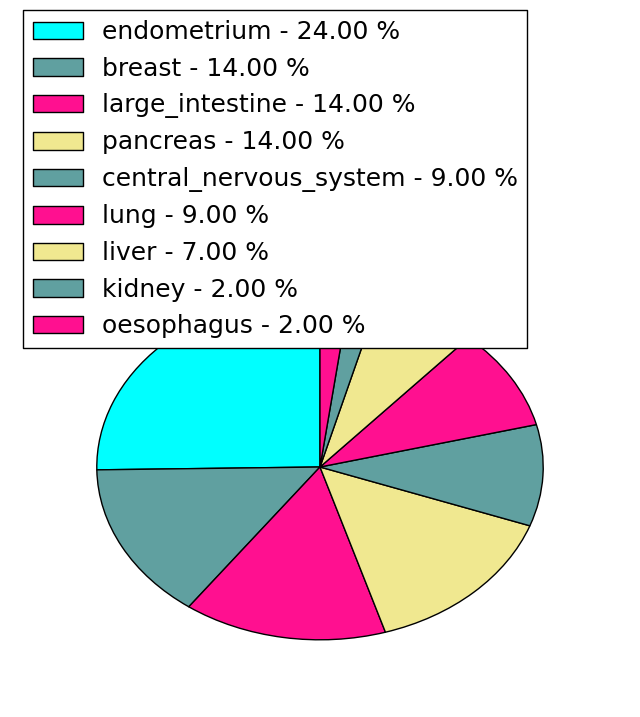
| Stat. for Non-Synonymous SNVs (# total SNVs=41) | (# total SNVs=16) |
 |  |
(# total SNVs=0) | (# total SNVs=0) |
| Top |
| * When you move the cursor on each content, you can see more deailed mutation information on the Tooltip. Those are primary_site,primary_histology,mutation(aa),pubmedID. |
| GRCh37 position | Mutation(aa) | Unique sampleID count |
| chr23:2867520-2867520 | p.V227I | 3 |
| chr23:2861175-2861175 | p.D353N | 3 |
| chr23:2852896-2852896 | p.L583V | 2 |
| chr23:2876407-2876407 | p.S31S | 2 |
| chr23:2873479-2873479 | p.T95T | 2 |
| chr23:2856150-2856150 | p.E425E | 2 |
| chr23:2873545-2873545 | p.G73G | 2 |
| chr23:2867504-2867504 | p.L232P | 2 |
| chr23:2856245-2856245 | p.R394C | 2 |
| chr23:2853194-2853194 | p.V483V | 1 |
| Top |
|
 |
| Point Mutation/ Tissue ID | 1 | 2 | 3 | 4 | 5 | 6 | 7 | 8 | 9 | 10 | 11 | 12 | 13 | 14 | 15 | 16 | 17 | 18 | 19 | 20 |
| # sample | 1 | 3 | 4 | 4 | 1 | 1 | 1 | 2 | 1 | 1 | 5 | 6 | 2 | 8 | ||||||
| # mutation | 1 | 3 | 5 | 4 | 1 | 1 | 1 | 2 | 1 | 1 | 5 | 7 | 2 | 13 | ||||||
| nonsynonymous SNV | 2 | 4 | 3 | 1 | 2 | 1 | 4 | 3 | 1 | 9 | ||||||||||
| synonymous SNV | 1 | 1 | 1 | 1 | 1 | 1 | 1 | 1 | 4 | 1 | 4 |
| cf) Tissue ID; Tissue type (1; BLCA[Bladder Urothelial Carcinoma], 2; BRCA[Breast invasive carcinoma], 3; CESC[Cervical squamous cell carcinoma and endocervical adenocarcinoma], 4; COAD[Colon adenocarcinoma], 5; GBM[Glioblastoma multiforme], 6; Glioma Low Grade, 7; HNSC[Head and Neck squamous cell carcinoma], 8; KICH[Kidney Chromophobe], 9; KIRC[Kidney renal clear cell carcinoma], 10; KIRP[Kidney renal papillary cell carcinoma], 11; LAML[Acute Myeloid Leukemia], 12; LUAD[Lung adenocarcinoma], 13; LUSC[Lung squamous cell carcinoma], 14; OV[Ovarian serous cystadenocarcinoma ], 15; PAAD[Pancreatic adenocarcinoma], 16; PRAD[Prostate adenocarcinoma], 17; SKCM[Skin Cutaneous Melanoma], 18:STAD[Stomach adenocarcinoma], 19:THCA[Thyroid carcinoma], 20:UCEC[Uterine Corpus Endometrial Carcinoma]) |
| Top |
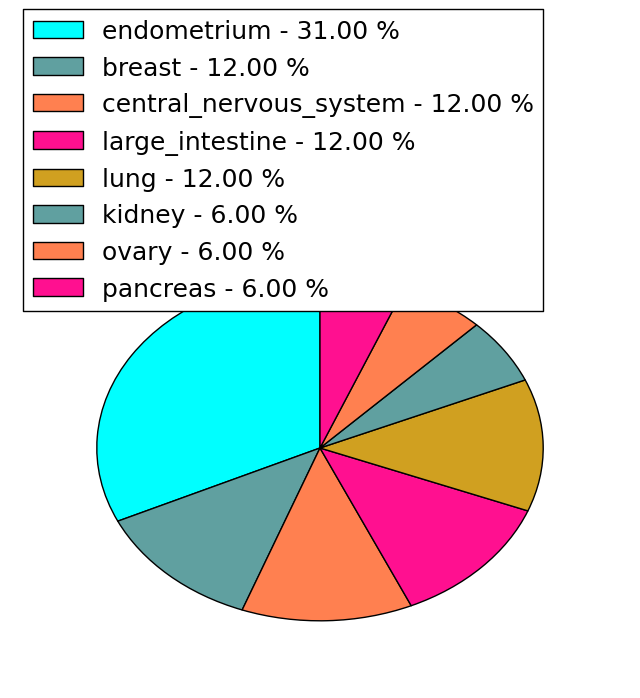
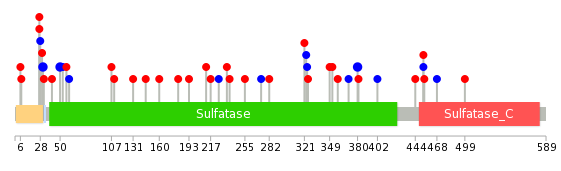
| * We represented just top 10 SNVs. When you move the cursor on each content, you can see more deailed mutation information on the Tooltip. Those are primary_site, primary_histology, mutation(aa), pubmedID. |
| Genomic Position | Mutation(aa) | Unique sampleID count |
| chrX:2873479 | p.T50T,ARSE | 2 |
| chrX:2856150 | p.E380E,ARSE | 2 |
| chrX:2876407 | p.S31S,ARSE | 2 |
| chrX:2856217 | p.G324G,ARSE | 1 |
| chrX:2876421 | p.A110V,ARSE | 1 |
| chrX:2867360 | p.G323G,ARSE | 1 |
| chrX:2853012 | p.C107S,ARSE | 1 |
| chrX:2873470 | p.A499V,ARSE | 1 |
| chrX:2856235 | p.Q321R,ARSE | 1 |
| chrX:2878422 | p.Y53Y,ARSE | 1 |
| * Copy number data were extracted from TCGA using R package TCGA-Assembler. The URLs of all public data files on TCGA DCC data server were gathered on Jan-05-2015. Function ProcessCNAData in TCGA-Assembler package was used to obtain gene-level copy number value which is calculated as the average copy number of the genomic region of a gene. |
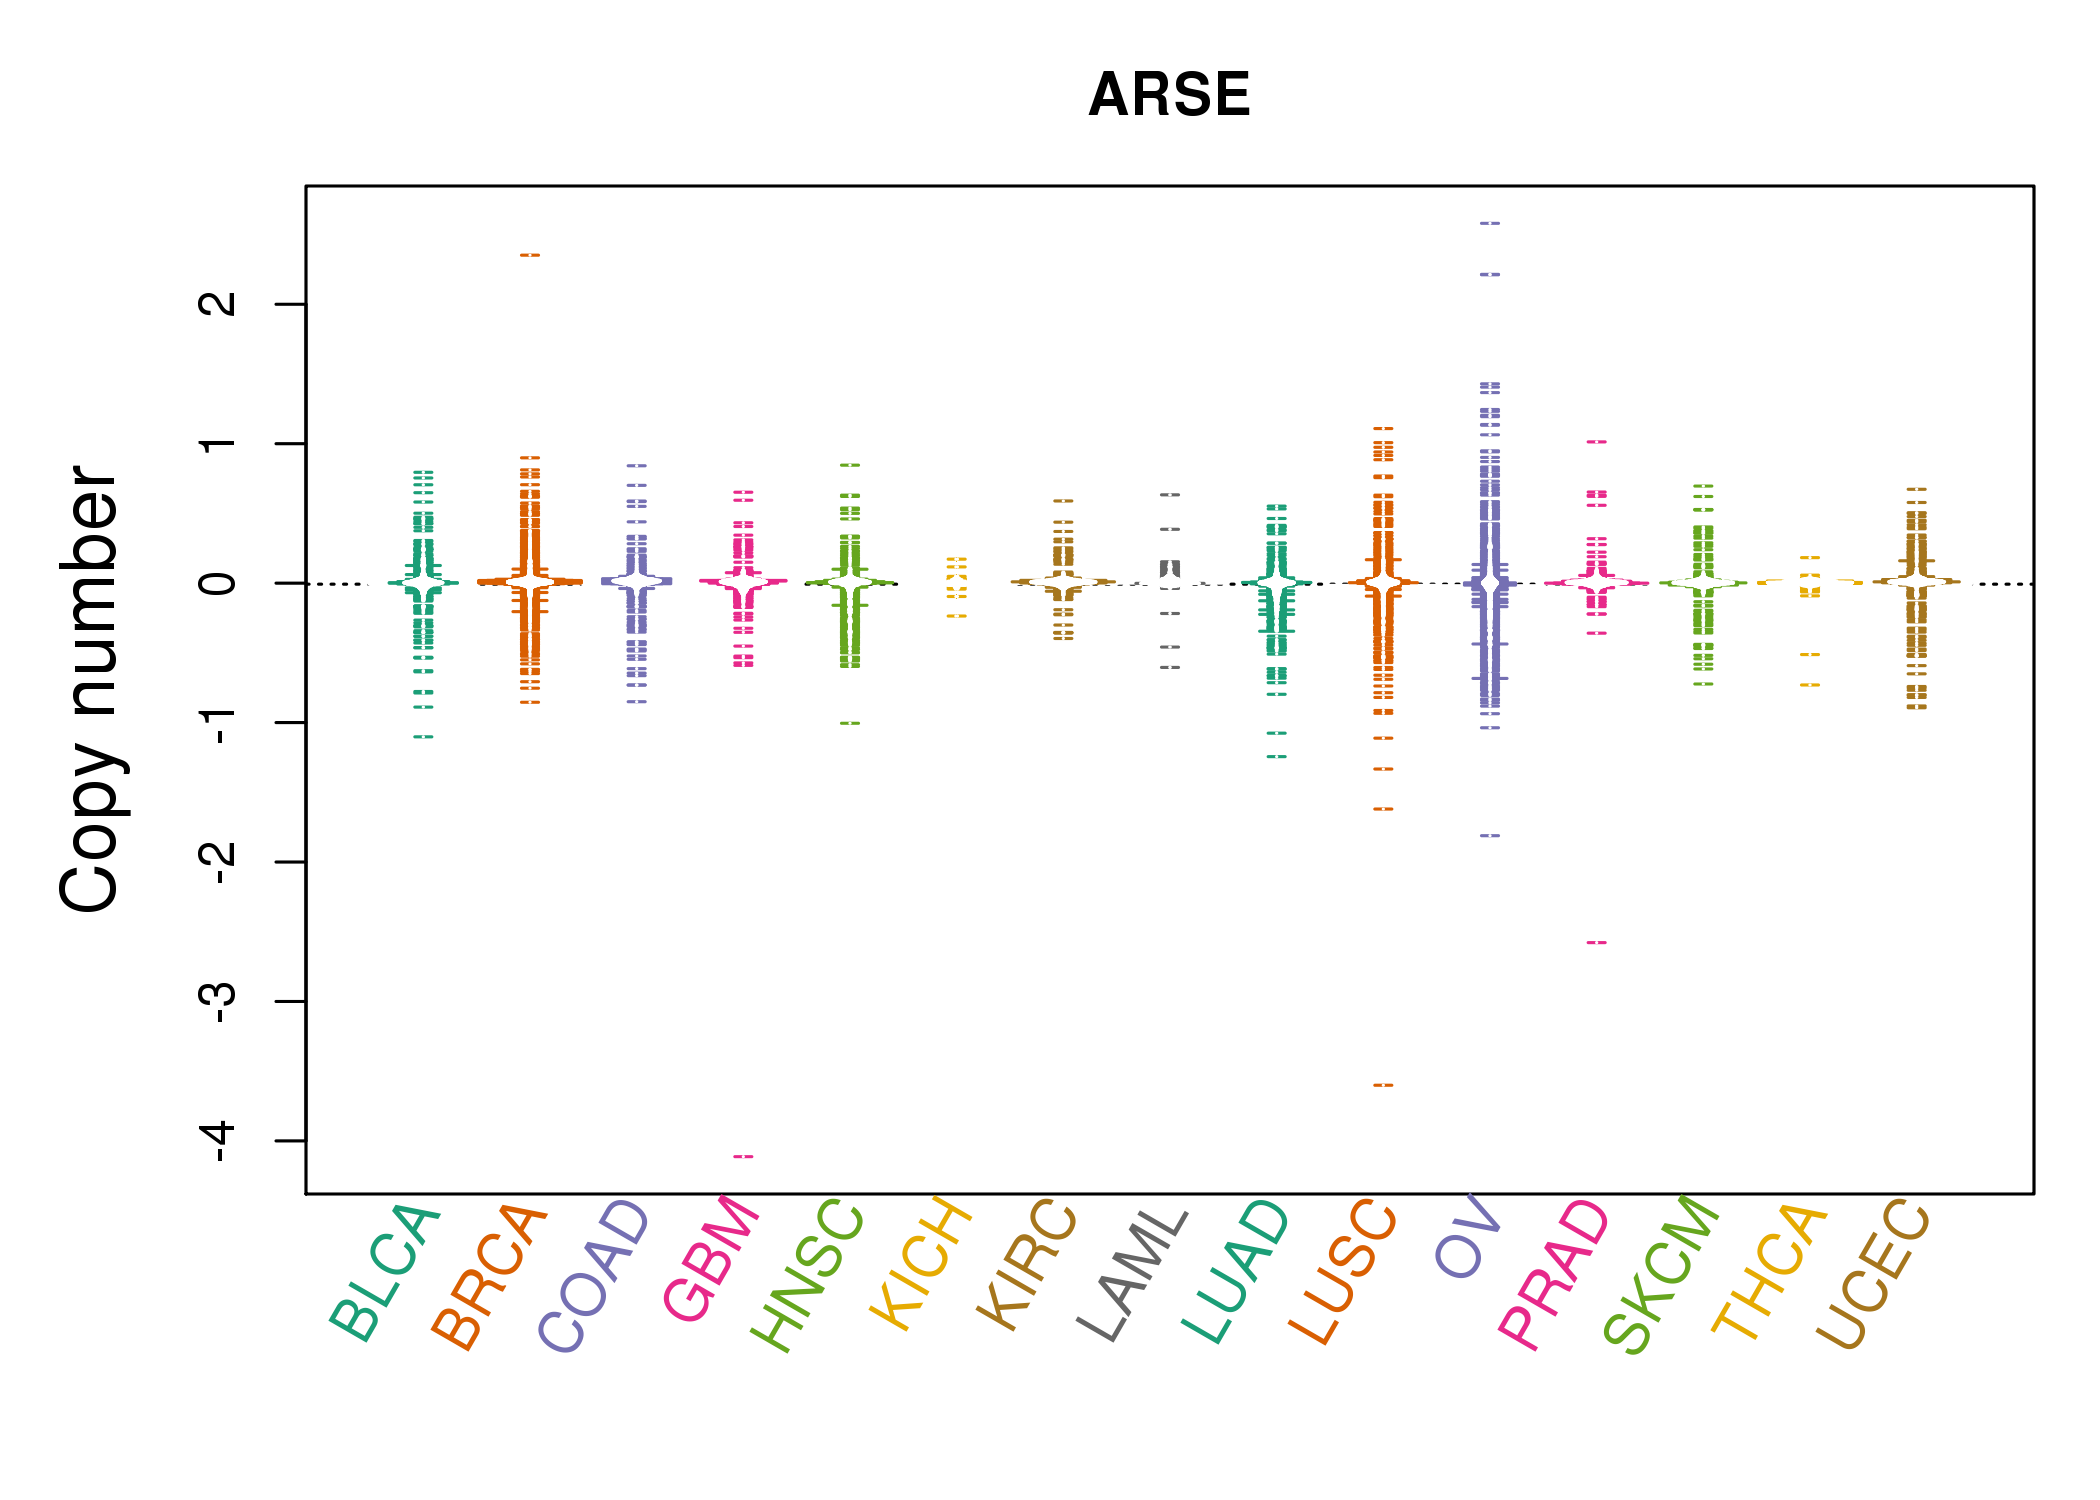 |
| cf) Tissue ID[Tissue type]: BLCA[Bladder Urothelial Carcinoma], BRCA[Breast invasive carcinoma], CESC[Cervical squamous cell carcinoma and endocervical adenocarcinoma], COAD[Colon adenocarcinoma], GBM[Glioblastoma multiforme], Glioma Low Grade, HNSC[Head and Neck squamous cell carcinoma], KICH[Kidney Chromophobe], KIRC[Kidney renal clear cell carcinoma], KIRP[Kidney renal papillary cell carcinoma], LAML[Acute Myeloid Leukemia], LUAD[Lung adenocarcinoma], LUSC[Lung squamous cell carcinoma], OV[Ovarian serous cystadenocarcinoma ], PAAD[Pancreatic adenocarcinoma], PRAD[Prostate adenocarcinoma], SKCM[Skin Cutaneous Melanoma], STAD[Stomach adenocarcinoma], THCA[Thyroid carcinoma], UCEC[Uterine Corpus Endometrial Carcinoma] |
| Top |
| Gene Expression for ARSE |
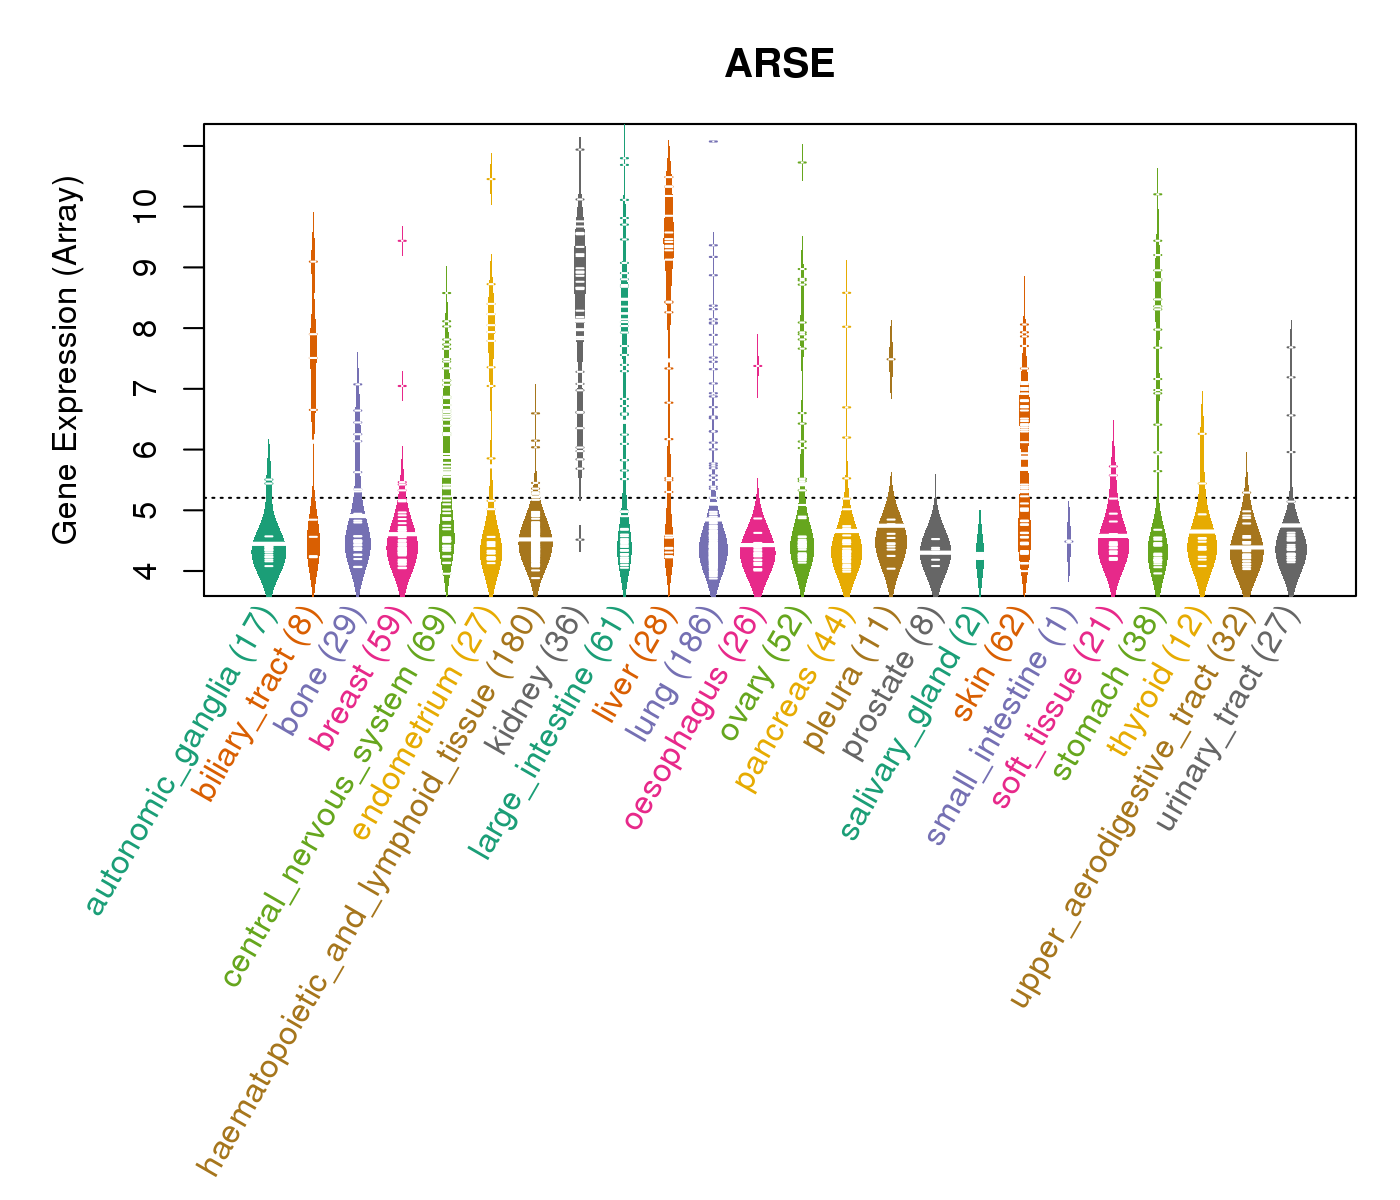
| * CCLE gene expression data were extracted from CCLE_Expression_Entrez_2012-10-18.res: Gene-centric RMA-normalized mRNA expression data. |
 |
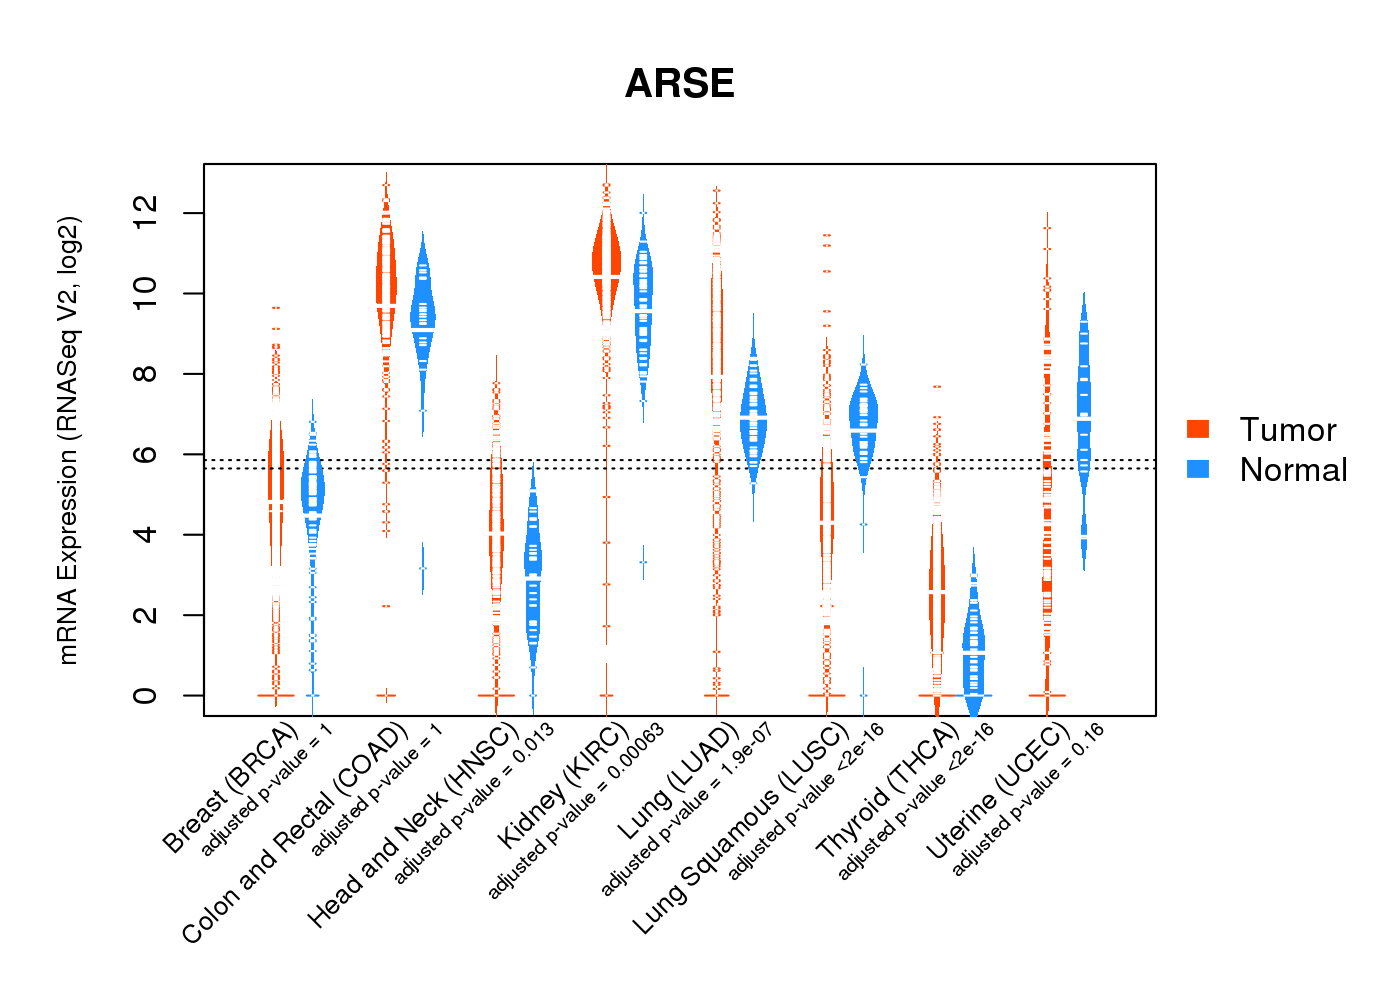
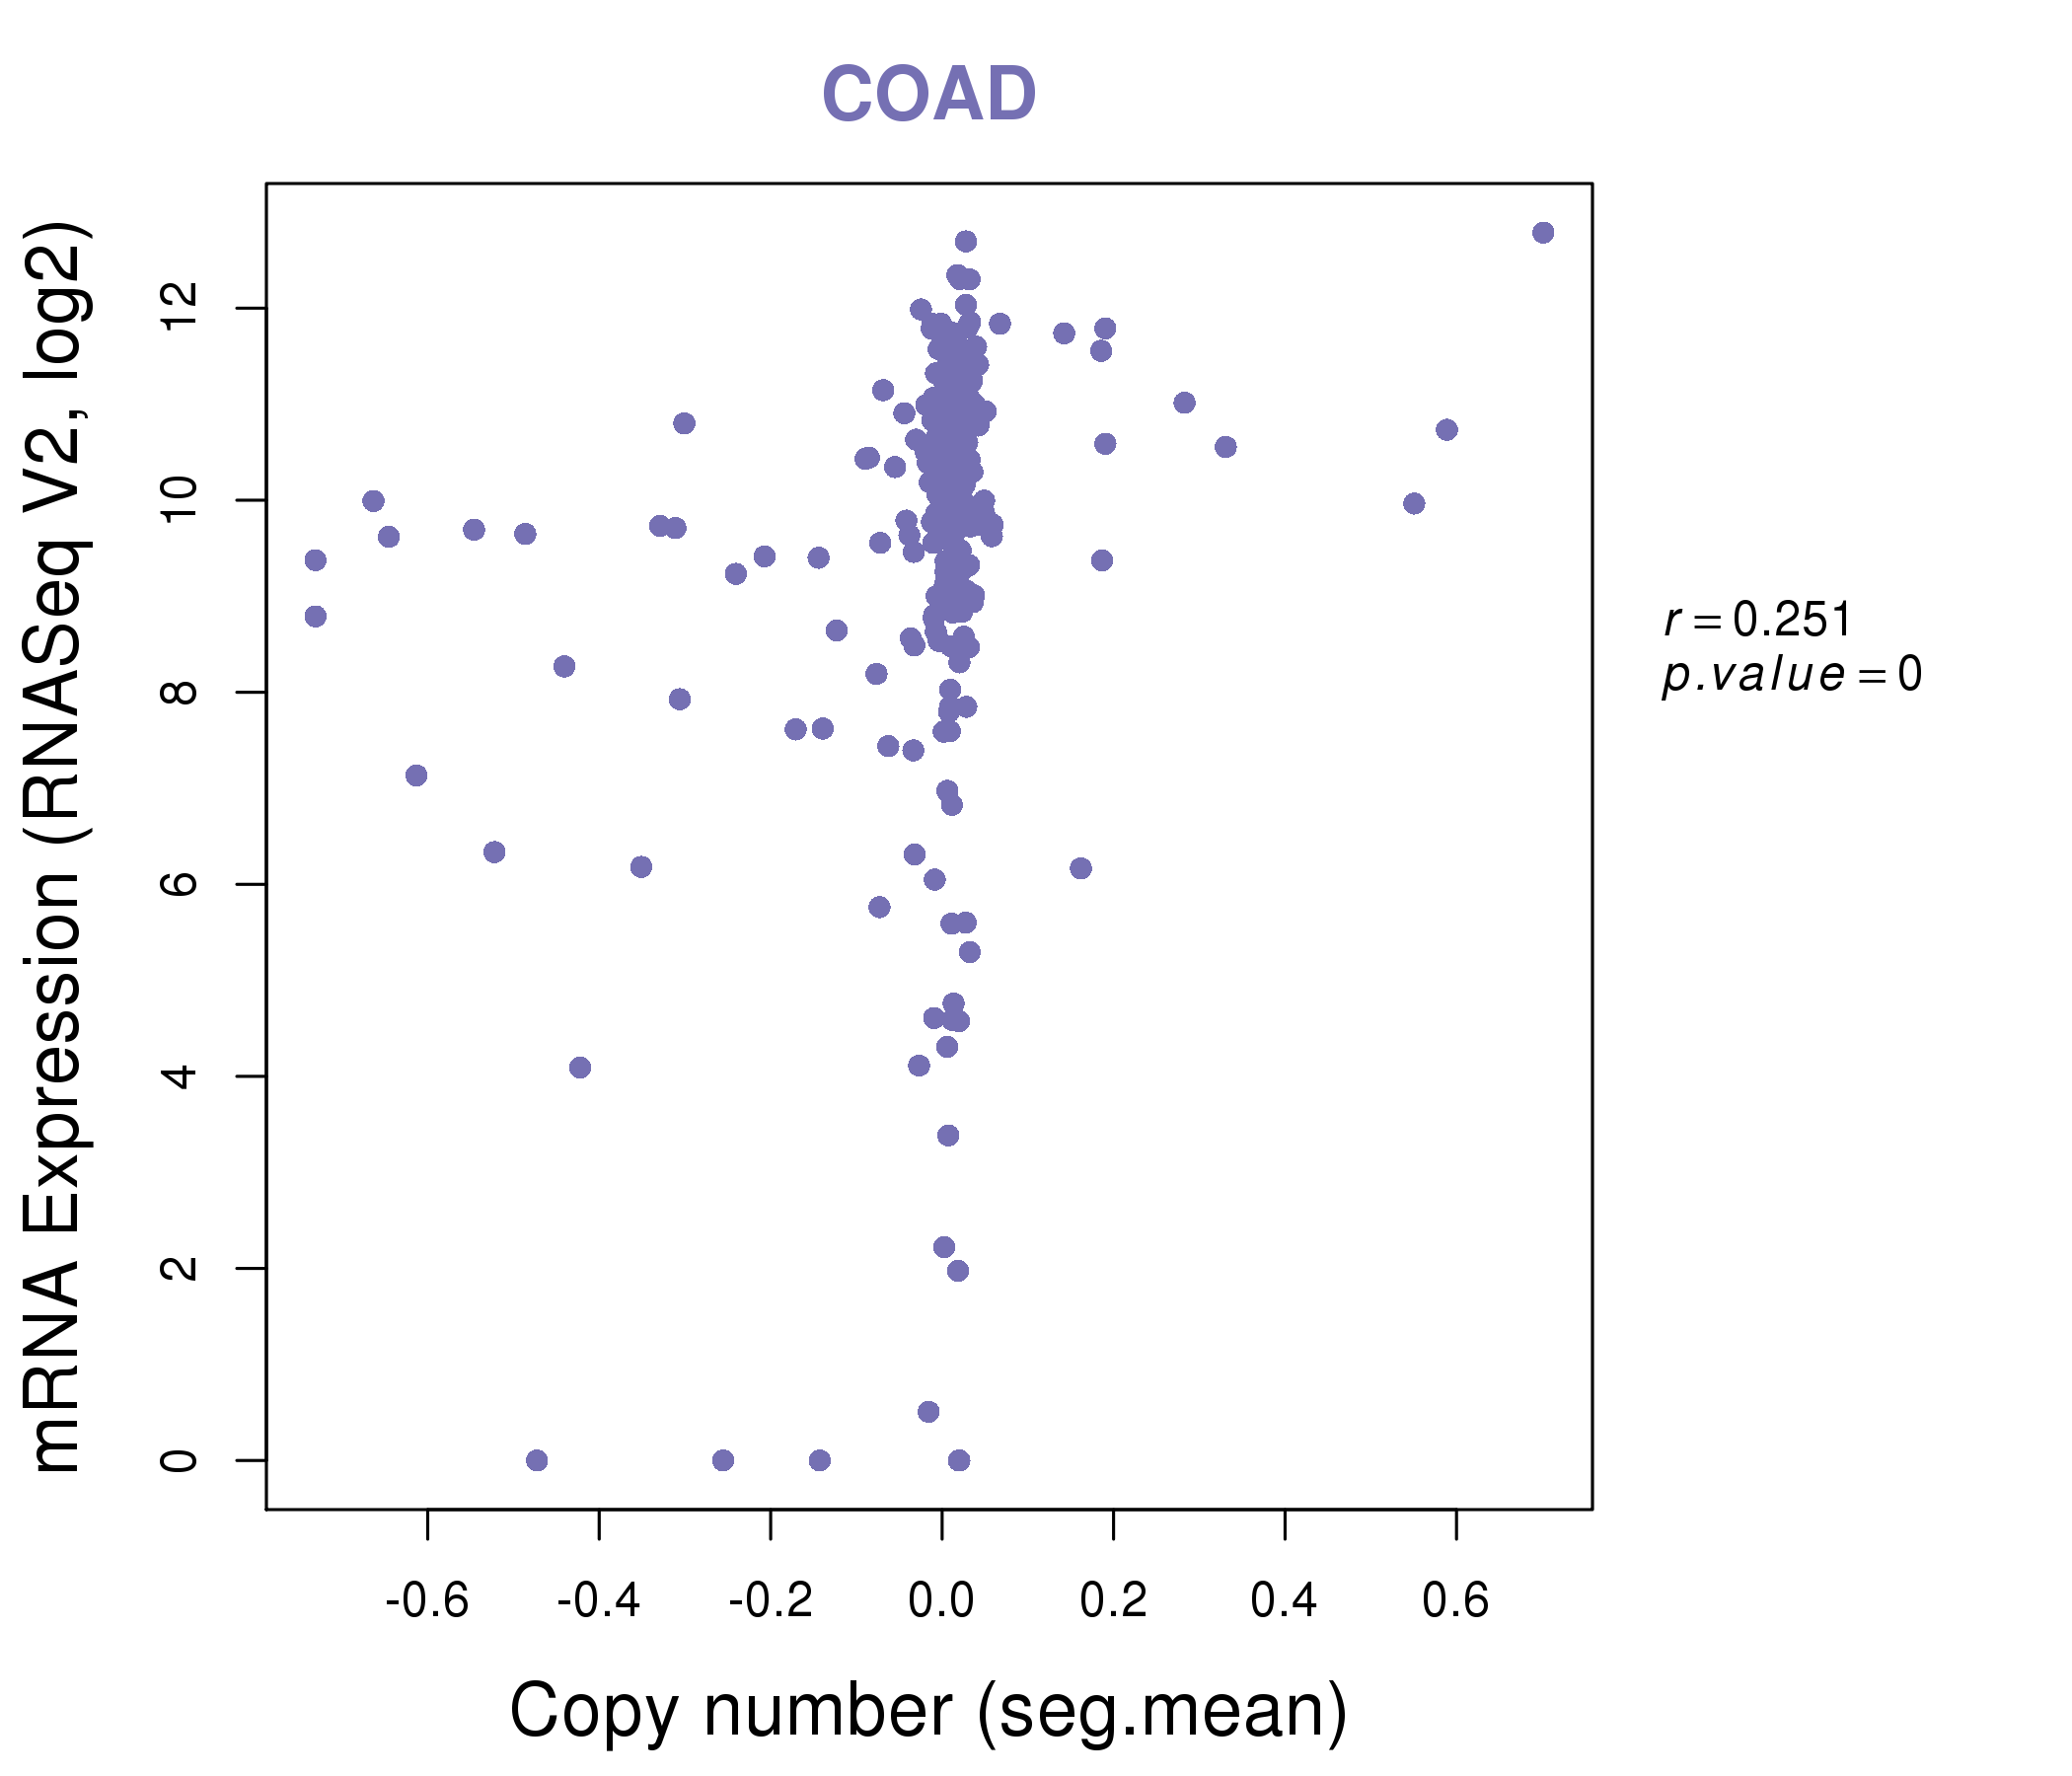
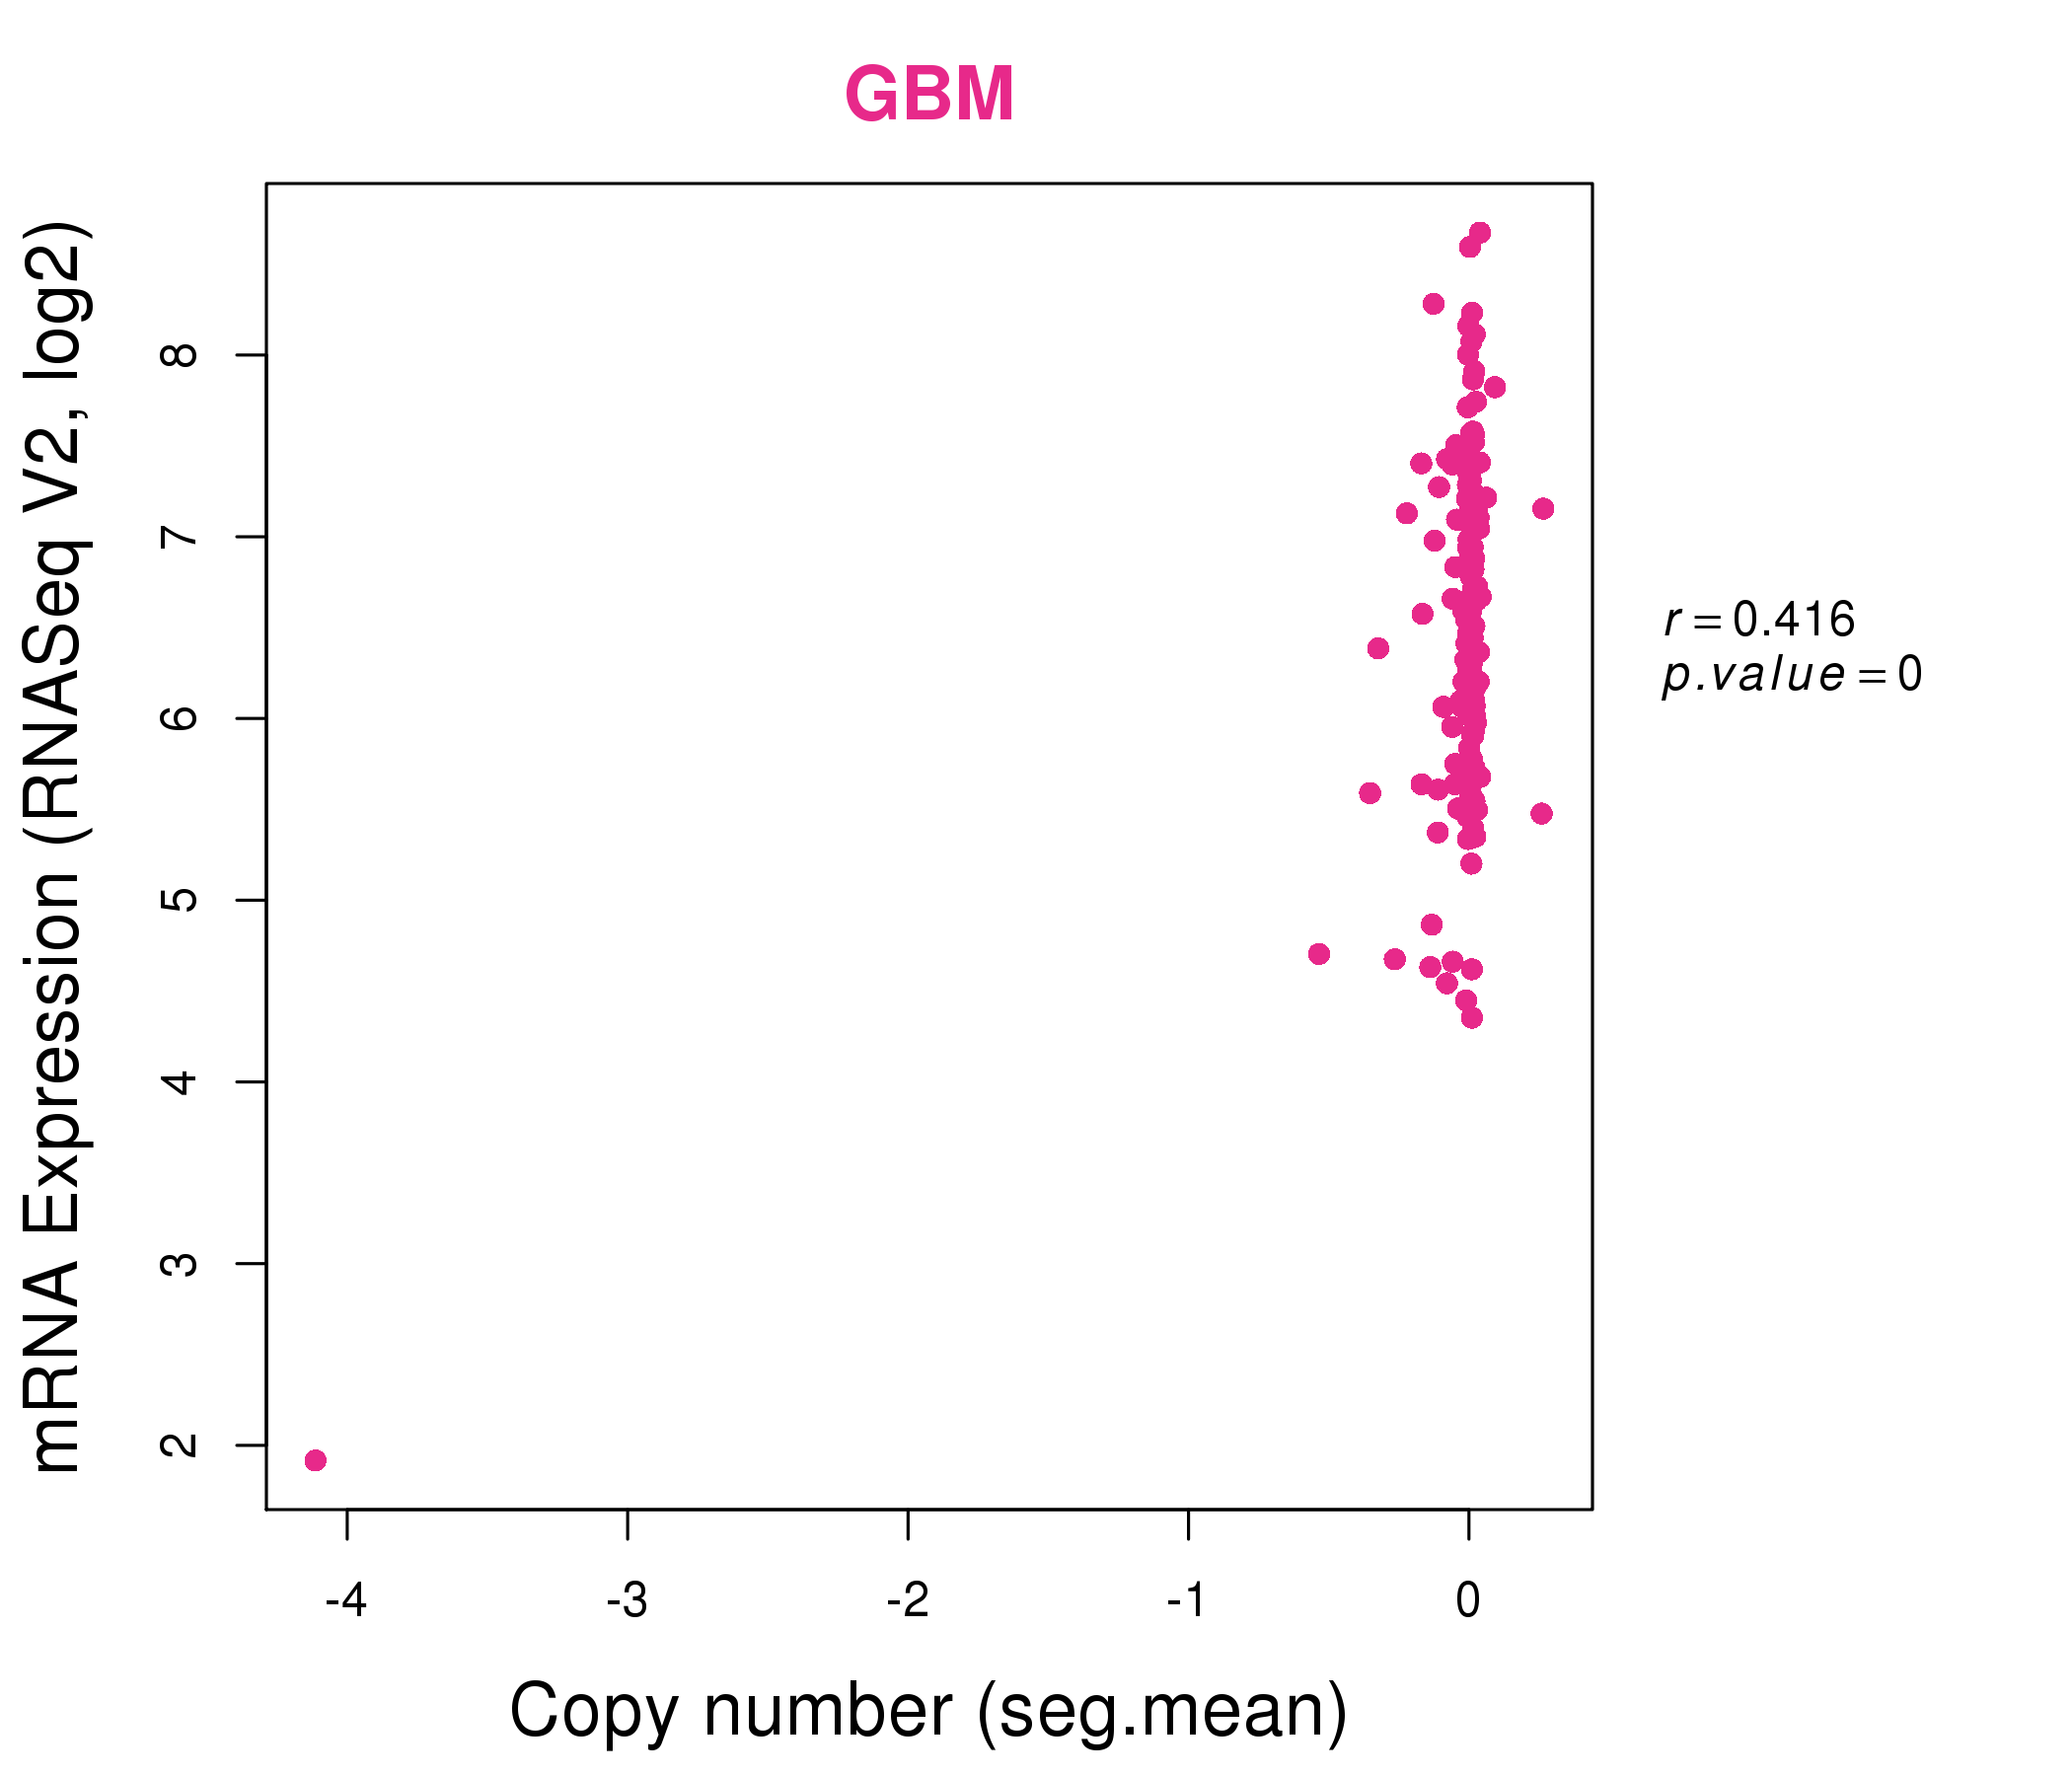
| * Normalized gene expression data of RNASeqV2 was extracted from TCGA using R package TCGA-Assembler. The URLs of all public data files on TCGA DCC data server were gathered at Jan-05-2015. Only eight cancer types have enough normal control samples for differential expression analysis. (t test, adjusted p<0.05 (using Benjamini-Hochberg FDR)) |
 |
| Top |
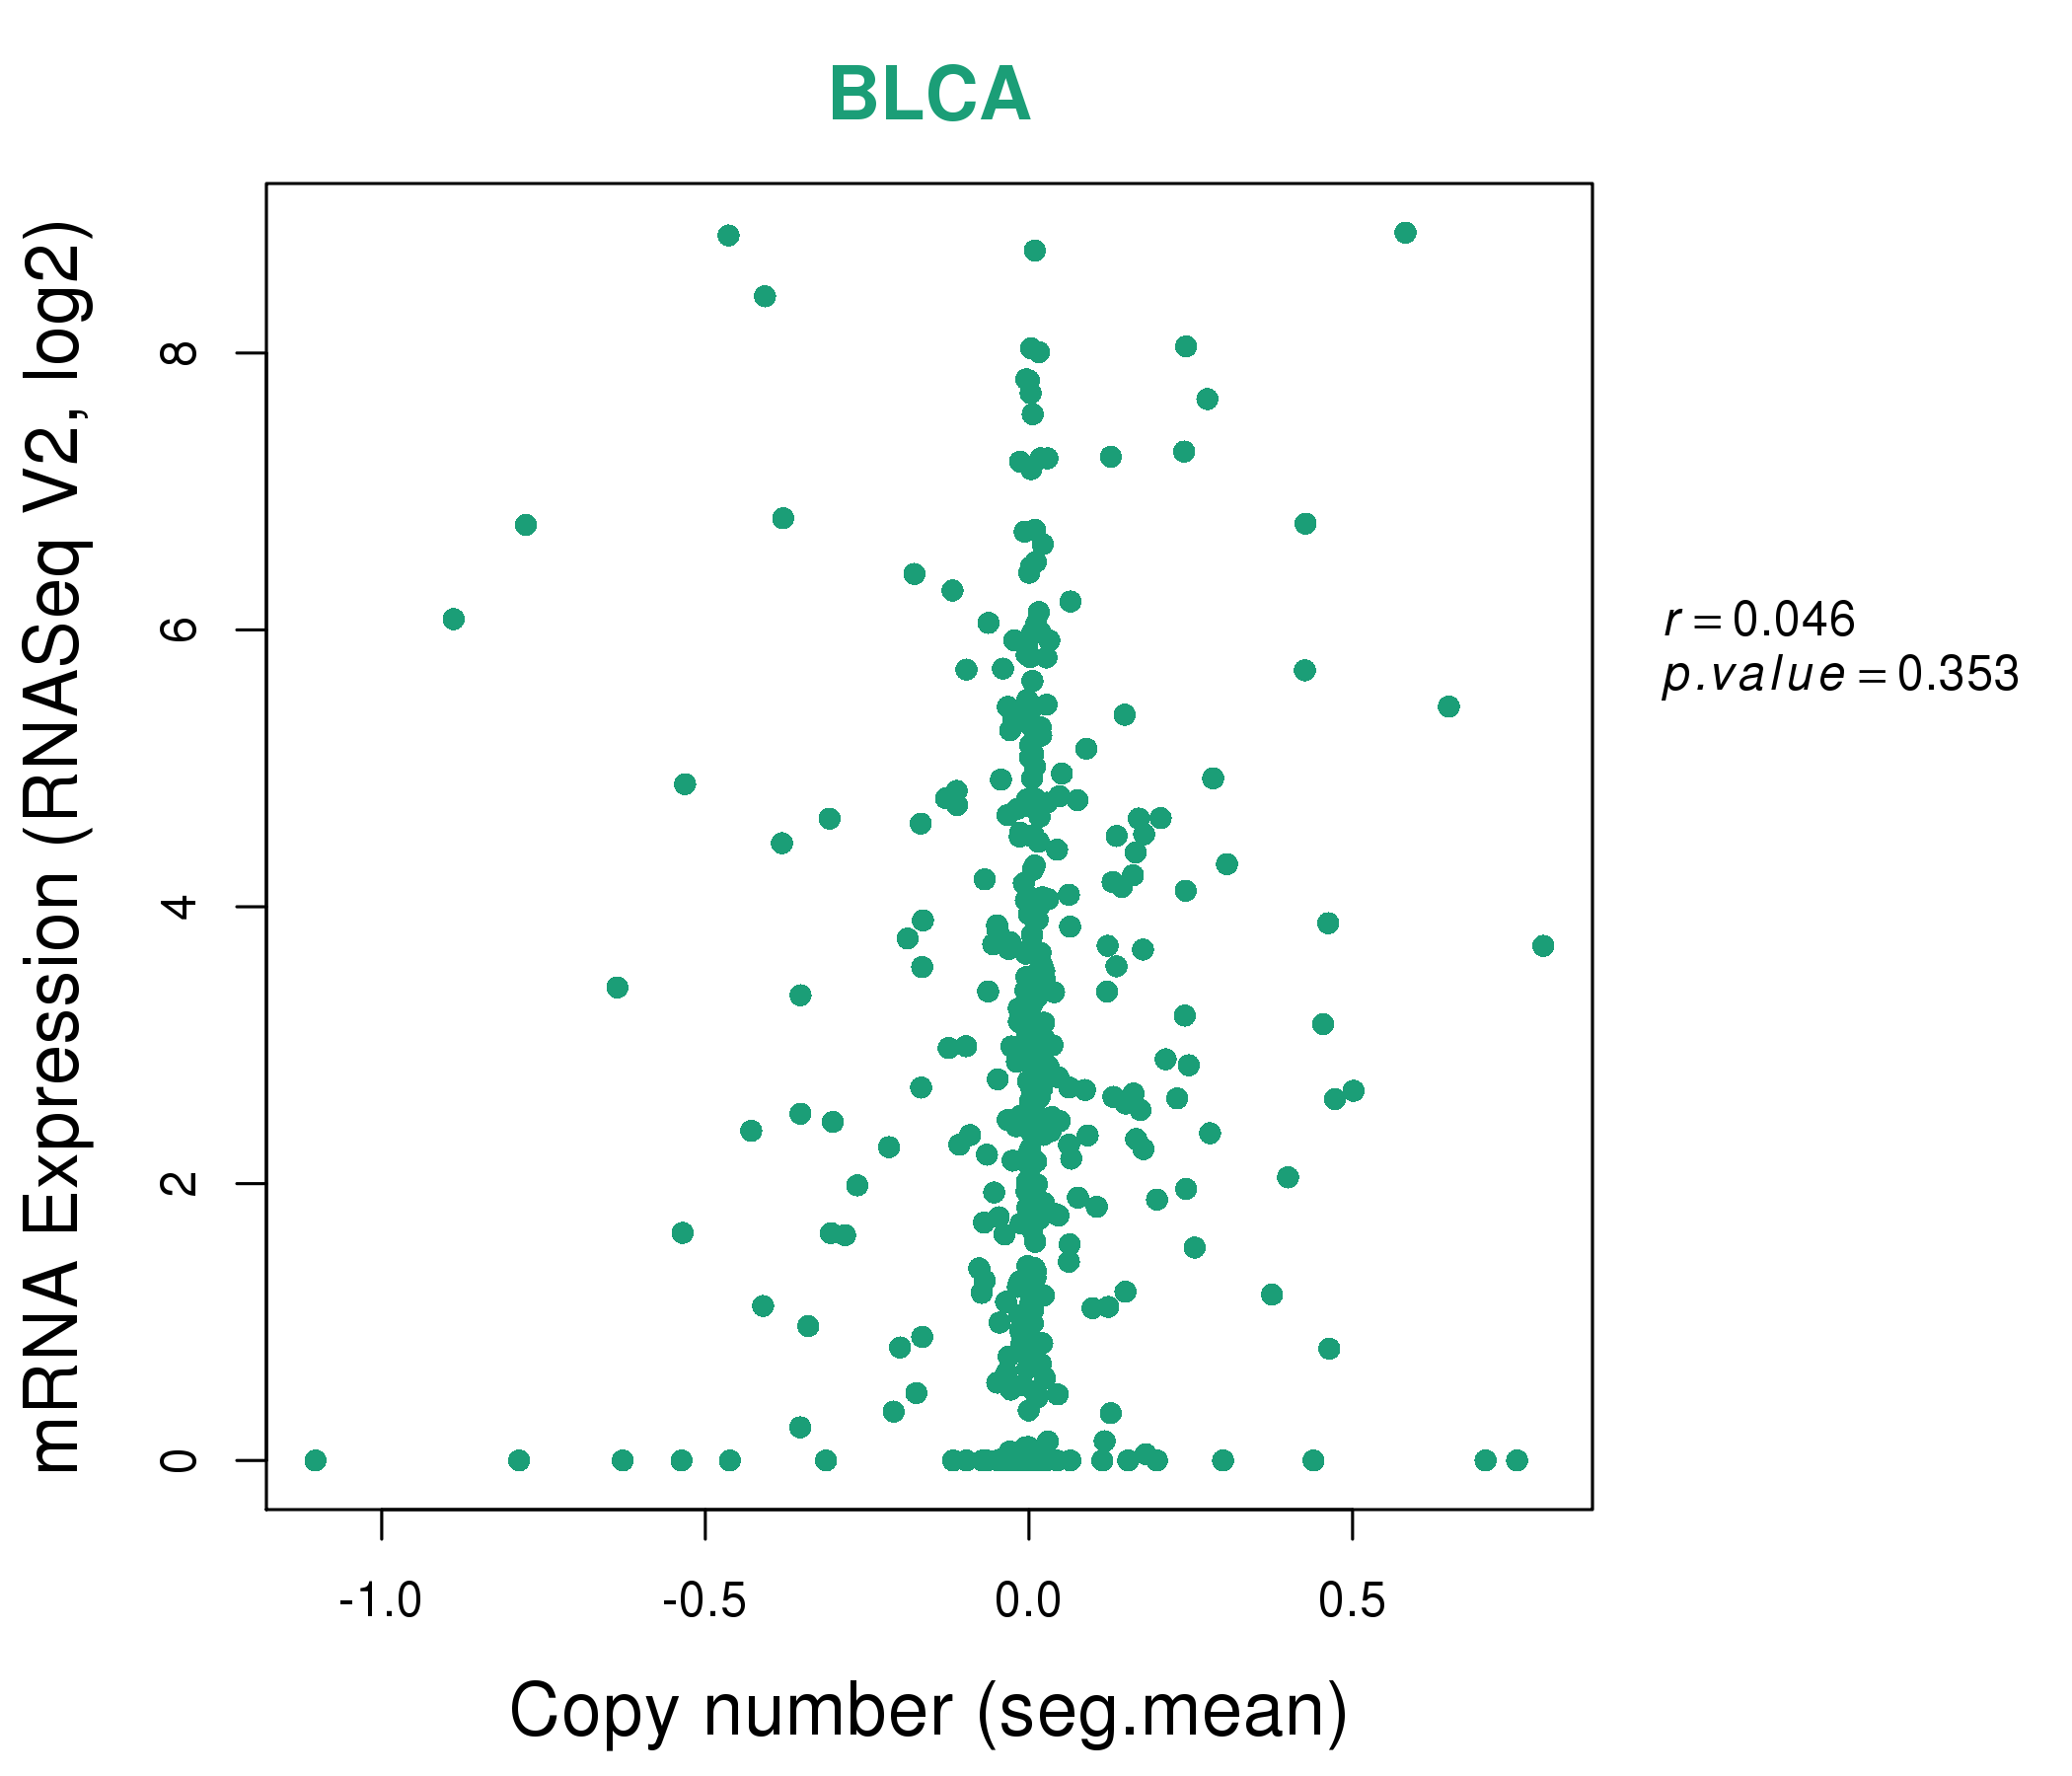
| * This plots show the correlation between CNV and gene expression. |
: Open all plots for all cancer types
 |
|
 |
|

| Top |
| Gene-Gene Network Information |
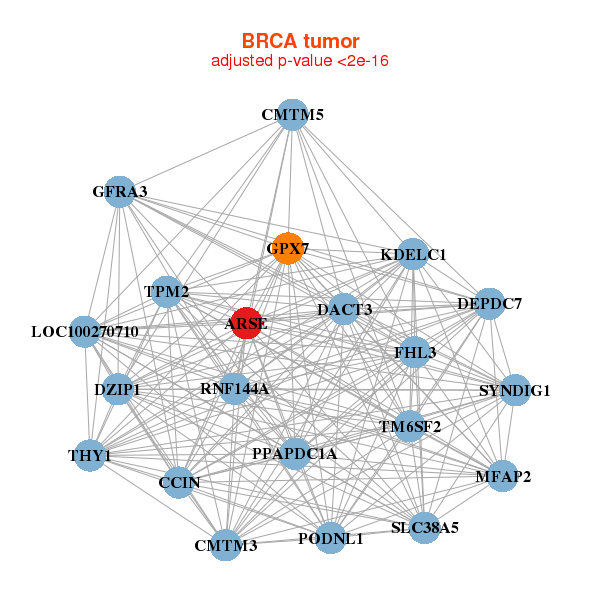
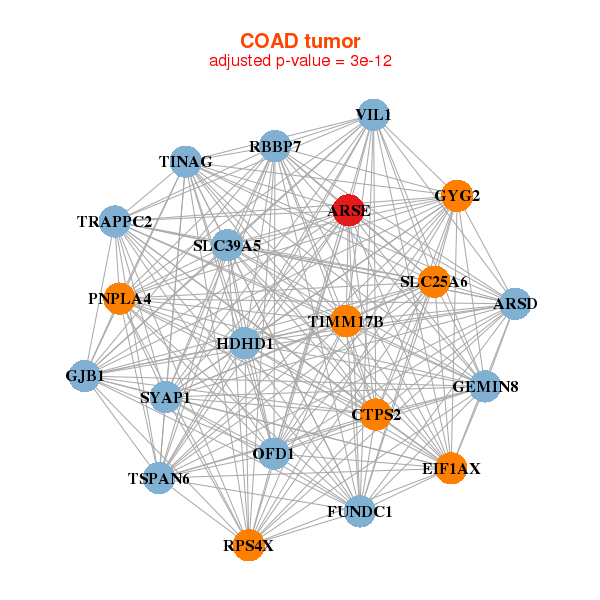
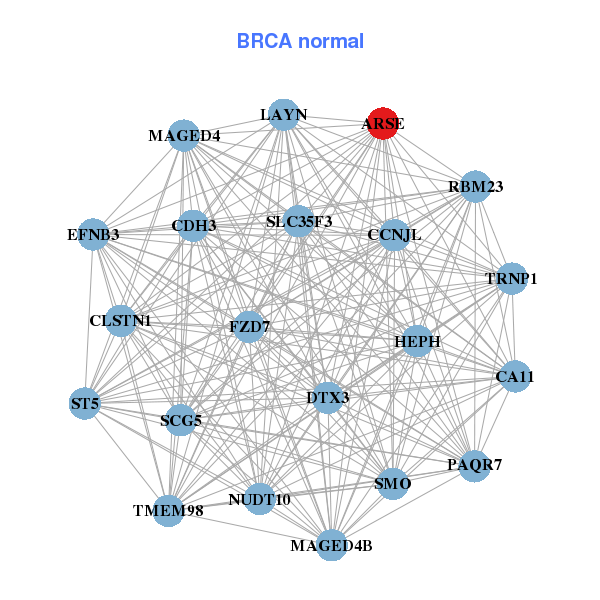
| * Co-Expression network figures were drawn using R package igraph. Only the top 20 genes with the highest correlations were shown. Red circle: input gene, orange circle: cell metabolism gene, sky circle: other gene |
: Open all plots for all cancer types
 |
| ||||
| ARSE,CCIN,CMTM3,CMTM5,DACT3,DEPDC7,DZIP1, FHL3,GFRA3,GPX7,KDELC1,LOC100270710,MFAP2,PODNL1, PPAPDC1A,RNF144A,SLC38A5,THY1,TM6SF2,SYNDIG1,TPM2 | ARSE,CA11,CCNJL,CDH3,CLSTN1,DTX3,EFNB3, FZD7,HEPH,LAYN,MAGED4,MAGED4B,NUDT10,PAQR7, RBM23,SCG5,SLC35F3,SMO,ST5,TMEM98,TRNP1 | ||||
 |
| ||||
| ARSD,ARSE,CTPS2,EIF1AX,FUNDC1,GEMIN8,GJB1, GYG2,HDHD1,OFD1,PNPLA4,RBBP7,RPS4X,SLC25A6, SLC39A5,SYAP1,TIMM17B,TINAG,TRAPPC2,TSPAN6,VIL1 | ARSD,ARSE,CDK16,CHDH,CISH,COX19,GRHL2, HDHD1,KDM5C,LENG9,MNX1,MYCL,PNPLA4,PRKX, QARS,REEP4,REPIN1,ARHGEF28,RPS4X,ZBED9,TRAPPC2 |
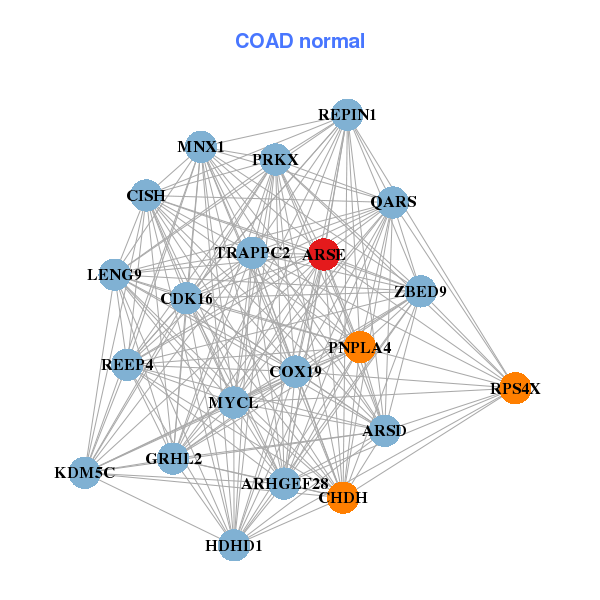
| * Co-Expression network figures were drawn using R package igraph. Only the top 20 genes with the highest correlations were shown. Red circle: input gene, orange circle: cell metabolism gene, sky circle: other gene |
: Open all plots for all cancer types
| Top |
: Open all interacting genes' information including KEGG pathway for all interacting genes from DAVID
| Top |
| Pharmacological Information for ARSE |
| DB Category | DB Name | DB's ID and Url link |
| * Gene Centered Interaction Network. |
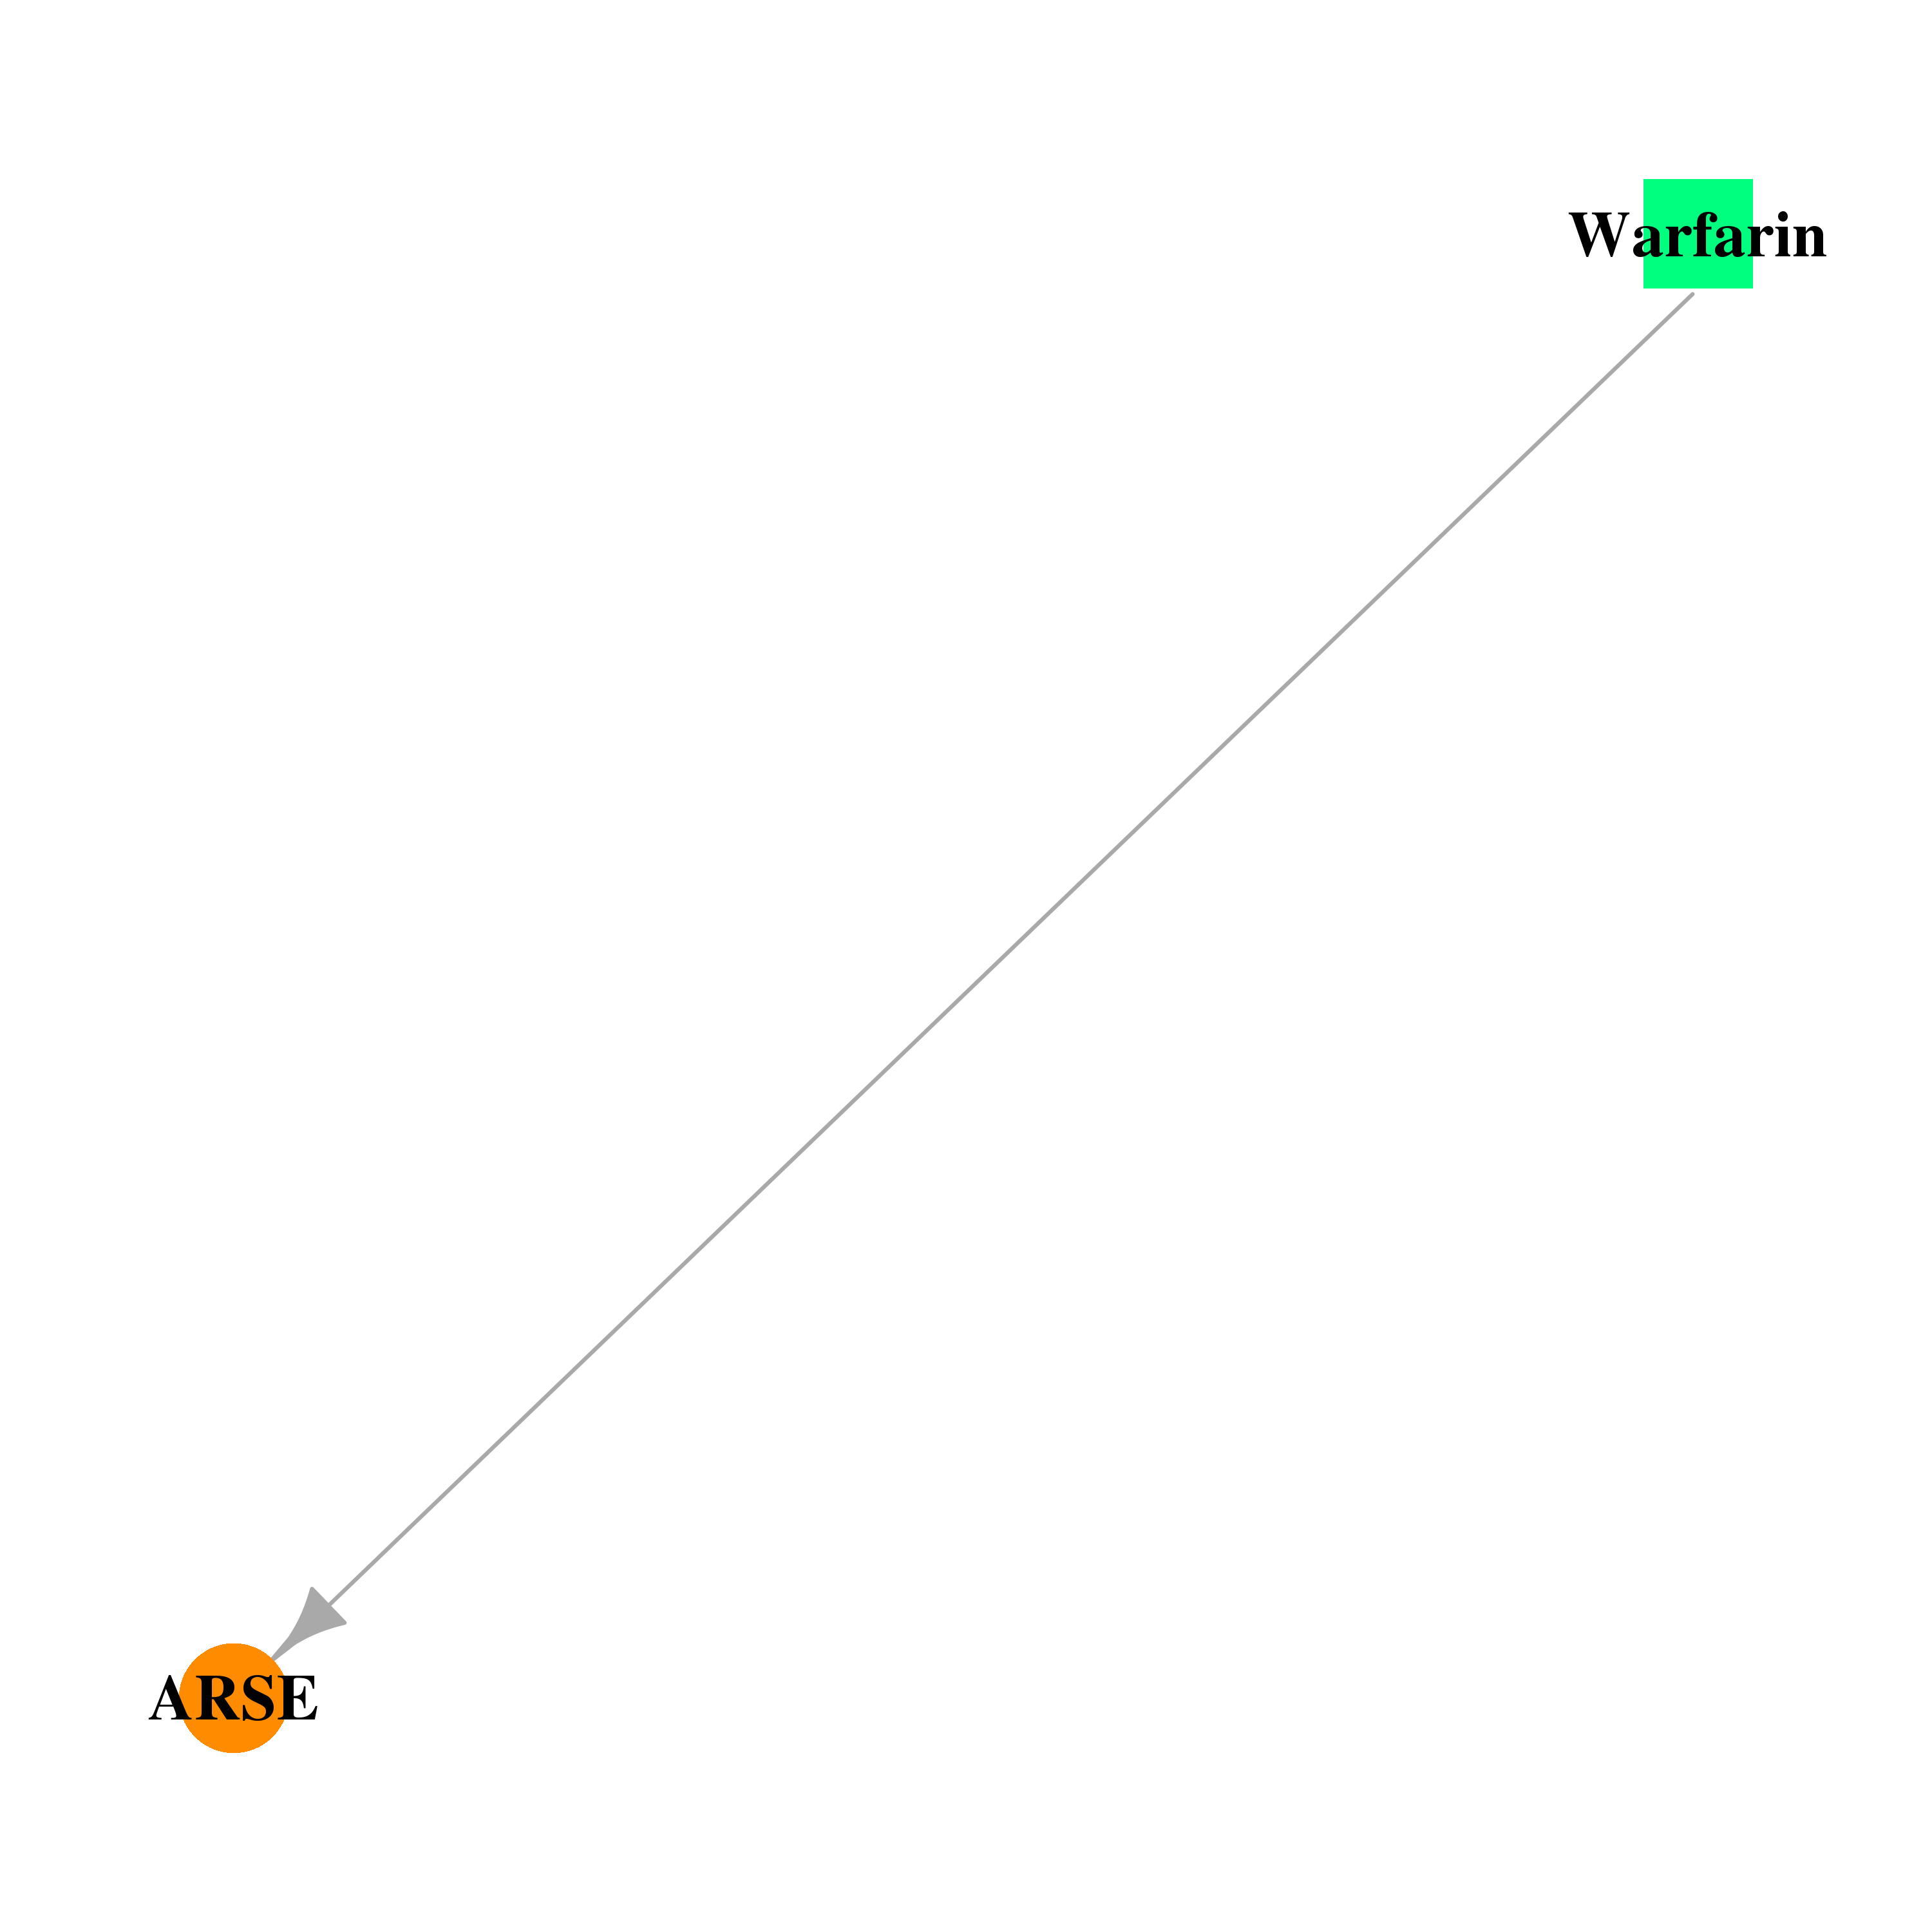 |
| * Drug Centered Interaction Network. |
| DrugBank ID | Target Name | Drug Groups | Generic Name | Drug Centered Network | Drug Structure |
| DB00682 | arylsulfatase E (chondrodysplasia punctata 1) | approved | Warfarin |  | 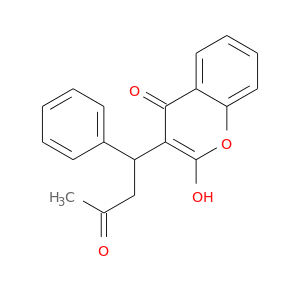 |
| Top |
| Cross referenced IDs for ARSE |
| * We obtained these cross-references from Uniprot database. It covers 150 different DBs, 18 categories. http://www.uniprot.org/help/cross_references_section |
: Open all cross reference information
|
Copyright © 2016-Present - The Univsersity of Texas Health Science Center at Houston @ |