|
||||||||||||||||||||
| |
| Phenotypic Information (metabolism pathway, cancer, disease, phenome) |
| |
| |
| Gene-Gene Network Information: Co-Expression Network, Interacting Genes & KEGG |
| |
|


| Gene Summary for CHST6 |
| Basic gene info. | Gene symbol | CHST6 |
| Gene name | carbohydrate (N-acetylglucosamine 6-O) sulfotransferase 6 | |
| Synonyms | MCDC1 | |
| Cytomap | UCSC genome browser: 16q22 | |
| Genomic location | chr16 :75507021-75528926 | |
| Type of gene | protein-coding | |
| RefGenes | NM_021615.4, | |
| Ensembl id | ENSG00000183196 | |
| Description | C-GlcNAc6STGST4-betaN-acetylglucosamine 6-O-sulfotransferase 5carbohydrate sulfotransferase 6corneal N-acetylglucosamine 6-sulfotransferasecorneal N-acetylglucosamine-6-O-sulfotransferasegalactose/N-acetylglucosamine/N-acetylglucosamine 6-O-sulfotra | |
| Modification date | 20141207 | |
| dbXrefs | MIM : 605294 | |
| HGNC : HGNC | ||
| Ensembl : ENSG00000183196 | ||
| HPRD : 05597 | ||
| Vega : OTTHUMG00000137612 | ||
| Protein | UniProt: go to UniProt's Cross Reference DB Table | |
| Expression | CleanEX: HS_CHST6 | |
| BioGPS: 4166 | ||
| Gene Expression Atlas: ENSG00000183196 | ||
| The Human Protein Atlas: ENSG00000183196 | ||
| Pathway | NCI Pathway Interaction Database: CHST6 | |
| KEGG: CHST6 | ||
| REACTOME: CHST6 | ||
| ConsensusPathDB | ||
| Pathway Commons: CHST6 | ||
| Metabolism | MetaCyc: CHST6 | |
| HUMANCyc: CHST6 | ||
| Regulation | Ensembl's Regulation: ENSG00000183196 | |
| miRBase: chr16 :75,507,021-75,528,926 | ||
| TargetScan: NM_021615 | ||
| cisRED: ENSG00000183196 | ||
| Context | iHOP: CHST6 | |
| cancer metabolism search in PubMed: CHST6 | ||
| UCL Cancer Institute: CHST6 | ||
| Assigned class in ccmGDB | C | |
| Top |
| Phenotypic Information for CHST6(metabolism pathway, cancer, disease, phenome) |
| Cancer | CGAP: CHST6 |
| Familial Cancer Database: CHST6 | |
| * This gene is included in those cancer gene databases. |
|
|
|
|
|
|
| ||||||||||||||
Oncogene 1 | Significant driver gene in | |||||||||||||||||||
| cf) number; DB name 1 Oncogene; http://nar.oxfordjournals.org/content/35/suppl_1/D721.long, 2 Tumor Suppressor gene; https://bioinfo.uth.edu/TSGene/, 3 Cancer Gene Census; http://www.nature.com/nrc/journal/v4/n3/abs/nrc1299.html, 4 CancerGenes; http://nar.oxfordjournals.org/content/35/suppl_1/D721.long, 5 Network of Cancer Gene; http://ncg.kcl.ac.uk/index.php, 1Therapeutic Vulnerabilities in Cancer; http://cbio.mskcc.org/cancergenomics/statius/ |
| REACTOME_METABOLISM_OF_CARBOHYDRATES | |
| OMIM | |
| Orphanet | |
| Disease | KEGG Disease: CHST6 |
| MedGen: CHST6 (Human Medical Genetics with Condition) | |
| ClinVar: CHST6 | |
| Phenotype | MGI: CHST6 (International Mouse Phenotyping Consortium) |
| PhenomicDB: CHST6 | |
| Mutations for CHST6 |
| * Under tables are showing count per each tissue to give us broad intuition about tissue specific mutation patterns.You can go to the detailed page for each mutation database's web site. |
| There's no structural variation information in COSMIC data for this gene. |
| * From mRNA Sanger sequences, Chitars2.0 arranged chimeric transcripts. This table shows CHST6 related fusion information. |
| ID | Head Gene | Tail Gene | Accession | Gene_a | qStart_a | qEnd_a | Chromosome_a | tStart_a | tEnd_a | Gene_a | qStart_a | qEnd_a | Chromosome_a | tStart_a | tEnd_a |
| AF219990 | CHST6 | 1 | 2069 | 16 | 75512350 | 75529282 | COTL1 | 2070 | 2521 | 16 | 84599202 | 84599653 | |
| Top |
| There's no copy number variation information in COSMIC data for this gene. |
| Top |
|
 |
| Top |
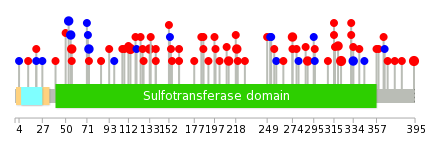
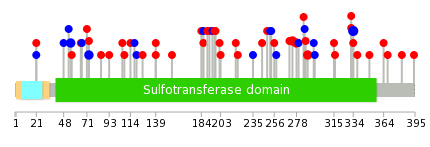
| Stat. for Non-Synonymous SNVs (# total SNVs=56) | (# total SNVs=13) |
 |  |
(# total SNVs=0) | (# total SNVs=0) |
| Top |
| * When you move the cursor on each content, you can see more deailed mutation information on the Tooltip. Those are primary_site,primary_histology,mutation(aa),pubmedID. |
| GRCh37 position | Mutation(aa) | Unique sampleID count |
| chr16:75513386-75513386 | p.R114H | 3 |
| chr16:75513561-75513561 | p.V56M | 3 |
| chr16:75512546-75512546 | p.R394Q | 3 |
| chr16:75512762-75512762 | p.S322L | 3 |
| chr16:75512770-75512770 | p.F319L | 2 |
| chr16:75513071-75513071 | p.A219V | 2 |
| chr16:75512905-75512905 | p.E274D | 2 |
| chr16:75513508-75513508 | p.A73A | 2 |
| chr16:75513243-75513243 | p.R162W | 2 |
| chr16:75513095-75513095 | p.R211Q | 2 |
| Top |
|
 |
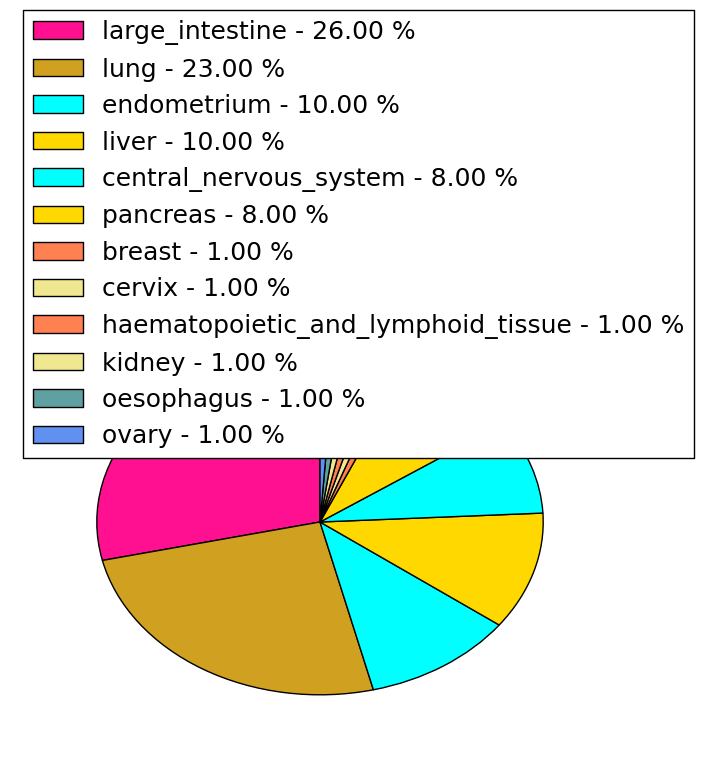
| Point Mutation/ Tissue ID | 1 | 2 | 3 | 4 | 5 | 6 | 7 | 8 | 9 | 10 | 11 | 12 | 13 | 14 | 15 | 16 | 17 | 18 | 19 | 20 |
| # sample | 3 | 1 | 8 | 2 | 12 | 1 | 7 | 5 | 1 | 1 | 7 | 10 | 7 | |||||||
| # mutation | 3 | 1 | 7 | 2 | 12 | 1 | 7 | 5 | 1 | 1 | 7 | 11 | 10 | |||||||
| nonsynonymous SNV | 1 | 1 | 5 | 2 | 6 | 1 | 5 | 5 | 1 | 1 | 4 | 9 | 6 | |||||||
| synonymous SNV | 2 | 2 | 6 | 2 | 3 | 2 | 4 |
| cf) Tissue ID; Tissue type (1; BLCA[Bladder Urothelial Carcinoma], 2; BRCA[Breast invasive carcinoma], 3; CESC[Cervical squamous cell carcinoma and endocervical adenocarcinoma], 4; COAD[Colon adenocarcinoma], 5; GBM[Glioblastoma multiforme], 6; Glioma Low Grade, 7; HNSC[Head and Neck squamous cell carcinoma], 8; KICH[Kidney Chromophobe], 9; KIRC[Kidney renal clear cell carcinoma], 10; KIRP[Kidney renal papillary cell carcinoma], 11; LAML[Acute Myeloid Leukemia], 12; LUAD[Lung adenocarcinoma], 13; LUSC[Lung squamous cell carcinoma], 14; OV[Ovarian serous cystadenocarcinoma ], 15; PAAD[Pancreatic adenocarcinoma], 16; PRAD[Prostate adenocarcinoma], 17; SKCM[Skin Cutaneous Melanoma], 18:STAD[Stomach adenocarcinoma], 19:THCA[Thyroid carcinoma], 20:UCEC[Uterine Corpus Endometrial Carcinoma]) |
| Top |
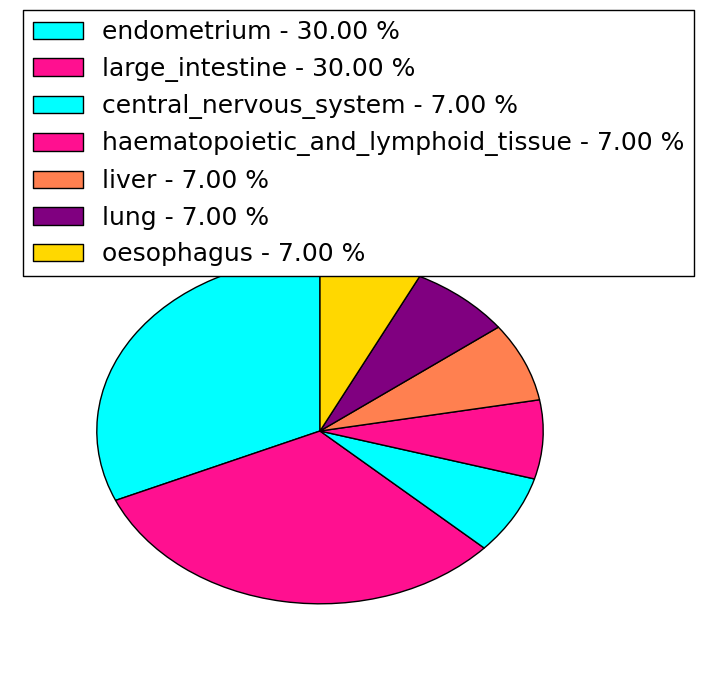
| * We represented just top 10 SNVs. When you move the cursor on each content, you can see more deailed mutation information on the Tooltip. Those are primary_site, primary_histology, mutation(aa), pubmedID. |
| Genomic Position | Mutation(aa) | Unique sampleID count |
| chr16:75512725 | p.R334R | 3 |
| chr16:75512895 | p.A332V | 2 |
| chr16:75512732 | p.F55F | 2 |
| chr16:75512907 | p.A289T | 2 |
| chr16:75513508 | p.R278W | 2 |
| chr16:75512862 | p.E274K | 2 |
| chr16:75513562 | p.A73A | 2 |
| chr16:75512678 | p.A256T | 1 |
| chr16:75513159 | p.P186T | 1 |
| chr16:75512869 | p.V66V | 1 |
| * Copy number data were extracted from TCGA using R package TCGA-Assembler. The URLs of all public data files on TCGA DCC data server were gathered on Jan-05-2015. Function ProcessCNAData in TCGA-Assembler package was used to obtain gene-level copy number value which is calculated as the average copy number of the genomic region of a gene. |
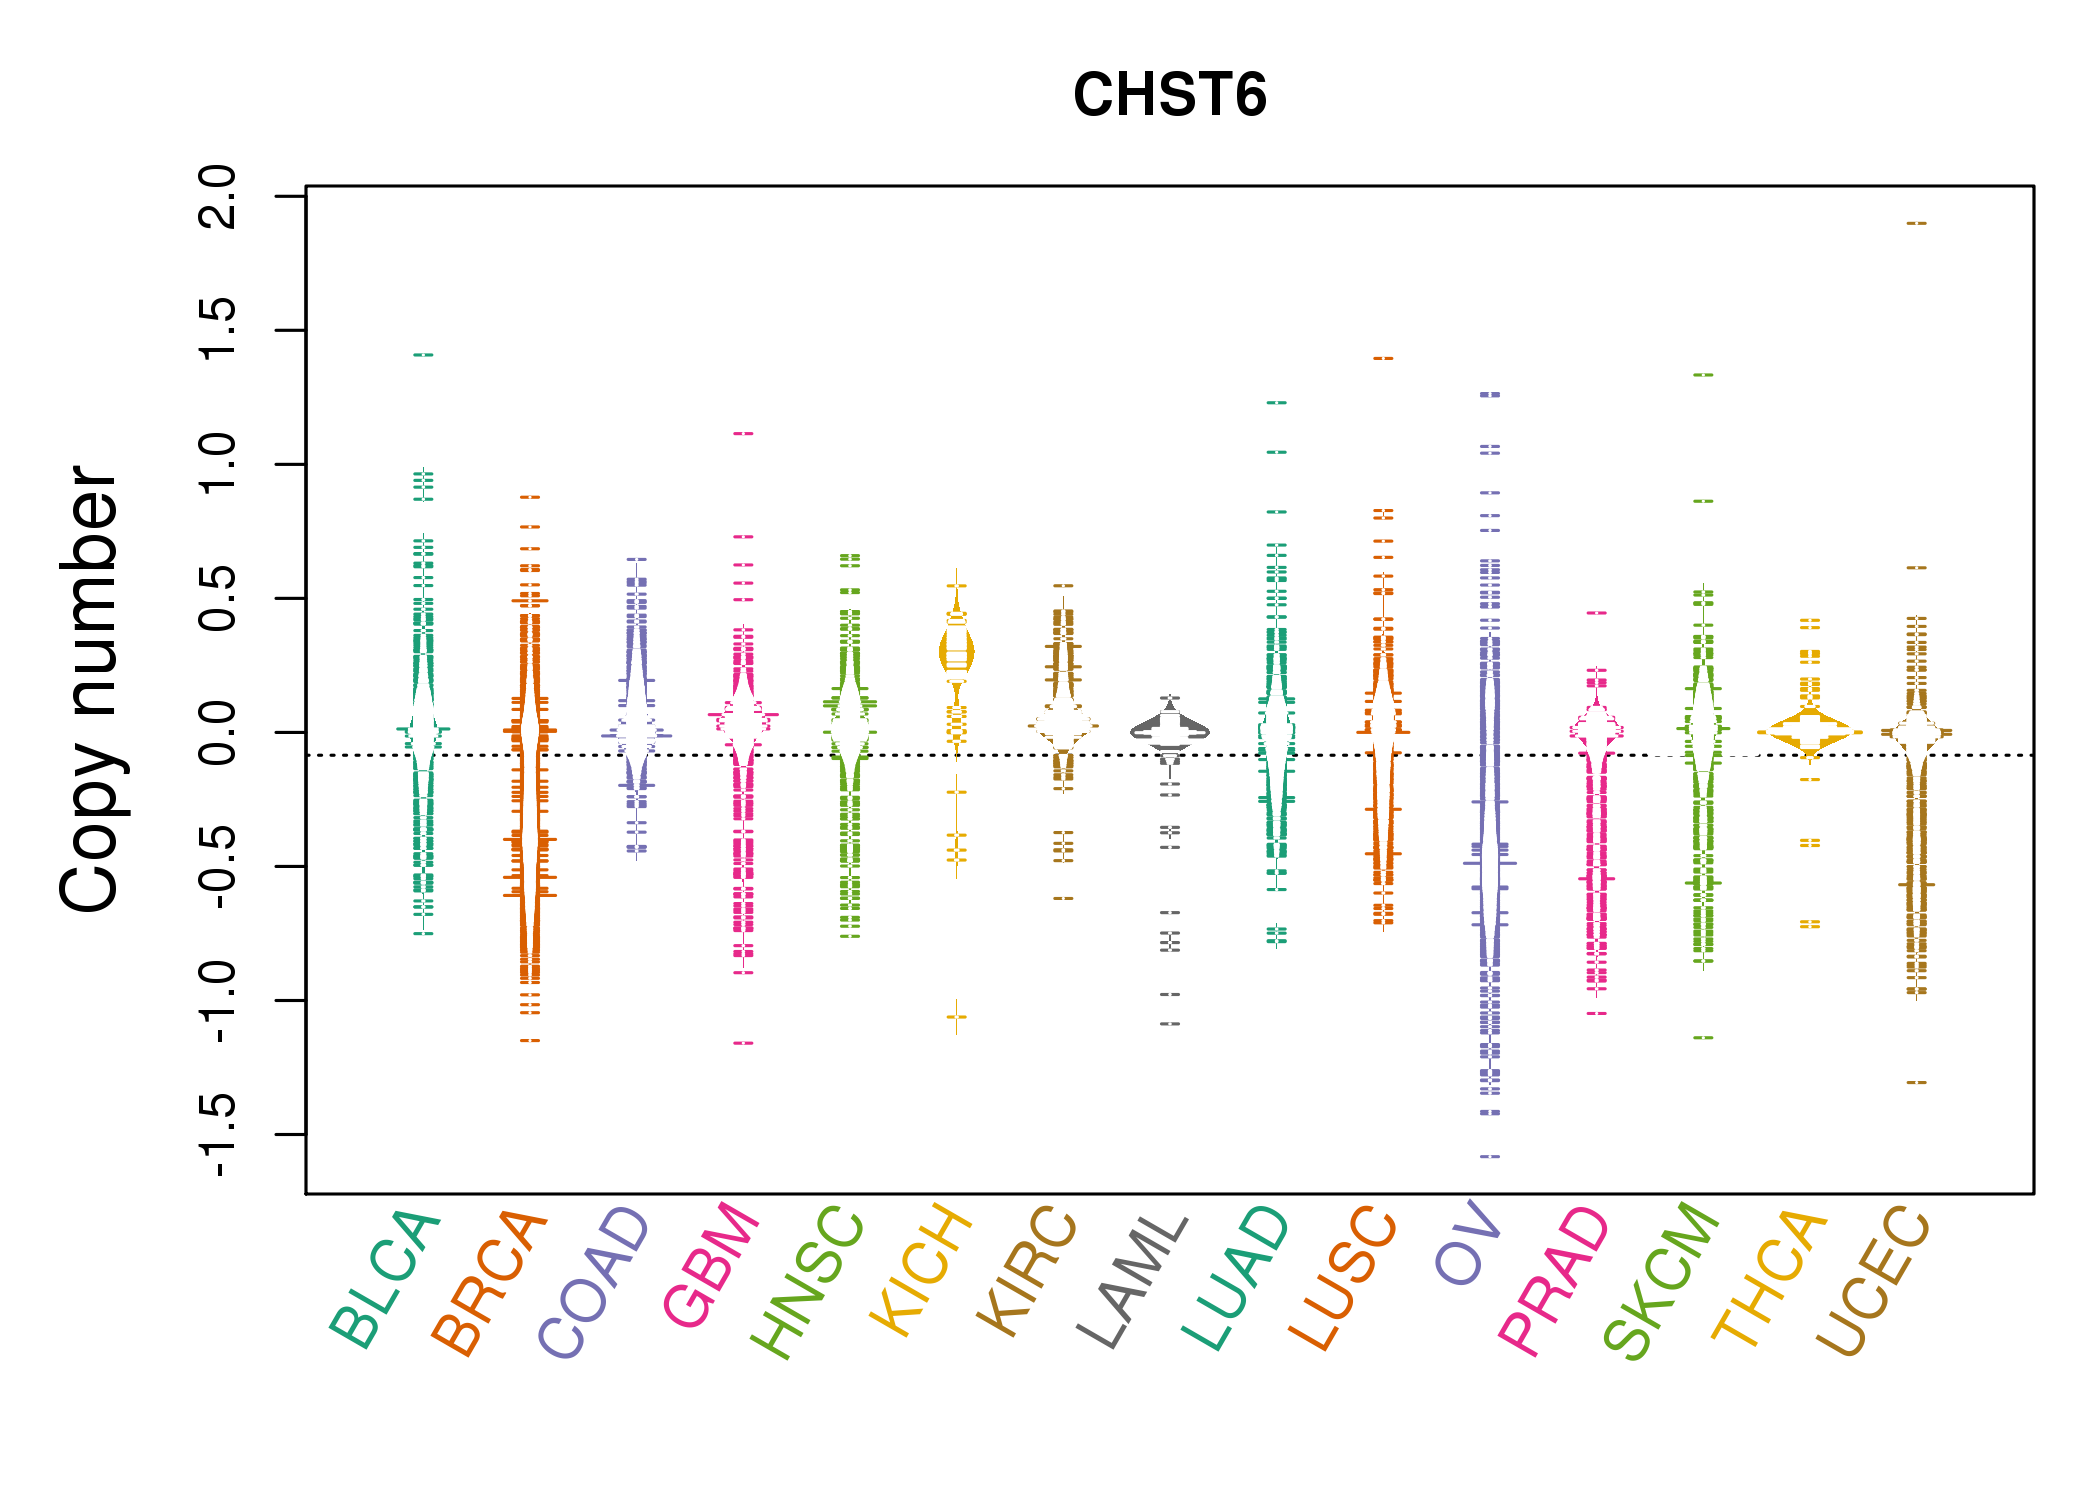 |
| cf) Tissue ID[Tissue type]: BLCA[Bladder Urothelial Carcinoma], BRCA[Breast invasive carcinoma], CESC[Cervical squamous cell carcinoma and endocervical adenocarcinoma], COAD[Colon adenocarcinoma], GBM[Glioblastoma multiforme], Glioma Low Grade, HNSC[Head and Neck squamous cell carcinoma], KICH[Kidney Chromophobe], KIRC[Kidney renal clear cell carcinoma], KIRP[Kidney renal papillary cell carcinoma], LAML[Acute Myeloid Leukemia], LUAD[Lung adenocarcinoma], LUSC[Lung squamous cell carcinoma], OV[Ovarian serous cystadenocarcinoma ], PAAD[Pancreatic adenocarcinoma], PRAD[Prostate adenocarcinoma], SKCM[Skin Cutaneous Melanoma], STAD[Stomach adenocarcinoma], THCA[Thyroid carcinoma], UCEC[Uterine Corpus Endometrial Carcinoma] |
| Top |
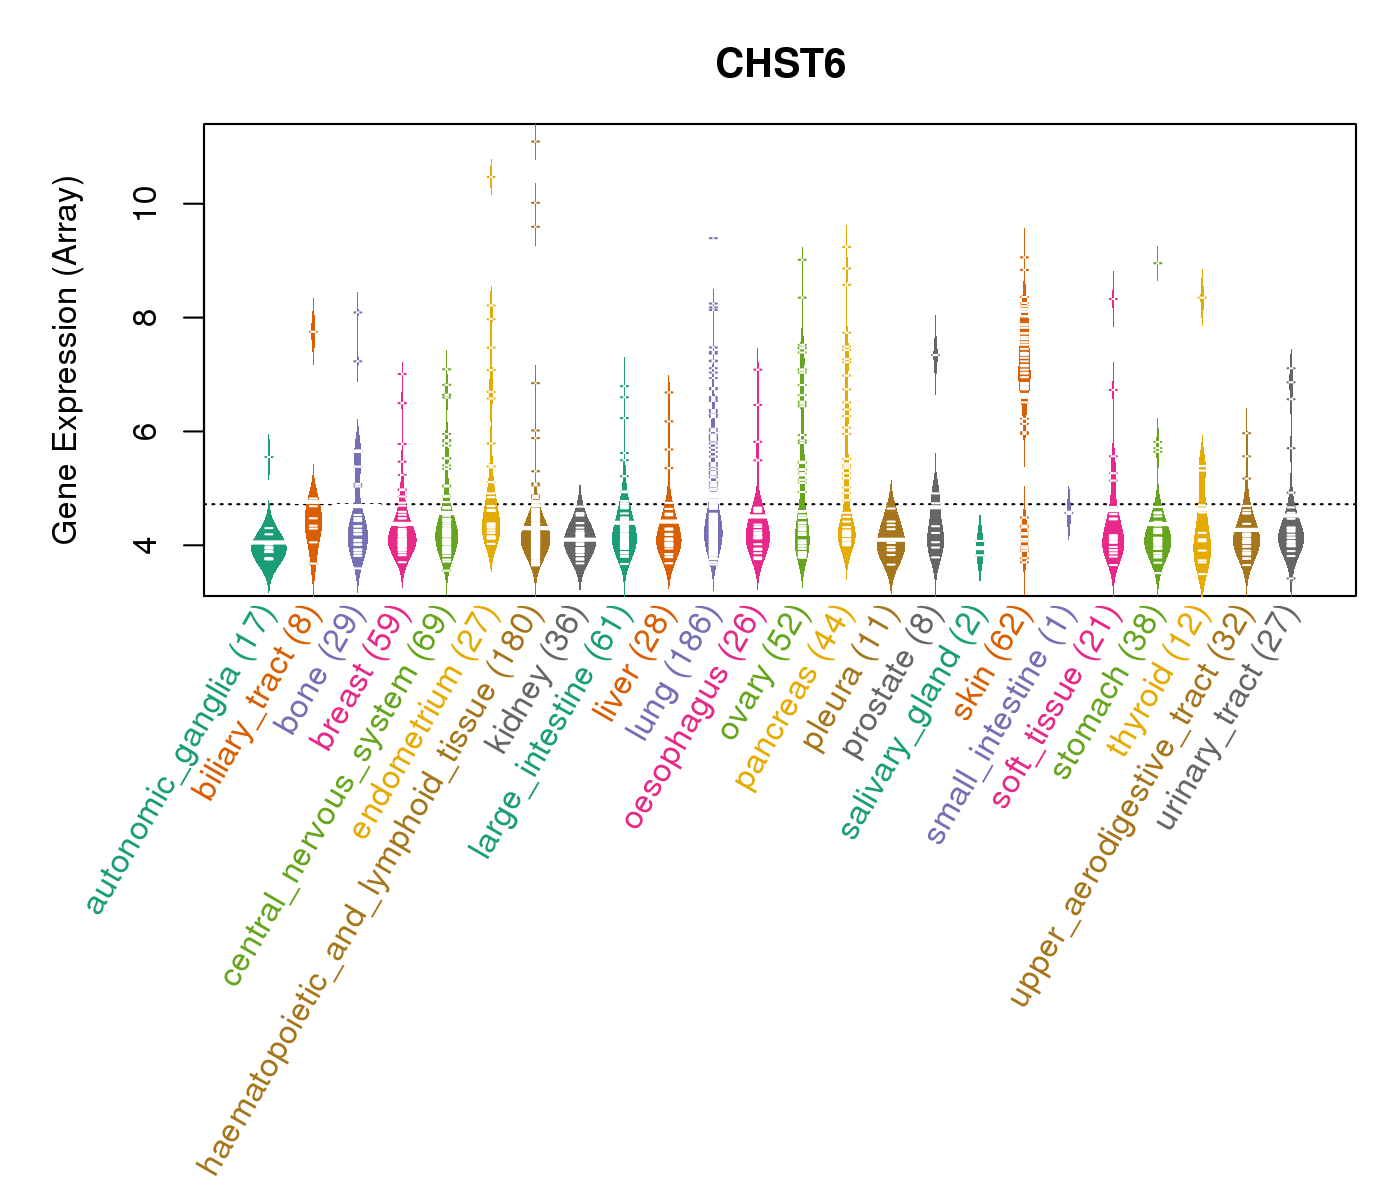
| Gene Expression for CHST6 |
| * CCLE gene expression data were extracted from CCLE_Expression_Entrez_2012-10-18.res: Gene-centric RMA-normalized mRNA expression data. |
 |
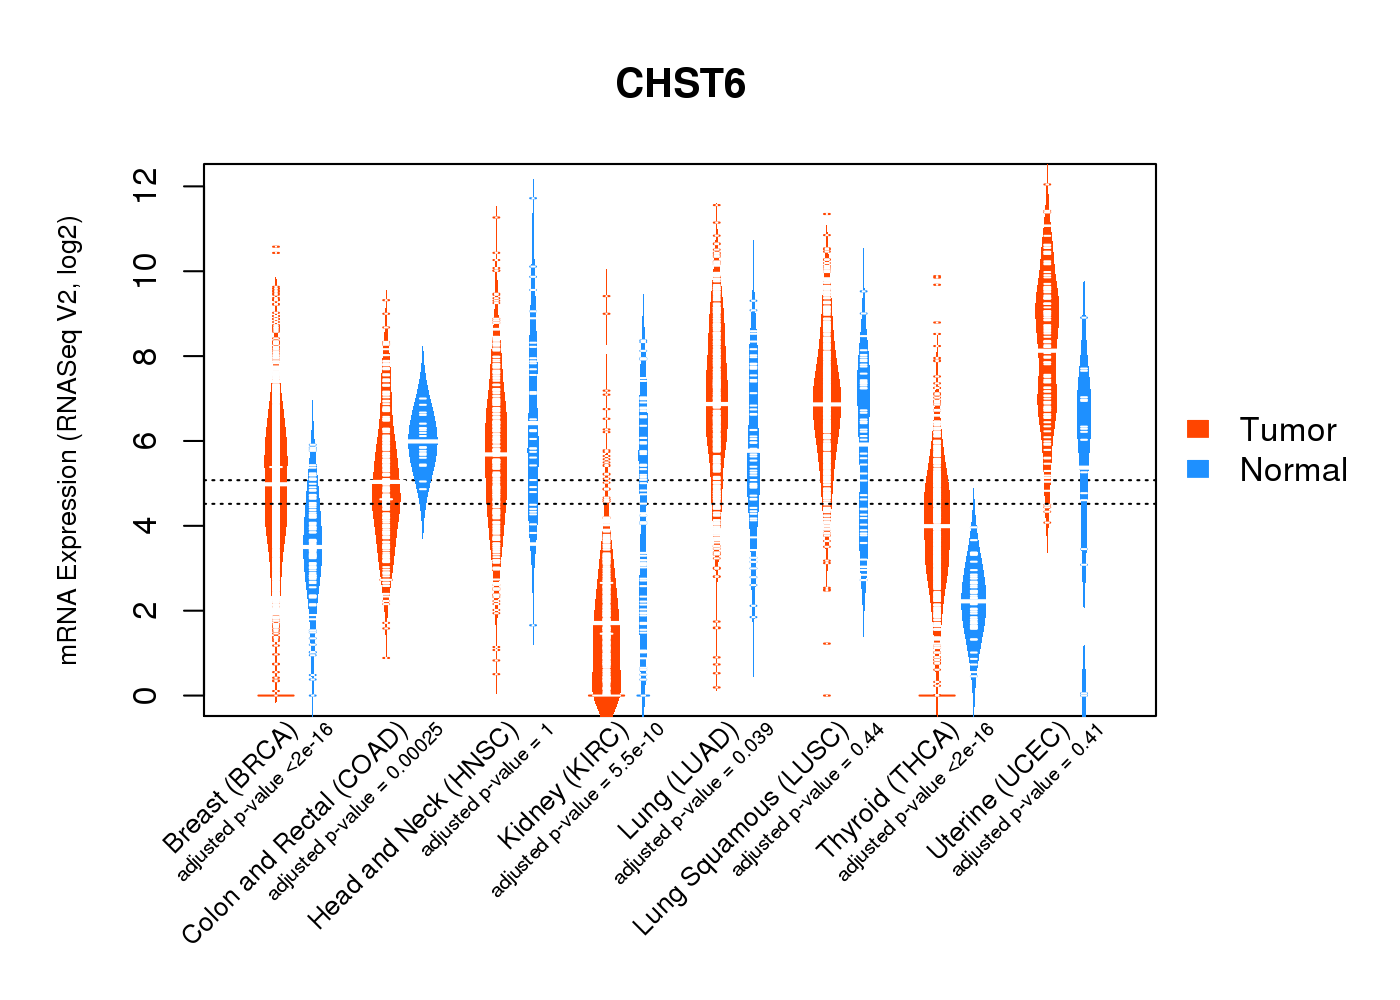
| * Normalized gene expression data of RNASeqV2 was extracted from TCGA using R package TCGA-Assembler. The URLs of all public data files on TCGA DCC data server were gathered at Jan-05-2015. Only eight cancer types have enough normal control samples for differential expression analysis. (t test, adjusted p<0.05 (using Benjamini-Hochberg FDR)) |
 |
| Top |
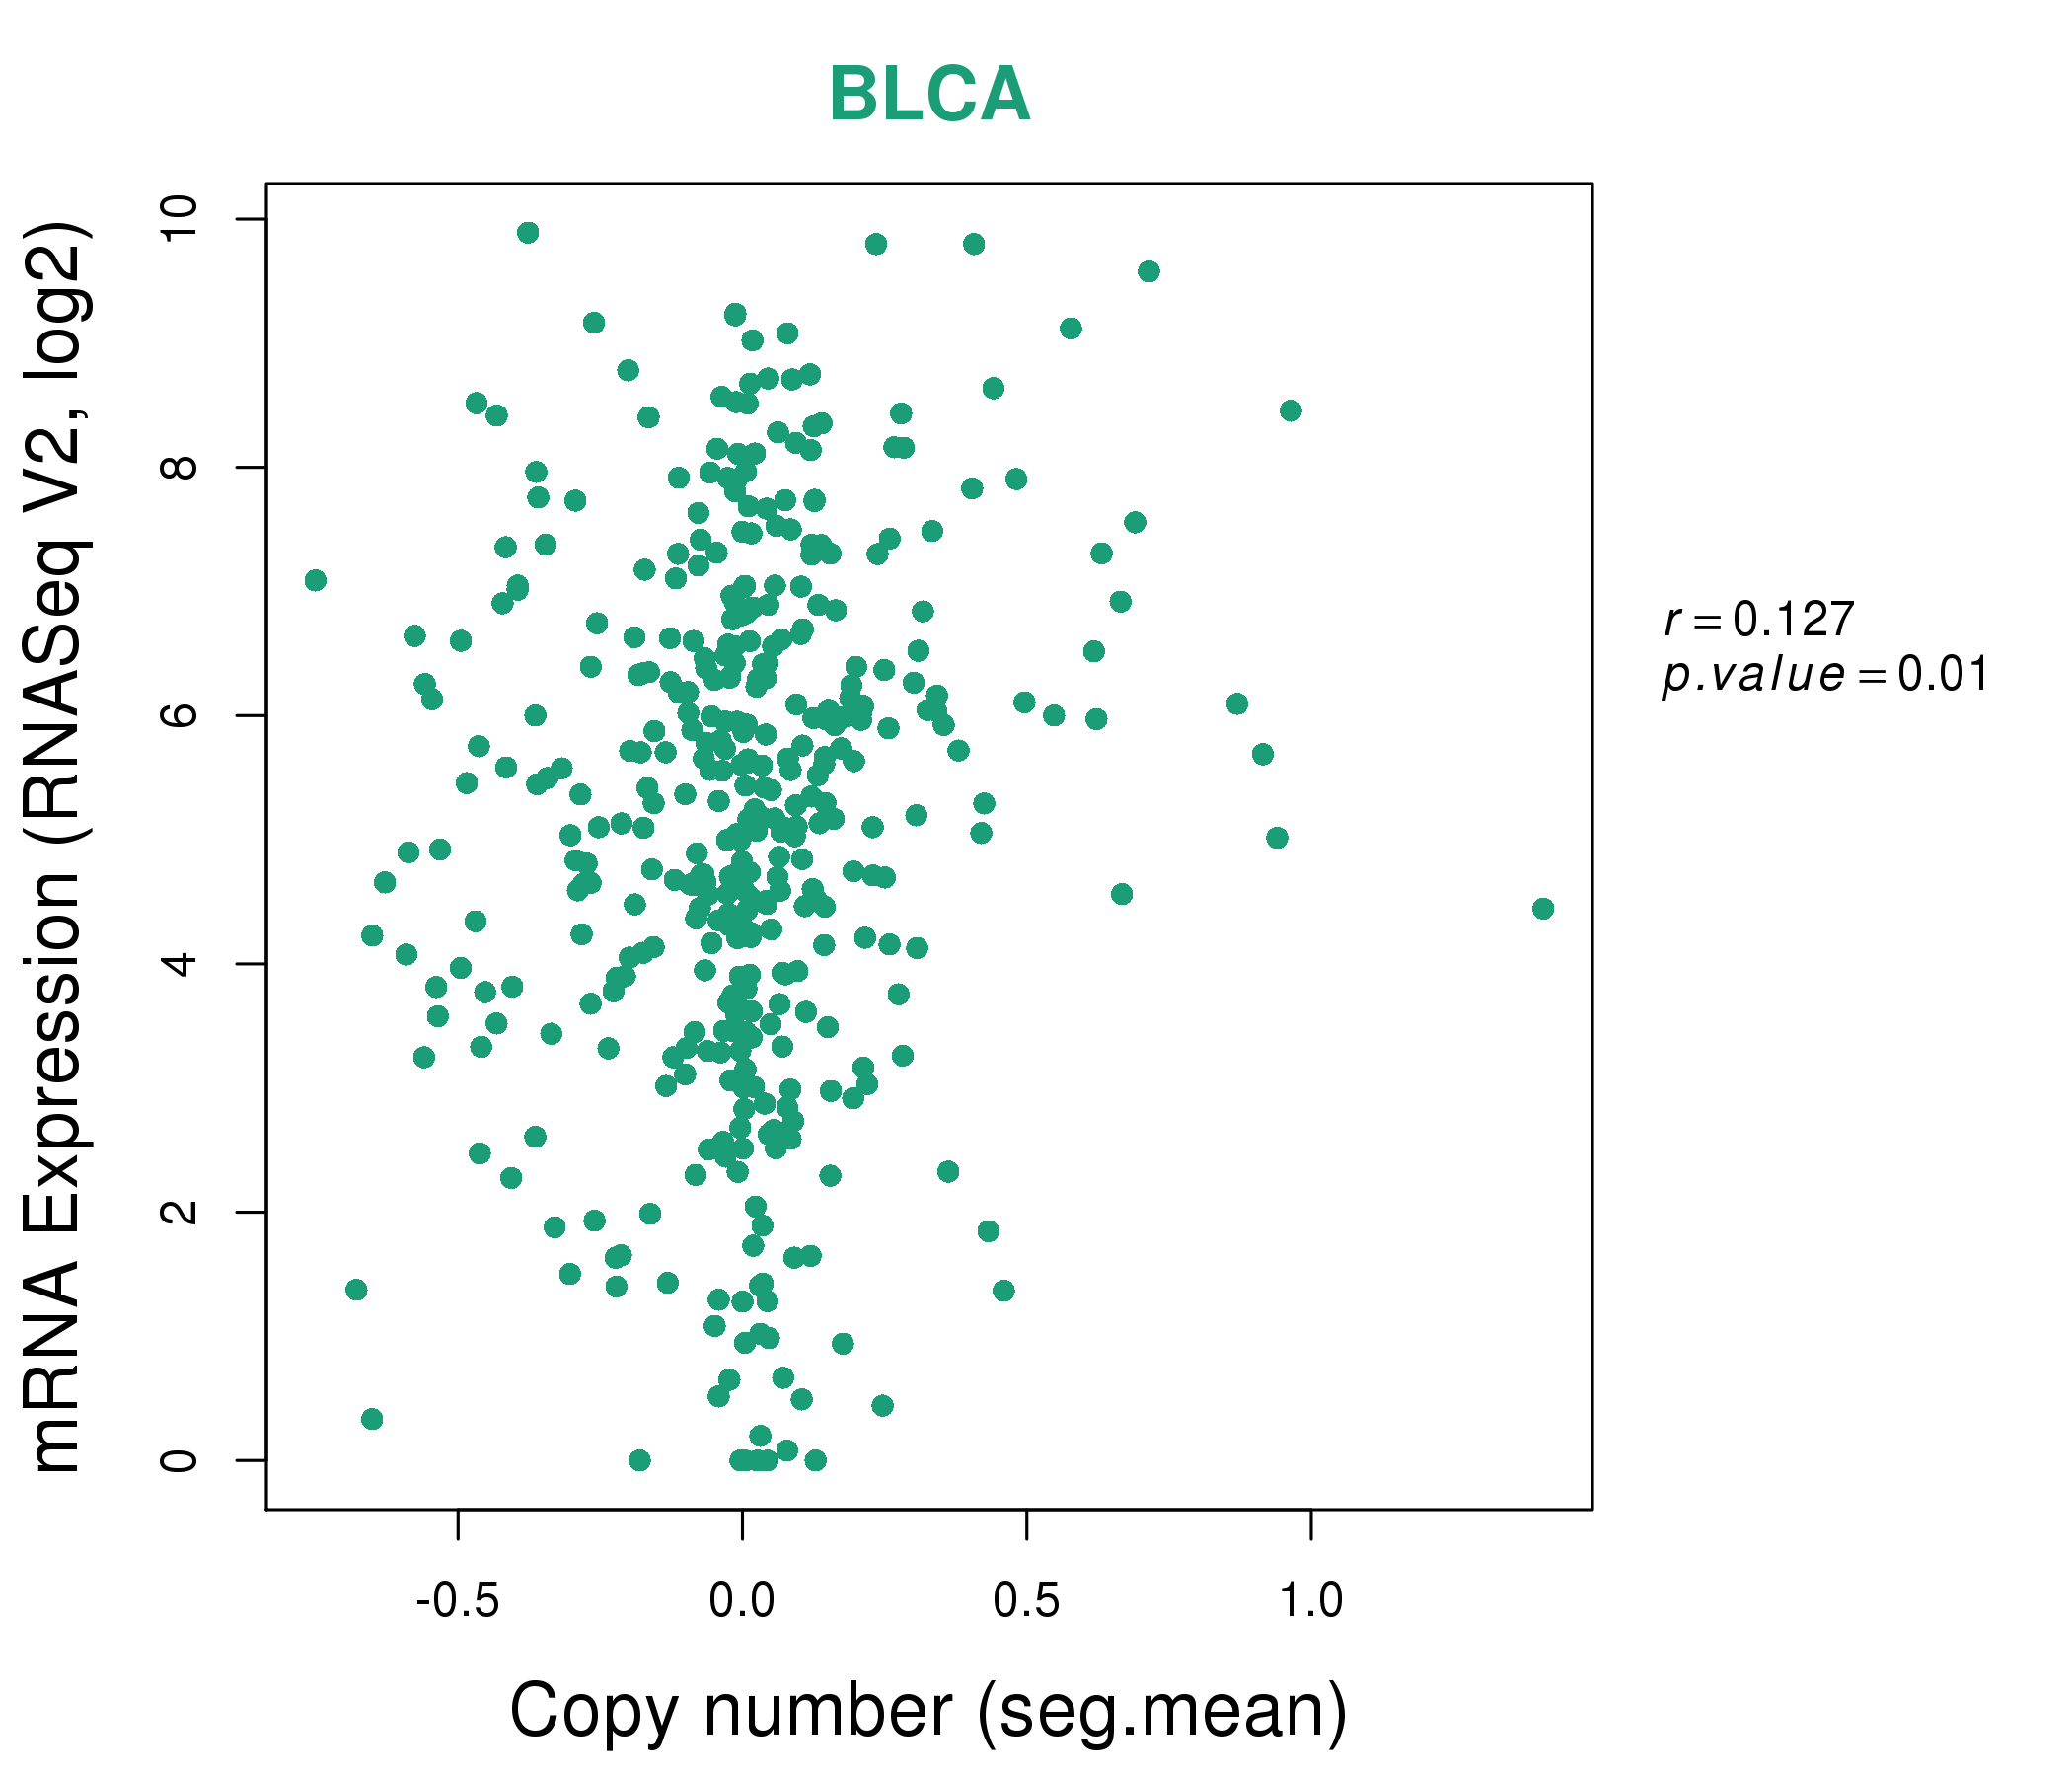
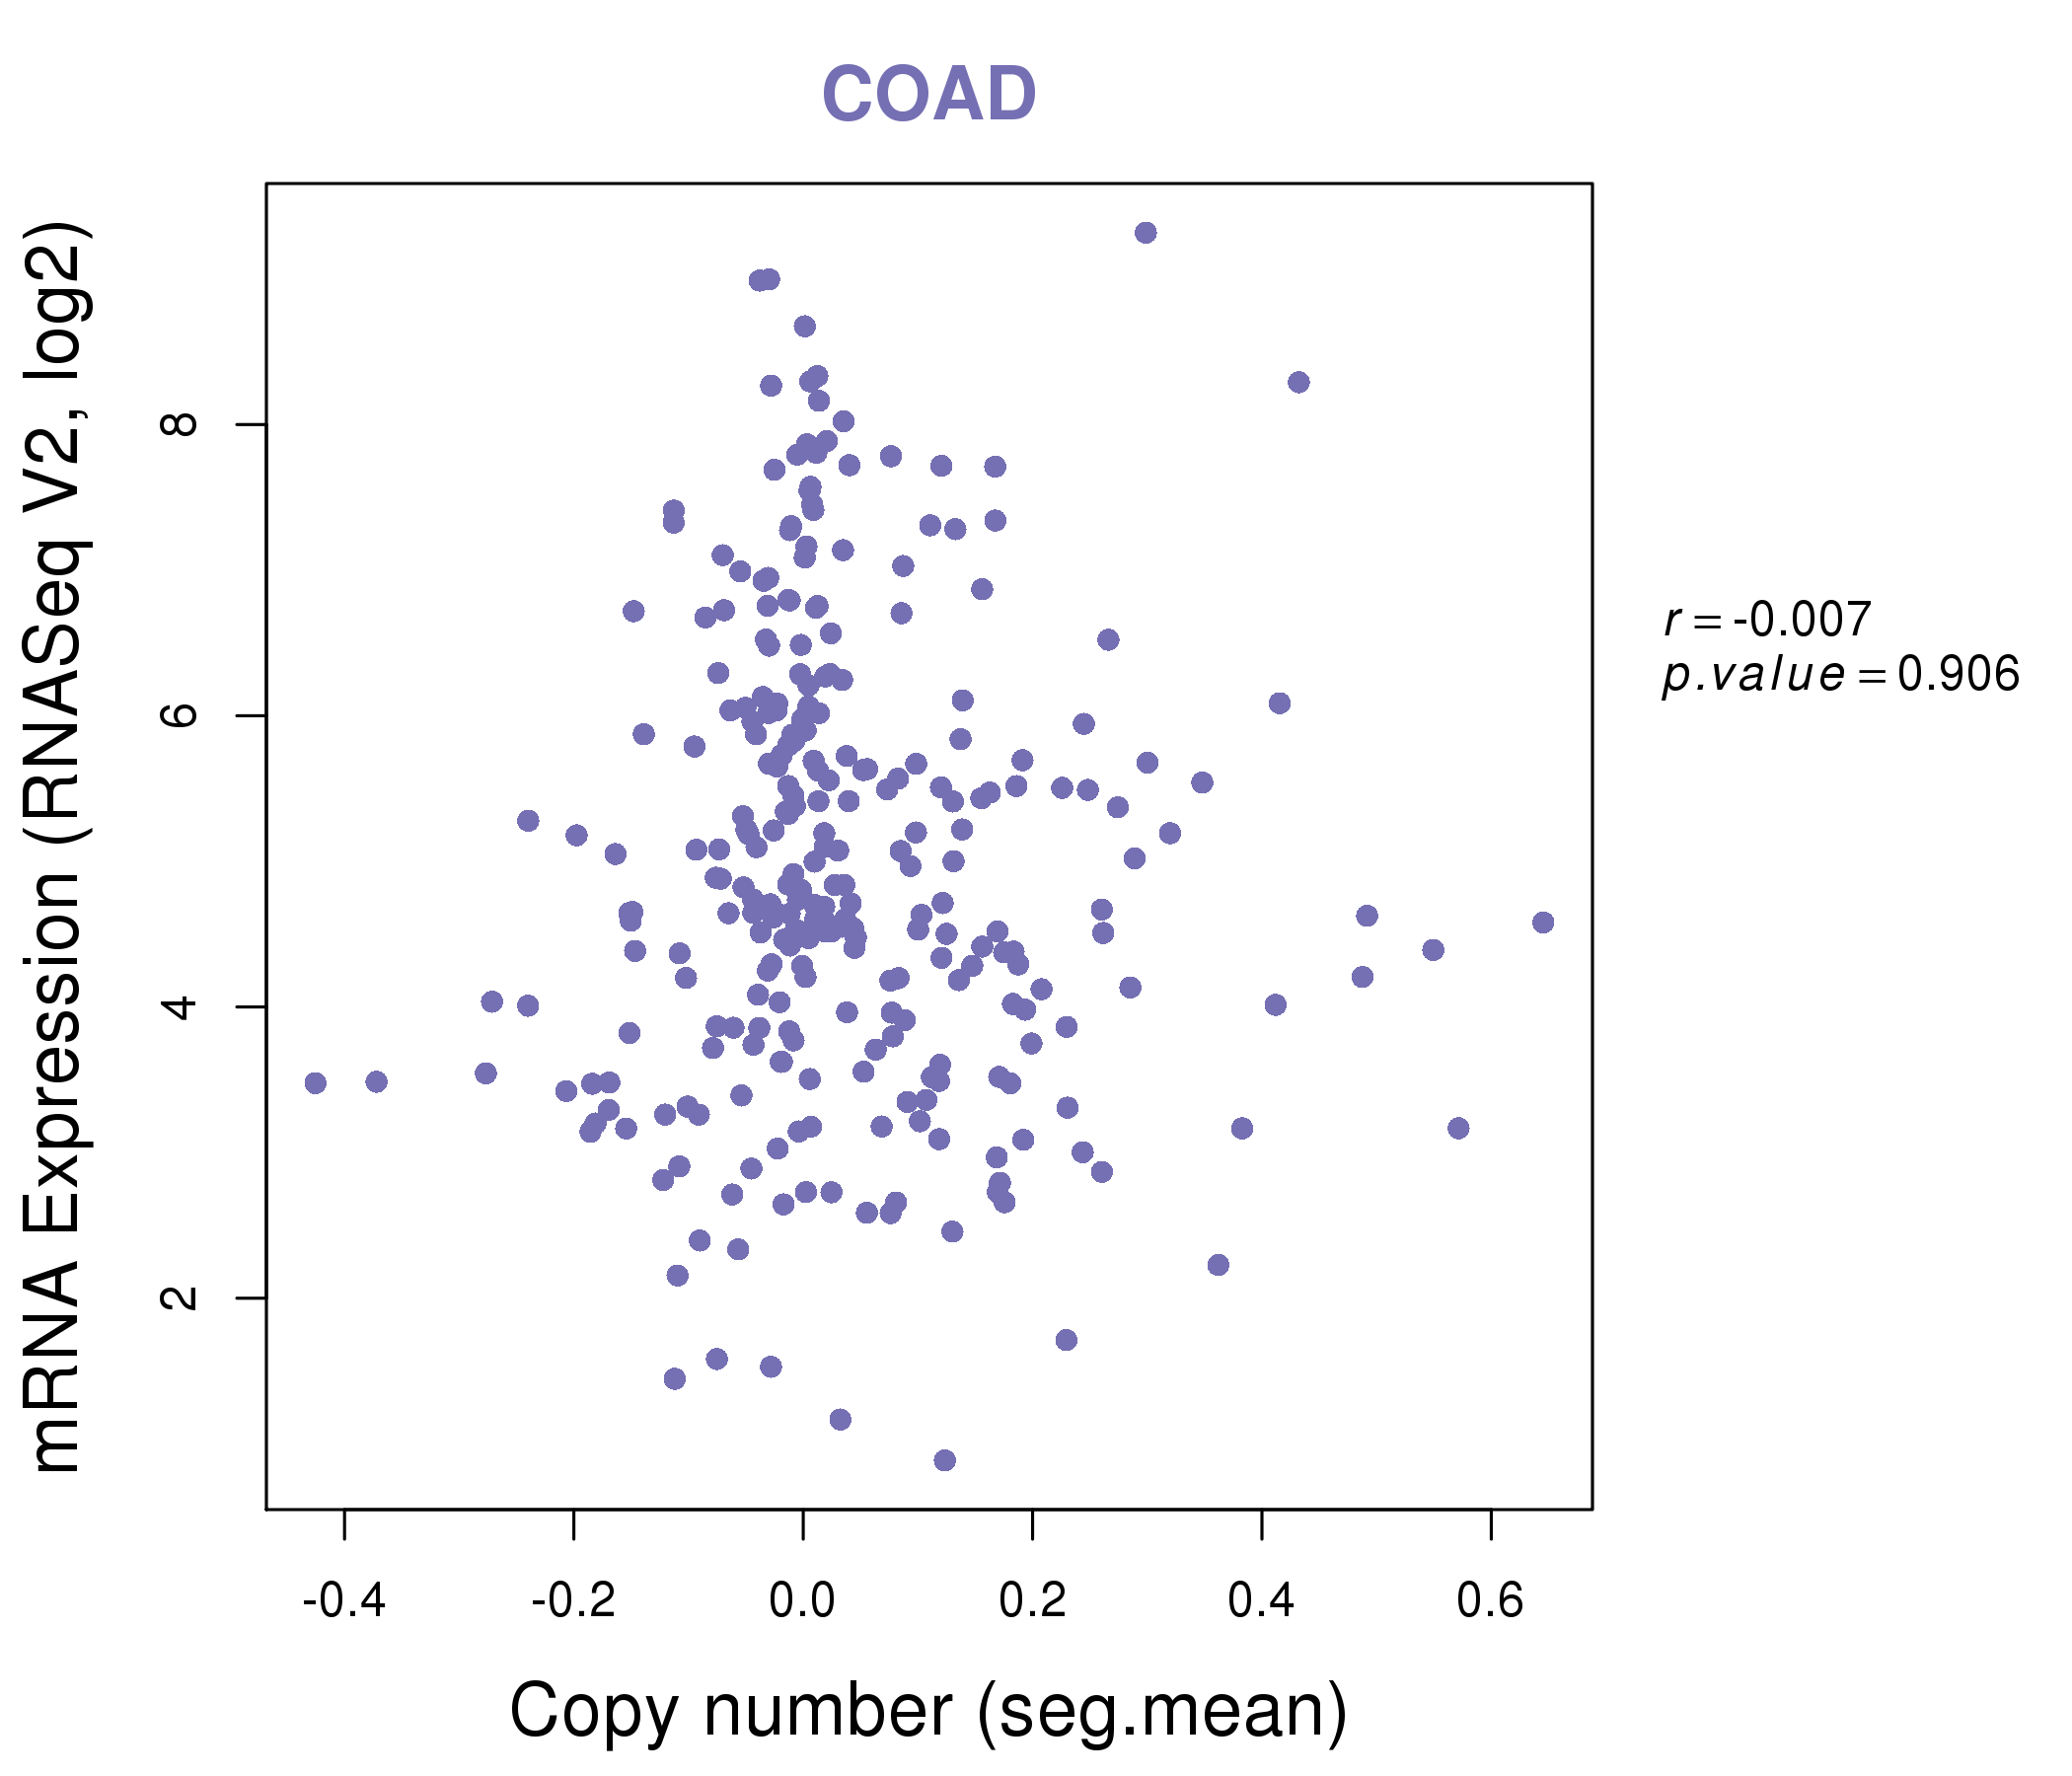
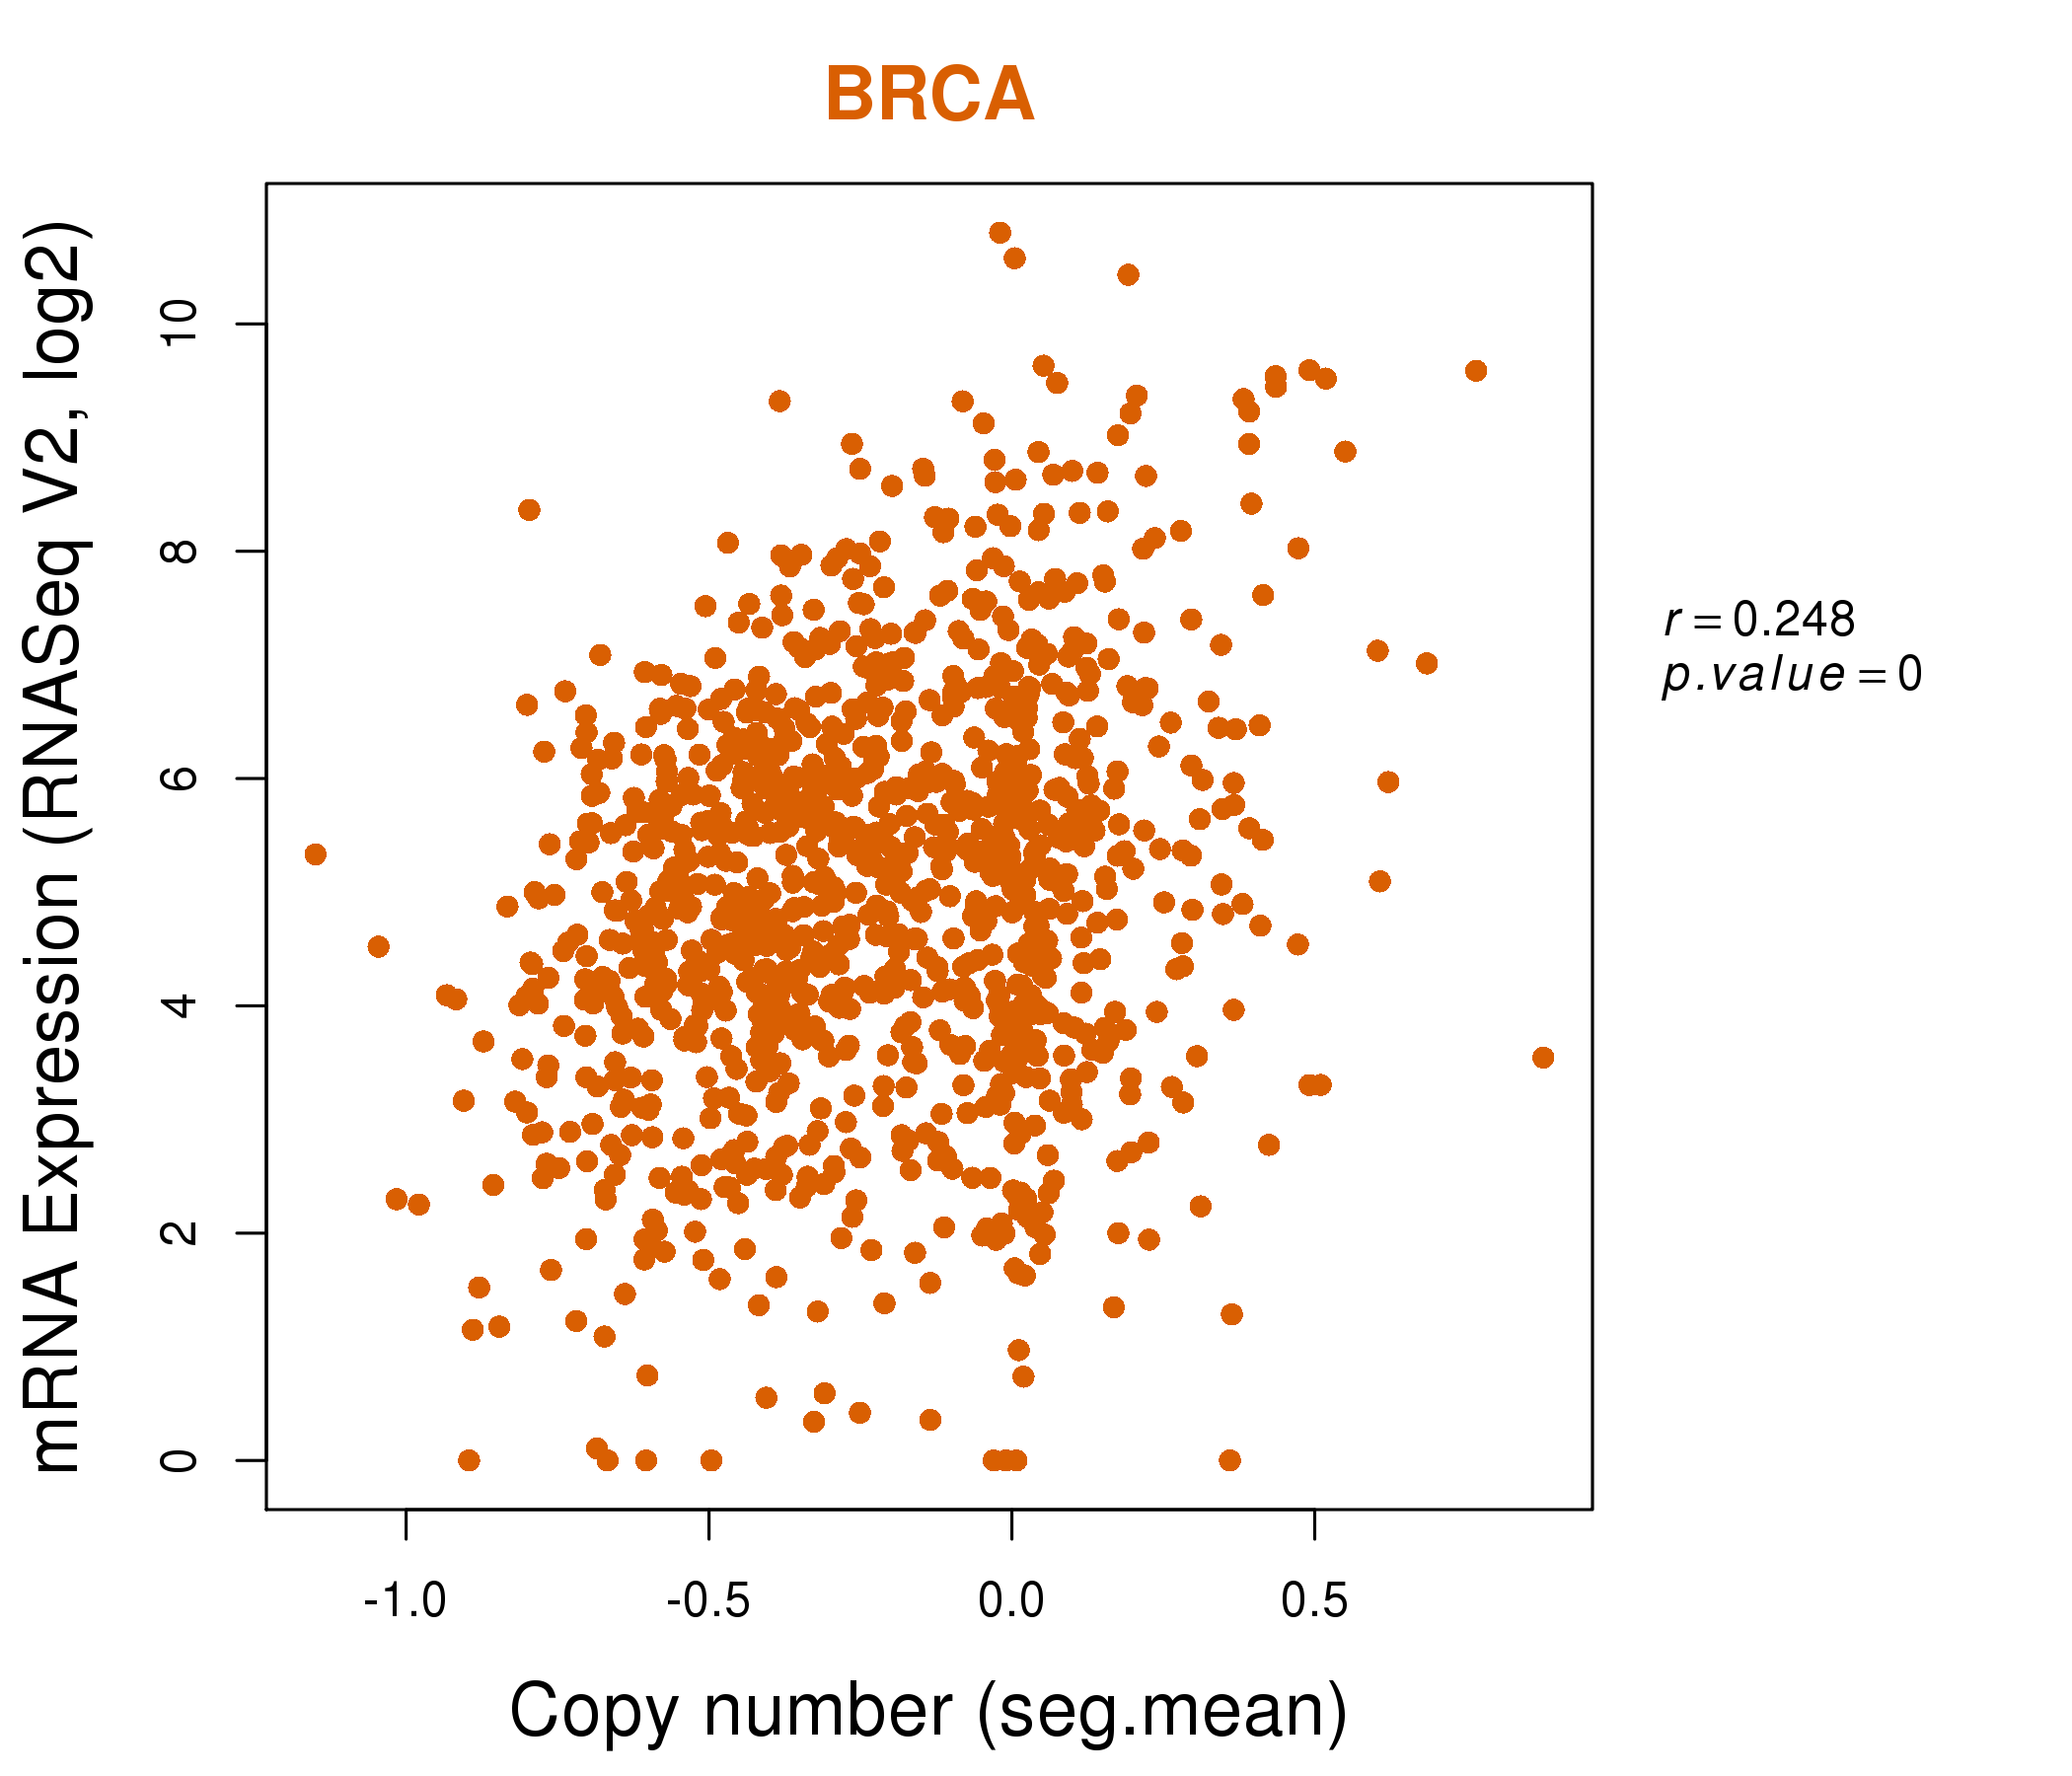
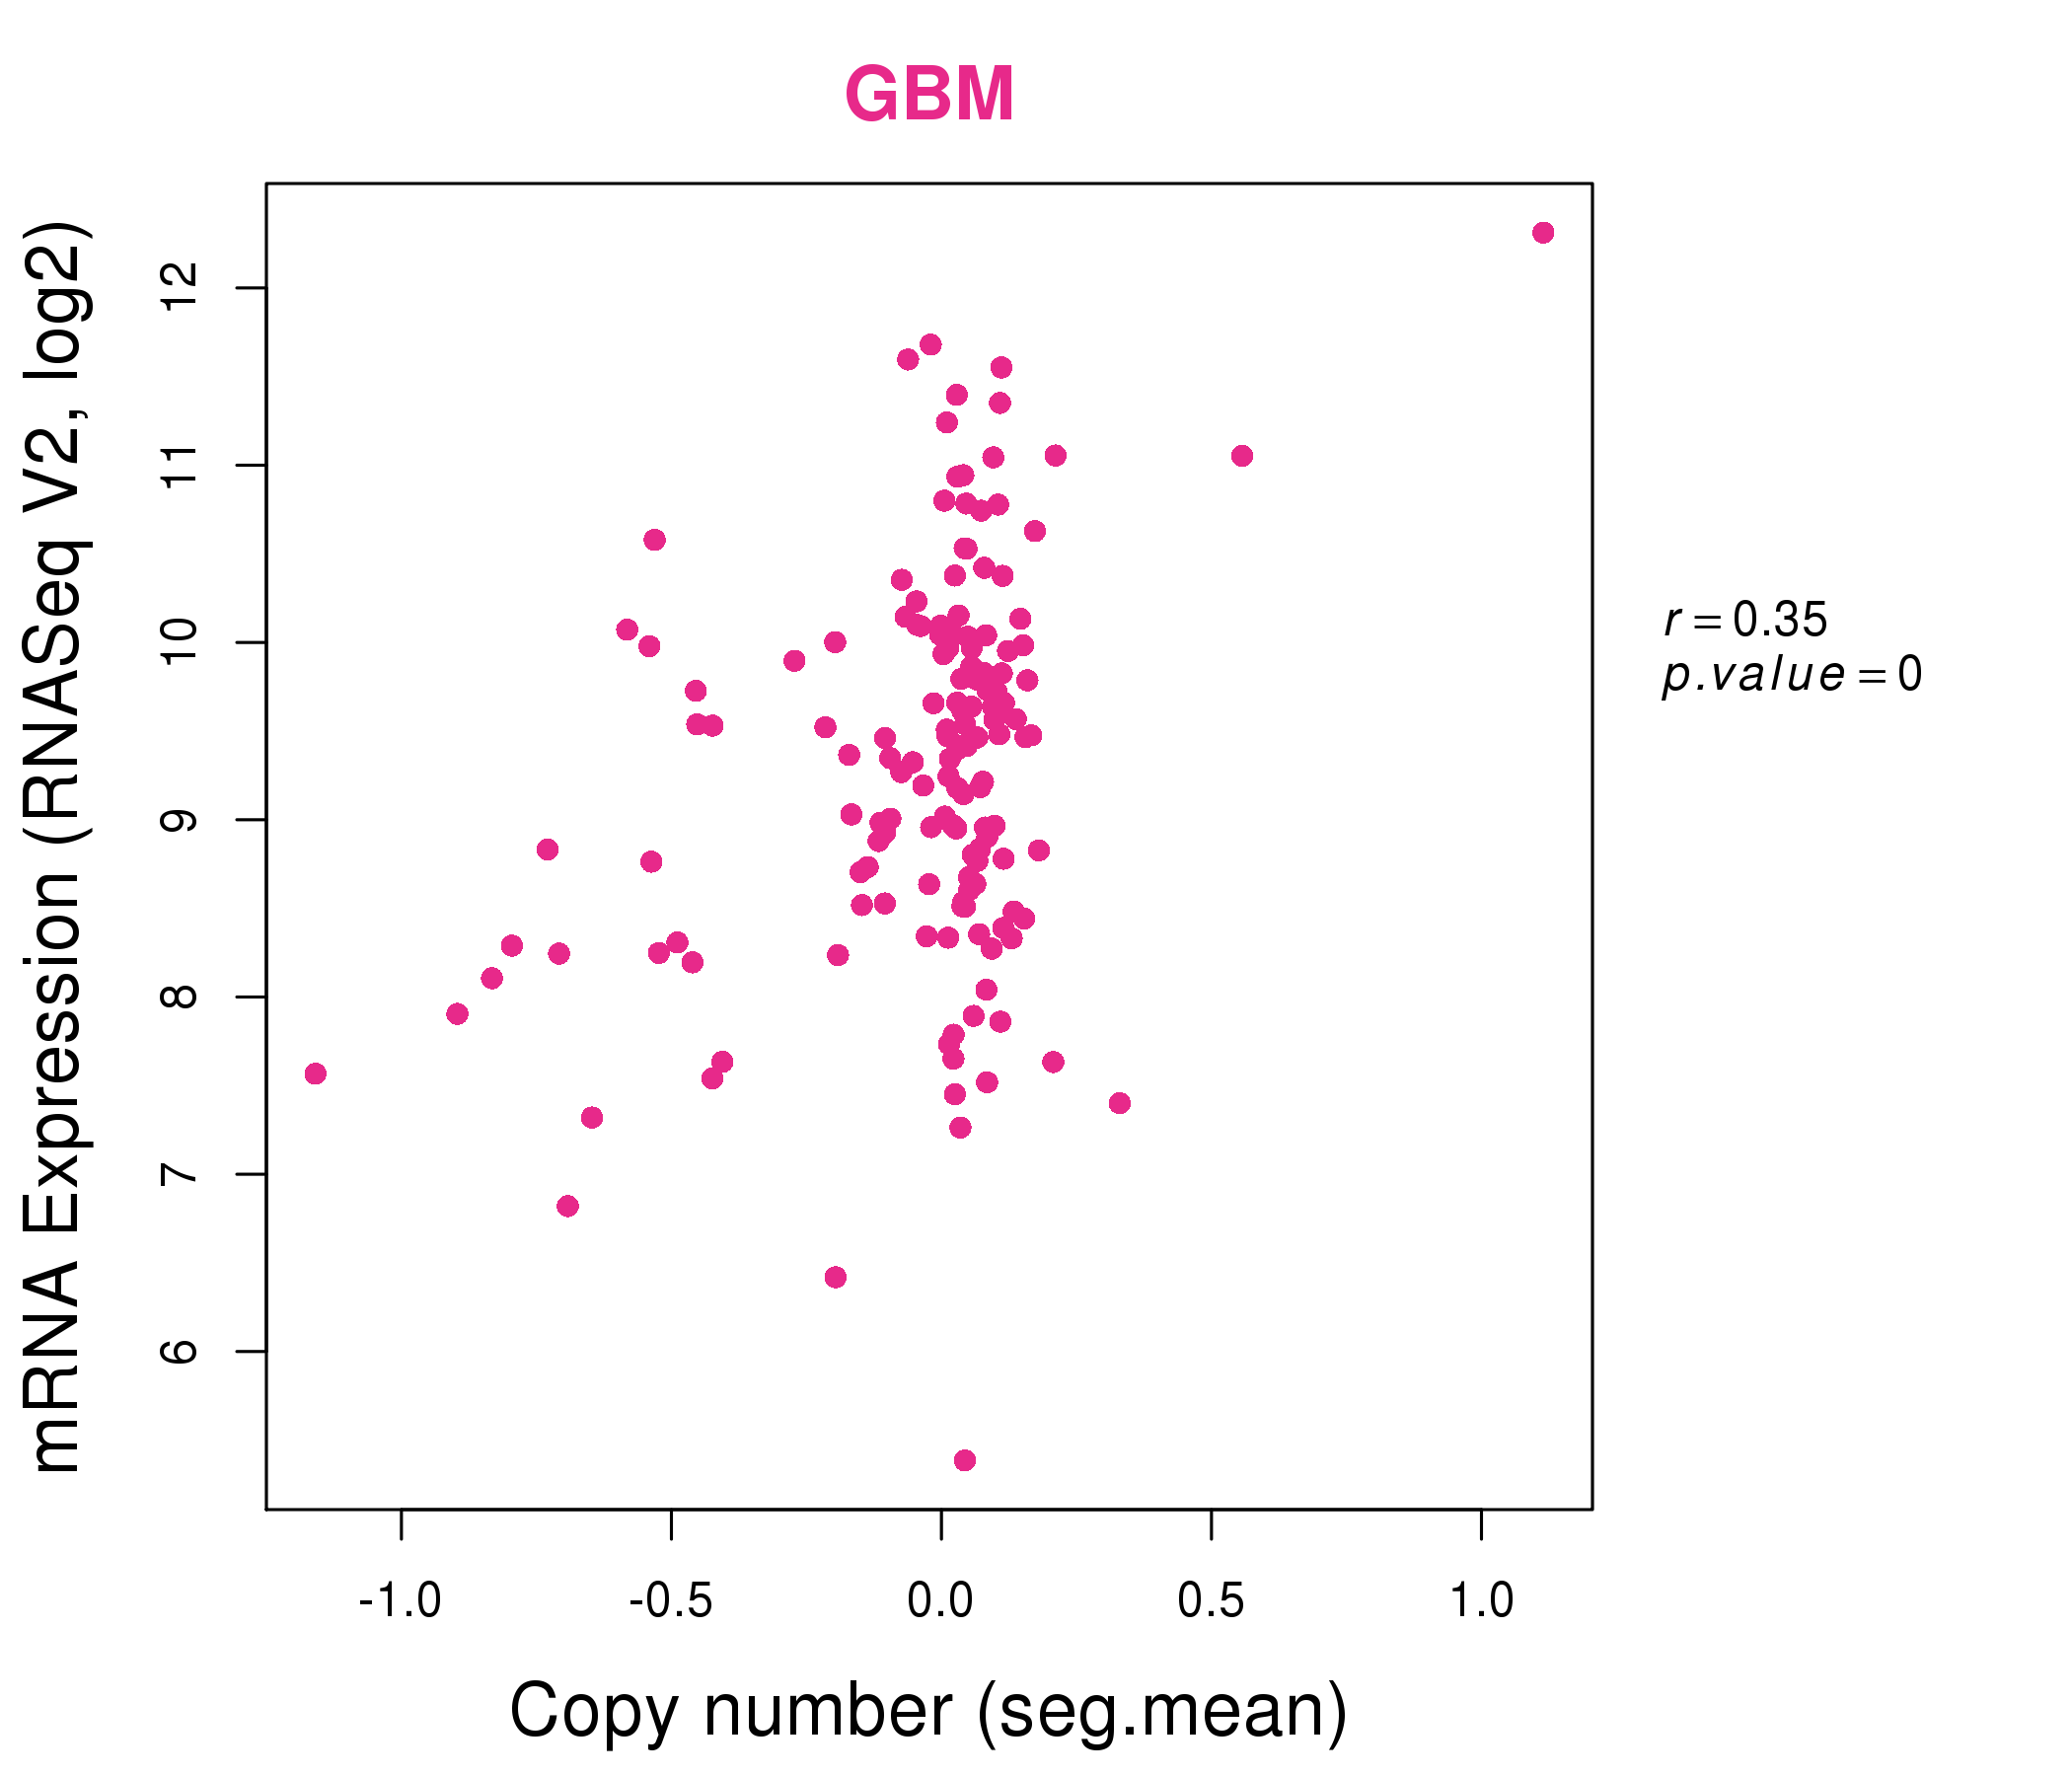
| * This plots show the correlation between CNV and gene expression. |
: Open all plots for all cancer types
 |
|
 |
|
| Top |
| Gene-Gene Network Information |
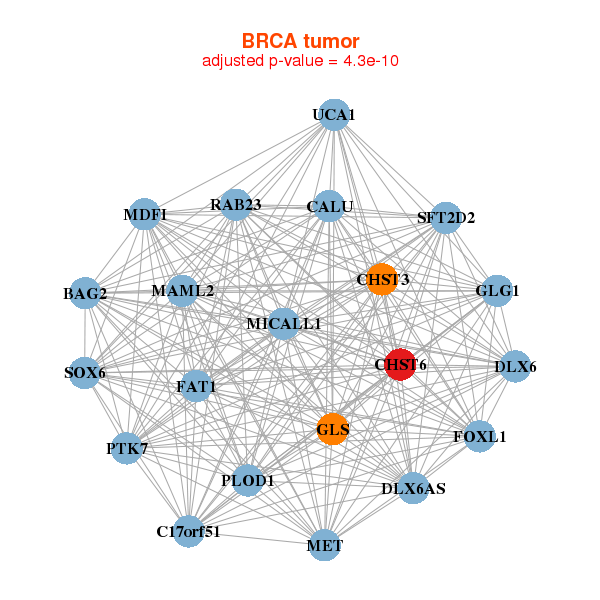
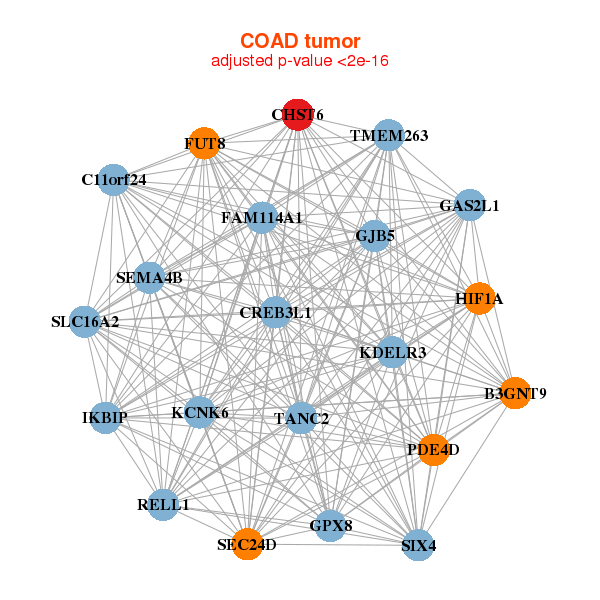
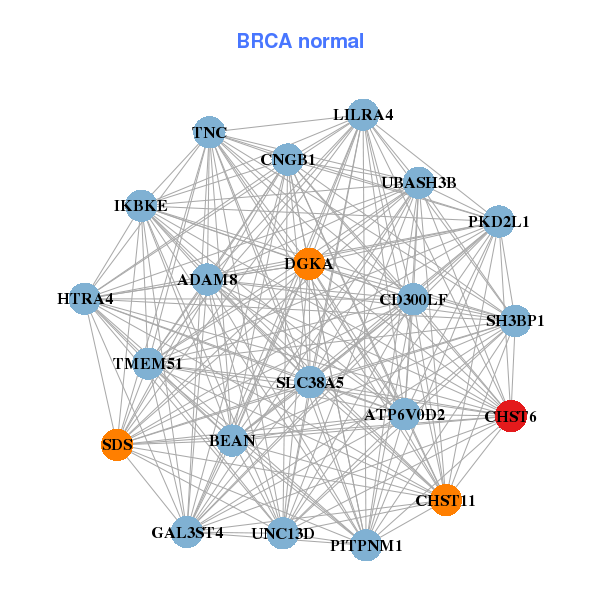
| * Co-Expression network figures were drawn using R package igraph. Only the top 20 genes with the highest correlations were shown. Red circle: input gene, orange circle: cell metabolism gene, sky circle: other gene |
: Open all plots for all cancer types
 |
|
| BAG2,C17orf51,CALU,CHST3,CHST6,DLX6,DLX6AS, FAT1,FOXL1,GLG1,GLS,MAML2,MDFI,MET, MICALL1,PLOD1,PTK7,RAB23,SFT2D2,SOX6,UCA1 | ADAM8,ATP6V0D2,BEAN,CD300LF,CHST11,CHST6,CNGB1, DGKA,GAL3ST4,HTRA4,IKBKE,LILRA4,PITPNM1,PKD2L1, SDS,SH3BP1,SLC38A5,TMEM51,TNC,UBASH3B,UNC13D |
 |
|
| B3GNT9,C11orf24,TMEM263,CHST6,CREB3L1,FAM114A1,FUT8, GAS2L1,GJB5,GPX8,HIF1A,IKBIP,KCNK6,KDELR3, PDE4D,RELL1,SEC24D,SEMA4B,SIX4,SLC16A2,TANC2 | ABHD12,C10orf54,C1orf115,CCL14-CCL15,CDHR5,CHST6,EPS8L2, FAM102A,INPP5J,KIAA1211,KIAA2013,LOC151534,MEP1A,NGEF, PC,PDLIM2,PLA2G12B,RIN2,RIPK4,TMEM120A,TMEM150B |
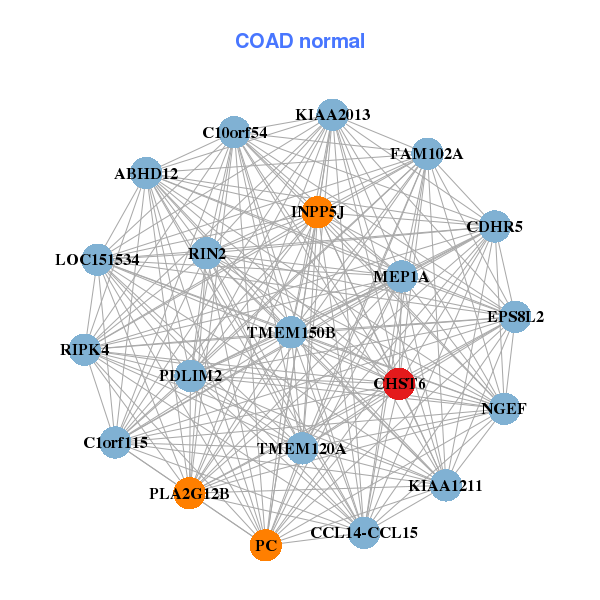
| * Co-Expression network figures were drawn using R package igraph. Only the top 20 genes with the highest correlations were shown. Red circle: input gene, orange circle: cell metabolism gene, sky circle: other gene |
: Open all plots for all cancer types
| Top |
: Open all interacting genes' information including KEGG pathway for all interacting genes from DAVID
| Top |
| Pharmacological Information for CHST6 |
| There's no related Drug. |
| Top |
| Cross referenced IDs for CHST6 |
| * We obtained these cross-references from Uniprot database. It covers 150 different DBs, 18 categories. http://www.uniprot.org/help/cross_references_section |
: Open all cross reference information
|
Copyright © 2016-Present - The Univsersity of Texas Health Science Center at Houston @ |