|
||||||||||||||||||||
| |
| Phenotypic Information (metabolism pathway, cancer, disease, phenome) |
| |
| |
| Gene-Gene Network Information: Co-Expression Network, Interacting Genes & KEGG |
| |
|


| Gene Summary for MDH1 |
| Basic gene info. | Gene symbol | MDH1 |
| Gene name | malate dehydrogenase 1, NAD (soluble) | |
| Synonyms | HEL-S-32|MDH-s|MDHA|MGC:1375|MOR2 | |
| Cytomap | UCSC genome browser: 2p13.3 | |
| Genomic location | chr2 :63816284-63834330 | |
| Type of gene | protein-coding | |
| RefGenes | NM_001199111.1, NM_001199112.1,NM_005917.3, | |
| Ensembl id | ENSG00000014641 | |
| Description | cytosolic malate dehydrogenasediiodophenylpyruvate reductaseepididymis secretory protein Li 32malate dehydrogenase, cytoplasmicsoluble malate dehydrogenase | |
| Modification date | 20141207 | |
| dbXrefs | MIM : 154200 | |
| HGNC : HGNC | ||
| Ensembl : ENSG00000014641 | ||
| HPRD : 01100 | ||
| Vega : OTTHUMG00000129512 | ||
| Protein | UniProt: P40925 go to UniProt's Cross Reference DB Table | |
| Expression | CleanEX: HS_MDH1 | |
| BioGPS: 4190 | ||
| Gene Expression Atlas: ENSG00000014641 | ||
| The Human Protein Atlas: ENSG00000014641 | ||
| Pathway | NCI Pathway Interaction Database: MDH1 | |
| KEGG: MDH1 | ||
| REACTOME: MDH1 | ||
| ConsensusPathDB | ||
| Pathway Commons: MDH1 | ||
| Metabolism | MetaCyc: MDH1 | |
| HUMANCyc: MDH1 | ||
| Regulation | Ensembl's Regulation: ENSG00000014641 | |
| miRBase: chr2 :63,816,284-63,834,330 | ||
| TargetScan: NM_001199111 | ||
| cisRED: ENSG00000014641 | ||
| Context | iHOP: MDH1 | |
| cancer metabolism search in PubMed: MDH1 | ||
| UCL Cancer Institute: MDH1 | ||
| Assigned class in ccmGDB | A - This gene has a literature evidence and it belongs to cancer gene. | |
| References showing role of MDH1 in cancer cell metabolism | 1. Lee SM, Kim JH, Cho EJ, Youn HD (2009) A nucleocytoplasmic malate dehydrogenase regulates p53 transcriptional activity in response to metabolic stress. Cell Death Differ 16: 738-748. doi: 10.1038/cdd.2009.5. go to article 2. Kounelakis MG, Zervakis ME, Giakos GC, Postma GJ, Buydens LM, et al. (2013) On the relevance of glycolysis process on brain gliomas. IEEE J Biomed Health Inform 17: 128-135. doi: 10.1109/TITB.2012.2199128. go to article | |
| Top |
| Phenotypic Information for MDH1(metabolism pathway, cancer, disease, phenome) |
| Cancer | CGAP: MDH1 |
| Familial Cancer Database: MDH1 | |
| * This gene is included in those cancer gene databases. |
|
|
|
|
|
|
| ||||||||||||||
Oncogene 1 | Significant driver gene in | |||||||||||||||||||
| cf) number; DB name 1 Oncogene; http://nar.oxfordjournals.org/content/35/suppl_1/D721.long, 2 Tumor Suppressor gene; https://bioinfo.uth.edu/TSGene/, 3 Cancer Gene Census; http://www.nature.com/nrc/journal/v4/n3/abs/nrc1299.html, 4 CancerGenes; http://nar.oxfordjournals.org/content/35/suppl_1/D721.long, 5 Network of Cancer Gene; http://ncg.kcl.ac.uk/index.php, 1Therapeutic Vulnerabilities in Cancer; http://cbio.mskcc.org/cancergenomics/statius/ |
| KEGG_PYRUVATE_METABOLISM KEGG_GLYOXYLATE_AND_DICARBOXYLATE_METABOLISM REACTOME_METABOLISM_OF_CARBOHYDRATES REACTOME_GLUCOSE_METABOLISM | |
| OMIM | 154200; gene. |
| Orphanet | |
| Disease | KEGG Disease: MDH1 |
| MedGen: MDH1 (Human Medical Genetics with Condition) | |
| ClinVar: MDH1 | |
| Phenotype | MGI: MDH1 (International Mouse Phenotyping Consortium) |
| PhenomicDB: MDH1 | |
| Mutations for MDH1 |
| * Under tables are showing count per each tissue to give us broad intuition about tissue specific mutation patterns.You can go to the detailed page for each mutation database's web site. |
| There's no structural variation information in COSMIC data for this gene. |
| * From mRNA Sanger sequences, Chitars2.0 arranged chimeric transcripts. This table shows MDH1 related fusion information. |
| ID | Head Gene | Tail Gene | Accession | Gene_a | qStart_a | qEnd_a | Chromosome_a | tStart_a | tEnd_a | Gene_a | qStart_a | qEnd_a | Chromosome_a | tStart_a | tEnd_a |
| BM741416 | KPNB1 | 1 | 432 | 17 | 45755440 | 45757968 | MDH1 | 433 | 614 | 2 | 63816113 | 63822571 | |
| BM751800 | KPNB1 | 1 | 432 | 17 | 45755440 | 45757968 | MDH1 | 433 | 599 | 2 | 63816113 | 63821720 | |
| BM768103 | KPNB1 | 1 | 432 | 17 | 45755440 | 45757968 | MDH1 | 433 | 596 | 2 | 63816113 | 63821717 | |
| BM745157 | KPNB1 | 1 | 431 | 17 | 45755440 | 45757968 | MDH1 | 432 | 598 | 2 | 63816113 | 63821720 | |
| BM741420 | KPNB1 | 1 | 431 | 17 | 45755440 | 45757968 | MDH1 | 432 | 623 | 2 | 63816113 | 63822581 | |
| CK003575 | MDH1 | 4 | 53 | 2 | 63816097 | 63816146 | CTNNA1 | 53 | 622 | 5 | 138269887 | 138270464 | |
| BM768064 | KPNB1 | 1 | 433 | 17 | 45755440 | 45757968 | MDH1 | 434 | 598 | 2 | 63816113 | 63821718 | |
| AA092172 | MAGED2 | 1 | 99 | X | 54834178 | 54837913 | MDH1 | 94 | 276 | 2 | 63831921 | 63832514 | |
| BE709622 | MDH1 | 8 | 67 | 2 | 63831845 | 63831904 | LRTOMT | 65 | 249 | 11 | 71796442 | 71796626 | |
| AA315813 | SMPD4 | 1 | 220 | 2 | 130932487 | 130939151 | MDH1 | 219 | 495 | 2 | 63821620 | 63824707 | |
| BM767348 | KPNB1 | 1 | 432 | 17 | 45755440 | 45757968 | MDH1 | 433 | 596 | 2 | 63816113 | 63821717 | |
| BG290076 | MDH1 | 39 | 308 | 2 | 63831925 | 63833146 | MDH1 | 302 | 744 | 2 | 63831899 | 63834120 | |
| AW951984 | SMPD4 | 1 | 219 | 2 | 130932487 | 130939150 | MDH1 | 218 | 333 | 2 | 63821620 | 63824547 | |
| Top |
| There's no copy number variation information in COSMIC data for this gene. |
| Top |
|
 |
| Top |
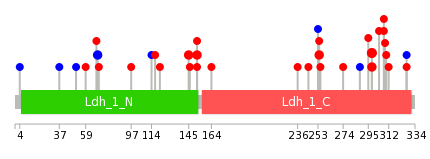
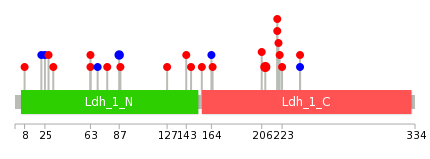
| Stat. for Non-Synonymous SNVs (# total SNVs=29) | (# total SNVs=7) |
 |  |
(# total SNVs=0) | (# total SNVs=0) |
| Top |
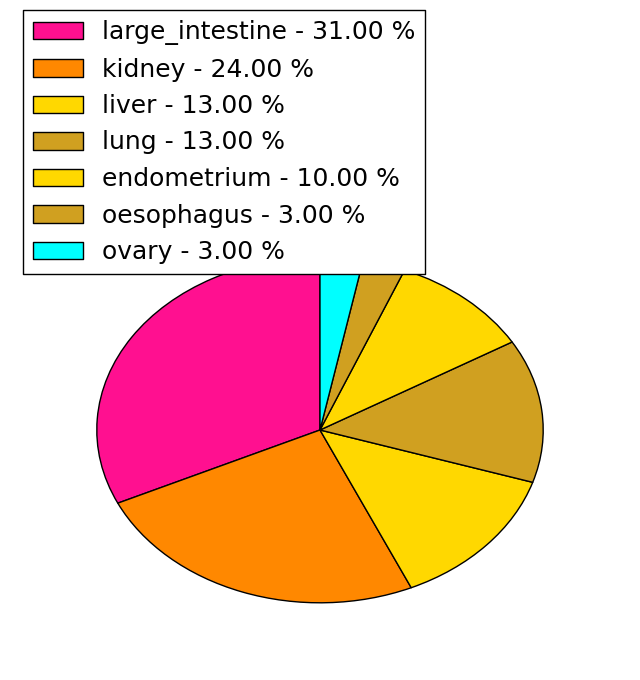
| * When you move the cursor on each content, you can see more deailed mutation information on the Tooltip. Those are primary_site,primary_histology,mutation(aa),pubmedID. |
| GRCh37 position | Mutation(aa) | Unique sampleID count |
| chr2:63832498-63832498 | p.V254I | 3 |
| chr2:63834009-63834009 | p.K298R | 3 |
| chr2:63826361-63826361 | p.P145A | 2 |
| chr2:63826383-63826383 | p.F152S | 2 |
| chr2:63824540-63824540 | p.I69I | 2 |
| chr2:63834027-63834027 | p.P304L | 1 |
| chr2:63824675-63824675 | p.A114A | 1 |
| chr2:63832446-63832446 | p.K236N | 1 |
| chr2:63834039-63834039 | p.F308Y | 1 |
| chr2:63824683-63824683 | p.D117G | 1 |
| Top |
|
 |
| Point Mutation/ Tissue ID | 1 | 2 | 3 | 4 | 5 | 6 | 7 | 8 | 9 | 10 | 11 | 12 | 13 | 14 | 15 | 16 | 17 | 18 | 19 | 20 |
| # sample | 1 | 7 | 1 | 2 | 2 | 2 | 1 | 1 | 4 | 8 | ||||||||||
| # mutation | 1 | 5 | 1 | 2 | 2 | 2 | 1 | 1 | 4 | 7 | ||||||||||
| nonsynonymous SNV | 1 | 5 | 1 | 2 | 2 | 1 | 1 | 1 | 3 | 3 | ||||||||||
| synonymous SNV | 1 | 1 | 4 |
| cf) Tissue ID; Tissue type (1; BLCA[Bladder Urothelial Carcinoma], 2; BRCA[Breast invasive carcinoma], 3; CESC[Cervical squamous cell carcinoma and endocervical adenocarcinoma], 4; COAD[Colon adenocarcinoma], 5; GBM[Glioblastoma multiforme], 6; Glioma Low Grade, 7; HNSC[Head and Neck squamous cell carcinoma], 8; KICH[Kidney Chromophobe], 9; KIRC[Kidney renal clear cell carcinoma], 10; KIRP[Kidney renal papillary cell carcinoma], 11; LAML[Acute Myeloid Leukemia], 12; LUAD[Lung adenocarcinoma], 13; LUSC[Lung squamous cell carcinoma], 14; OV[Ovarian serous cystadenocarcinoma ], 15; PAAD[Pancreatic adenocarcinoma], 16; PRAD[Prostate adenocarcinoma], 17; SKCM[Skin Cutaneous Melanoma], 18:STAD[Stomach adenocarcinoma], 19:THCA[Thyroid carcinoma], 20:UCEC[Uterine Corpus Endometrial Carcinoma]) |
| Top |
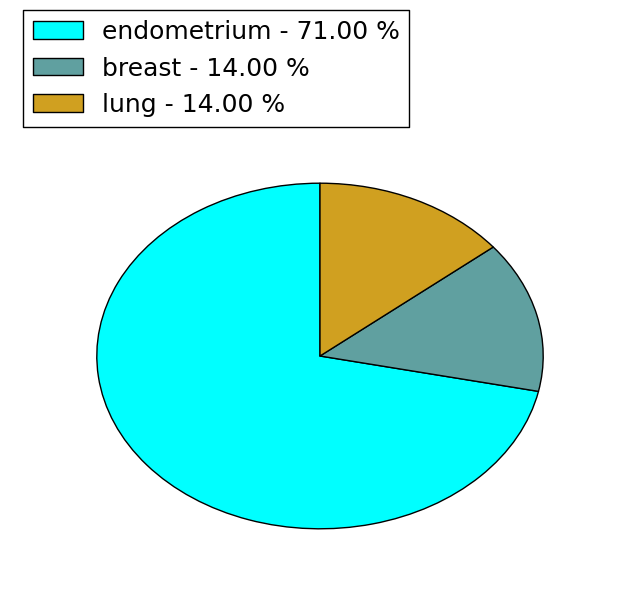
| * We represented just top 10 SNVs. When you move the cursor on each content, you can see more deailed mutation information on the Tooltip. Those are primary_site, primary_histology, mutation(aa), pubmedID. |
| Genomic Position | Mutation(aa) | Unique sampleID count |
| chr2:63834009 | p.K209R,MDH1 | 3 |
| chr2:63824540 | p.I87I,MDH1 | 2 |
| chr2:63826382 | p.S156Y,MDH1 | 1 |
| chr2:63834040 | p.H164H,MDH1 | 1 |
| chr2:63826383 | p.P22P,MDH1 | 1 |
| chr2:63834042 | p.V165I,MDH1 | 1 |
| chr2:63821630 | p.D69D,MDH1 | 1 |
| chr2:63831977 | p.K206T,MDH1 | 1 |
| chr2:63834045 | p.D77G,MDH1 | 1 |
| chr2:63822607 | p.F219Y,MDH1 | 1 |
| * Copy number data were extracted from TCGA using R package TCGA-Assembler. The URLs of all public data files on TCGA DCC data server were gathered on Jan-05-2015. Function ProcessCNAData in TCGA-Assembler package was used to obtain gene-level copy number value which is calculated as the average copy number of the genomic region of a gene. |
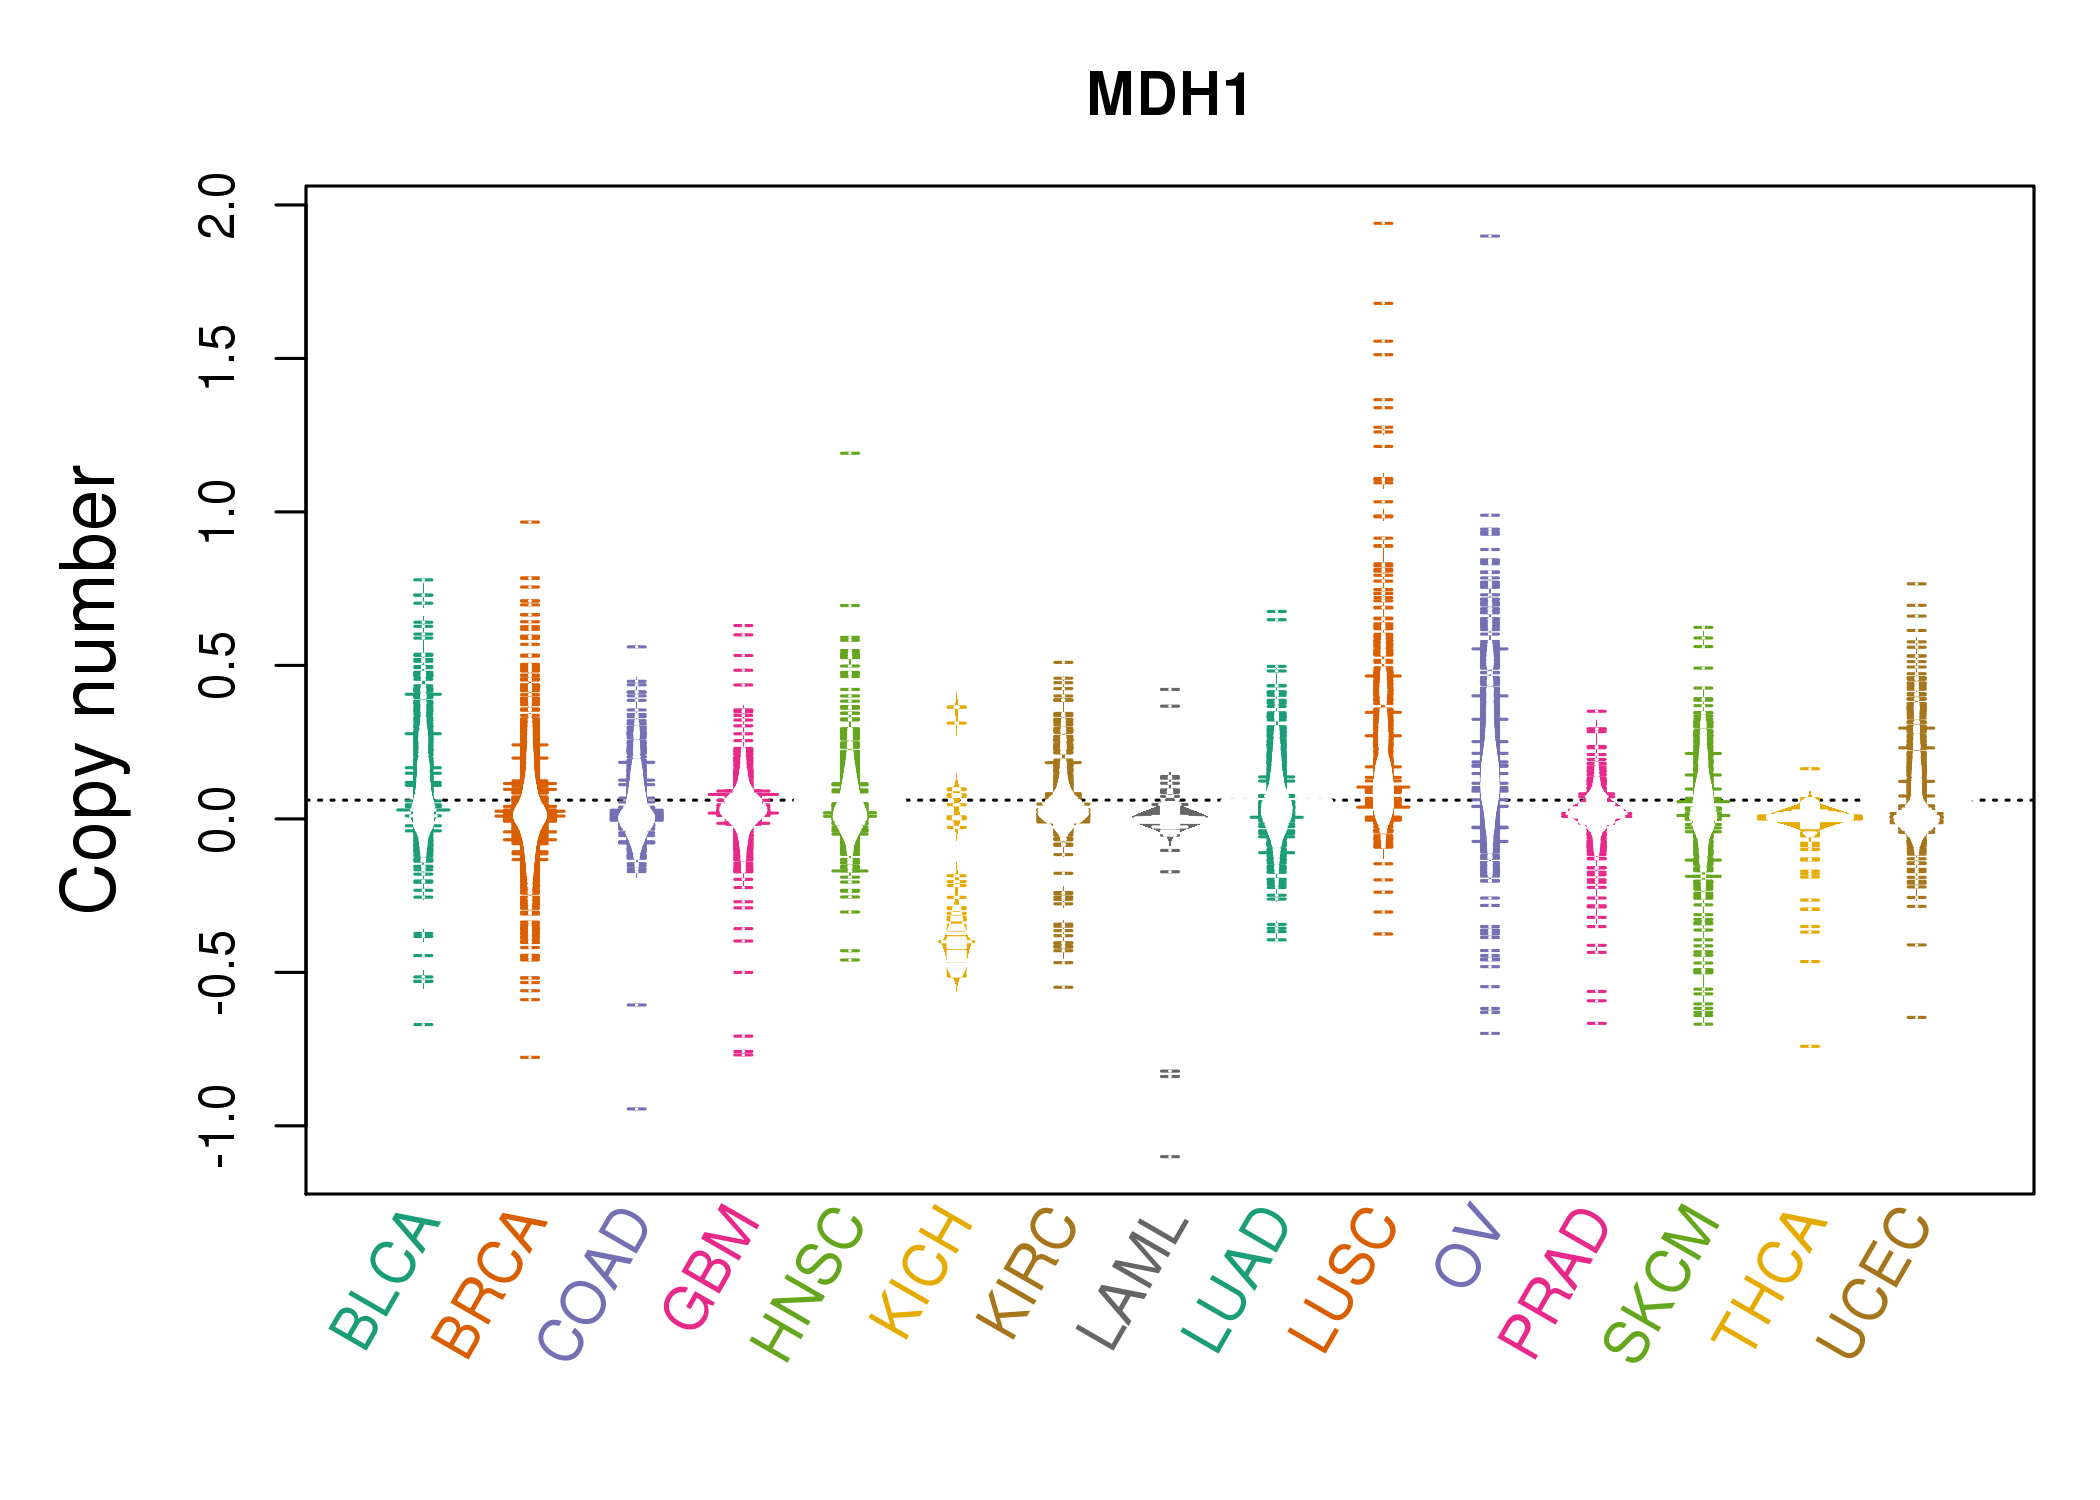 |
| cf) Tissue ID[Tissue type]: BLCA[Bladder Urothelial Carcinoma], BRCA[Breast invasive carcinoma], CESC[Cervical squamous cell carcinoma and endocervical adenocarcinoma], COAD[Colon adenocarcinoma], GBM[Glioblastoma multiforme], Glioma Low Grade, HNSC[Head and Neck squamous cell carcinoma], KICH[Kidney Chromophobe], KIRC[Kidney renal clear cell carcinoma], KIRP[Kidney renal papillary cell carcinoma], LAML[Acute Myeloid Leukemia], LUAD[Lung adenocarcinoma], LUSC[Lung squamous cell carcinoma], OV[Ovarian serous cystadenocarcinoma ], PAAD[Pancreatic adenocarcinoma], PRAD[Prostate adenocarcinoma], SKCM[Skin Cutaneous Melanoma], STAD[Stomach adenocarcinoma], THCA[Thyroid carcinoma], UCEC[Uterine Corpus Endometrial Carcinoma] |
| Top |
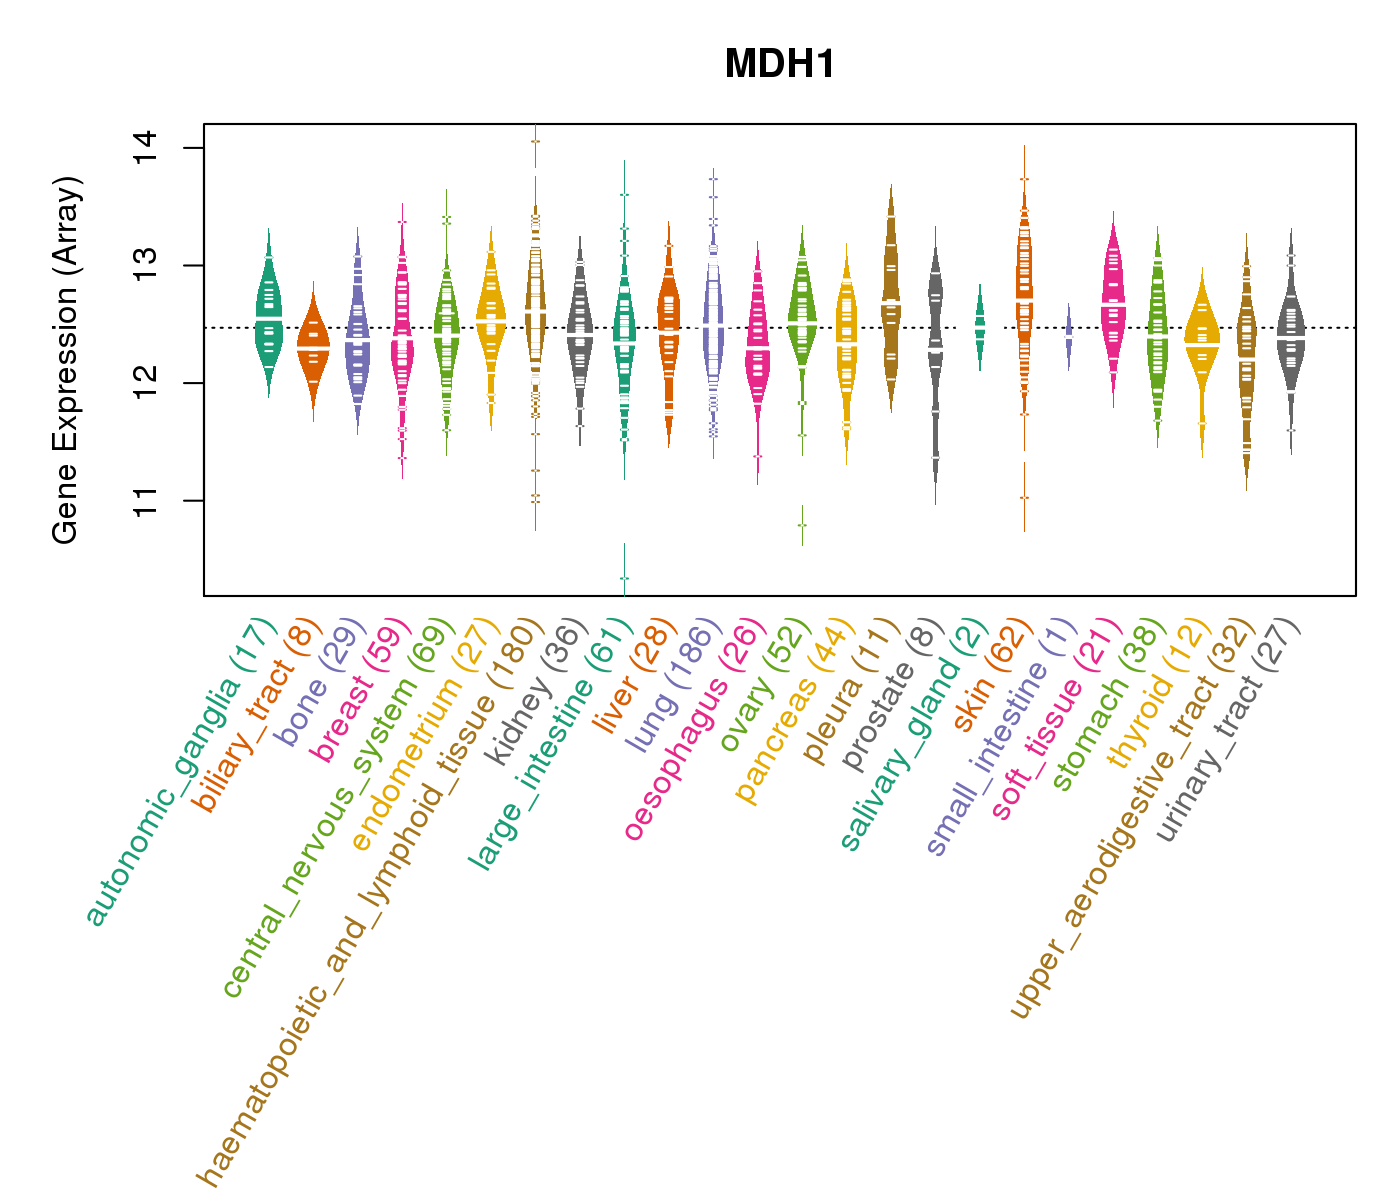
| Gene Expression for MDH1 |
| * CCLE gene expression data were extracted from CCLE_Expression_Entrez_2012-10-18.res: Gene-centric RMA-normalized mRNA expression data. |
 |
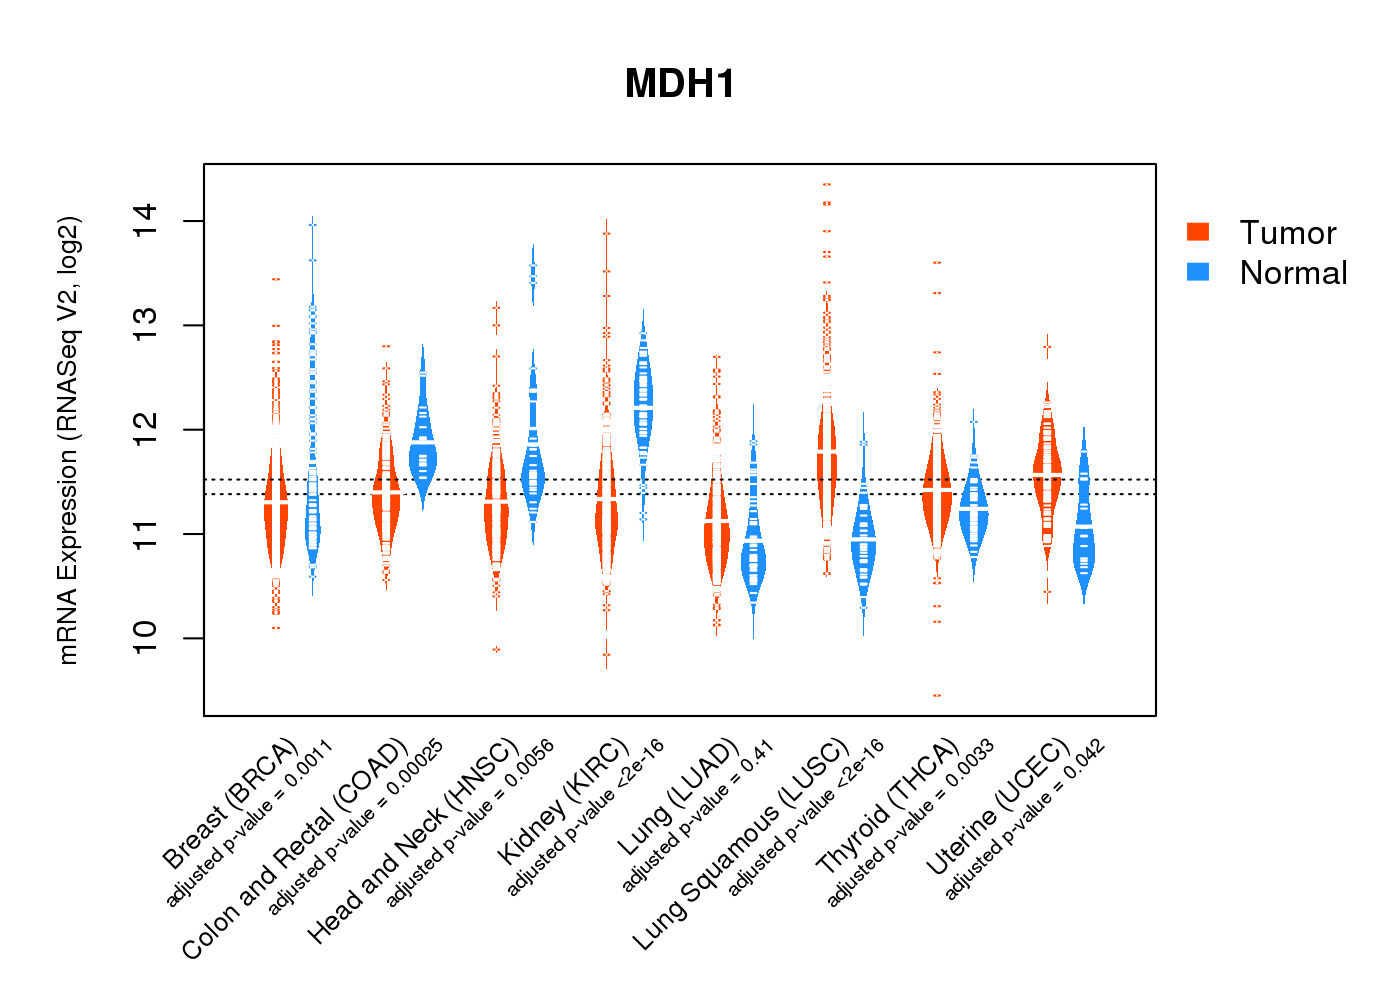
| * Normalized gene expression data of RNASeqV2 was extracted from TCGA using R package TCGA-Assembler. The URLs of all public data files on TCGA DCC data server were gathered at Jan-05-2015. Only eight cancer types have enough normal control samples for differential expression analysis. (t test, adjusted p<0.05 (using Benjamini-Hochberg FDR)) |
 |
| Top |
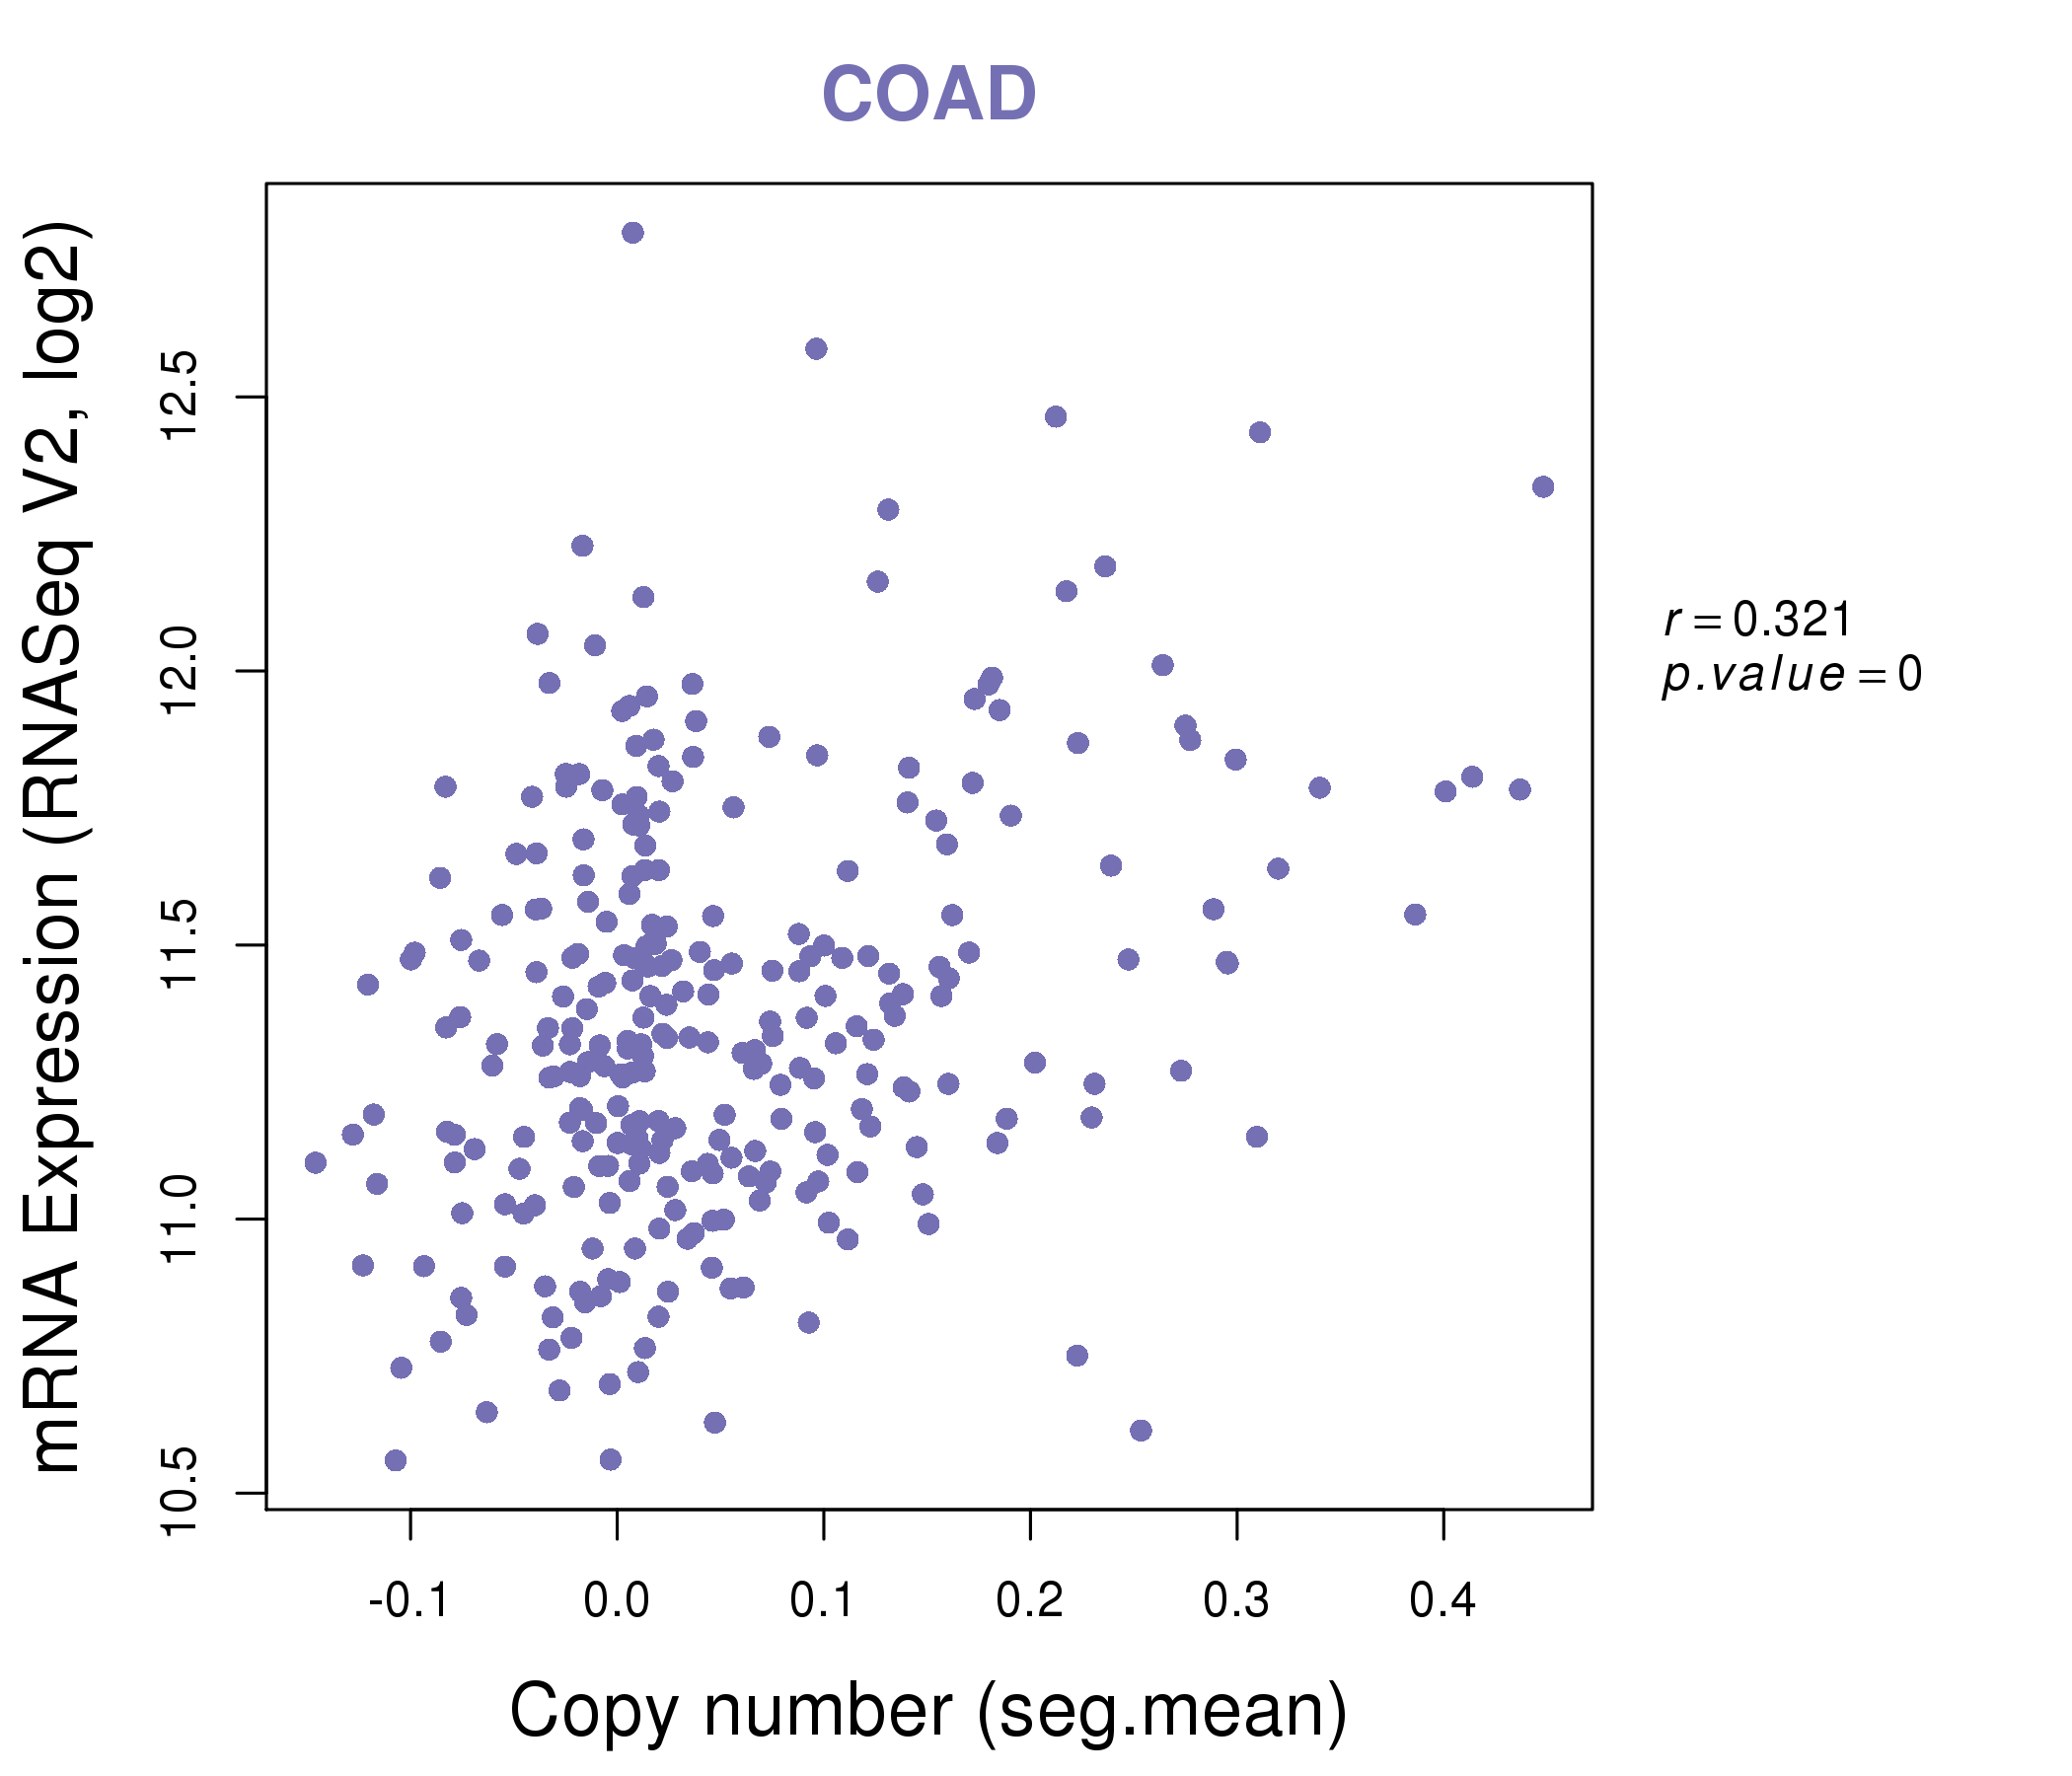
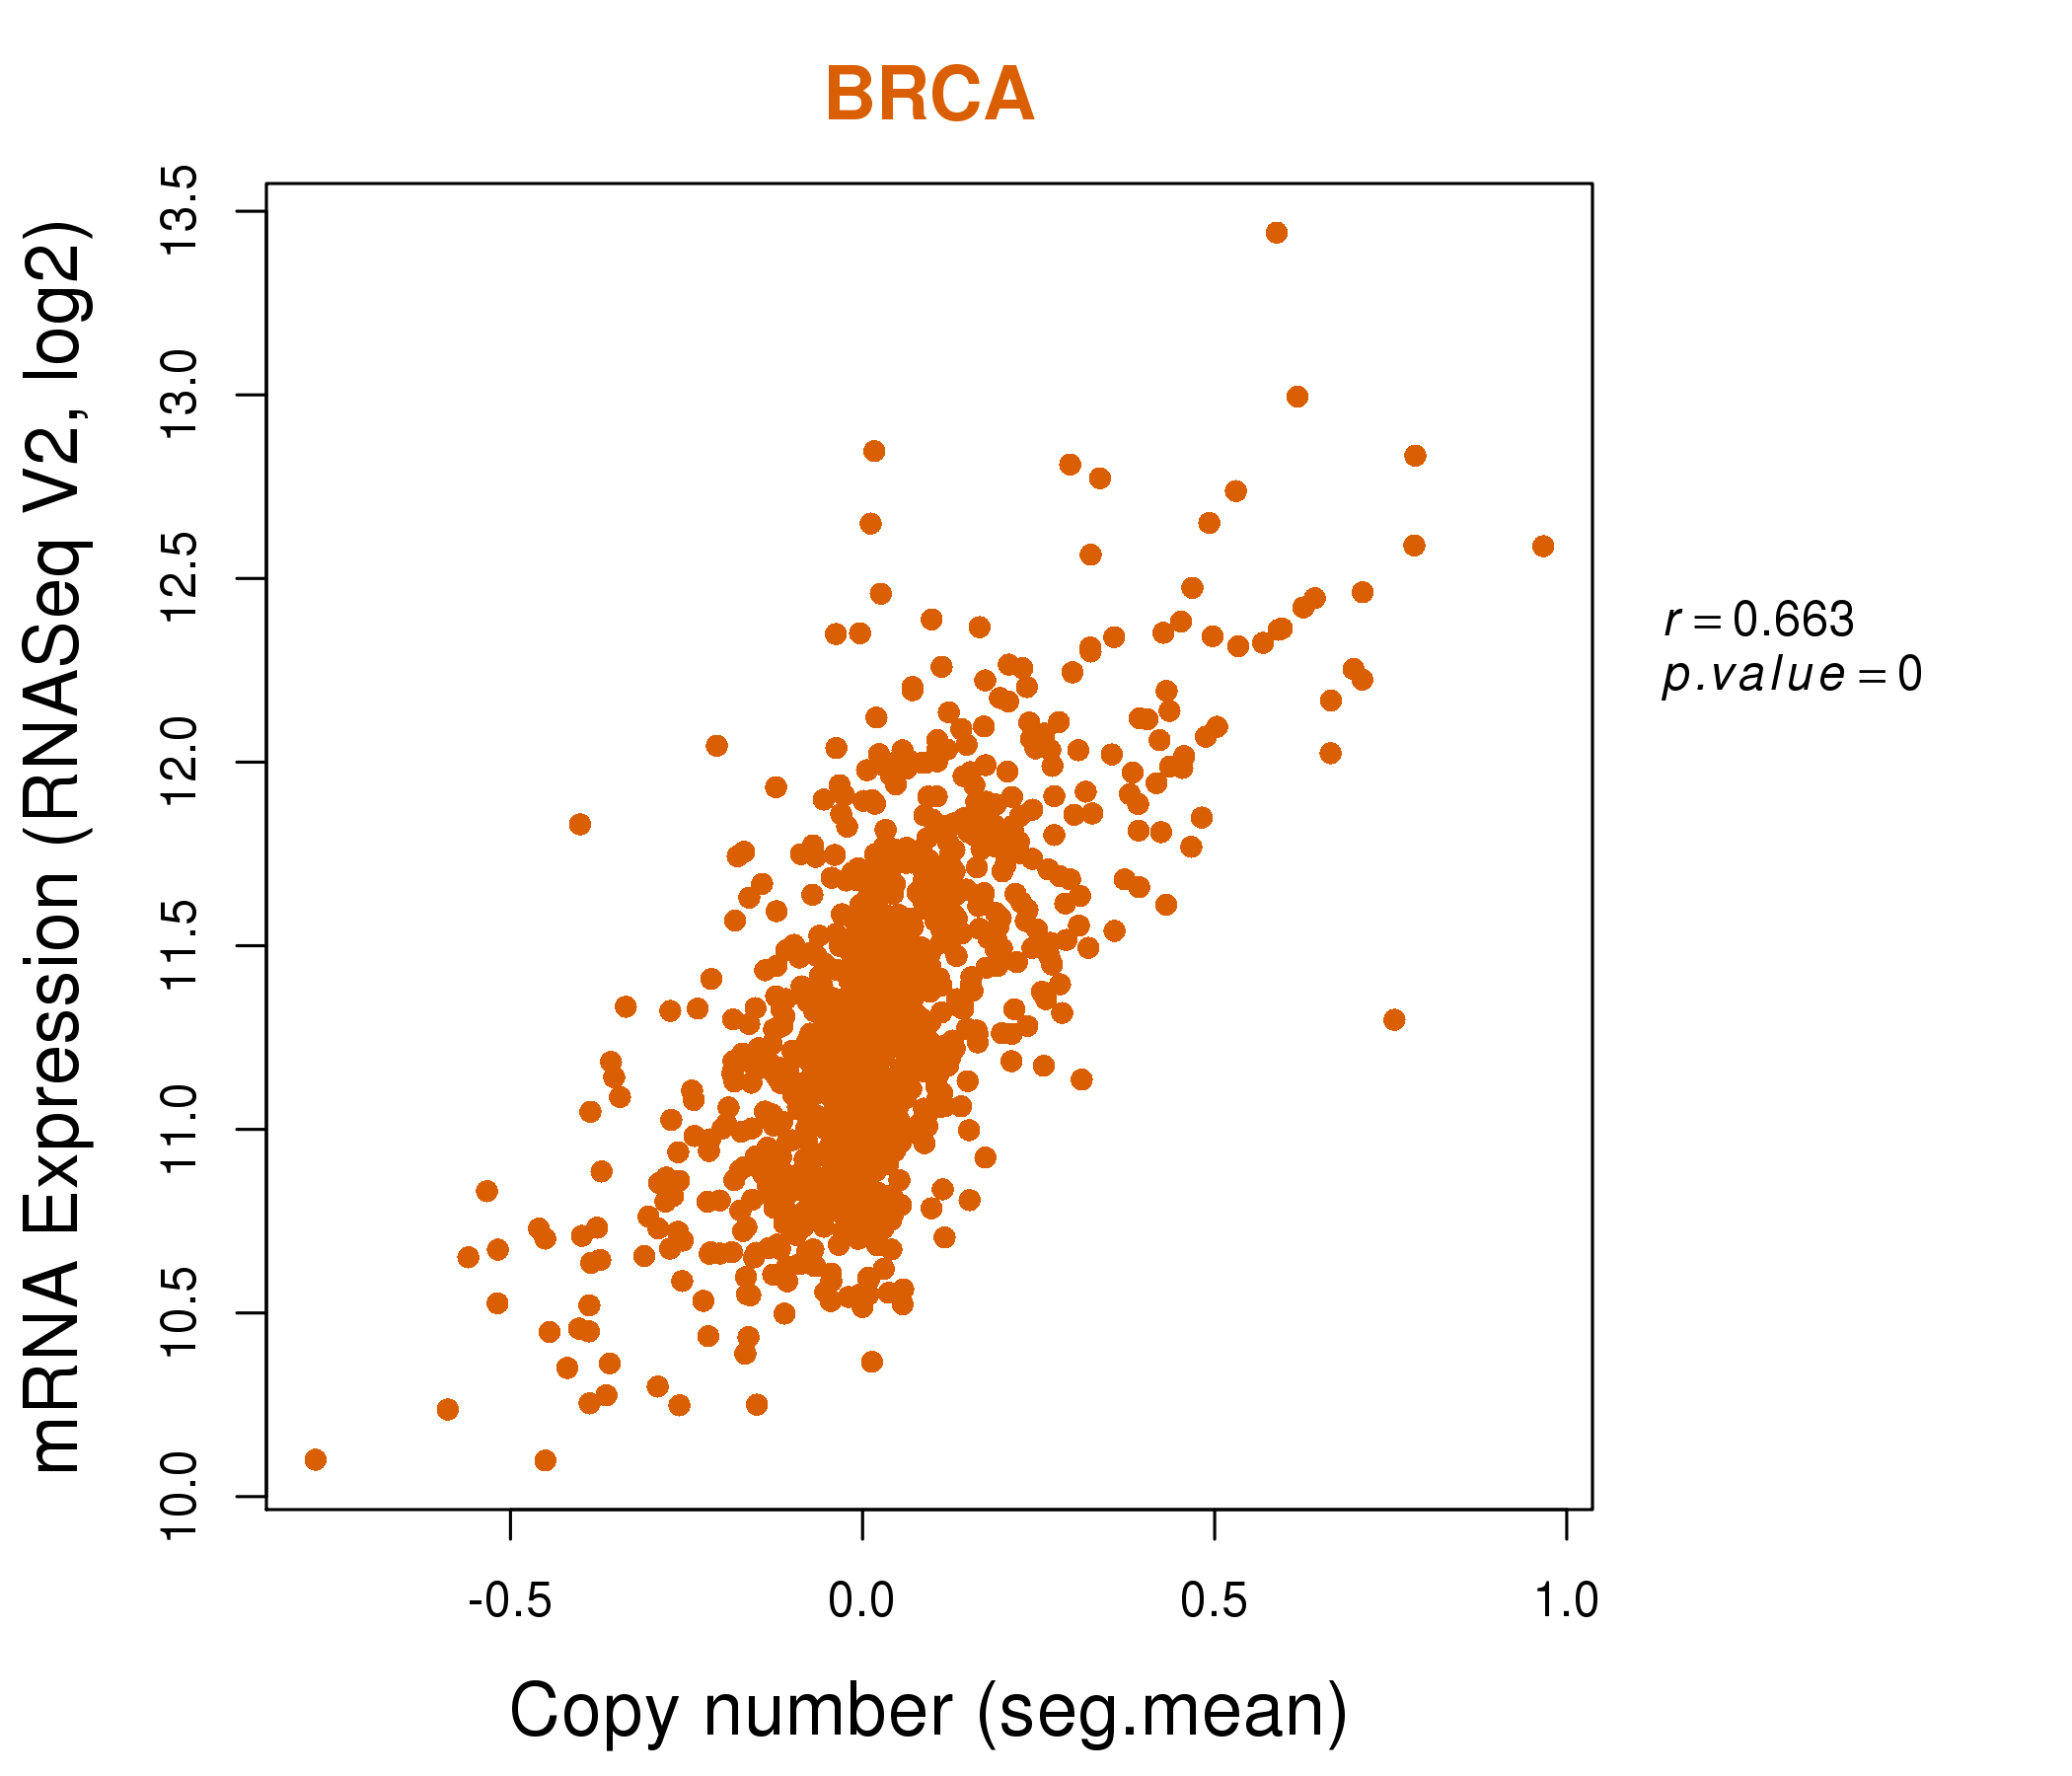
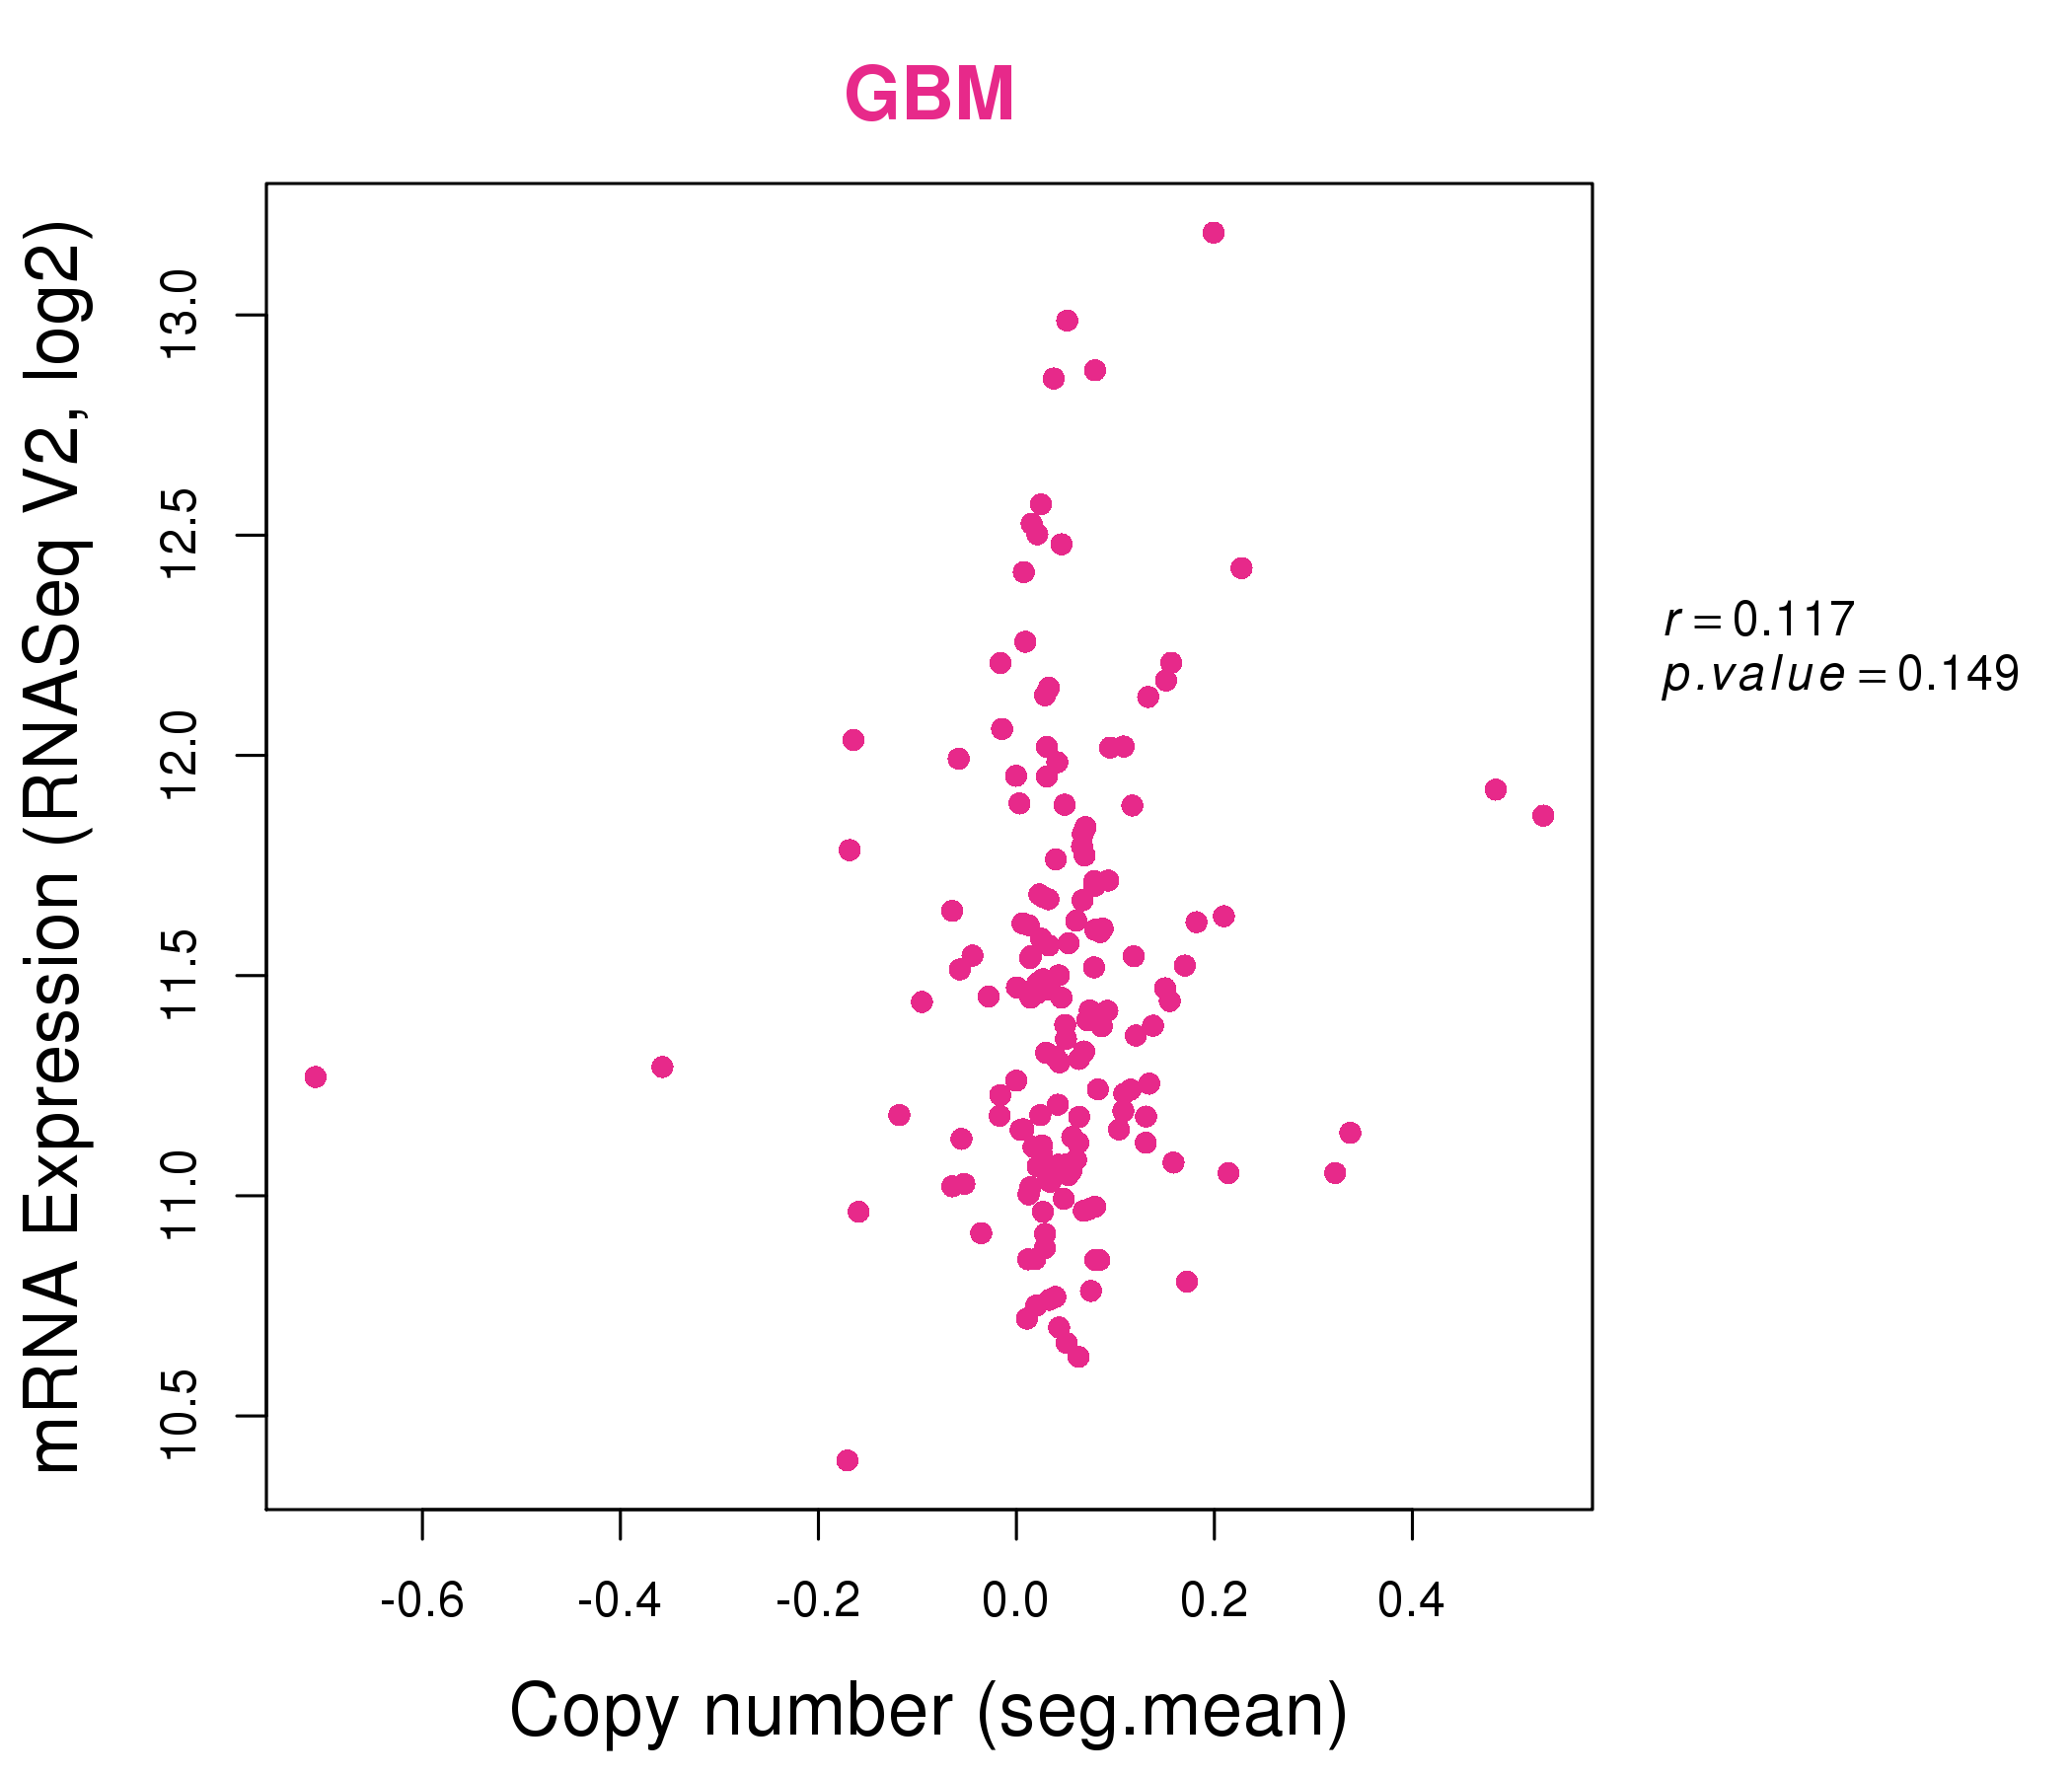
| * This plots show the correlation between CNV and gene expression. |
: Open all plots for all cancer types
 |
|
 |
|
| Top |
| Gene-Gene Network Information |
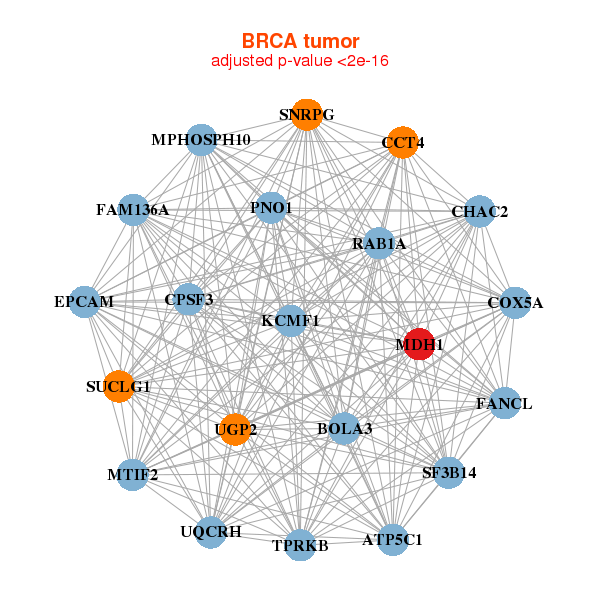
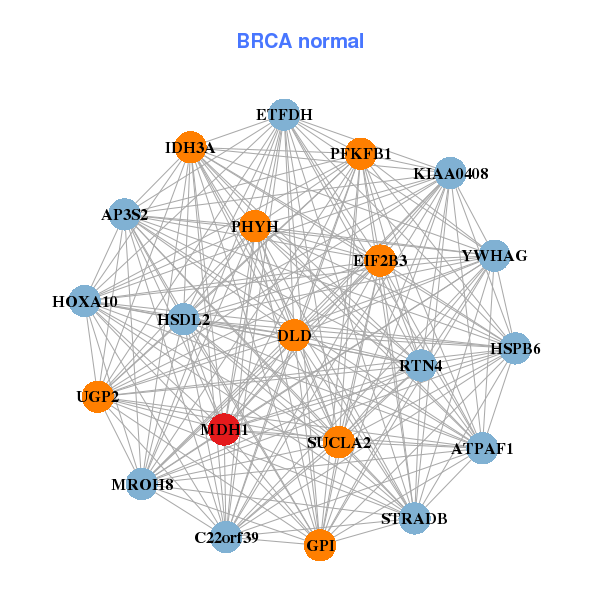
| * Co-Expression network figures were drawn using R package igraph. Only the top 20 genes with the highest correlations were shown. Red circle: input gene, orange circle: cell metabolism gene, sky circle: other gene |
: Open all plots for all cancer types
 |
| ||||
| ATP5C1,BOLA3,CCT4,CHAC2,COX5A,CPSF3,EPCAM, FAM136A,FANCL,KCMF1,MDH1,MPHOSPH10,MTIF2,PNO1, RAB1A,SF3B14,SNRPG,SUCLG1,TPRKB,UGP2,UQCRH | AP3S2,ATPAF1,MROH8,C22orf39,DLD,EIF2B3,ETFDH, GPI,HOXA10,HSDL2,HSPB6,IDH3A,KIAA0408,MDH1, PFKFB1,PHYH,RTN4,STRADB,SUCLA2,UGP2,YWHAG | ||||
 |
| ||||
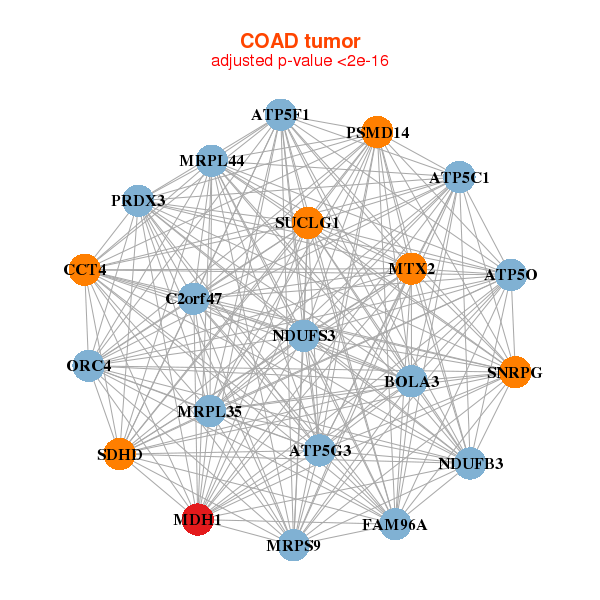
| ATP5C1,ATP5F1,ATP5G3,ATP5O,BOLA3,C2orf47,CCT4, FAM96A,MDH1,MRPL35,MRPL44,MRPS9,MTX2,NDUFB3, NDUFS3,ORC4,PRDX3,PSMD14,SDHD,SNRPG,SUCLG1 | ARMC1,COQ3,CRYZL1,ESD,COX20,FRG1,FUNDC2, KATNA1,MDH1,MOCS2,MYL6,NDUFA8,NDUFS5,PCMT1, PRKRA,RWDD2B,SEPHS1,SNX3,SPOP,UQCRB,VDAC3 |
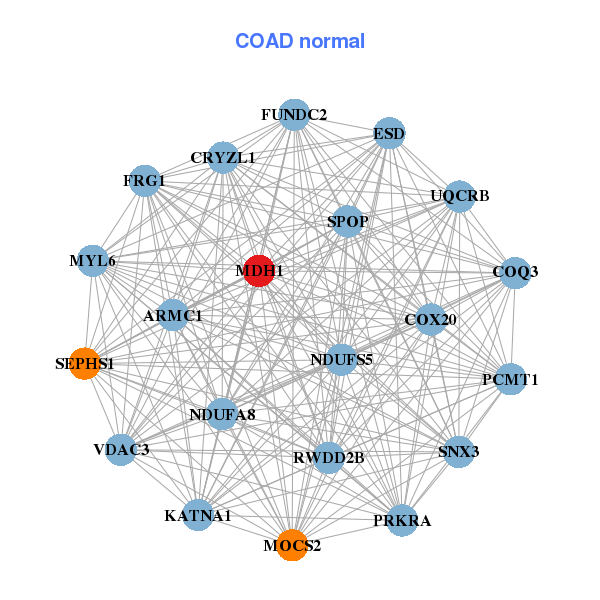
| * Co-Expression network figures were drawn using R package igraph. Only the top 20 genes with the highest correlations were shown. Red circle: input gene, orange circle: cell metabolism gene, sky circle: other gene |
: Open all plots for all cancer types
| Top |
: Open all interacting genes' information including KEGG pathway for all interacting genes from DAVID
| Top |
| Pharmacological Information for MDH1 |
| DB Category | DB Name | DB's ID and Url link |
| Chemistry | BindingDB | P40925; -. |
| Chemistry | ChEMBL | CHEMBL3560; -. |
| Organism-specific databases | PharmGKB | PA30714; -. |
| Organism-specific databases | CTD | 4190; -. |
| * Gene Centered Interaction Network. |
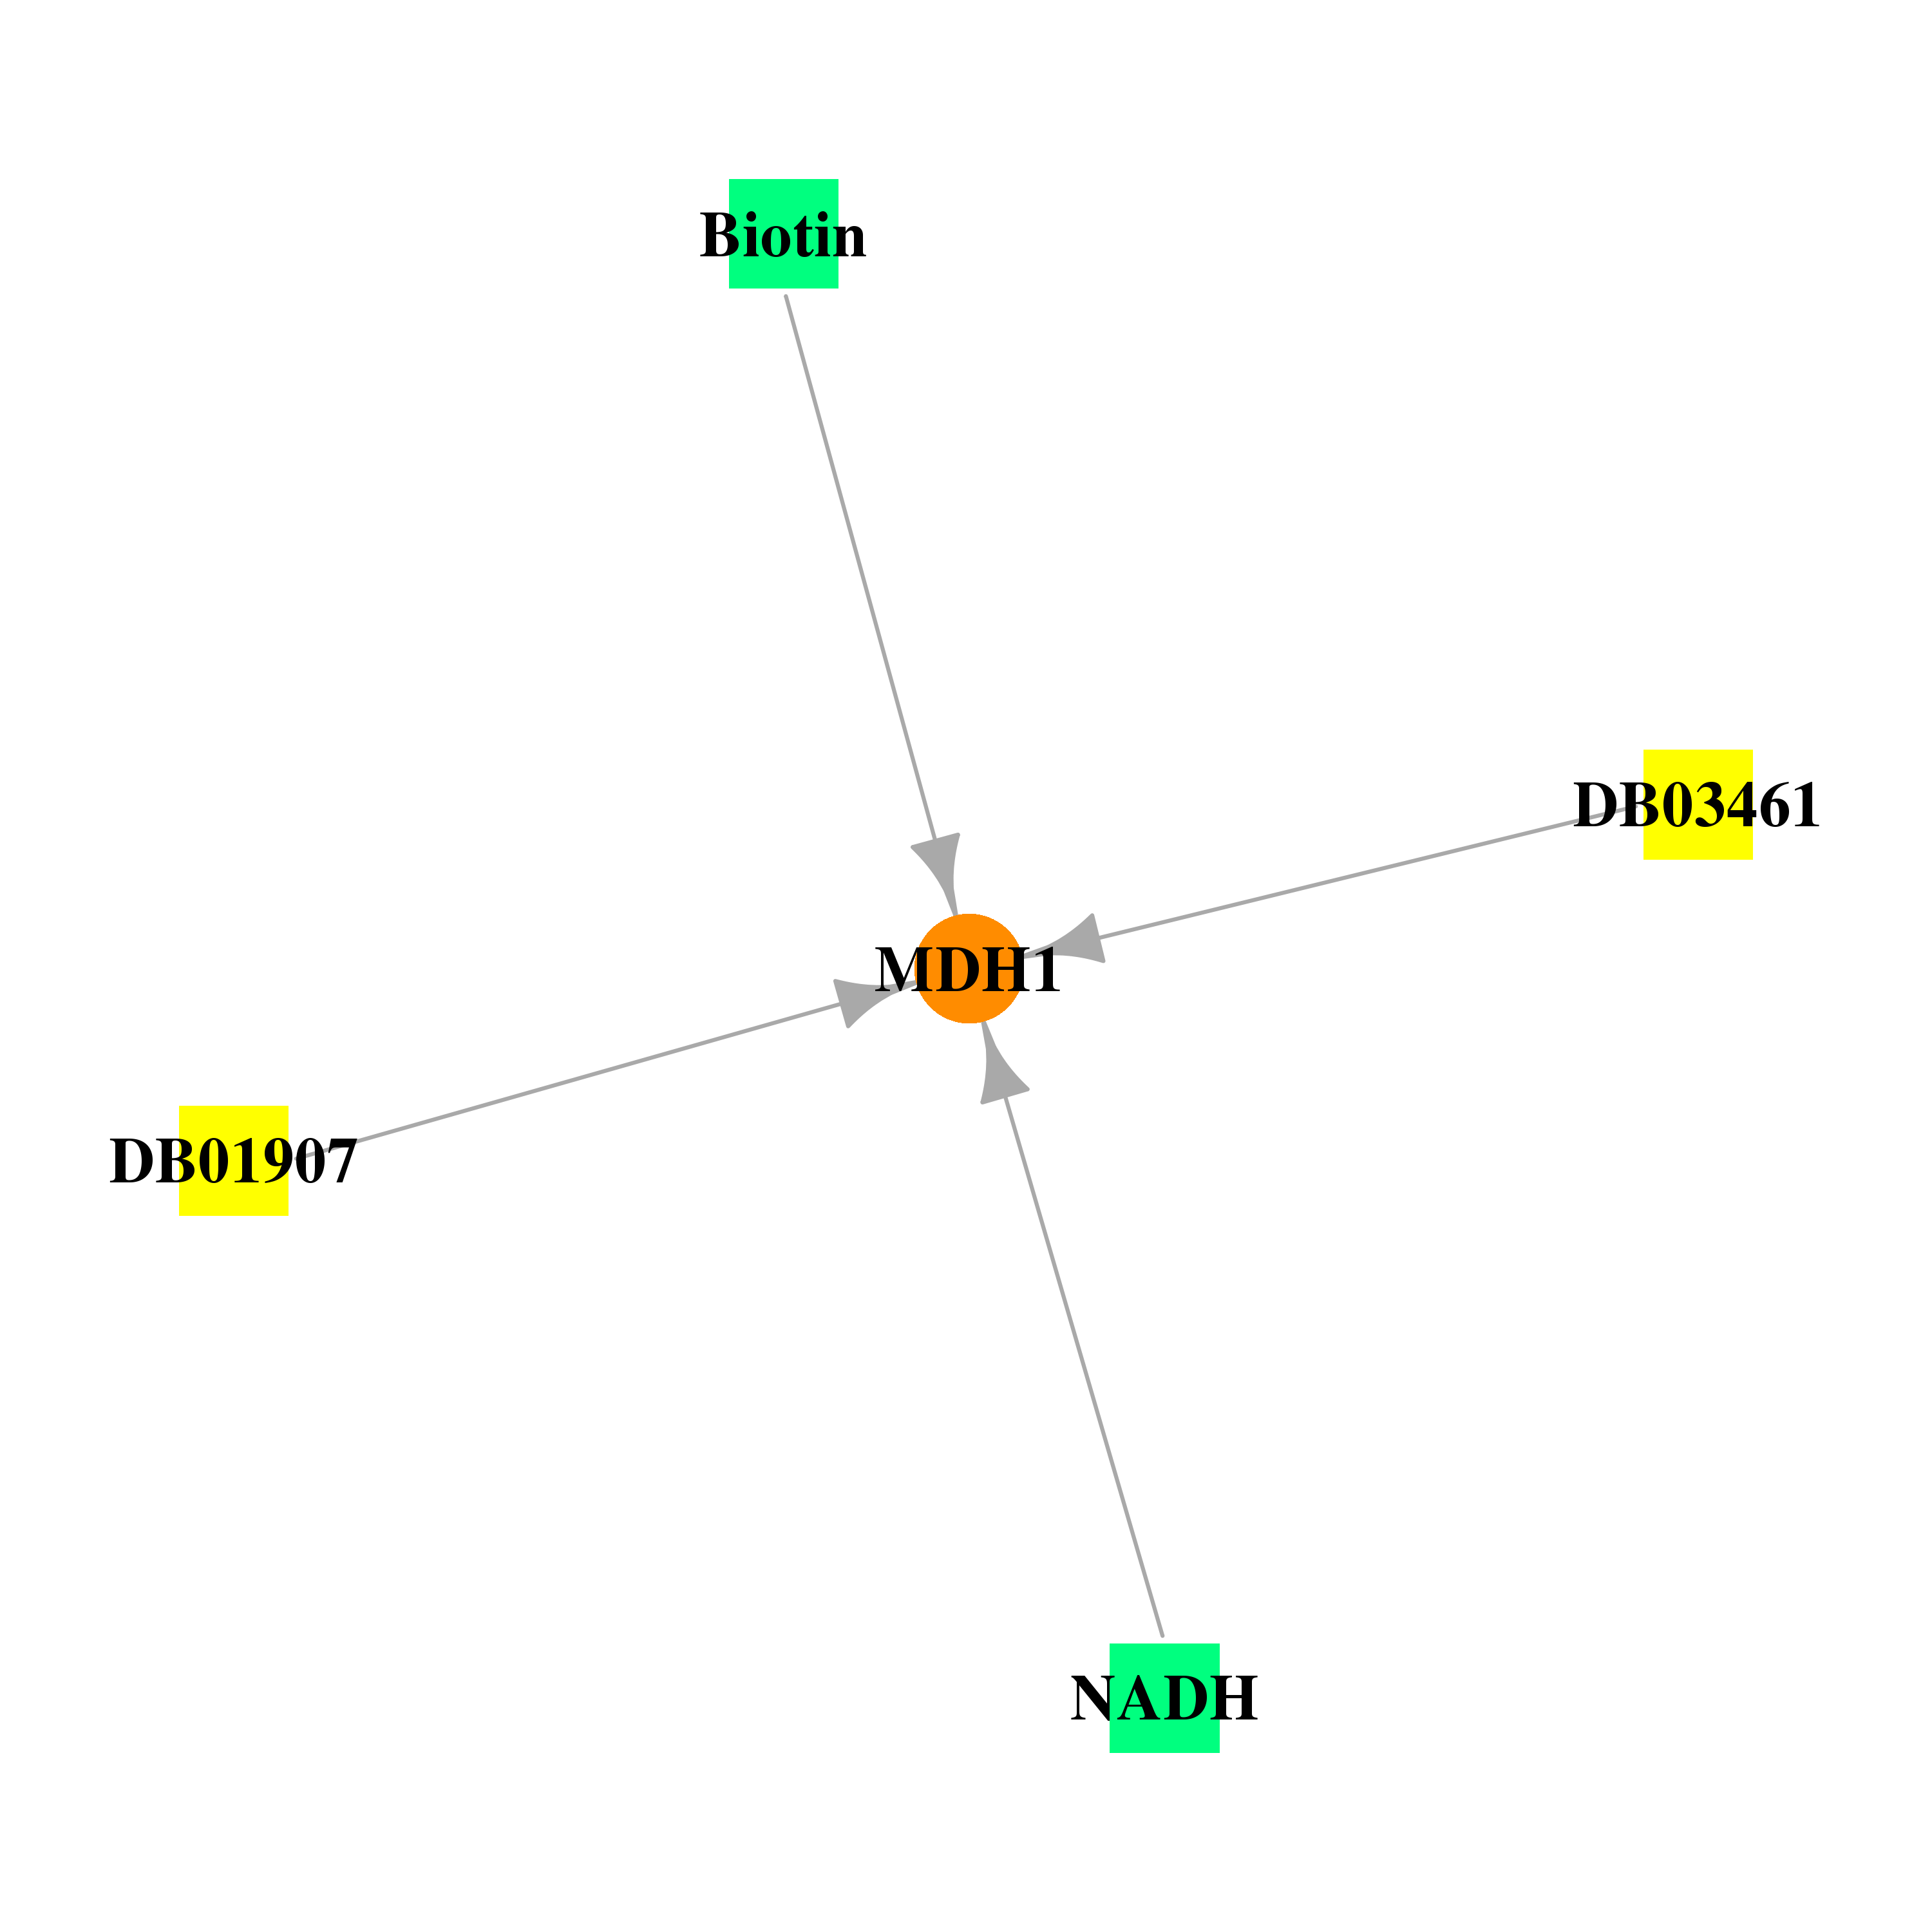 |
| * Drug Centered Interaction Network. |
| DrugBank ID | Target Name | Drug Groups | Generic Name | Drug Centered Network | Drug Structure |
| DB00157 | malate dehydrogenase 1, NAD (soluble) | approved; nutraceutical | NADH |  |  |
| DB01907 | malate dehydrogenase 1, NAD (soluble) | experimental | Nicotinamide-Adenine-Dinucleotide | 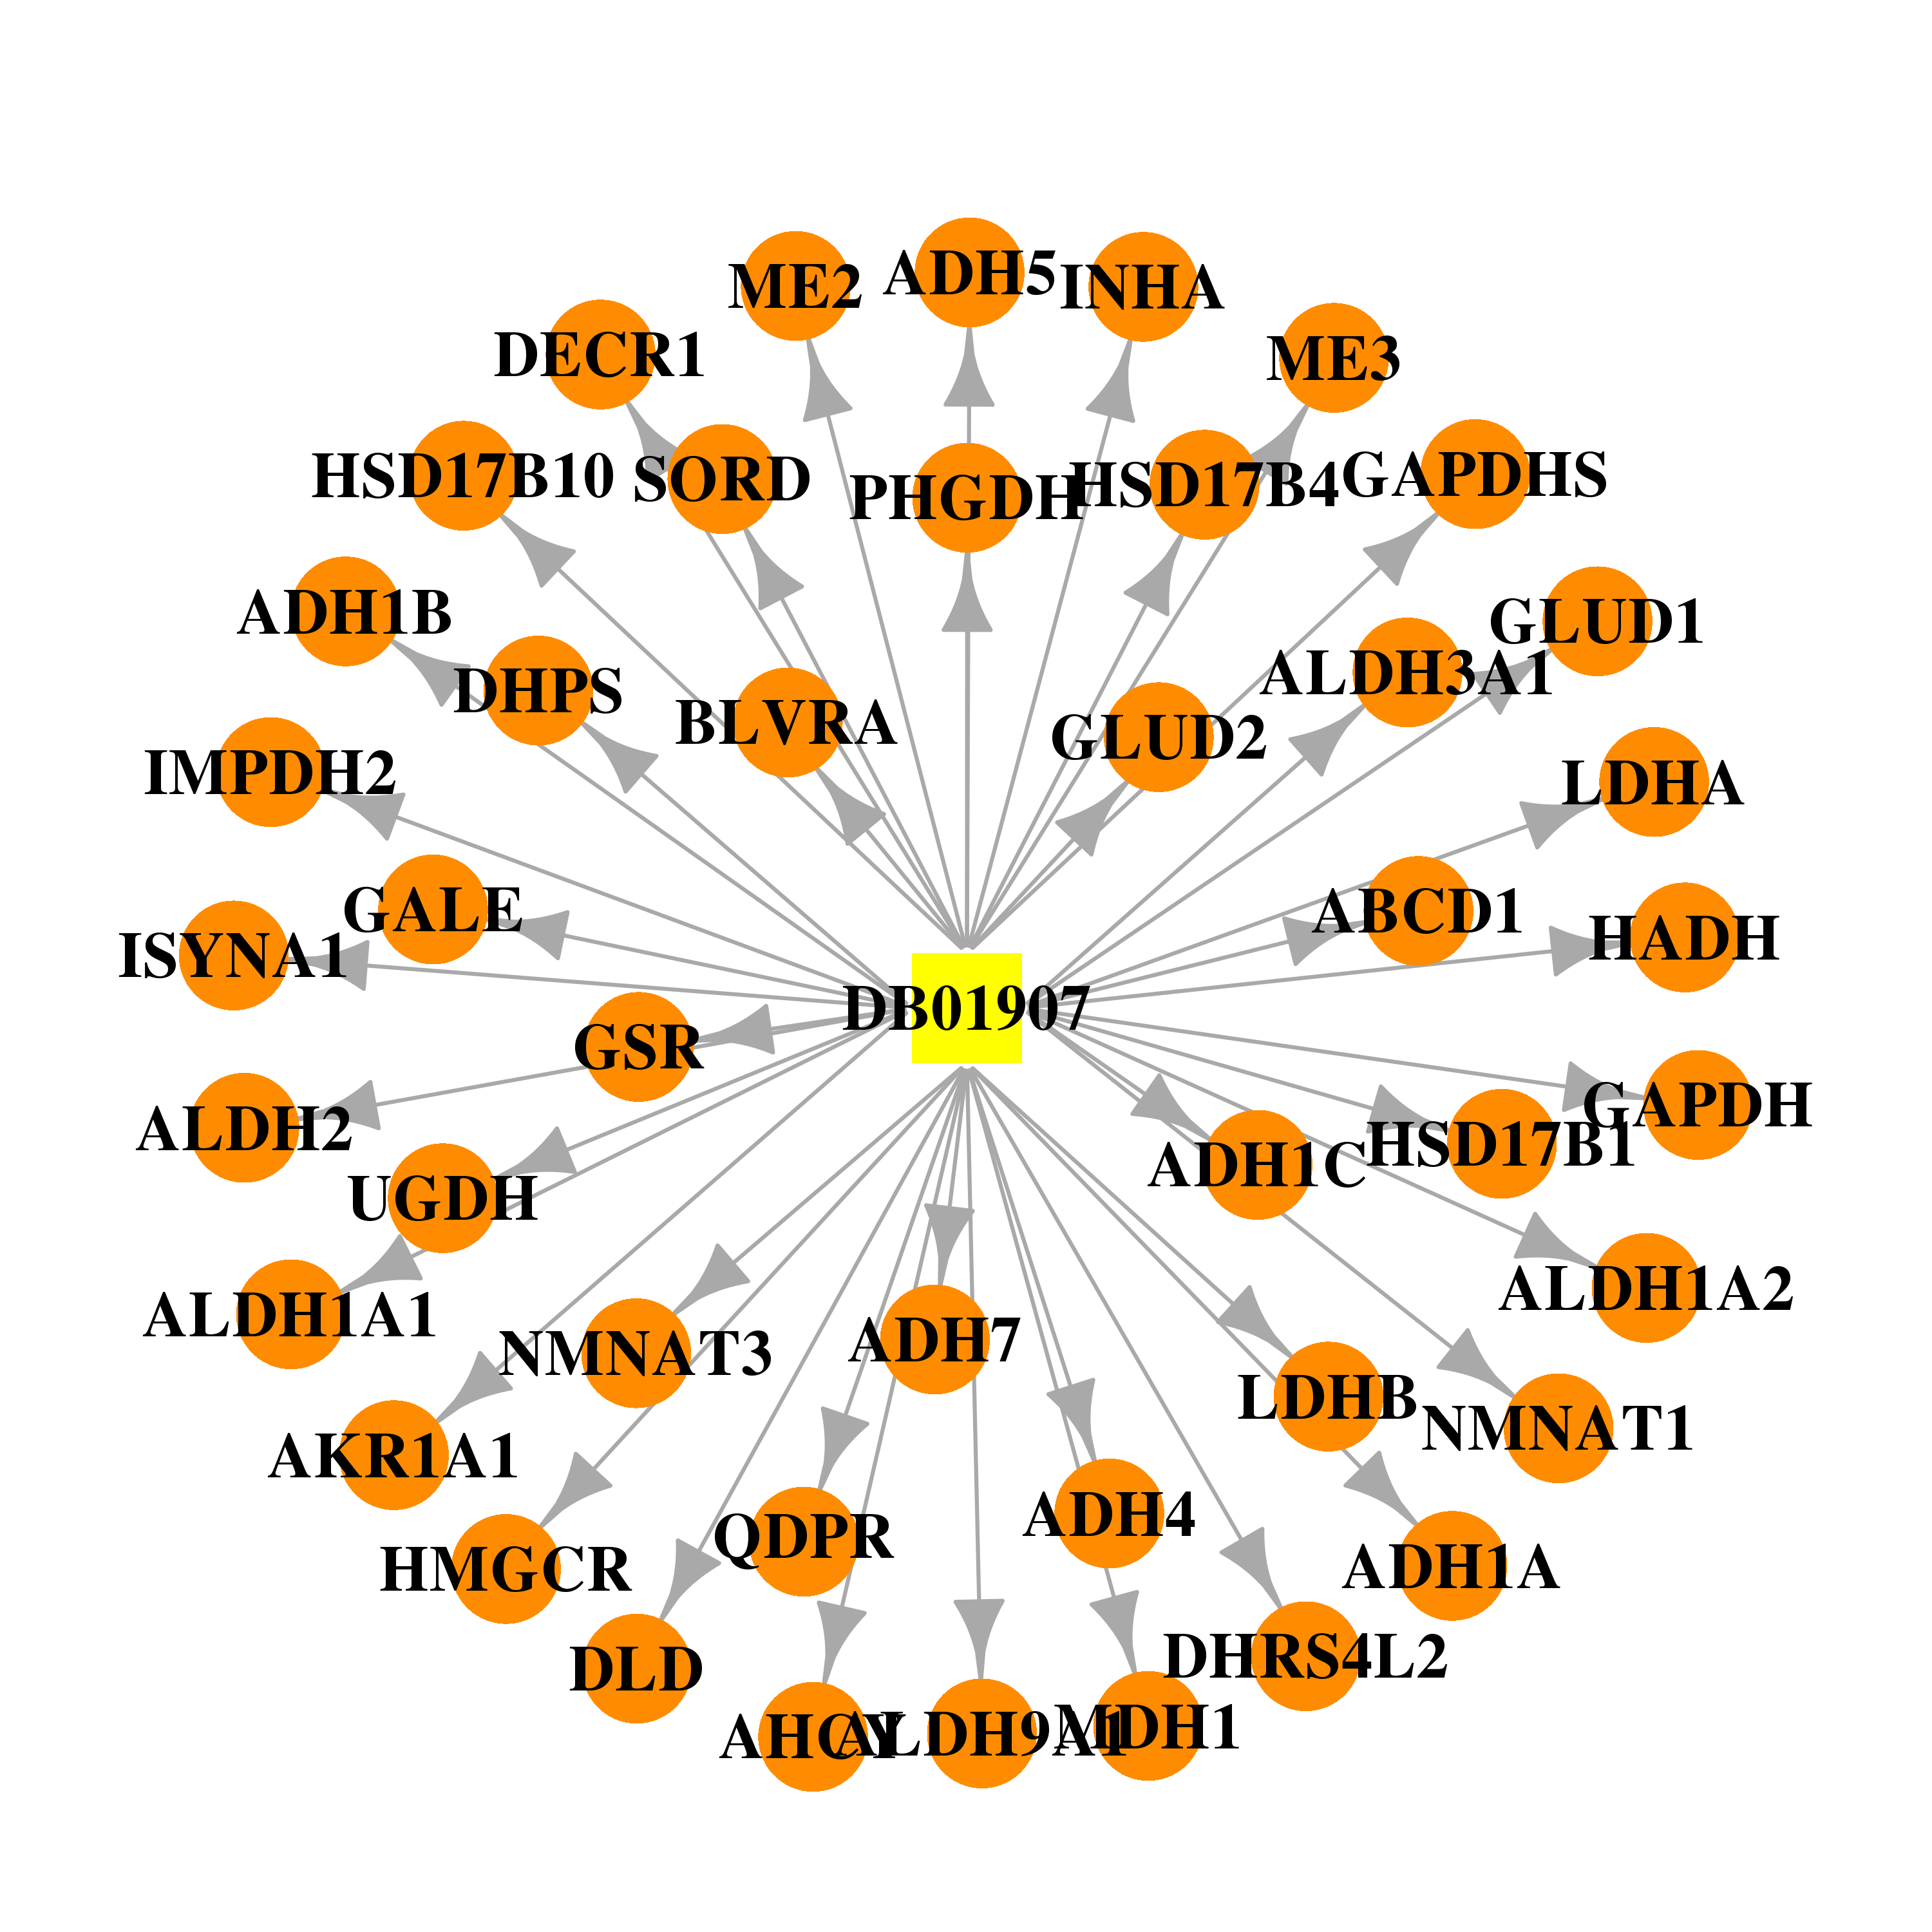 |  |
| DB03461 | malate dehydrogenase 1, NAD (soluble) | experimental | 2'-Monophosphoadenosine 5'-Diphosphoribose | 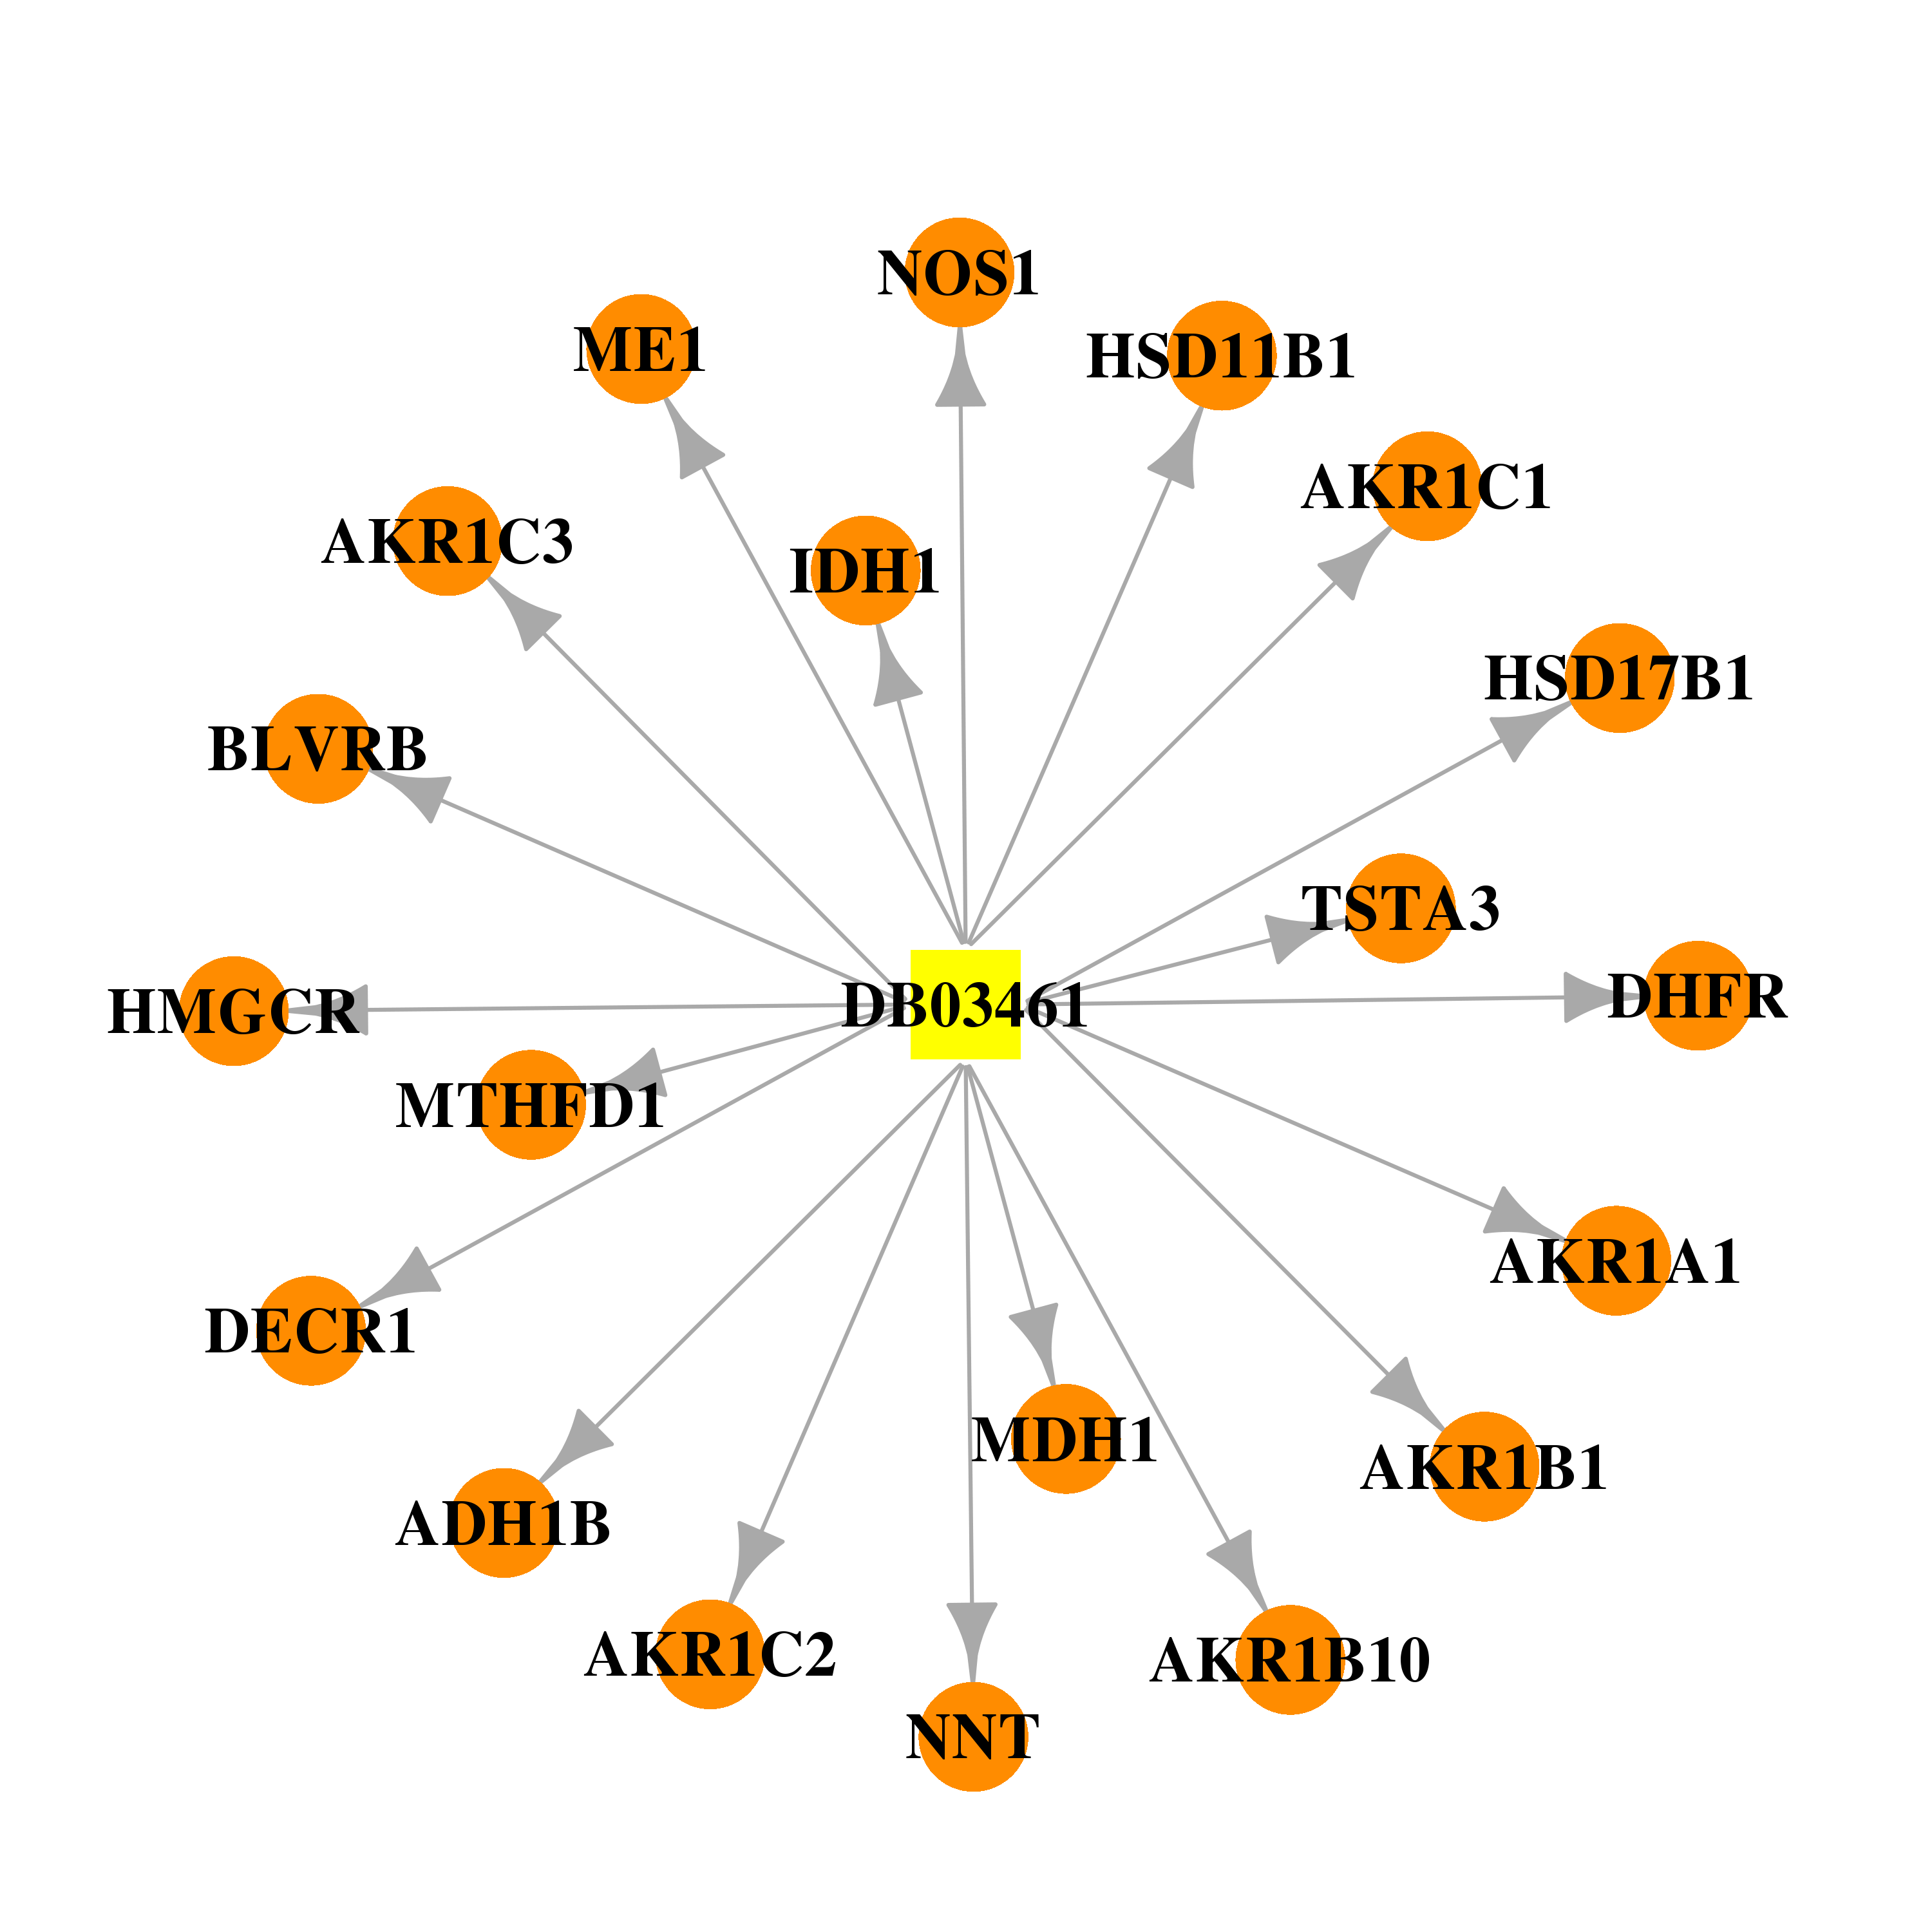 |  |
| DB00121 | malate dehydrogenase 1, NAD (soluble) | approved; nutraceutical | Biotin | 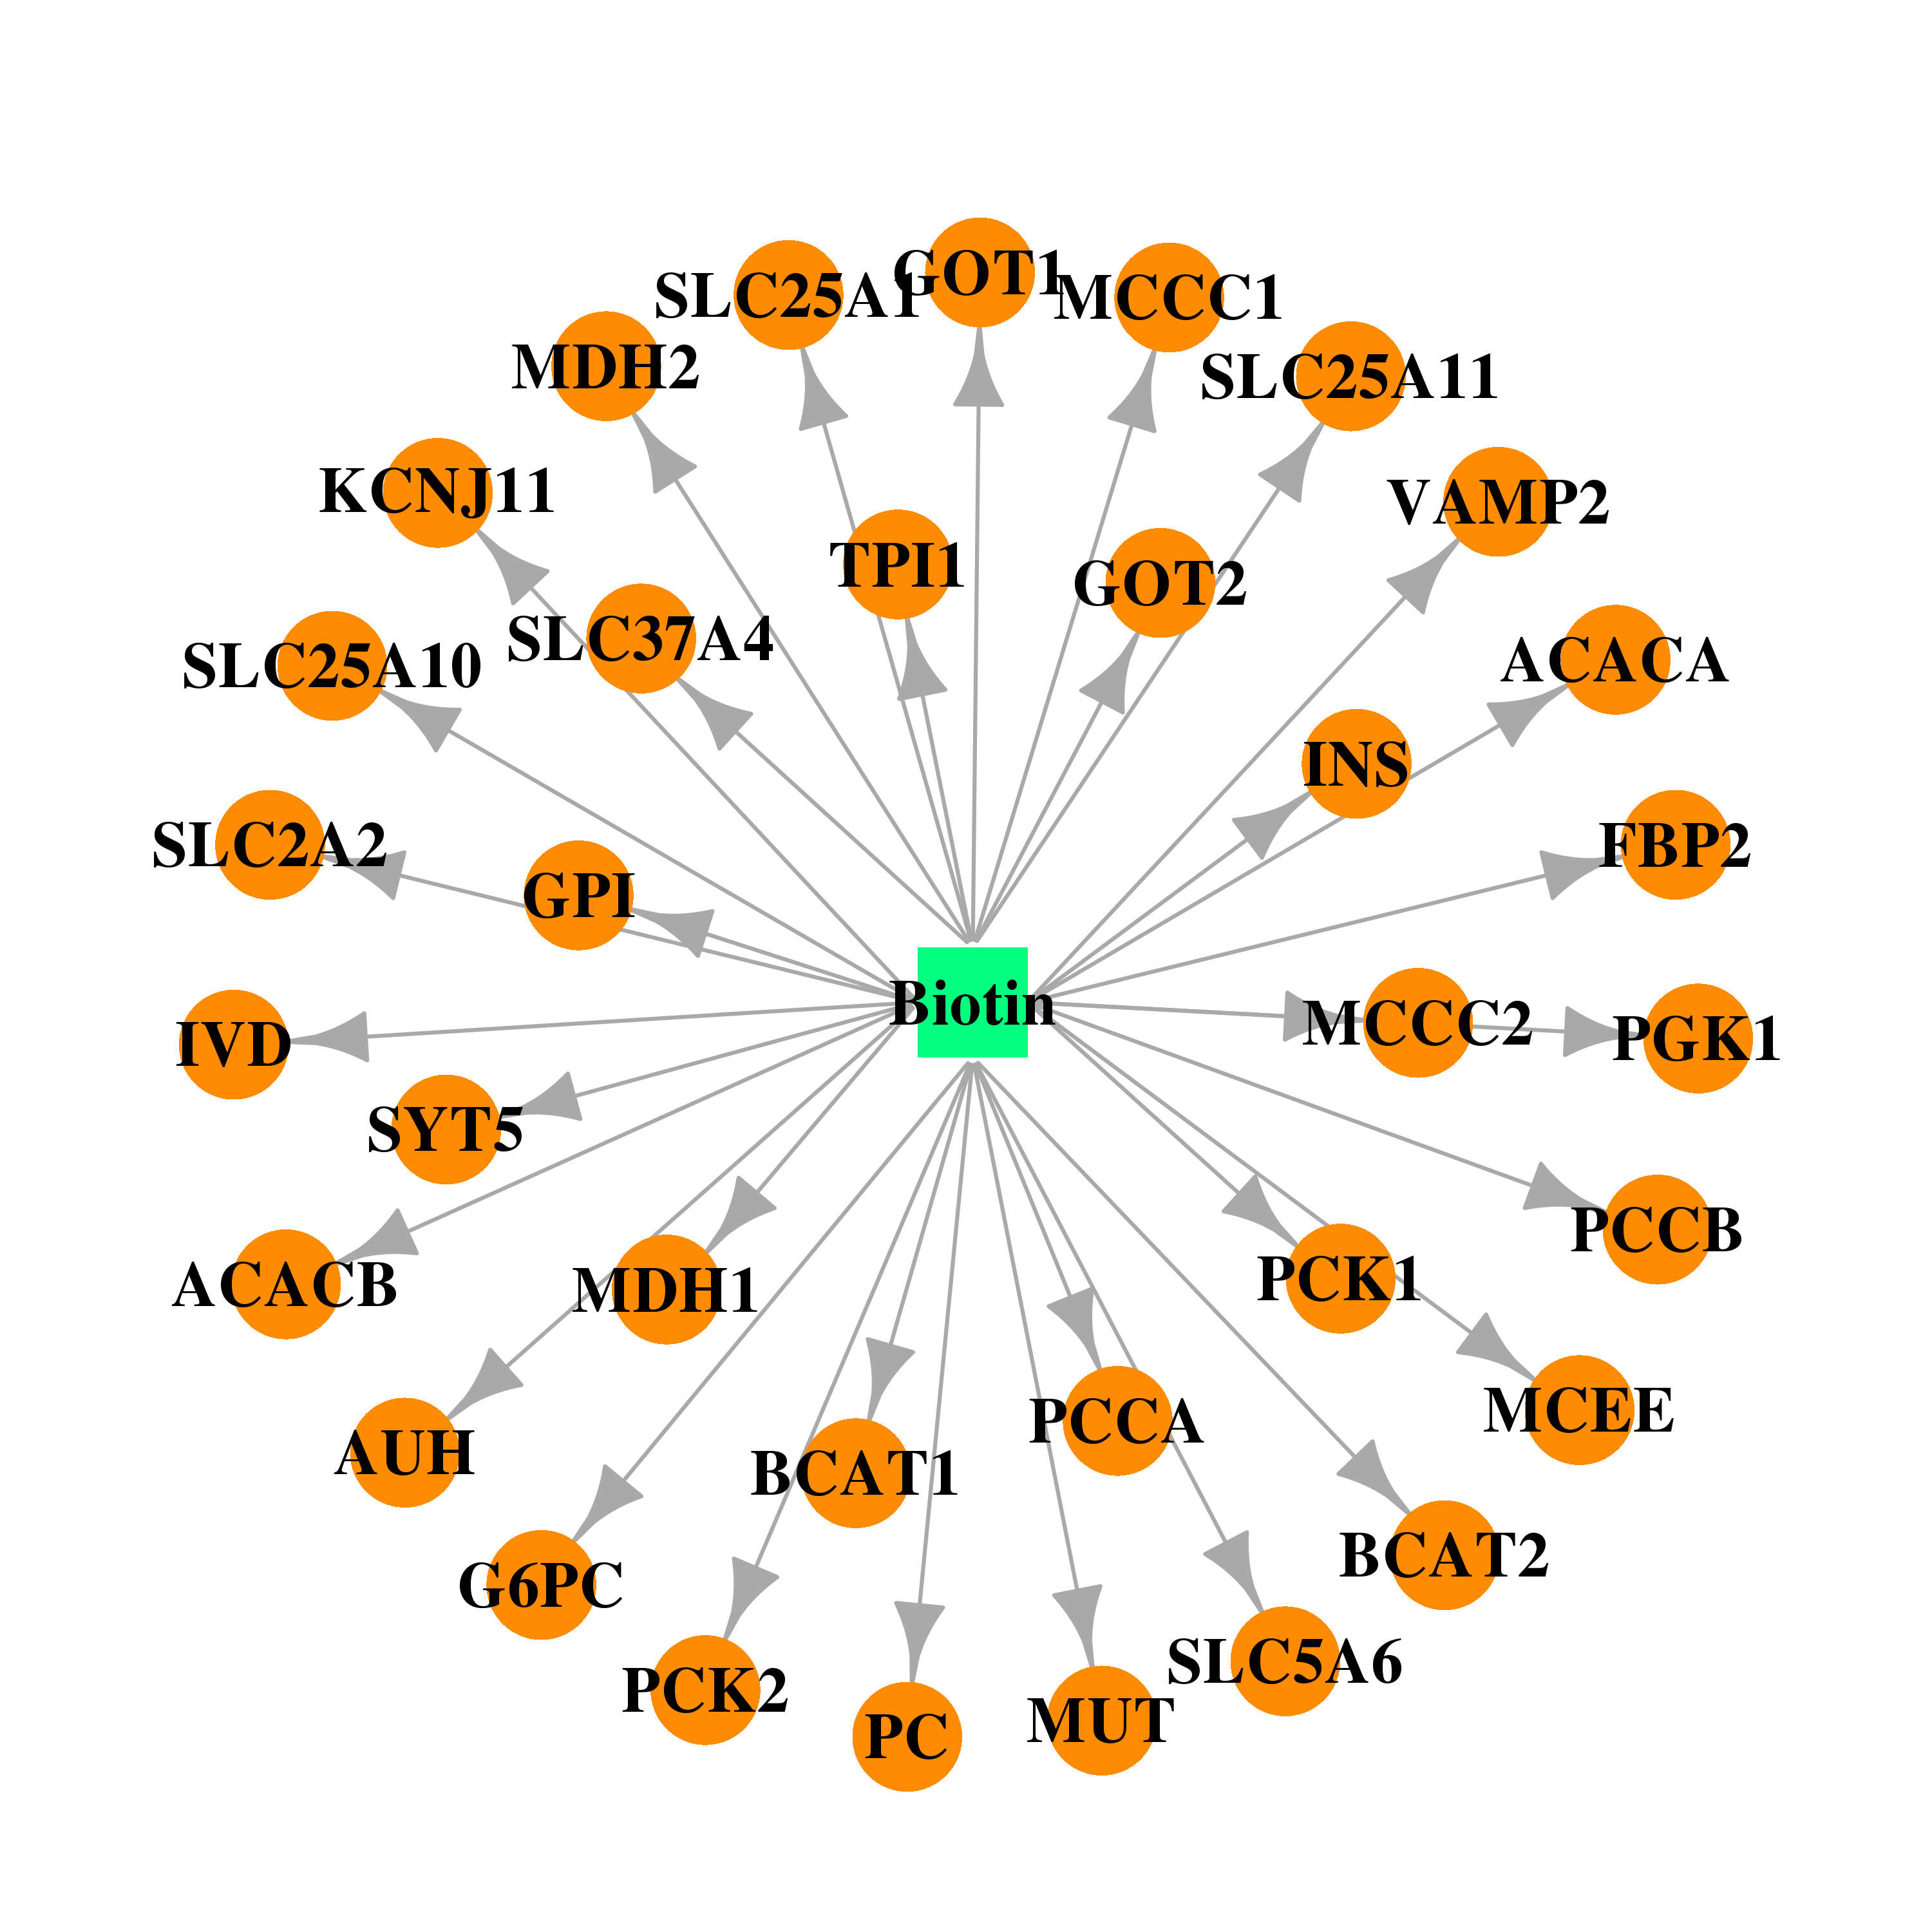 |  |
| Top |
| Cross referenced IDs for MDH1 |
| * We obtained these cross-references from Uniprot database. It covers 150 different DBs, 18 categories. http://www.uniprot.org/help/cross_references_section |
: Open all cross reference information
|
Copyright © 2016-Present - The Univsersity of Texas Health Science Center at Houston @ |