|
|||||||||||||||||||||||||||||||||||||||||||||||||||||||||||||||||||||||||||||||||||||||||||||||||||||||||||||||||||||||||||||||||||||||||||||||||||||||||||||||||||||||||||||||||||||||||||||||||||||||||||||||||||||||||||||||||||||||||||||||||||||||||||||||||||||||||||||||||||||||||||||||||||||||||||||||||||||||||||||||||||||||||||||||||||||||||
| |
| Phenotypic Information (metabolism pathway, cancer, disease, phenome) |
| |
| |
| Gene-Gene Network Information: Co-Expression Network, Interacting Genes & KEGG |
| |
|


| Gene Summary for MDH2 |
| Top |
| Phenotypic Information for MDH2(metabolism pathway, cancer, disease, phenome) |
| Cancer | CGAP: MDH2 |
| Familial Cancer Database: MDH2 | |
| * This gene is included in those cancer gene databases. |
|
|
|
|
|
|
| |||||||||||||||||||||||||||||||||||||||||||||||||||||||||||||||||||||||||||||||||||||||||||||||||||||||||||||||||||||||||||||||||||||||||||||||||||||||||||||||||||||||||||||||||||||||||||||||||||||||||||||||||||||||||||||||||||||||||||||||||||||||||||||||||||||||||||||||||||||||||||||||||||||||||||||||||||||||||||||||||||||||||||||||||||
Oncogene 1 | Significant driver gene in | ||||||||||||||||||||||||||||||||||||||||||||||||||||||||||||||||||||||||||||||||||||||||||||||||||||||||||||||||||||||||||||||||||||||||||||||||||||||||||||||||||||||||||||||||||||||||||||||||||||||||||||||||||||||||||||||||||||||||||||||||||||||||||||||||||||||||||||||||||||||||||||||||||||||||||||||||||||||||||||||||||||||||||||||||||||||||
| cf) number; DB name 1 Oncogene; http://nar.oxfordjournals.org/content/35/suppl_1/D721.long, 2 Tumor Suppressor gene; https://bioinfo.uth.edu/TSGene/, 3 Cancer Gene Census; http://www.nature.com/nrc/journal/v4/n3/abs/nrc1299.html, 4 CancerGenes; http://nar.oxfordjournals.org/content/35/suppl_1/D721.long, 5 Network of Cancer Gene; http://ncg.kcl.ac.uk/index.php, 1Therapeutic Vulnerabilities in Cancer; http://cbio.mskcc.org/cancergenomics/statius/ |
| KEGG_PYRUVATE_METABOLISM KEGG_GLYOXYLATE_AND_DICARBOXYLATE_METABOLISM REACTOME_PYRUVATE_METABOLISM_AND_CITRIC_ACID_TCA_CYCLE REACTOME_METABOLISM_OF_CARBOHYDRATES REACTOME_GLUCOSE_METABOLISM | |
| OMIM | |
| Orphanet | |
| Disease | KEGG Disease: MDH2 |
| MedGen: MDH2 (Human Medical Genetics with Condition) | |
| ClinVar: MDH2 | |
| Phenotype | MGI: MDH2 (International Mouse Phenotyping Consortium) |
| PhenomicDB: MDH2 | |
| Mutations for MDH2 |
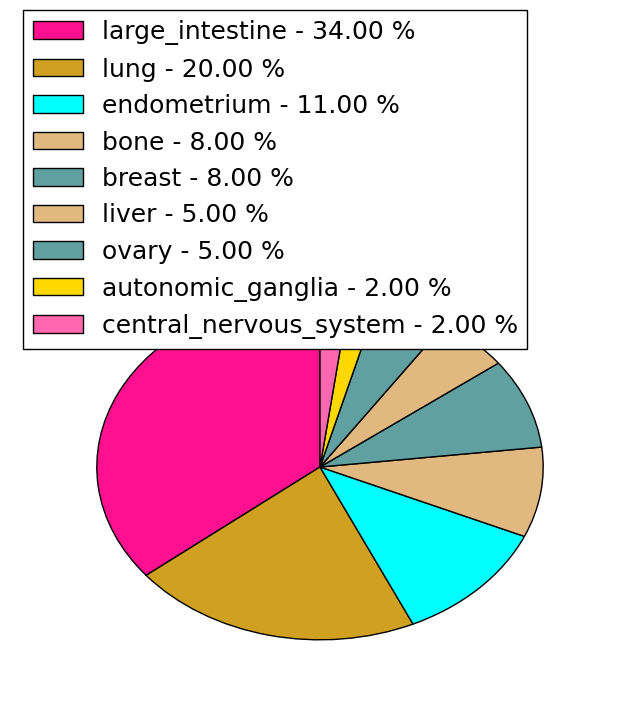
| * Under tables are showing count per each tissue to give us broad intuition about tissue specific mutation patterns.You can go to the detailed page for each mutation database's web site. |
| - Statistics for Tissue and Mutation type | Top |
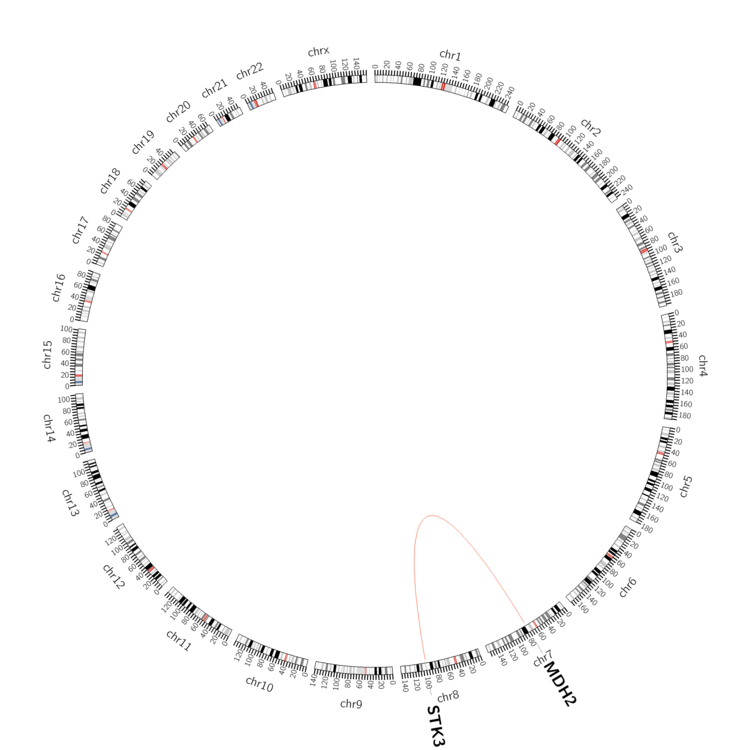 |
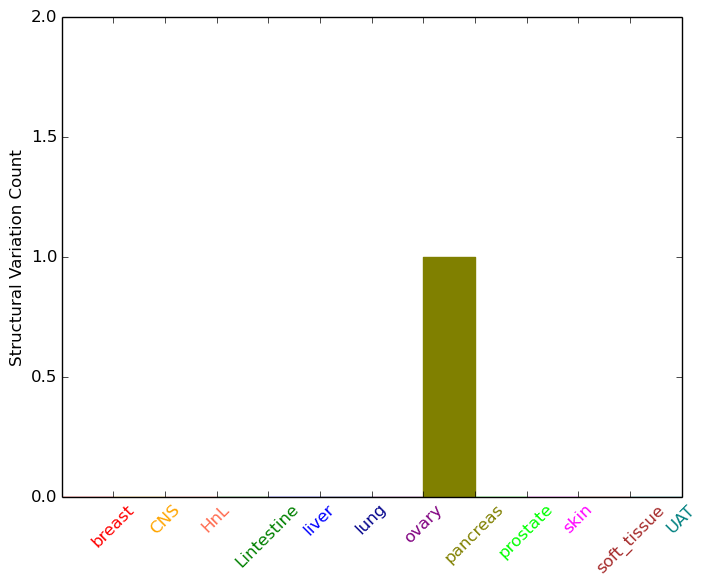
| - For Inter-chromosomal Variations |
| * Inter-chromosomal variantions includes 'interchromosomal amplicon to amplicon', 'interchromosomal amplicon to non-amplified dna', 'interchromosomal insertion', 'Interchromosomal unknown type'. |
 |
| - For Intra-chromosomal Variations |
| There's no intra-chromosomal structural variation. |
| Sample | Symbol_a | Chr_a | Start_a | End_a | Symbol_b | Chr_b | Start_b | End_b |
| pancreas | MDH2 | chr7 | 75689245 | 75689265 | STK3 | chr8 | 99623537 | 99623557 |
| cf) Tissue number; Tissue name (1;Breast, 2;Central_nervous_system, 3;Haematopoietic_and_lymphoid_tissue, 4;Large_intestine, 5;Liver, 6;Lung, 7;Ovary, 8;Pancreas, 9;Prostate, 10;Skin, 11;Soft_tissue, 12;Upper_aerodigestive_tract) |
| * From mRNA Sanger sequences, Chitars2.0 arranged chimeric transcripts. This table shows MDH2 related fusion information. |
| ID | Head Gene | Tail Gene | Accession | Gene_a | qStart_a | qEnd_a | Chromosome_a | tStart_a | tEnd_a | Gene_a | qStart_a | qEnd_a | Chromosome_a | tStart_a | tEnd_a |
| BP259062 | MDH2 | 1 | 234 | 7 | 75677424 | 75684260 | LOC100507412 | 229 | 448 | ? | 109556 | 109774 | |
| BF794536 | MDH2 | 24 | 102 | 7 | 75695601 | 75695679 | MDH2 | 91 | 340 | 7 | 75695658 | 75695908 | |
| Top |
| Mutation type/ Tissue ID | brca | cns | cerv | endome | haematopo | kidn | Lintest | liver | lung | ns | ovary | pancre | prost | skin | stoma | thyro | urina | |||
| Total # sample | 1 | |||||||||||||||||||
| GAIN (# sample) | 1 | |||||||||||||||||||
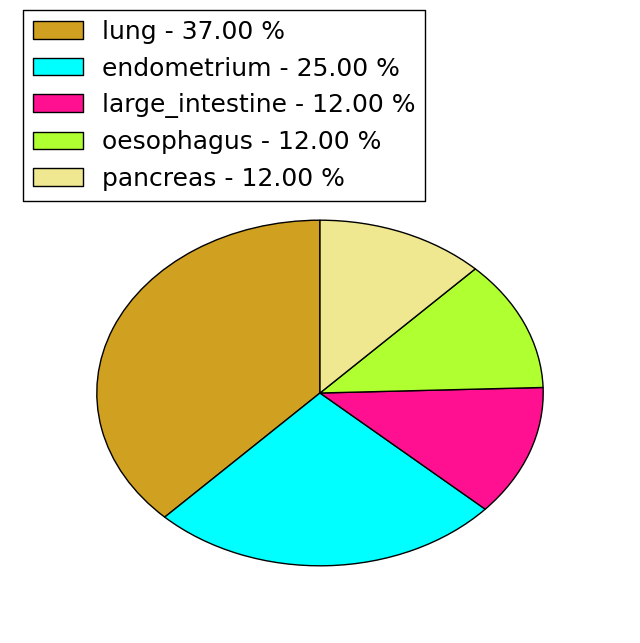
| LOSS (# sample) |
| cf) Tissue ID; Tissue type (1; Breast, 2; Central_nervous_system, 3; Cervix, 4; Endometrium, 5; Haematopoietic_and_lymphoid_tissue, 6; Kidney, 7; Large_intestine, 8; Liver, 9; Lung, 10; NS, 11; Ovary, 12; Pancreas, 13; Prostate, 14; Skin, 15; Stomach, 16; Thyroid, 17; Urinary_tract) |
| Top |
|
 |
| Top |
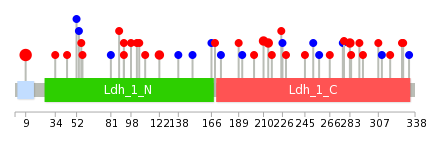
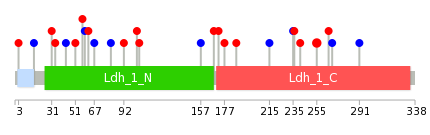
| Stat. for Non-Synonymous SNVs (# total SNVs=35) | (# total SNVs=8) |
 |  |
(# total SNVs=1) | (# total SNVs=0) |
 |
| Top |
| * When you move the cursor on each content, you can see more deailed mutation information on the Tooltip. Those are primary_site,primary_histology,mutation(aa),pubmedID. |
| GRCh37 position | Mutation(aa) | Unique sampleID count |
| chr7:75677504-75677504 | p.A9V | 9 |
| chr7:75692906-75692906 | p.S210C | 2 |
| chr7:75687331-75687331 | p.A122S | 2 |
| chr7:75693664-75693664 | p.P214L | 2 |
| chr7:75694234-75694234 | p.T283M | 2 |
| chr7:75686766-75686766 | p.G92C | 2 |
| chr7:75686807-75686807 | p.K105N | 1 |
| chr7:75695692-75695692 | p.I327M | 1 |
| chr7:75692882-75692882 | p.G202E | 1 |
| chr7:75684208-75684210 | p.L44delL | 1 |
| Top |
|
 |
| Point Mutation/ Tissue ID | 1 | 2 | 3 | 4 | 5 | 6 | 7 | 8 | 9 | 10 | 11 | 12 | 13 | 14 | 15 | 16 | 17 | 18 | 19 | 20 |
| # sample | 1 | 4 | 1 | 3 | 2 | 2 | 1 | 8 | 1 | 5 | ||||||||||
| # mutation | 1 | 4 | 1 | 3 | 2 | 2 | 1 | 8 | 1 | 5 | ||||||||||
| nonsynonymous SNV | 1 | 3 | 2 | 1 | 2 | 1 | 4 | 1 | 3 | |||||||||||
| synonymous SNV | 1 | 1 | 1 | 1 | 4 | 2 |
| cf) Tissue ID; Tissue type (1; BLCA[Bladder Urothelial Carcinoma], 2; BRCA[Breast invasive carcinoma], 3; CESC[Cervical squamous cell carcinoma and endocervical adenocarcinoma], 4; COAD[Colon adenocarcinoma], 5; GBM[Glioblastoma multiforme], 6; Glioma Low Grade, 7; HNSC[Head and Neck squamous cell carcinoma], 8; KICH[Kidney Chromophobe], 9; KIRC[Kidney renal clear cell carcinoma], 10; KIRP[Kidney renal papillary cell carcinoma], 11; LAML[Acute Myeloid Leukemia], 12; LUAD[Lung adenocarcinoma], 13; LUSC[Lung squamous cell carcinoma], 14; OV[Ovarian serous cystadenocarcinoma ], 15; PAAD[Pancreatic adenocarcinoma], 16; PRAD[Prostate adenocarcinoma], 17; SKCM[Skin Cutaneous Melanoma], 18:STAD[Stomach adenocarcinoma], 19:THCA[Thyroid carcinoma], 20:UCEC[Uterine Corpus Endometrial Carcinoma]) |
| Top |
| * We represented just top 10 SNVs. When you move the cursor on each content, you can see more deailed mutation information on the Tooltip. Those are primary_site, primary_histology, mutation(aa), pubmedID. |
| Genomic Position | Mutation(aa) | Unique sampleID count |
| chr7:75695601 | p.K255R,MDH2 | 2 |
| chr7:75689766 | p.D57H,MDH2 | 1 |
| chr7:75684232 | p.R215R,MDH2 | 1 |
| chr7:75689783 | p.L81L,MDH2 | 1 |
| chr7:75695631 | p.F235F,MDH2 | 1 |
| chr7:75684250 | p.G92C,MDH2 | 1 |
| chr7:75692874 | p.V236I,MDH2 | 1 |
| chr7:75695641 | p.P103S,MDH2 | 1 |
| chr7:75686735 | p.T241M,MDH2 | 1 |
| chr7:75692906 | p.K105N,MDH2 | 1 |
| * Copy number data were extracted from TCGA using R package TCGA-Assembler. The URLs of all public data files on TCGA DCC data server were gathered on Jan-05-2015. Function ProcessCNAData in TCGA-Assembler package was used to obtain gene-level copy number value which is calculated as the average copy number of the genomic region of a gene. |
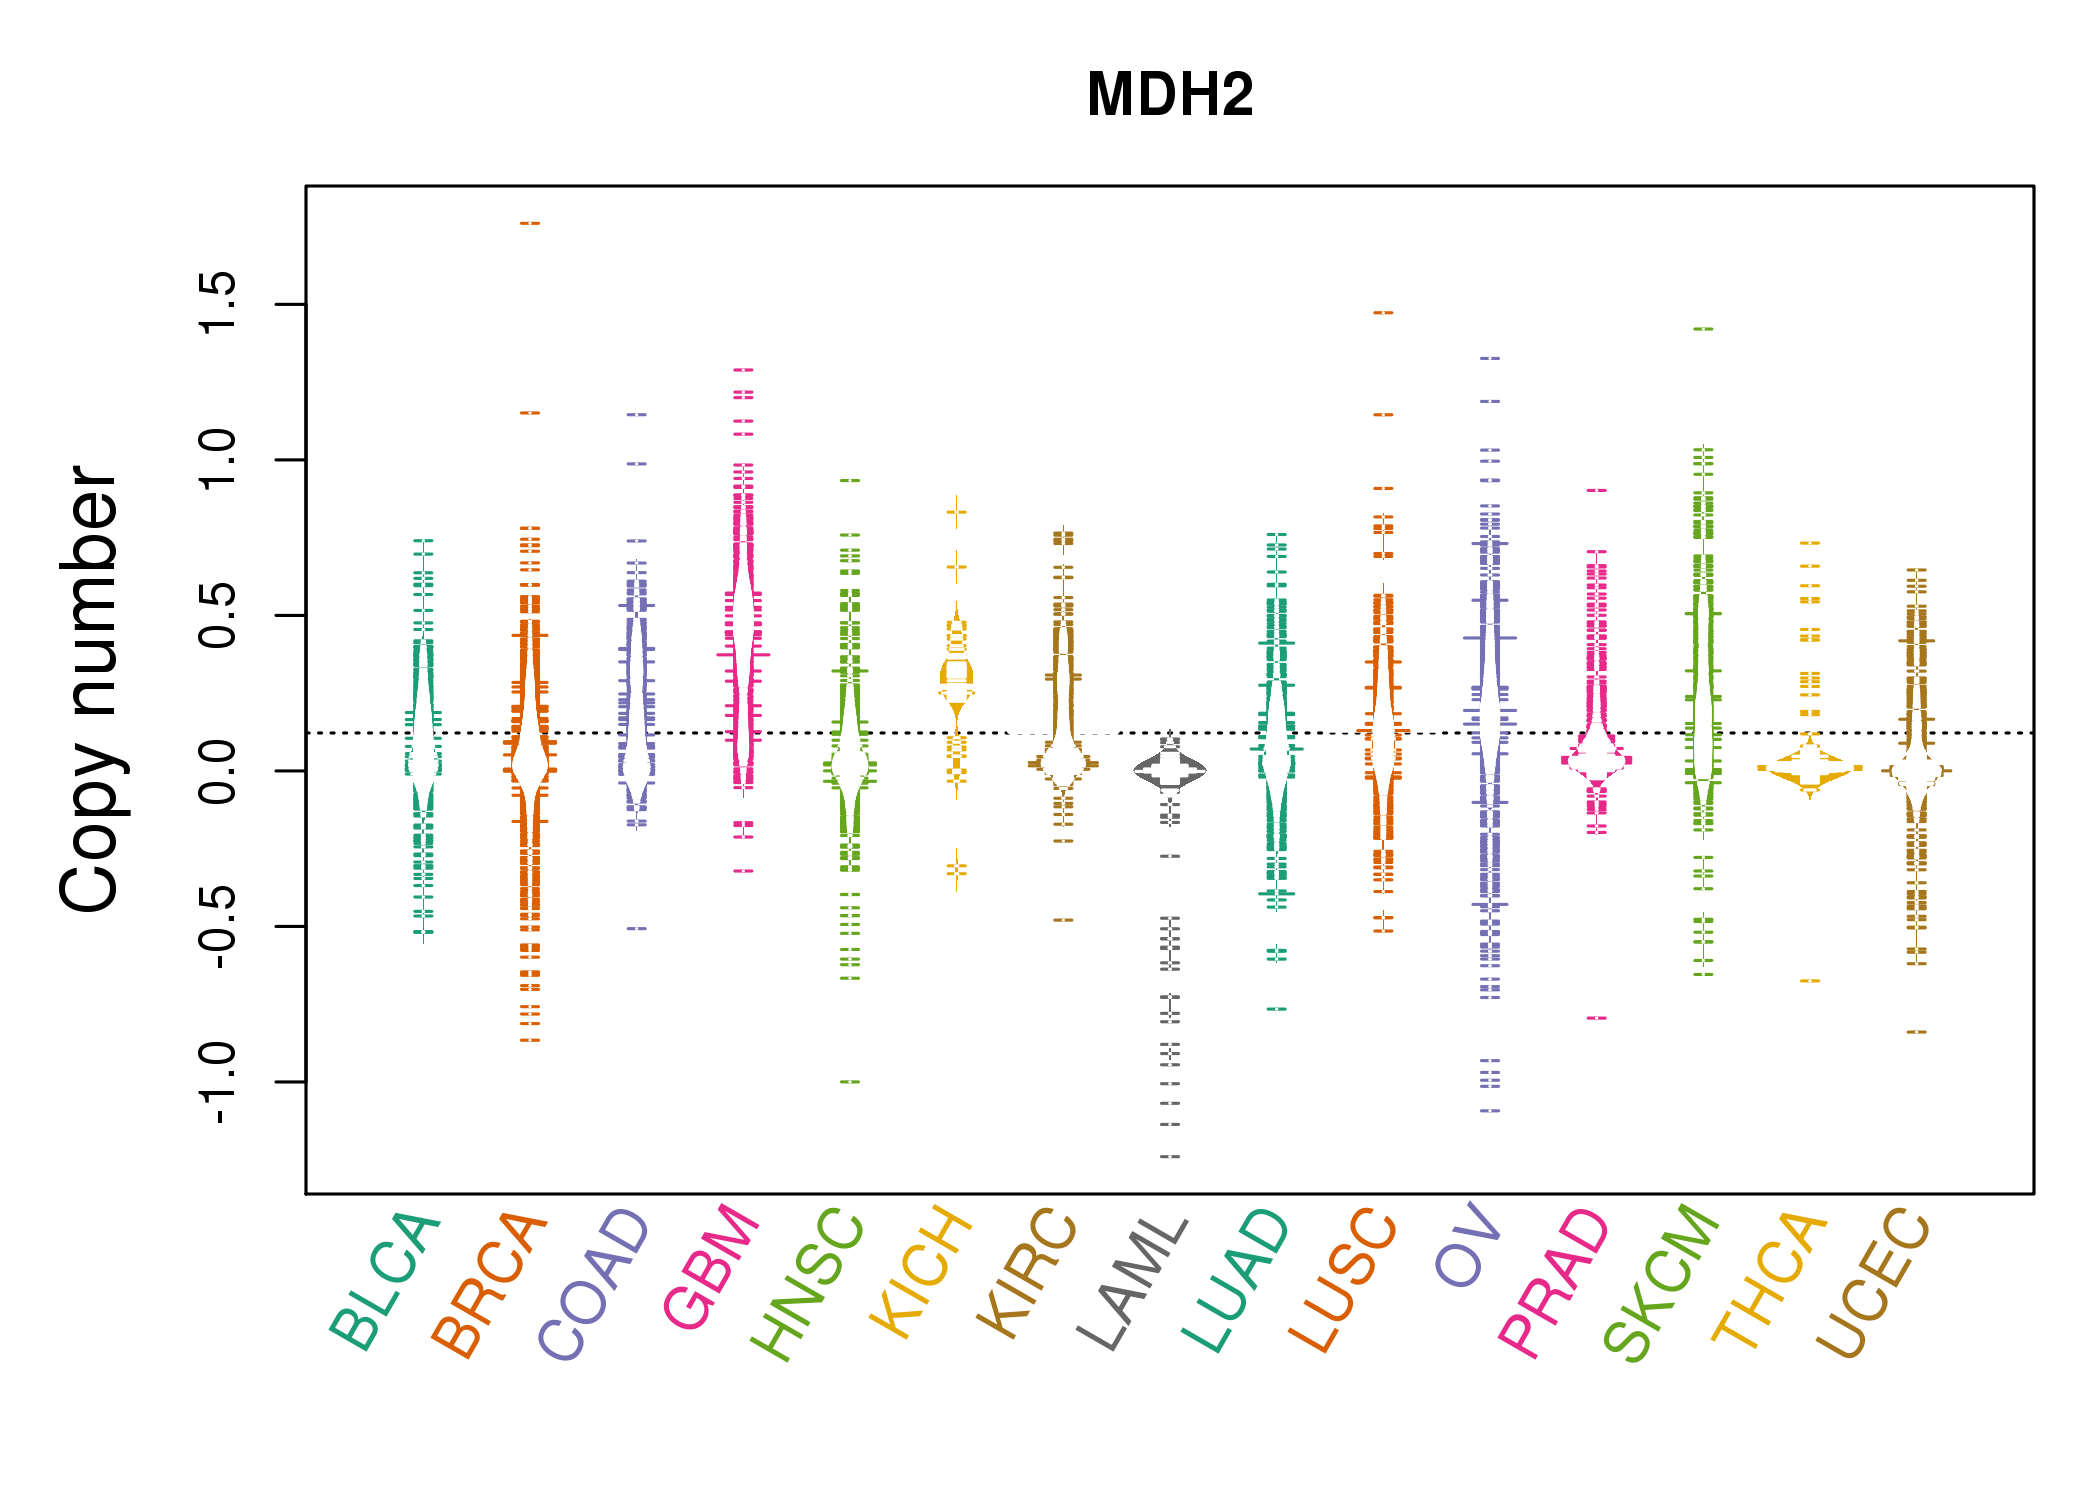 |
| cf) Tissue ID[Tissue type]: BLCA[Bladder Urothelial Carcinoma], BRCA[Breast invasive carcinoma], CESC[Cervical squamous cell carcinoma and endocervical adenocarcinoma], COAD[Colon adenocarcinoma], GBM[Glioblastoma multiforme], Glioma Low Grade, HNSC[Head and Neck squamous cell carcinoma], KICH[Kidney Chromophobe], KIRC[Kidney renal clear cell carcinoma], KIRP[Kidney renal papillary cell carcinoma], LAML[Acute Myeloid Leukemia], LUAD[Lung adenocarcinoma], LUSC[Lung squamous cell carcinoma], OV[Ovarian serous cystadenocarcinoma ], PAAD[Pancreatic adenocarcinoma], PRAD[Prostate adenocarcinoma], SKCM[Skin Cutaneous Melanoma], STAD[Stomach adenocarcinoma], THCA[Thyroid carcinoma], UCEC[Uterine Corpus Endometrial Carcinoma] |
| Top |
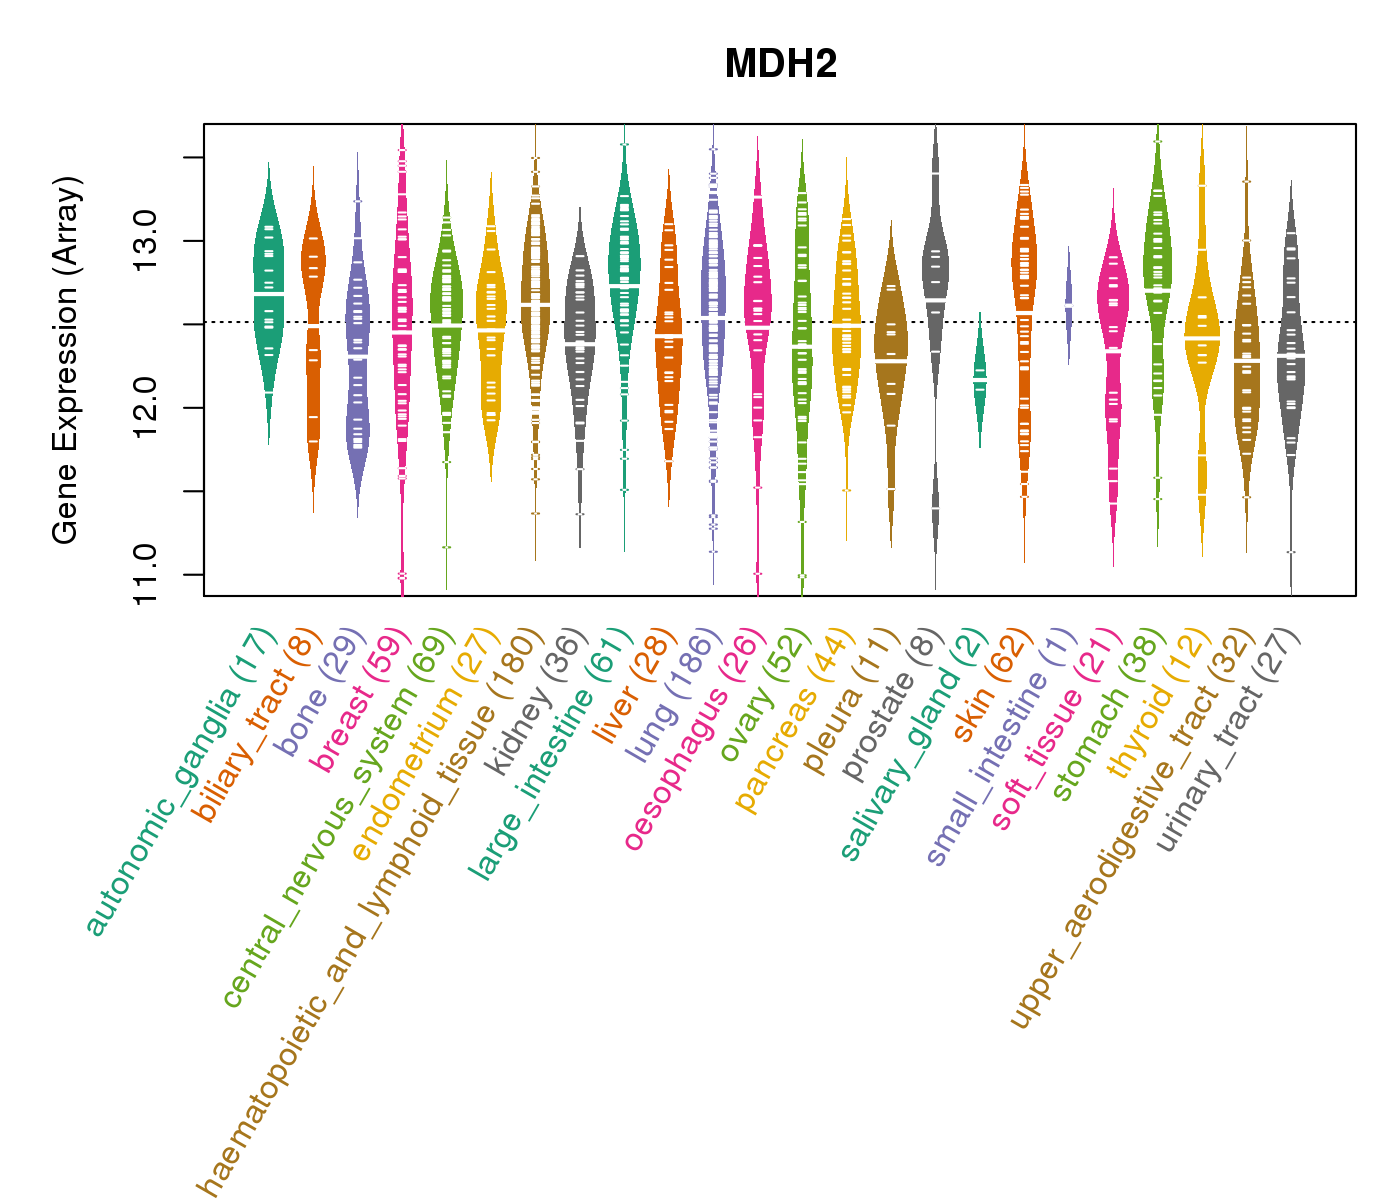
| Gene Expression for MDH2 |
| * CCLE gene expression data were extracted from CCLE_Expression_Entrez_2012-10-18.res: Gene-centric RMA-normalized mRNA expression data. |
 |
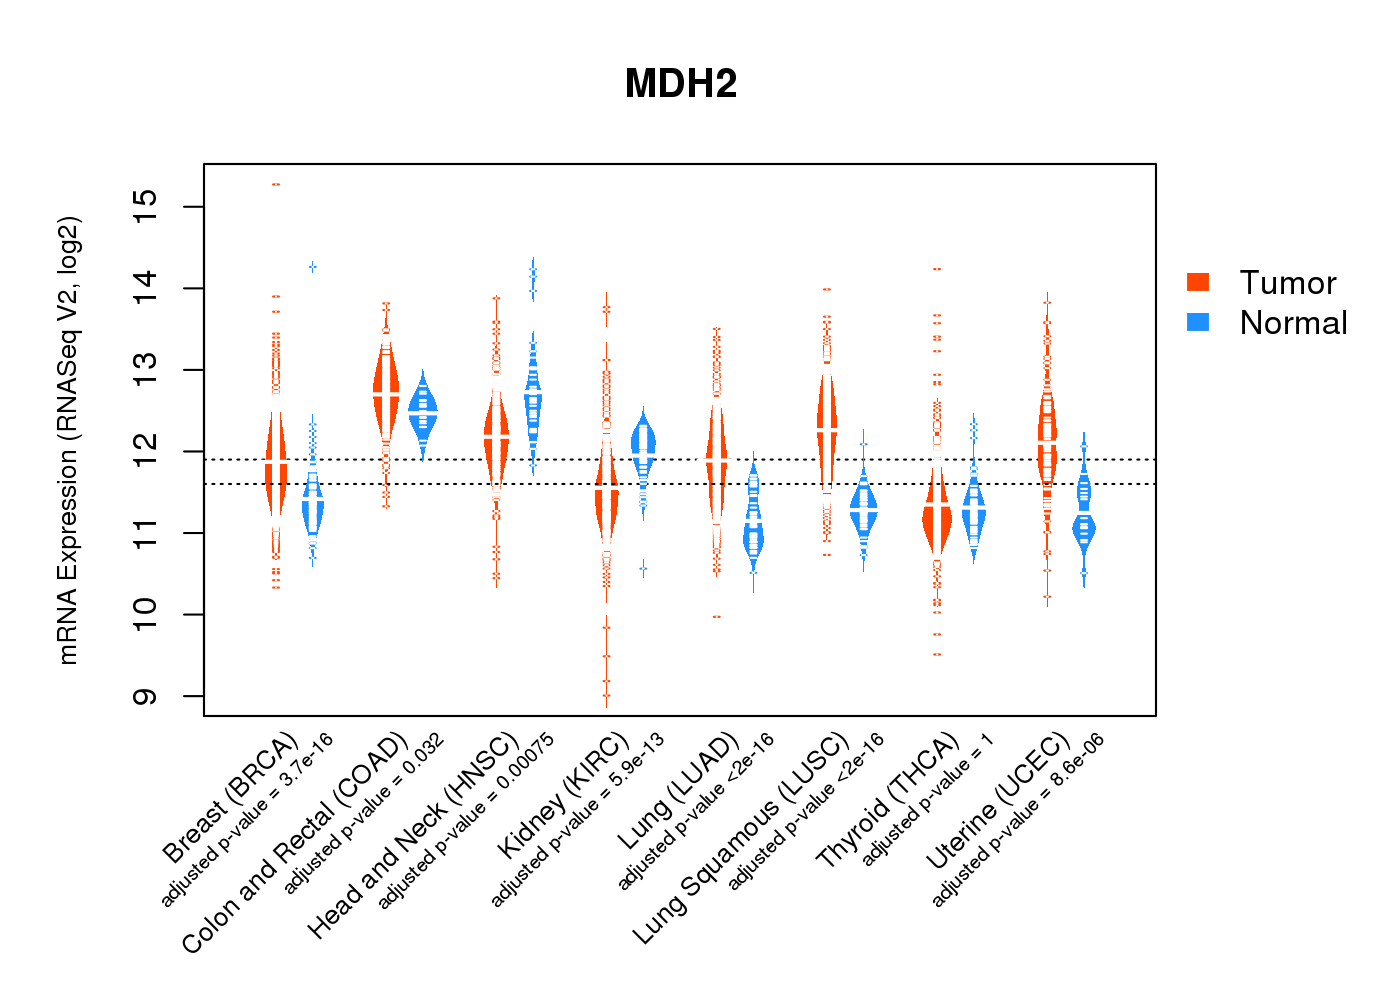
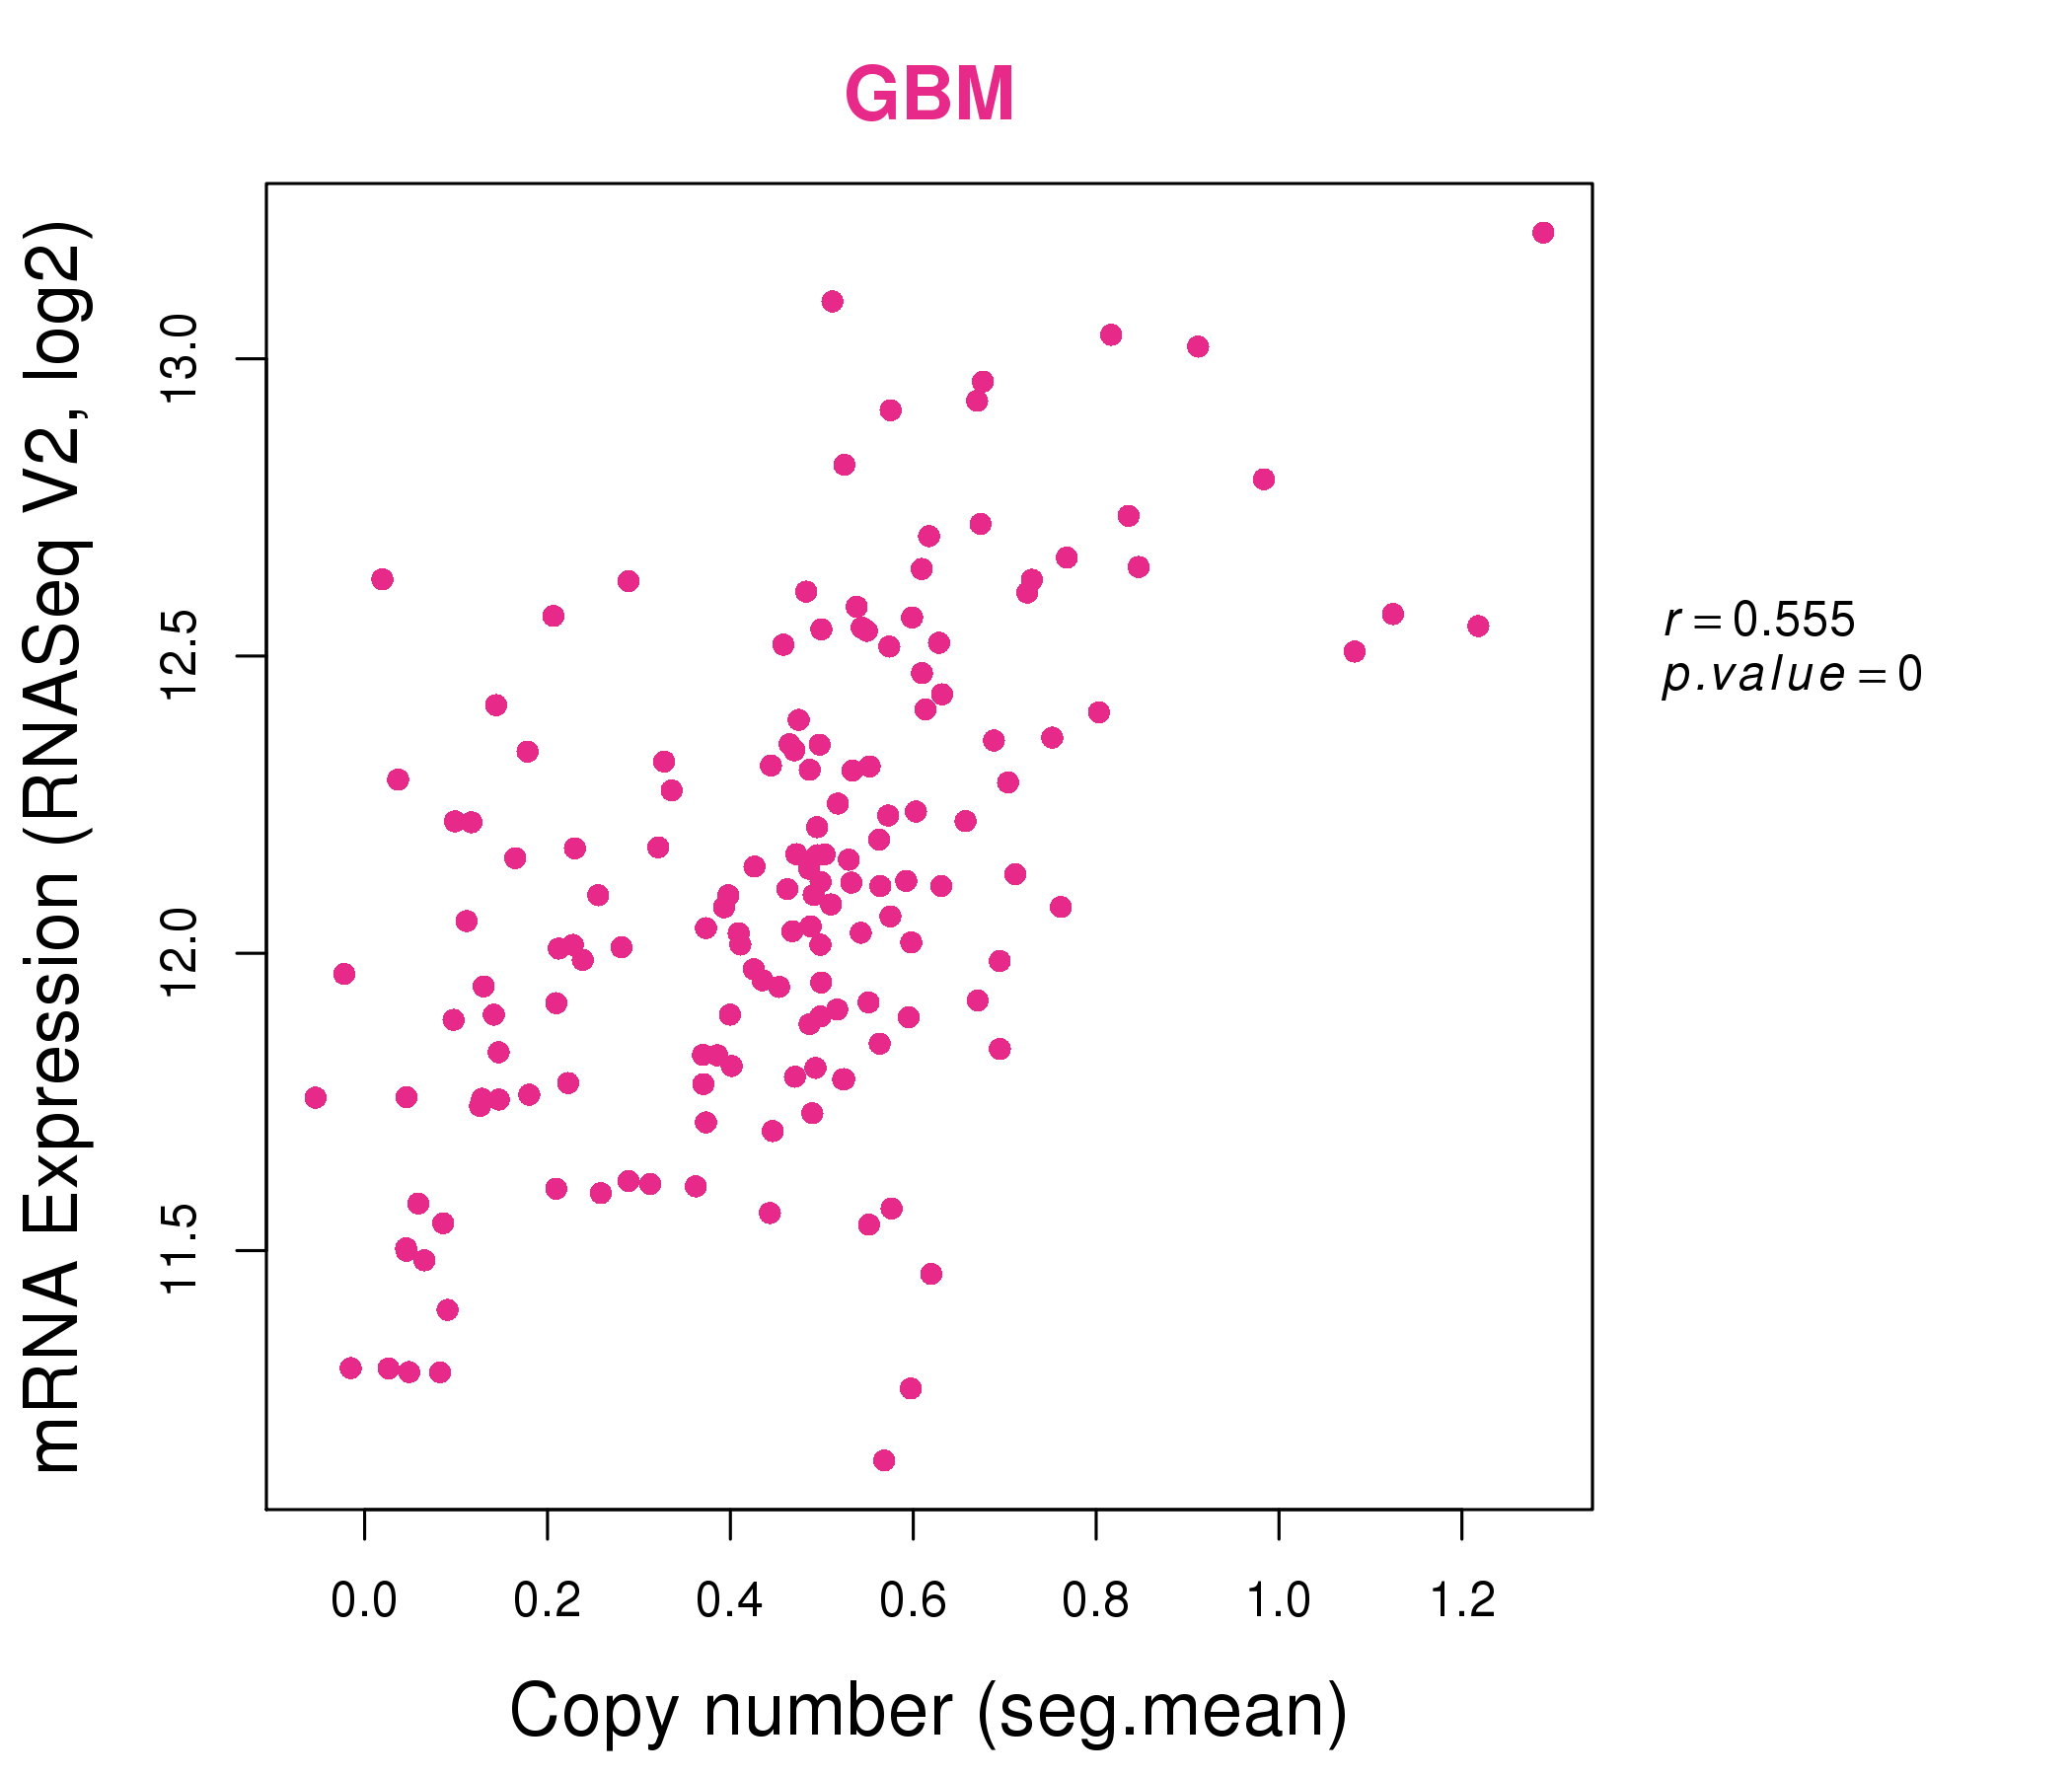
| * Normalized gene expression data of RNASeqV2 was extracted from TCGA using R package TCGA-Assembler. The URLs of all public data files on TCGA DCC data server were gathered at Jan-05-2015. Only eight cancer types have enough normal control samples for differential expression analysis. (t test, adjusted p<0.05 (using Benjamini-Hochberg FDR)) |
 |
| Top |
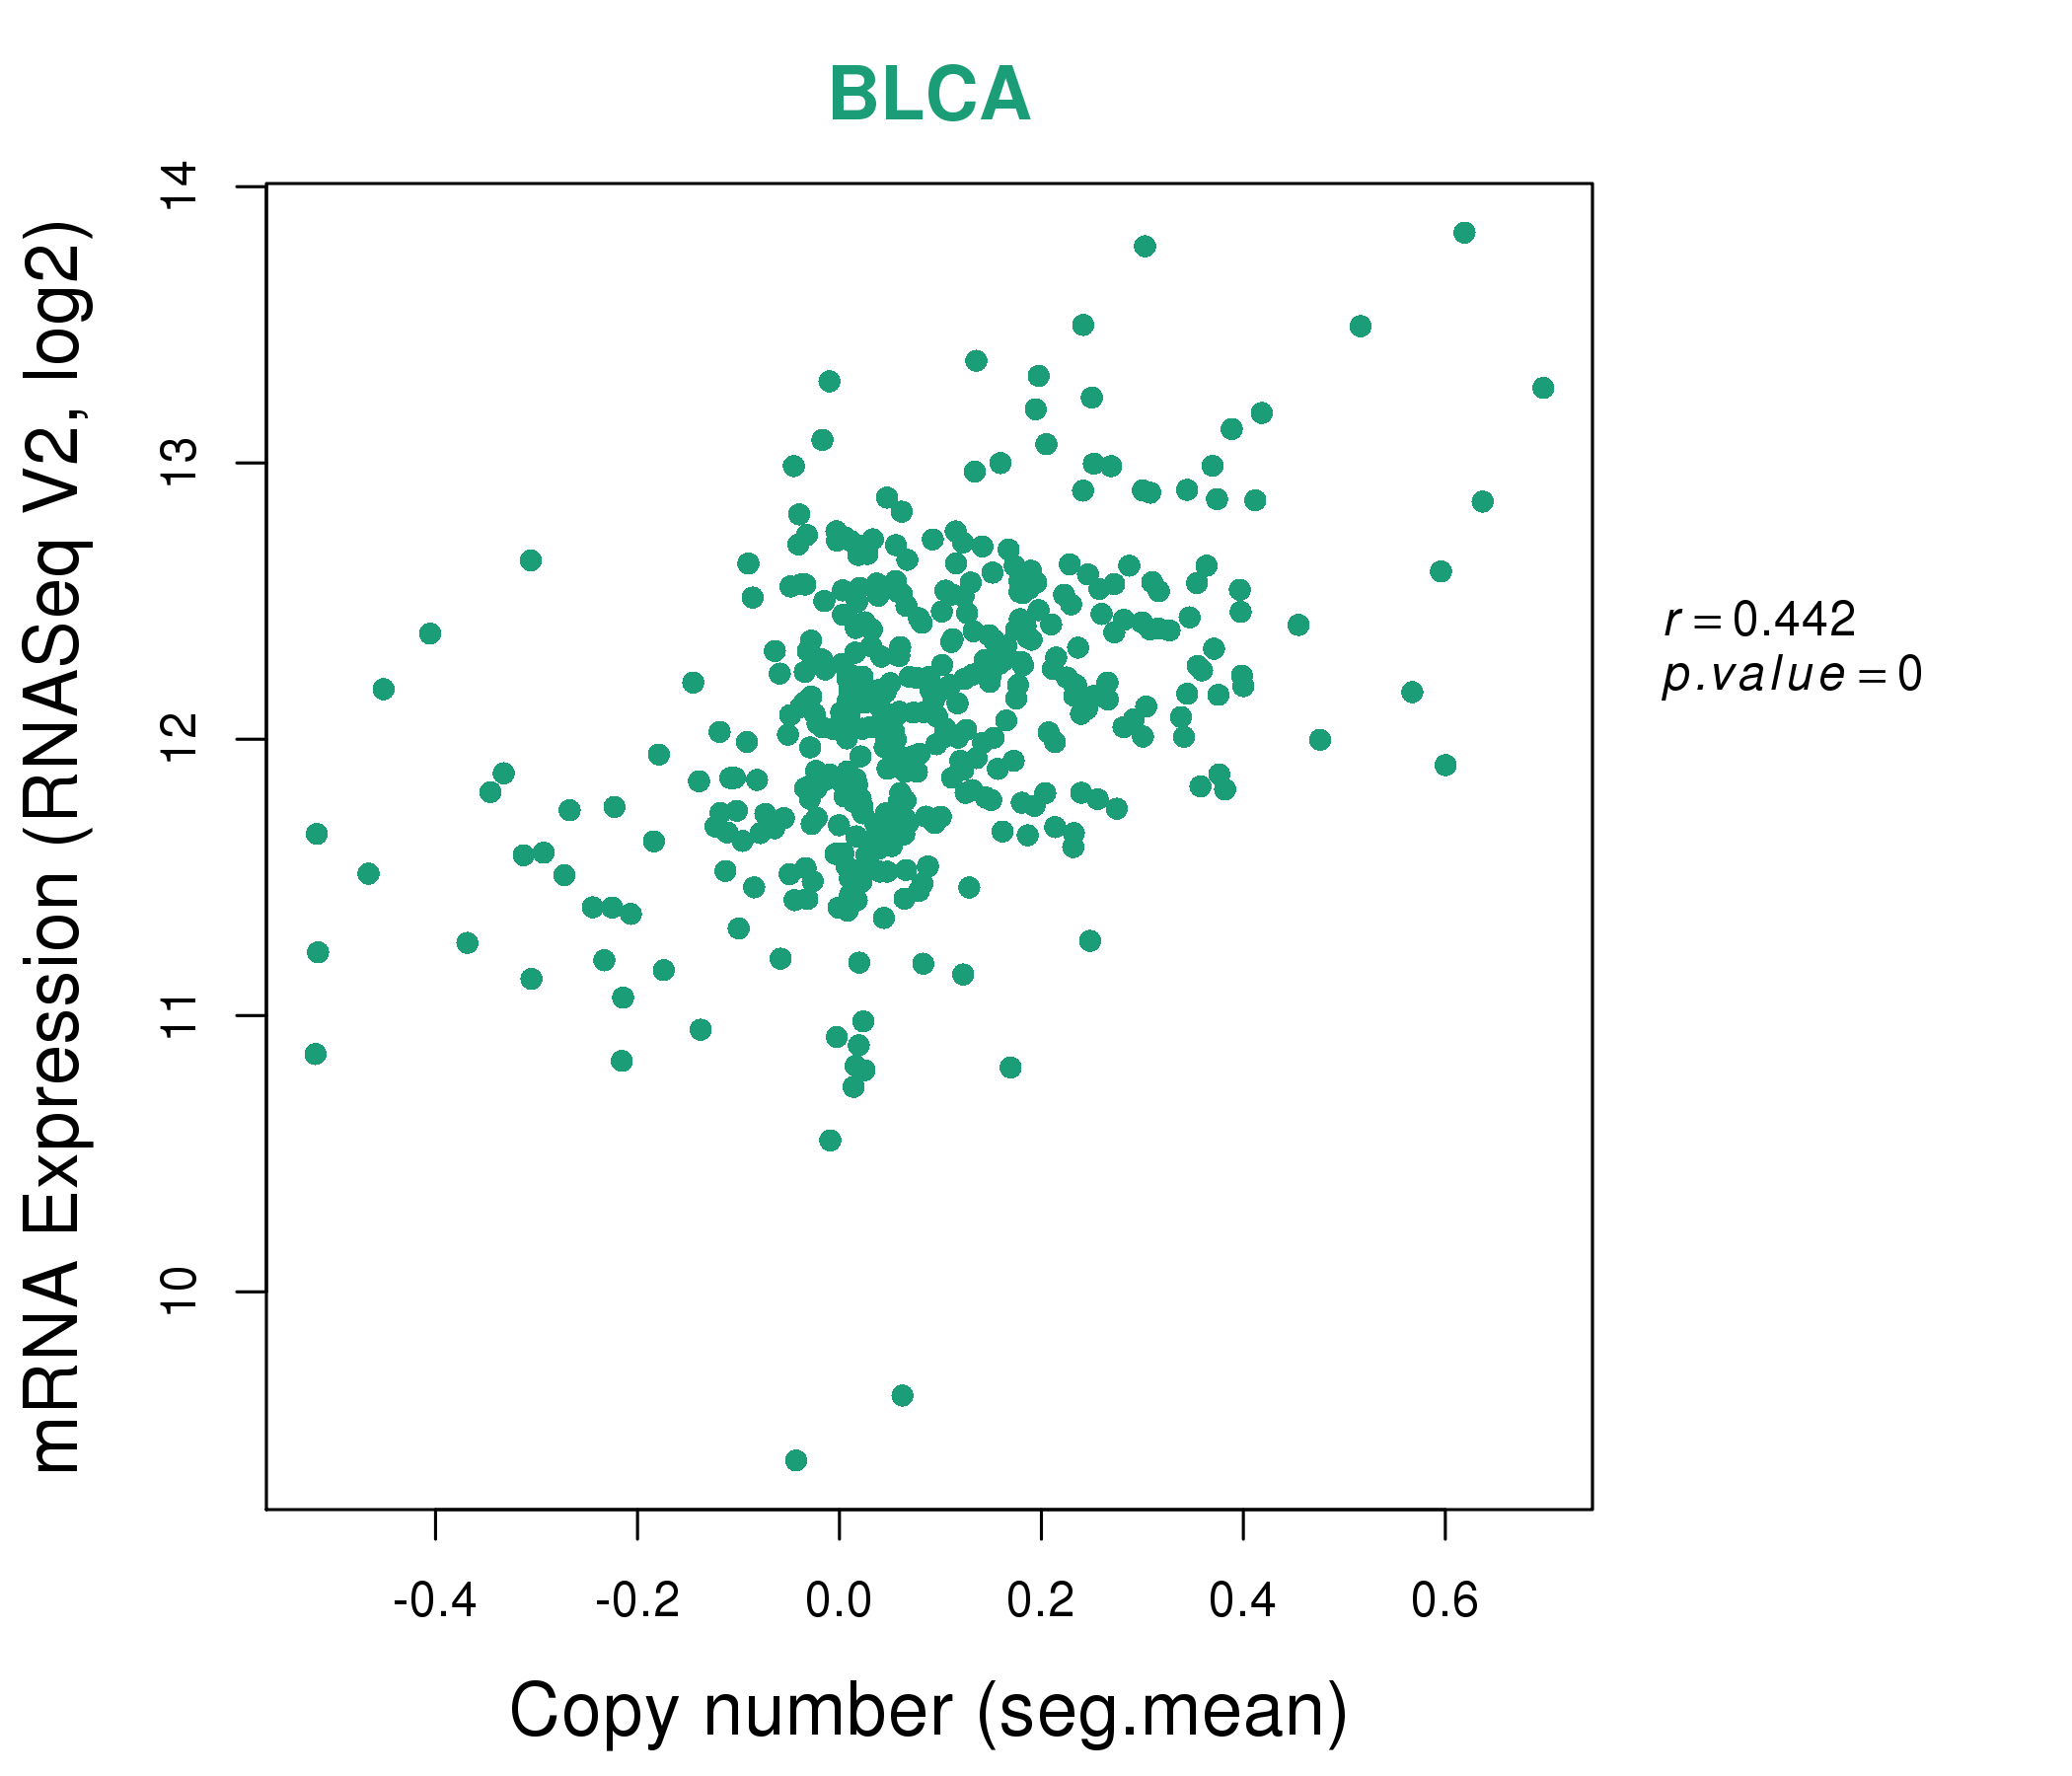
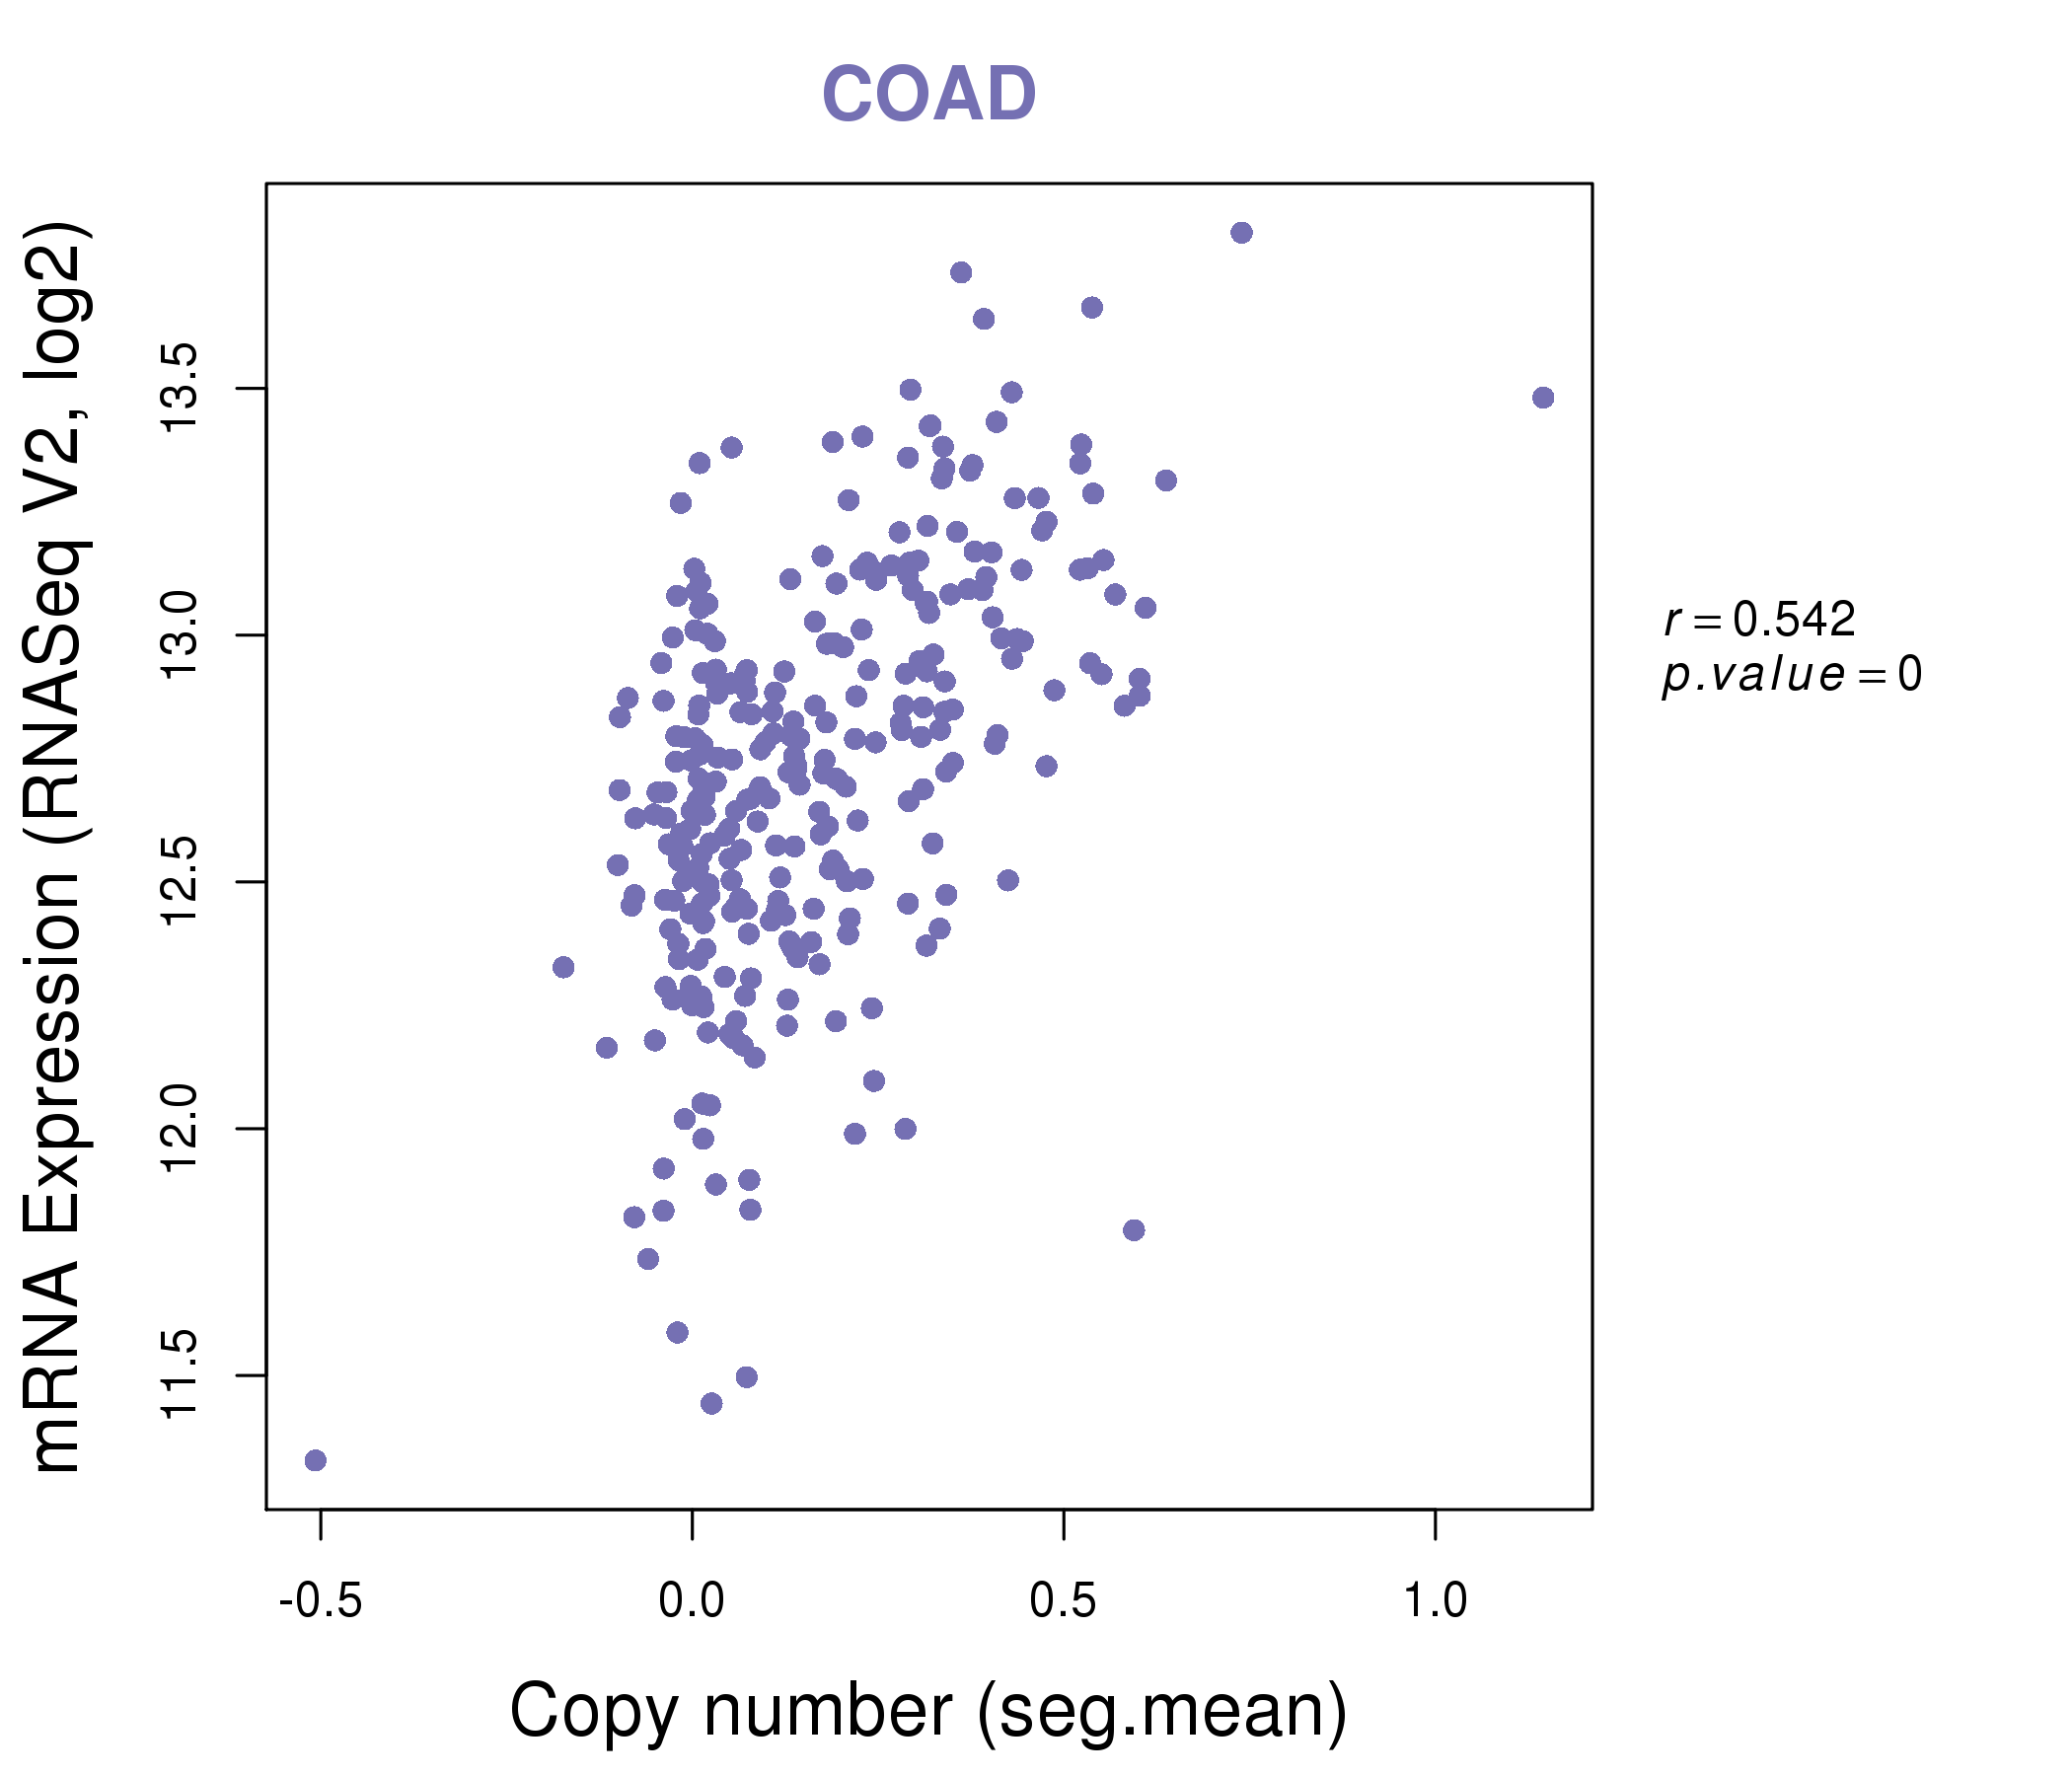
| * This plots show the correlation between CNV and gene expression. |
: Open all plots for all cancer types
 |
|
 |
|

| Top |
| Gene-Gene Network Information |
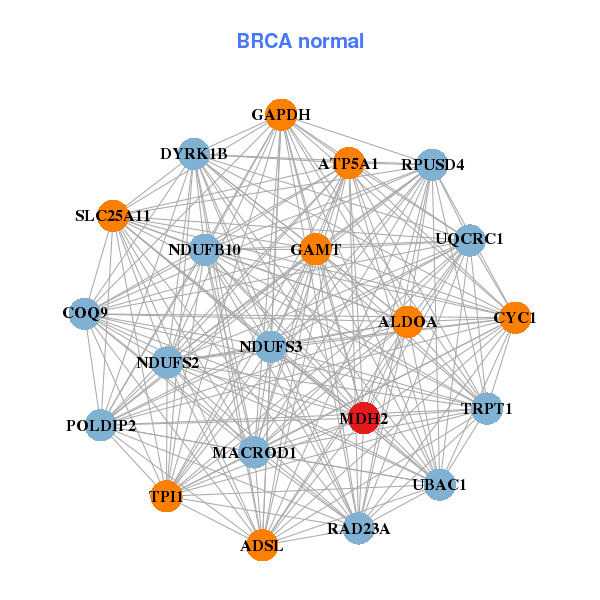
| * Co-Expression network figures were drawn using R package igraph. Only the top 20 genes with the highest correlations were shown. Red circle: input gene, orange circle: cell metabolism gene, sky circle: other gene |
: Open all plots for all cancer types
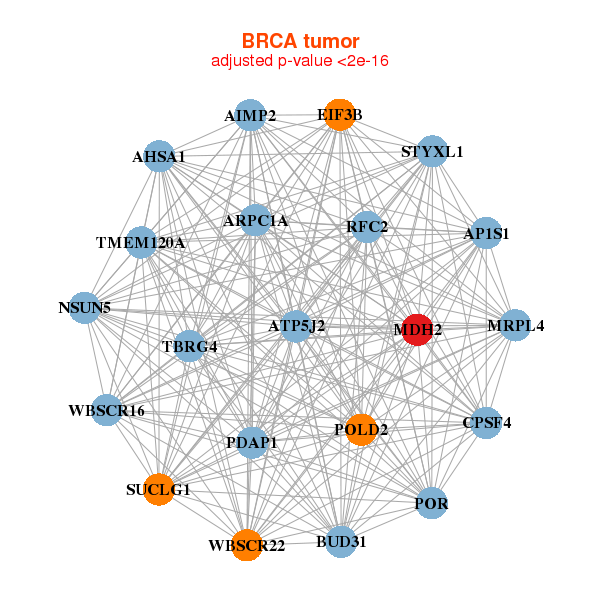 |
| ||||
| AHSA1,AIMP2,AP1S1,ARPC1A,ATP5J2,BUD31,CPSF4, EIF3B,MDH2,MRPL4,NSUN5,PDAP1,POLD2,POR, RFC2,STYXL1,SUCLG1,TBRG4,TMEM120A,WBSCR16,WBSCR22 | ADSL,ALDOA,ATP5A1,COQ9,CYC1,DYRK1B,GAMT, GAPDH,MACROD1,MDH2,NDUFB10,NDUFS2,NDUFS3,POLDIP2, RAD23A,RPUSD4,SLC25A11,TPI1,TRPT1,UBAC1,UQCRC1 | ||||
 |
| ||||
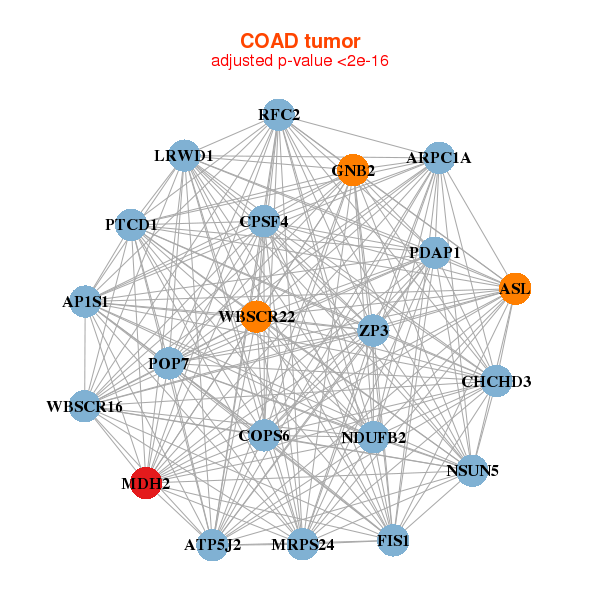
| AP1S1,ARPC1A,ASL,ATP5J2,CHCHD3,COPS6,CPSF4, FIS1,GNB2,LRWD1,MDH2,MRPS24,NDUFB2,NSUN5, PDAP1,POP7,PTCD1,RFC2,WBSCR16,WBSCR22,ZP3 | ATP5A1,ATP5B,ATP5D,CHCHD10,COQ4,COX5A,ECHS1, ETFB,FH,GLRX5,IDH3B,IDH3G,MDH2,MRPL23, MTCH2,NDUFV1,SAMM50,TALDO1,TPI1,TUFM,UQCRC1 |
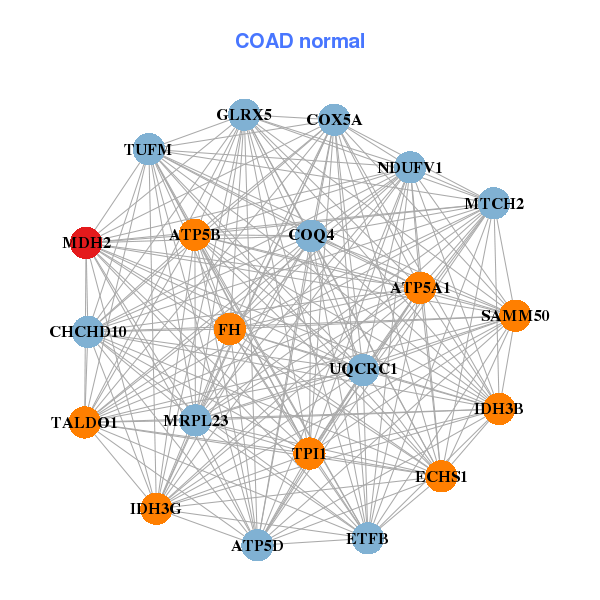
| * Co-Expression network figures were drawn using R package igraph. Only the top 20 genes with the highest correlations were shown. Red circle: input gene, orange circle: cell metabolism gene, sky circle: other gene |
: Open all plots for all cancer types
| Top |
: Open all interacting genes' information including KEGG pathway for all interacting genes from DAVID
| Top |
| Pharmacological Information for MDH2 |
| DB Category | DB Name | DB's ID and Url link |
| * Gene Centered Interaction Network. |
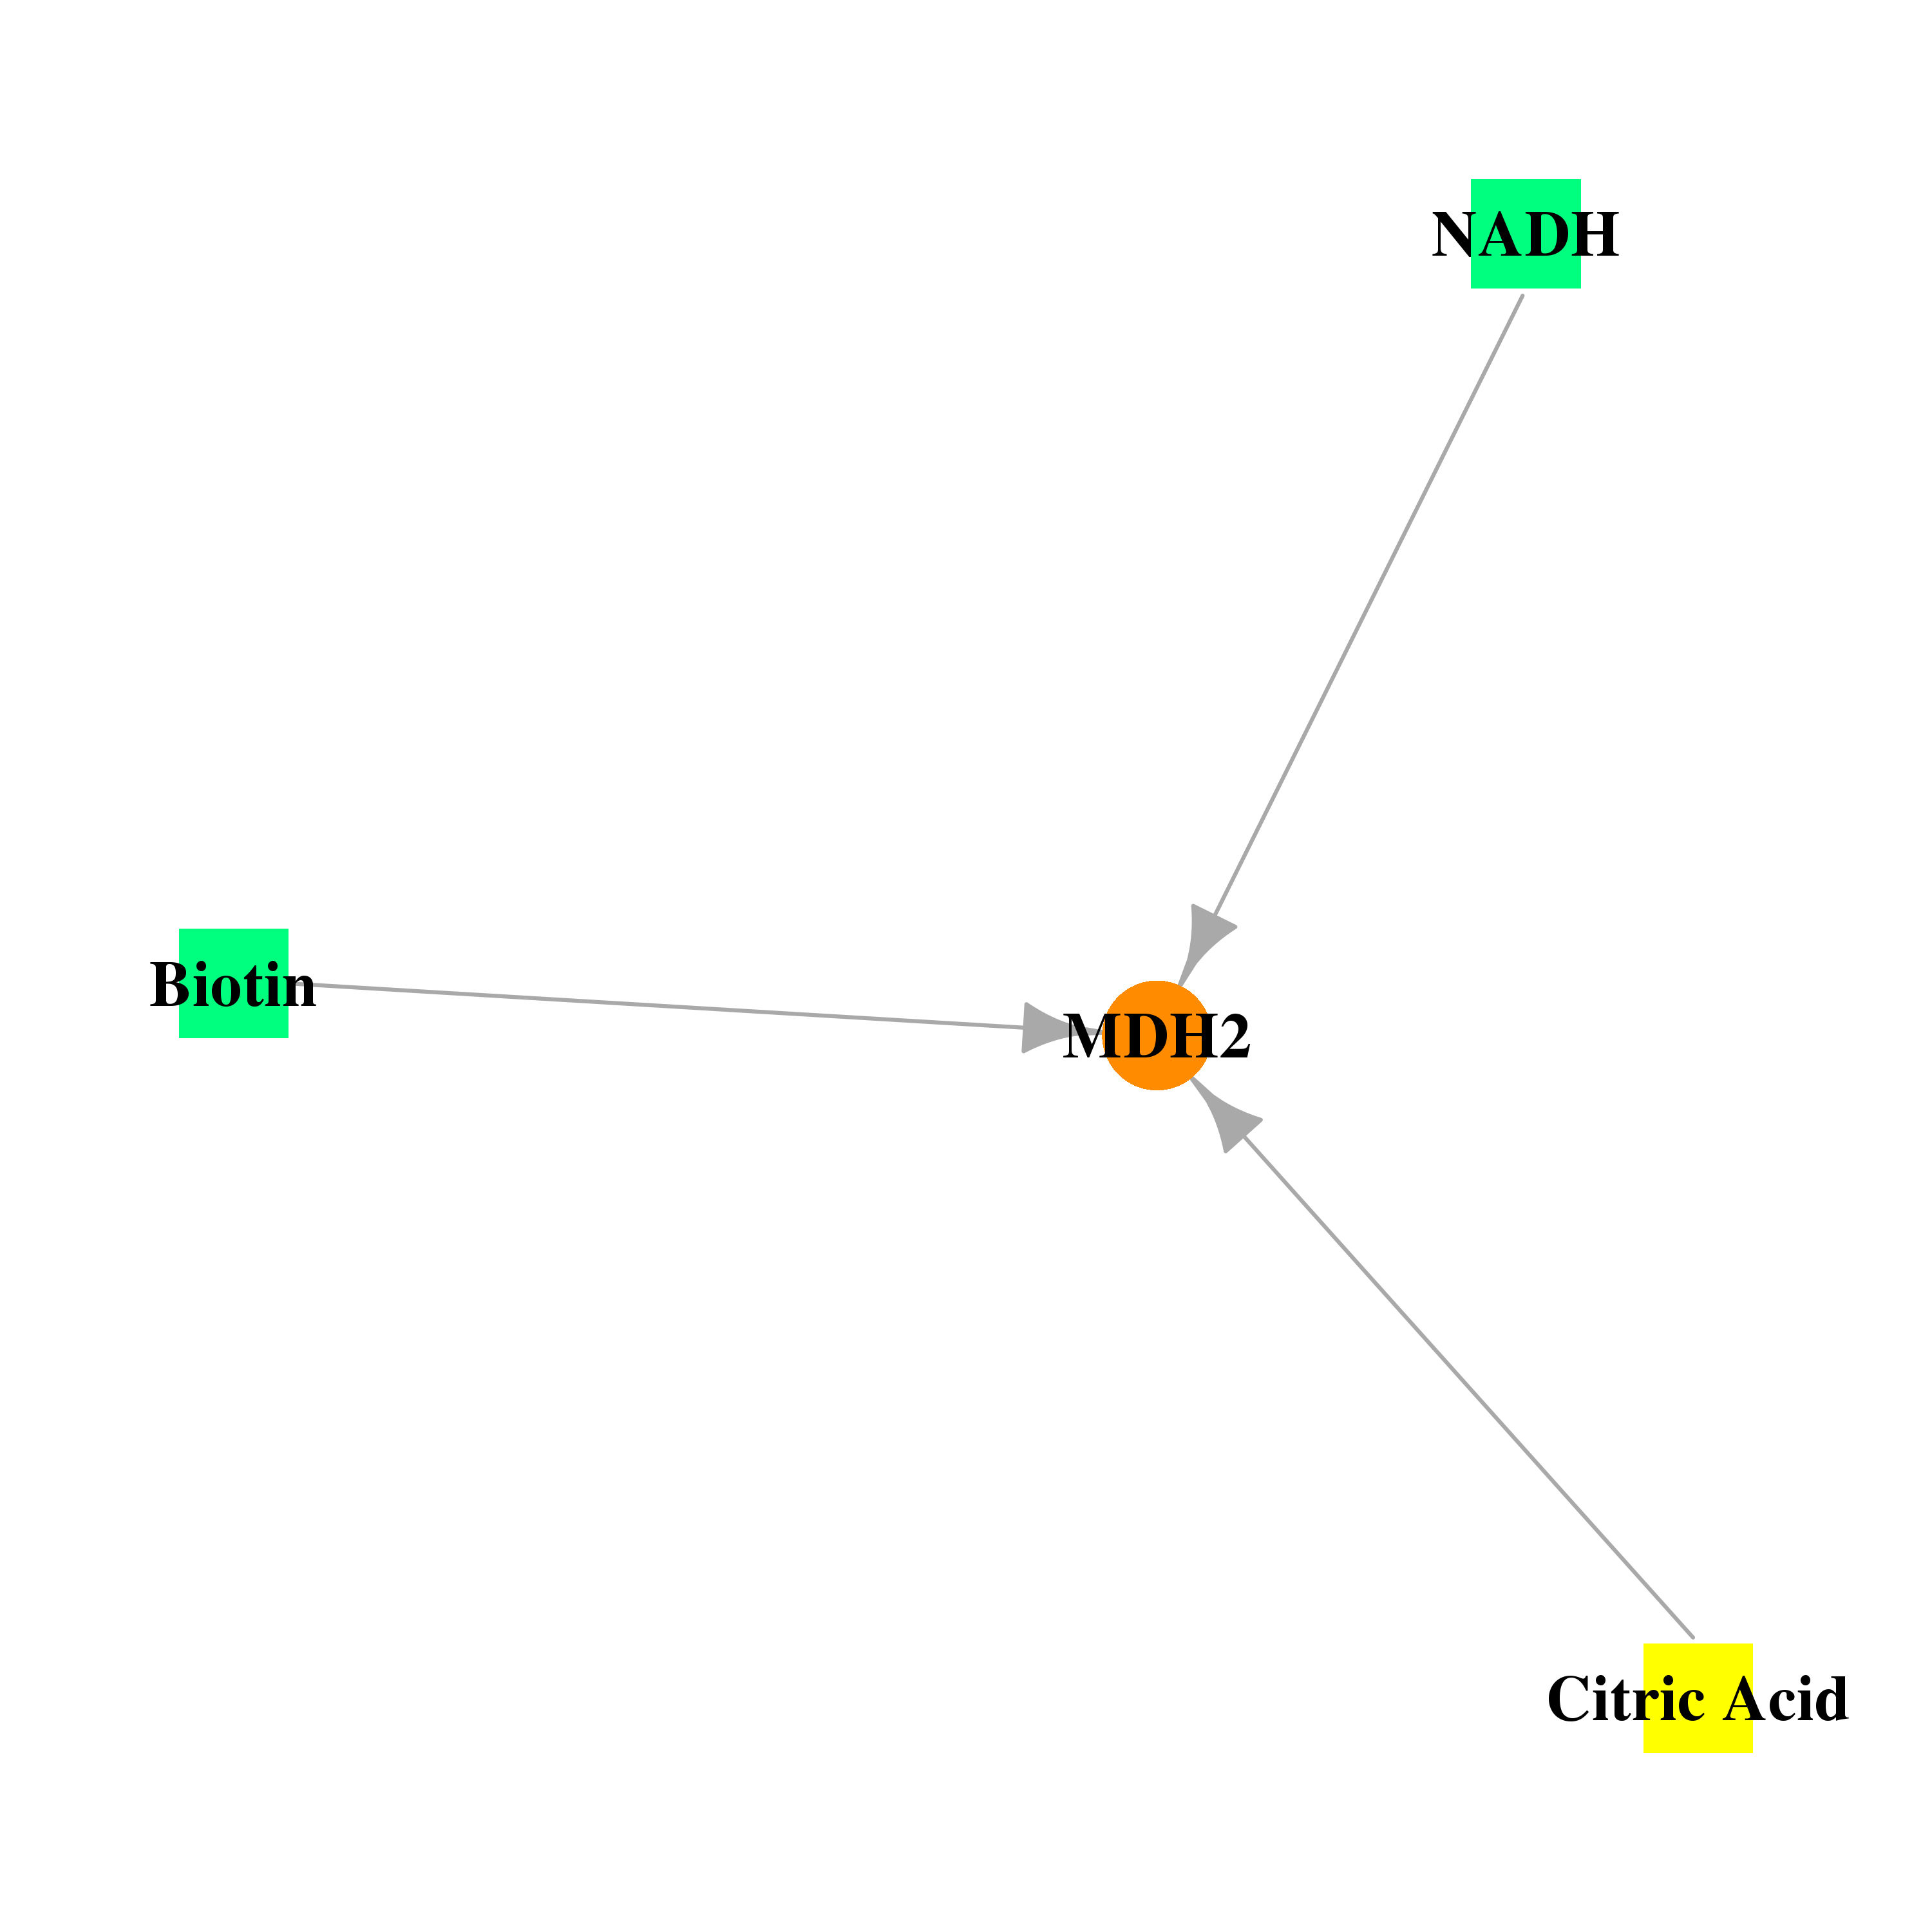 |
| * Drug Centered Interaction Network. |
| DrugBank ID | Target Name | Drug Groups | Generic Name | Drug Centered Network | Drug Structure |
| DB00157 | malate dehydrogenase 2, NAD (mitochondrial) | approved; nutraceutical | NADH |  |  |
| DB04272 | malate dehydrogenase 2, NAD (mitochondrial) | experimental | Citric Acid | 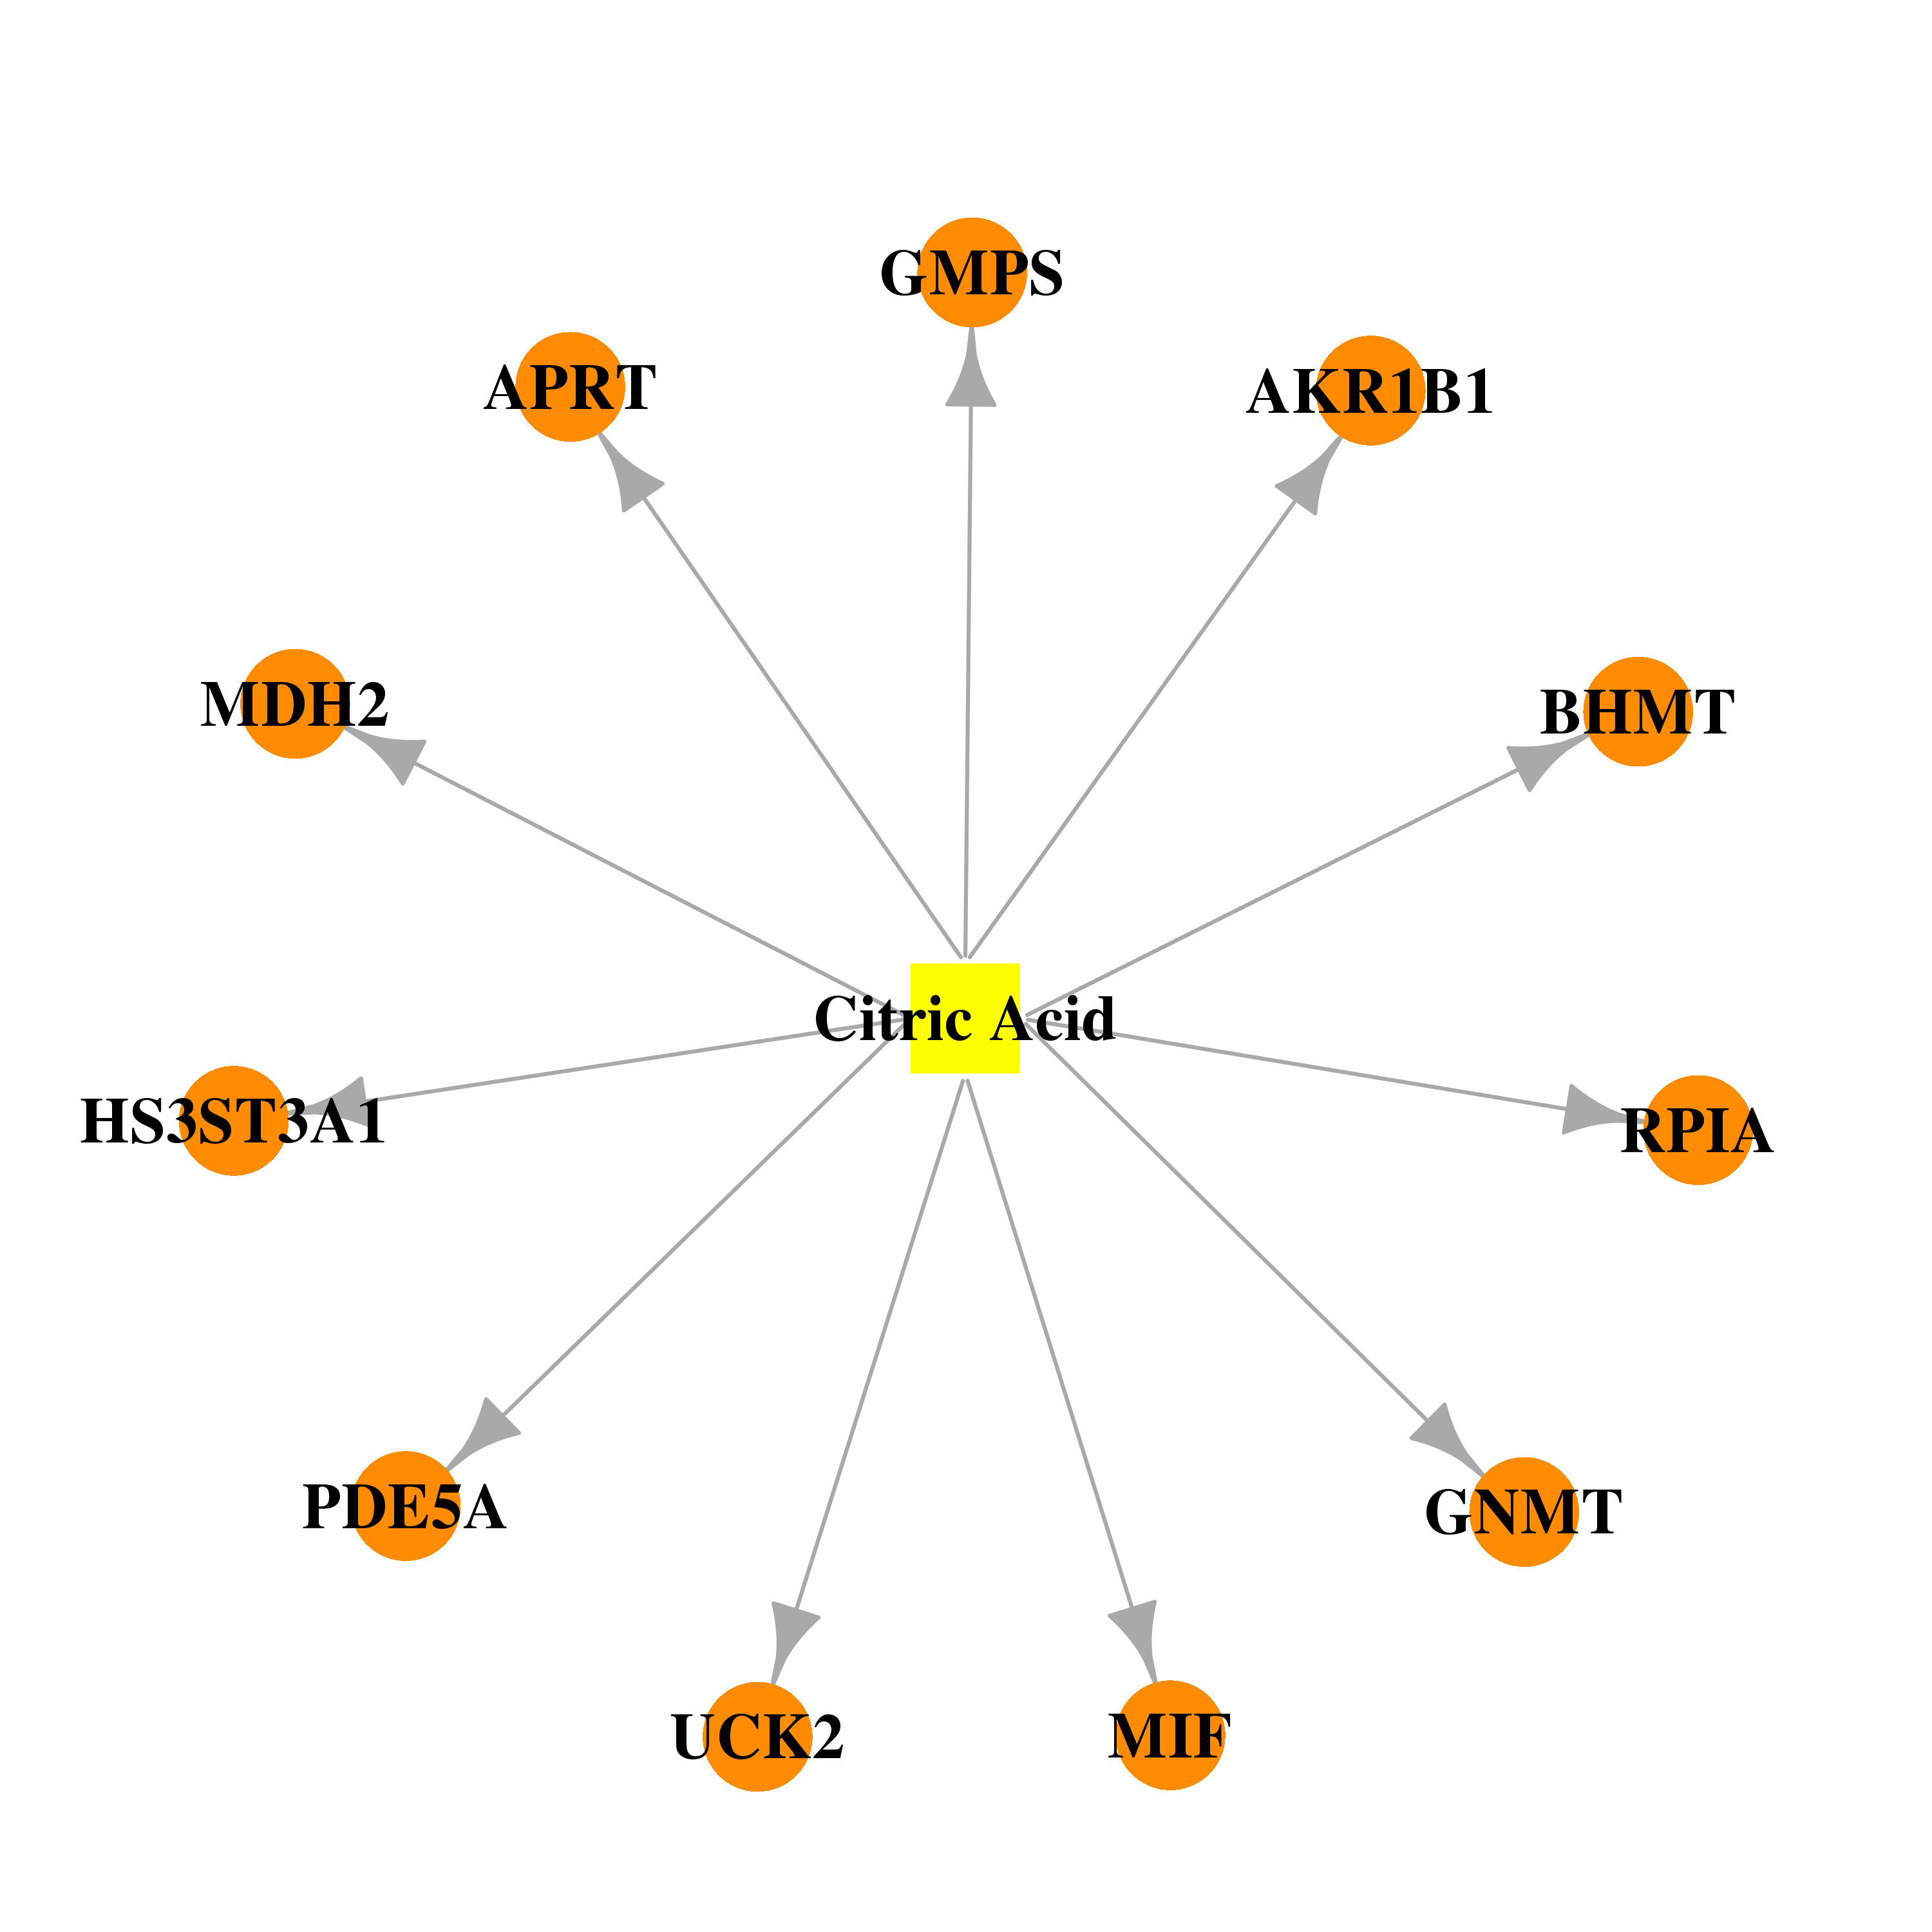 | 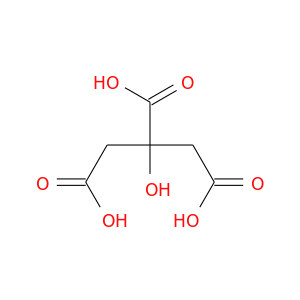 |
| DB00121 | malate dehydrogenase 2, NAD (mitochondrial) | approved; nutraceutical | Biotin | 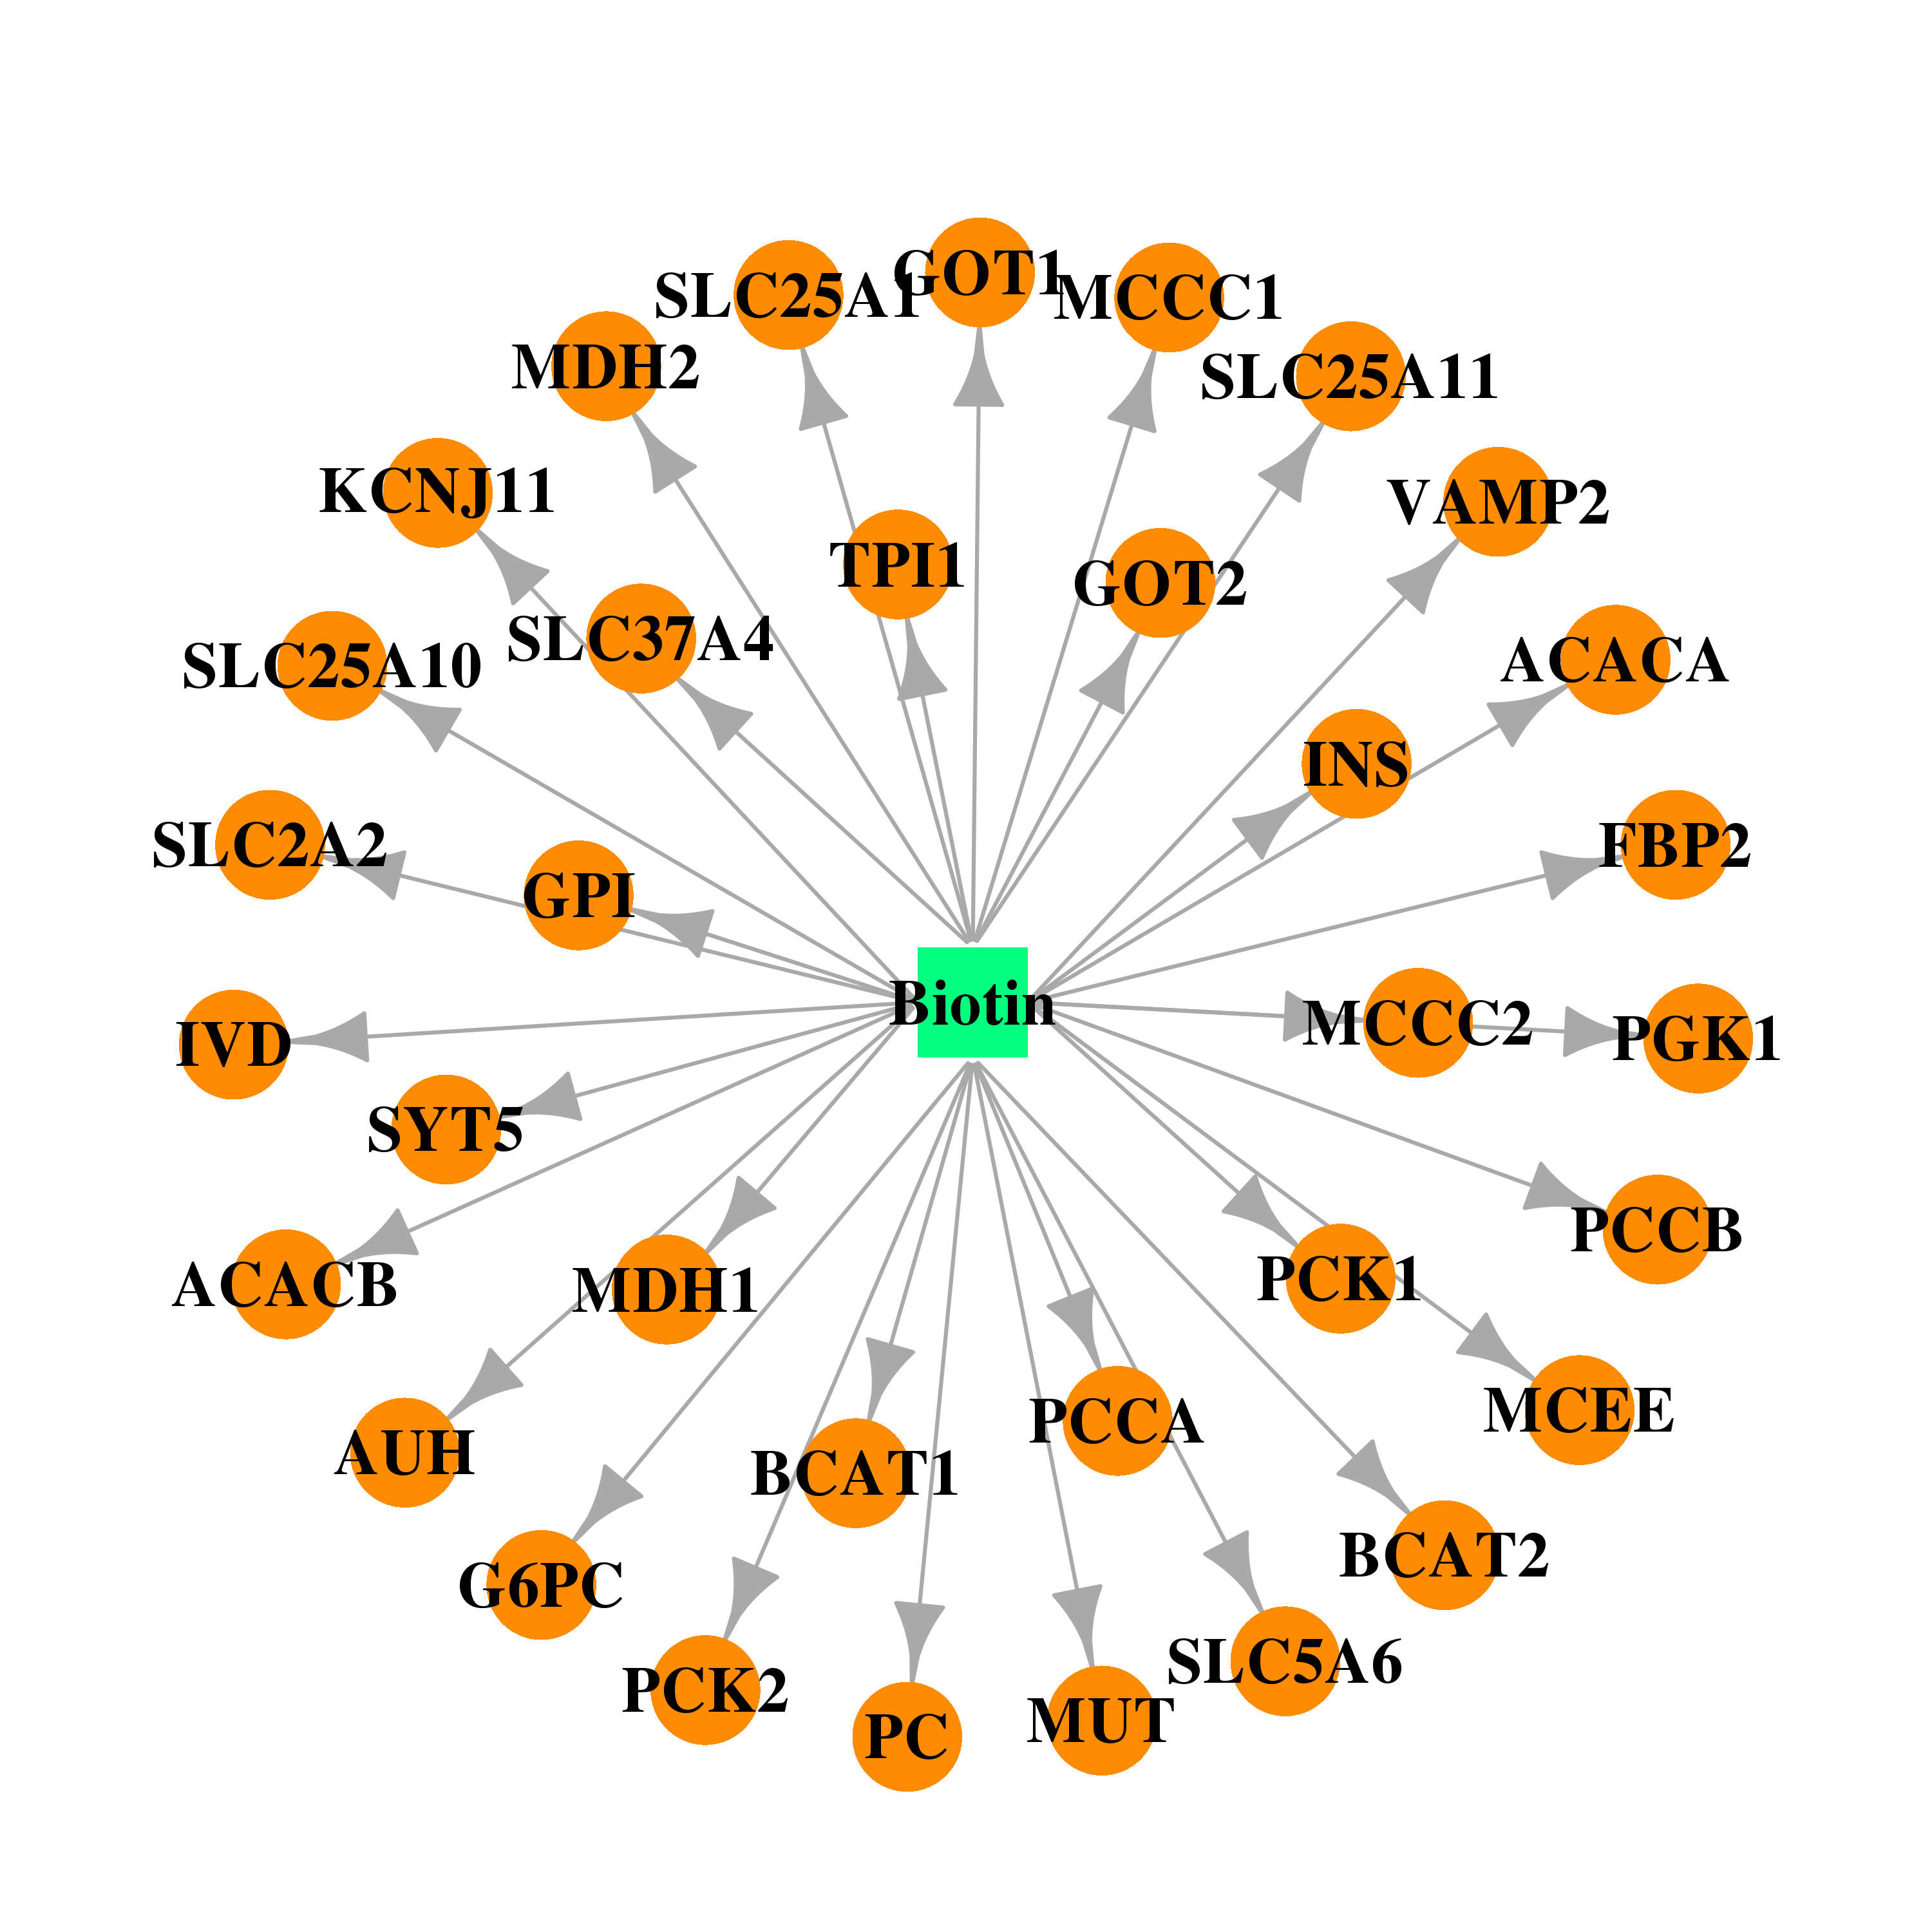 | 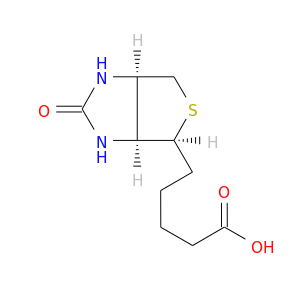 |
| Top |
| Cross referenced IDs for MDH2 |
| * We obtained these cross-references from Uniprot database. It covers 150 different DBs, 18 categories. http://www.uniprot.org/help/cross_references_section |
: Open all cross reference information
|
Copyright © 2016-Present - The Univsersity of Texas Health Science Center at Houston @ |