|
|||||||||||||||||||||||||||||||||||||||||||||||||||||||||||||||||||||||||||||||||||||||||||||||||||||||||||||||||||||||||||||||||||||||||||||||||||||||||||||||||||||||||||||||||||||||||||||||||||||||||||||||||||||||||||||||||||||||||||||||||||||||||||||||||||||||||||||||||||||||||||||||||||||||||||||||||||||||||||||||||||||||||||||||||||
| |
| Phenotypic Information (metabolism pathway, cancer, disease, phenome) |
| |
| |
| Gene-Gene Network Information: Co-Expression Network, Interacting Genes & KEGG |
| |
|


| Gene Summary for ME1 |
| Basic gene info. | Gene symbol | ME1 |
| Gene name | malic enzyme 1, NADP(+)-dependent, cytosolic | |
| Synonyms | HUMNDME|MES | |
| Cytomap | UCSC genome browser: 6q12 | |
| Genomic location | chr6 :83920109-84140938 | |
| Type of gene | protein-coding | |
| RefGenes | NM_002395.5, | |
| Ensembl id | ENSG00000065833 | |
| Description | Malic enzyme, cytoplasmicNADP-MENADP-dependent malic enzymemalate dehydrogenasemalic enzyme 1, solublepyruvic-malic carboxylase | |
| Modification date | 20141207 | |
| dbXrefs | MIM : 154250 | |
| HGNC : HGNC | ||
| Ensembl : ENSG00000065833 | ||
| HPRD : 01102 | ||
| Vega : OTTHUMG00000015111 | ||
| Protein | UniProt: go to UniProt's Cross Reference DB Table | |
| Expression | CleanEX: HS_ME1 | |
| BioGPS: 4199 | ||
| Gene Expression Atlas: ENSG00000065833 | ||
| The Human Protein Atlas: ENSG00000065833 | ||
| Pathway | NCI Pathway Interaction Database: ME1 | |
| KEGG: ME1 | ||
| REACTOME: ME1 | ||
| ConsensusPathDB | ||
| Pathway Commons: ME1 | ||
| Metabolism | MetaCyc: ME1 | |
| HUMANCyc: ME1 | ||
| Regulation | Ensembl's Regulation: ENSG00000065833 | |
| miRBase: chr6 :83,920,109-84,140,938 | ||
| TargetScan: NM_002395 | ||
| cisRED: ENSG00000065833 | ||
| Context | iHOP: ME1 | |
| cancer metabolism search in PubMed: ME1 | ||
| UCL Cancer Institute: ME1 | ||
| Assigned class in ccmGDB | C | |
| Top |
| Phenotypic Information for ME1(metabolism pathway, cancer, disease, phenome) |
| Cancer | CGAP: ME1 |
| Familial Cancer Database: ME1 | |
| * This gene is included in those cancer gene databases. |
|
|
|
|
|
|
| |||||||||||||||||||||||||||||||||||||||||||||||||||||||||||||||||||||||||||||||||||||||||||||||||||||||||||||||||||||||||||||||||||||||||||||||||||||||||||||||||||||||||||||||||||||||||||||||||||||||||||||||||||||||||||||||||||||||||||||||||||||||||||||||||||||||||||||||||||||||||||||||||||||||||||||||||||||||||||||||||||||||||||||
Oncogene 1 | Significant driver gene in | ||||||||||||||||||||||||||||||||||||||||||||||||||||||||||||||||||||||||||||||||||||||||||||||||||||||||||||||||||||||||||||||||||||||||||||||||||||||||||||||||||||||||||||||||||||||||||||||||||||||||||||||||||||||||||||||||||||||||||||||||||||||||||||||||||||||||||||||||||||||||||||||||||||||||||||||||||||||||||||||||||||||||||||||||||
| cf) number; DB name 1 Oncogene; http://nar.oxfordjournals.org/content/35/suppl_1/D721.long, 2 Tumor Suppressor gene; https://bioinfo.uth.edu/TSGene/, 3 Cancer Gene Census; http://www.nature.com/nrc/journal/v4/n3/abs/nrc1299.html, 4 CancerGenes; http://nar.oxfordjournals.org/content/35/suppl_1/D721.long, 5 Network of Cancer Gene; http://ncg.kcl.ac.uk/index.php, 1Therapeutic Vulnerabilities in Cancer; http://cbio.mskcc.org/cancergenomics/statius/ |
| KEGG_PYRUVATE_METABOLISM REACTOME_METABOLISM_OF_LIPIDS_AND_LIPOPROTEINS | |
| OMIM | |
| Orphanet | |
| Disease | KEGG Disease: ME1 |
| MedGen: ME1 (Human Medical Genetics with Condition) | |
| ClinVar: ME1 | |
| Phenotype | MGI: ME1 (International Mouse Phenotyping Consortium) |
| PhenomicDB: ME1 | |
| Mutations for ME1 |
| * Under tables are showing count per each tissue to give us broad intuition about tissue specific mutation patterns.You can go to the detailed page for each mutation database's web site. |
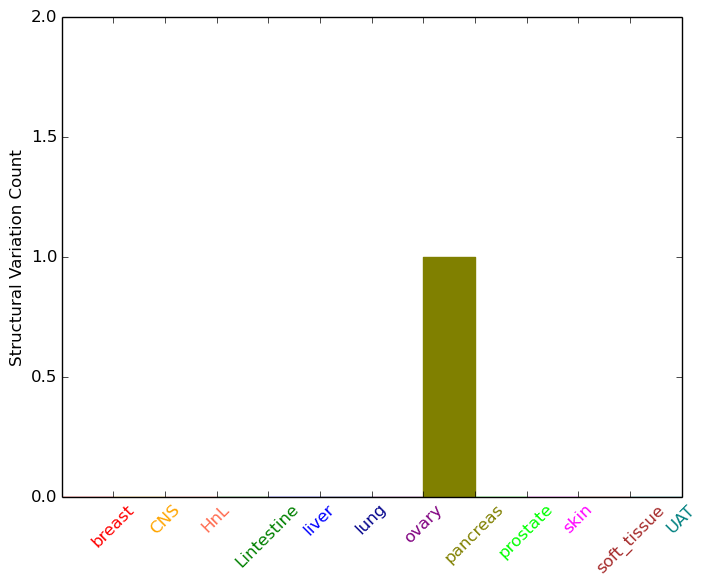
| - Statistics for Tissue and Mutation type | Top |
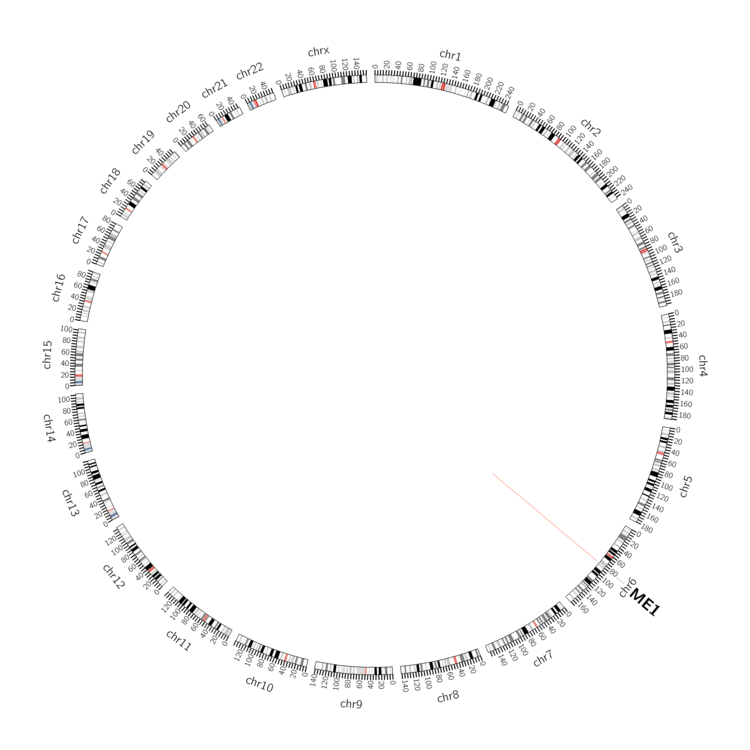 |
| - For Inter-chromosomal Variations |
| There's no inter-chromosomal structural variation. |
| - For Intra-chromosomal Variations |
| * Intra-chromosomal variantions includes 'intrachromosomal amplicon to amplicon', 'intrachromosomal amplicon to non-amplified dna', 'intrachromosomal deletion', 'intrachromosomal fold-back inversion', 'intrachromosomal inversion', 'intrachromosomal tandem duplication', 'Intrachromosomal unknown type', 'intrachromosomal with inverted orientation', 'intrachromosomal with non-inverted orientation'. |
 |
| Sample | Symbol_a | Chr_a | Start_a | End_a | Symbol_b | Chr_b | Start_b | End_b |
| pancreas | ME1 | chr6 | 83923998 | 83924018 | ME1 | chr6 | 83924064 | 83924084 |
| cf) Tissue number; Tissue name (1;Breast, 2;Central_nervous_system, 3;Haematopoietic_and_lymphoid_tissue, 4;Large_intestine, 5;Liver, 6;Lung, 7;Ovary, 8;Pancreas, 9;Prostate, 10;Skin, 11;Soft_tissue, 12;Upper_aerodigestive_tract) |
| * From mRNA Sanger sequences, Chitars2.0 arranged chimeric transcripts. This table shows ME1 related fusion information. |
| ID | Head Gene | Tail Gene | Accession | Gene_a | qStart_a | qEnd_a | Chromosome_a | tStart_a | tEnd_a | Gene_a | qStart_a | qEnd_a | Chromosome_a | tStart_a | tEnd_a |
| Top |
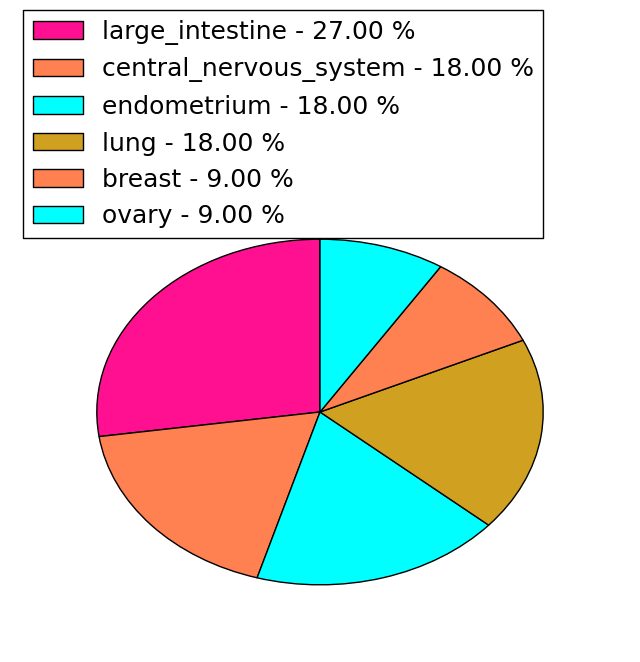
| Mutation type/ Tissue ID | brca | cns | cerv | endome | haematopo | kidn | Lintest | liver | lung | ns | ovary | pancre | prost | skin | stoma | thyro | urina | |||
| Total # sample | 2 | |||||||||||||||||||
| GAIN (# sample) | 2 | |||||||||||||||||||
| LOSS (# sample) |
| cf) Tissue ID; Tissue type (1; Breast, 2; Central_nervous_system, 3; Cervix, 4; Endometrium, 5; Haematopoietic_and_lymphoid_tissue, 6; Kidney, 7; Large_intestine, 8; Liver, 9; Lung, 10; NS, 11; Ovary, 12; Pancreas, 13; Prostate, 14; Skin, 15; Stomach, 16; Thyroid, 17; Urinary_tract) |
| Top |
|
 |
| Top |
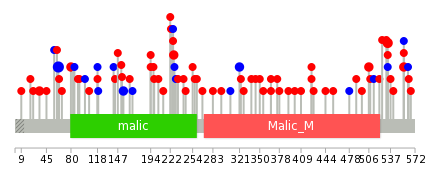
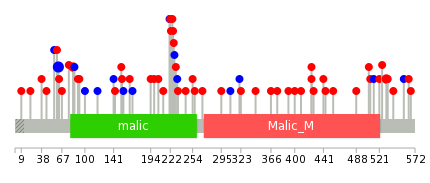
| Stat. for Non-Synonymous SNVs (# total SNVs=53) | (# total SNVs=11) |
 |  |
(# total SNVs=1) | (# total SNVs=0) |
 |
| Top |
| * When you move the cursor on each content, you can see more deailed mutation information on the Tooltip. Those are primary_site,primary_histology,mutation(aa),pubmedID. |
| GRCh37 position | Mutation(aa) | Unique sampleID count |
| chr6:84117513-84117513 | p.F62F | 5 |
| chr6:83921764-83921764 | p.P533L | 3 |
| chr6:83921695-83921695 | p.C556Y | 3 |
| chr6:83947499-83947499 | p.G321G | 2 |
| chr6:84056027-84056027 | p.R155R | 2 |
| chr6:83938569-83938569 | p.E370* | 2 |
| chr6:84117596-84117596 | p.R35G | 2 |
| chr6:84025054-84025054 | p.E227K | 2 |
| chr6:83937058-83937058 | p.T424I | 2 |
| chr6:84108210-84108210 | p.D80Y | 2 |
| Top |
|
 |
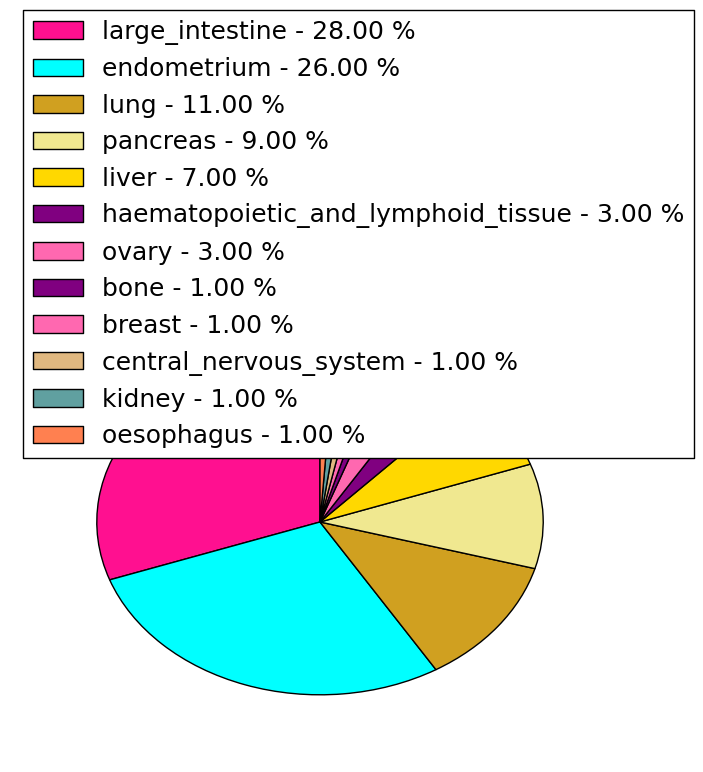
| Point Mutation/ Tissue ID | 1 | 2 | 3 | 4 | 5 | 6 | 7 | 8 | 9 | 10 | 11 | 12 | 13 | 14 | 15 | 16 | 17 | 18 | 19 | 20 |
| # sample | 2 | 12 | 2 | 1 | 1 | 3 | 2 | 3 | 25 | 3 | 12 | |||||||||
| # mutation | 2 | 14 | 2 | 1 | 1 | 3 | 2 | 3 | 24 | 3 | 15 | |||||||||
| nonsynonymous SNV | 2 | 12 | 1 | 1 | 1 | 2 | 1 | 2 | 18 | 2 | 13 | |||||||||
| synonymous SNV | 2 | 1 | 1 | 1 | 1 | 6 | 1 | 2 |
| cf) Tissue ID; Tissue type (1; BLCA[Bladder Urothelial Carcinoma], 2; BRCA[Breast invasive carcinoma], 3; CESC[Cervical squamous cell carcinoma and endocervical adenocarcinoma], 4; COAD[Colon adenocarcinoma], 5; GBM[Glioblastoma multiforme], 6; Glioma Low Grade, 7; HNSC[Head and Neck squamous cell carcinoma], 8; KICH[Kidney Chromophobe], 9; KIRC[Kidney renal clear cell carcinoma], 10; KIRP[Kidney renal papillary cell carcinoma], 11; LAML[Acute Myeloid Leukemia], 12; LUAD[Lung adenocarcinoma], 13; LUSC[Lung squamous cell carcinoma], 14; OV[Ovarian serous cystadenocarcinoma ], 15; PAAD[Pancreatic adenocarcinoma], 16; PRAD[Prostate adenocarcinoma], 17; SKCM[Skin Cutaneous Melanoma], 18:STAD[Stomach adenocarcinoma], 19:THCA[Thyroid carcinoma], 20:UCEC[Uterine Corpus Endometrial Carcinoma]) |
| Top |
| * We represented just top 10 SNVs. When you move the cursor on each content, you can see more deailed mutation information on the Tooltip. Those are primary_site, primary_histology, mutation(aa), pubmedID. |
| Genomic Position | Mutation(aa) | Unique sampleID count |
| chr6:84117513 | p.F62F | 5 |
| chr6:84108201 | p.P531S | 2 |
| chr6:83921771 | p.E83K | 2 |
| chr6:83937058 | p.T424I | 2 |
| chr6:83921787 | p.P409S | 1 |
| chr6:84025066 | p.E230D | 1 |
| chr6:83937104 | p.D152V | 1 |
| chr6:84056037 | p.L38F | 1 |
| chr6:83963391 | p.V563A | 1 |
| chr6:84117512 | p.R400Q | 1 |
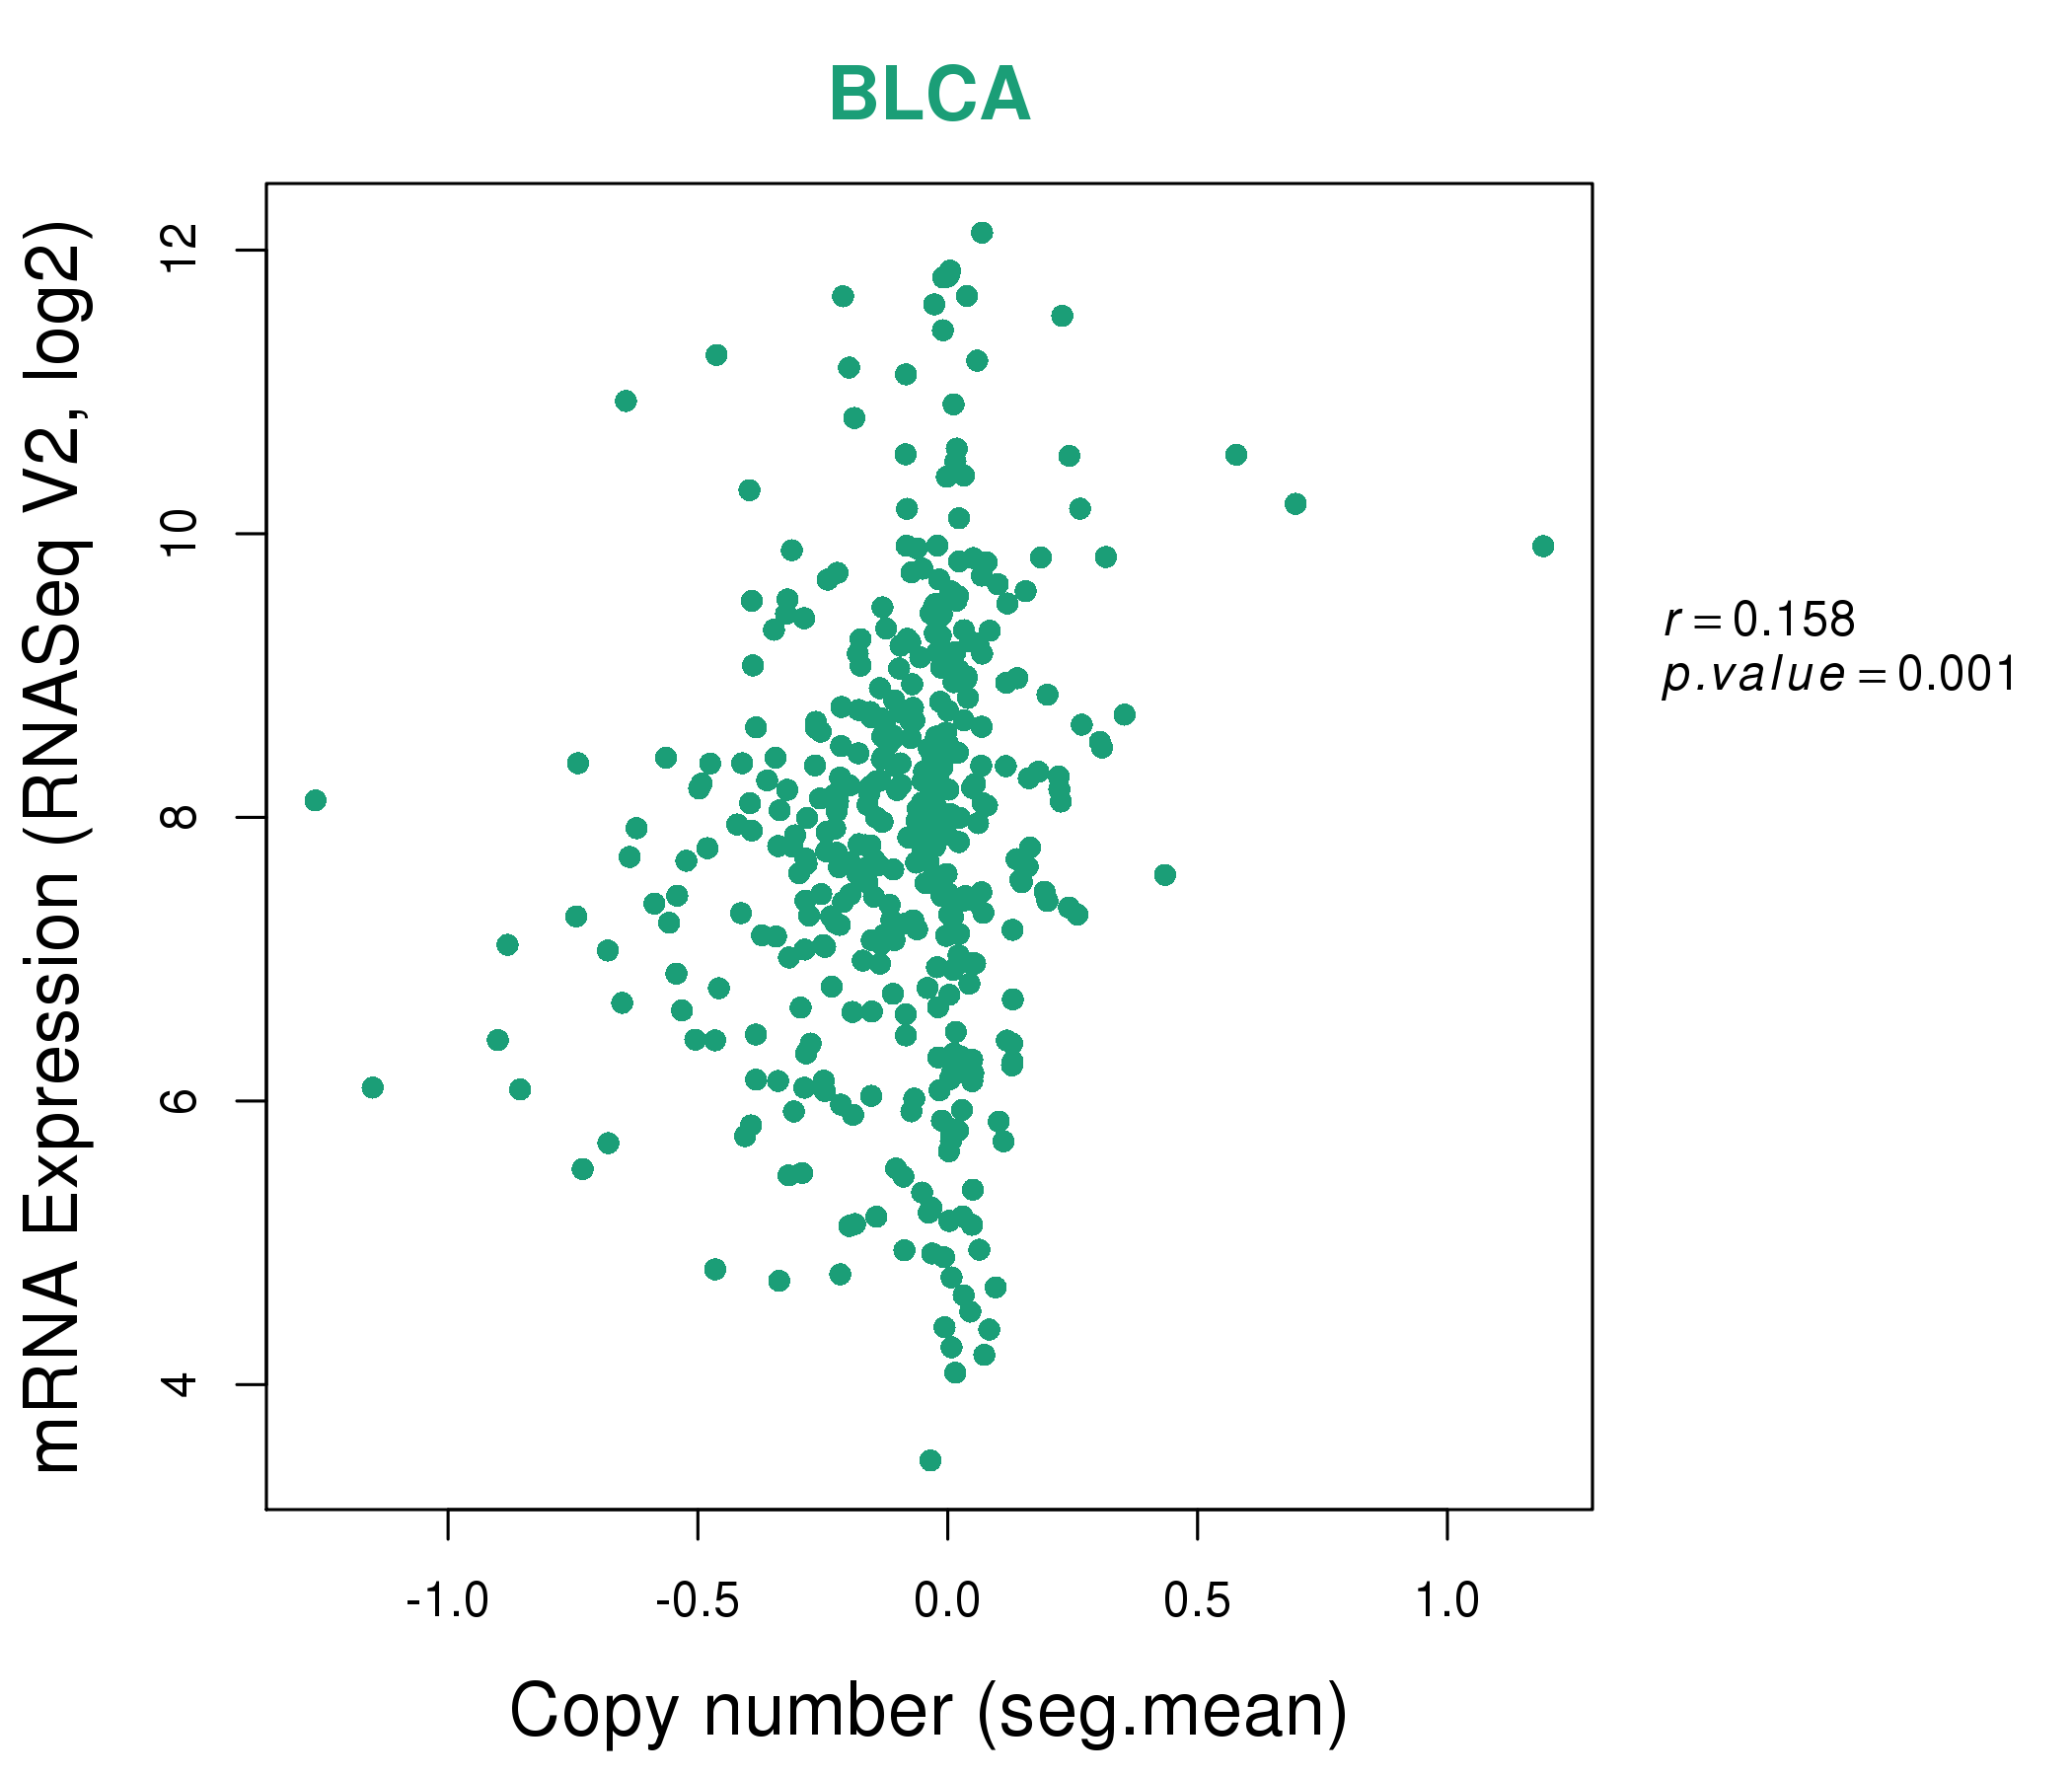
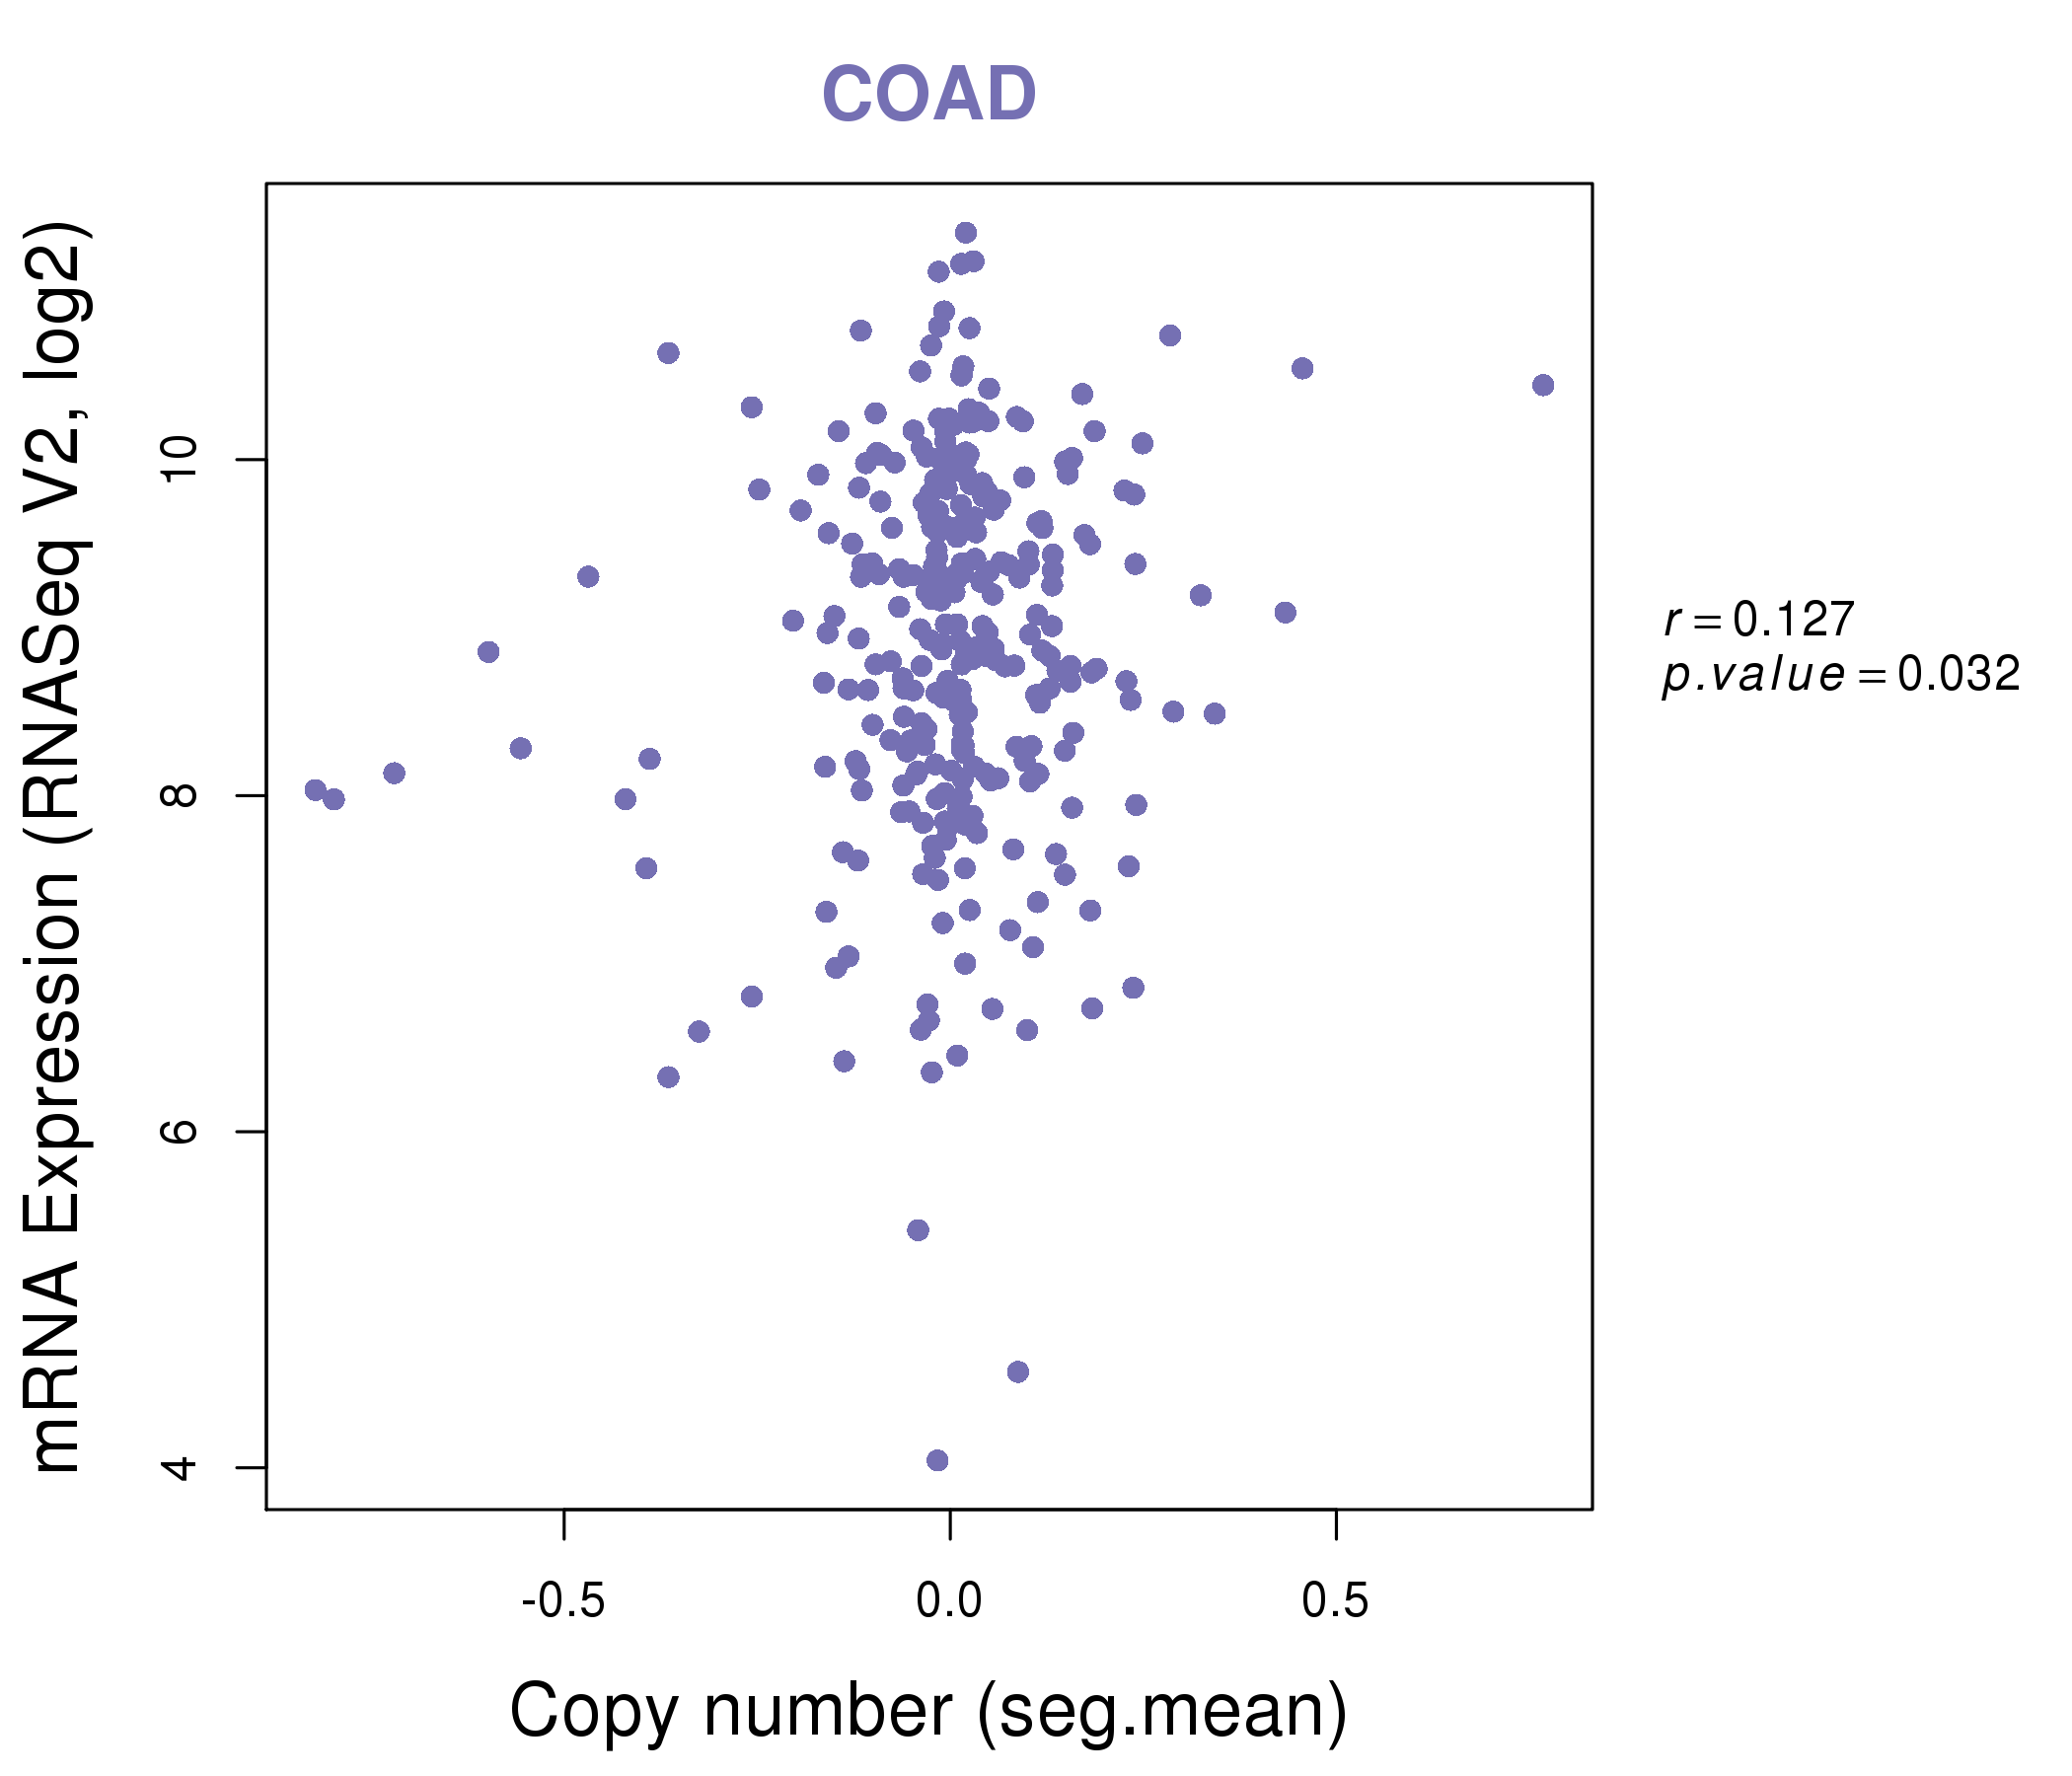
| * Copy number data were extracted from TCGA using R package TCGA-Assembler. The URLs of all public data files on TCGA DCC data server were gathered on Jan-05-2015. Function ProcessCNAData in TCGA-Assembler package was used to obtain gene-level copy number value which is calculated as the average copy number of the genomic region of a gene. |
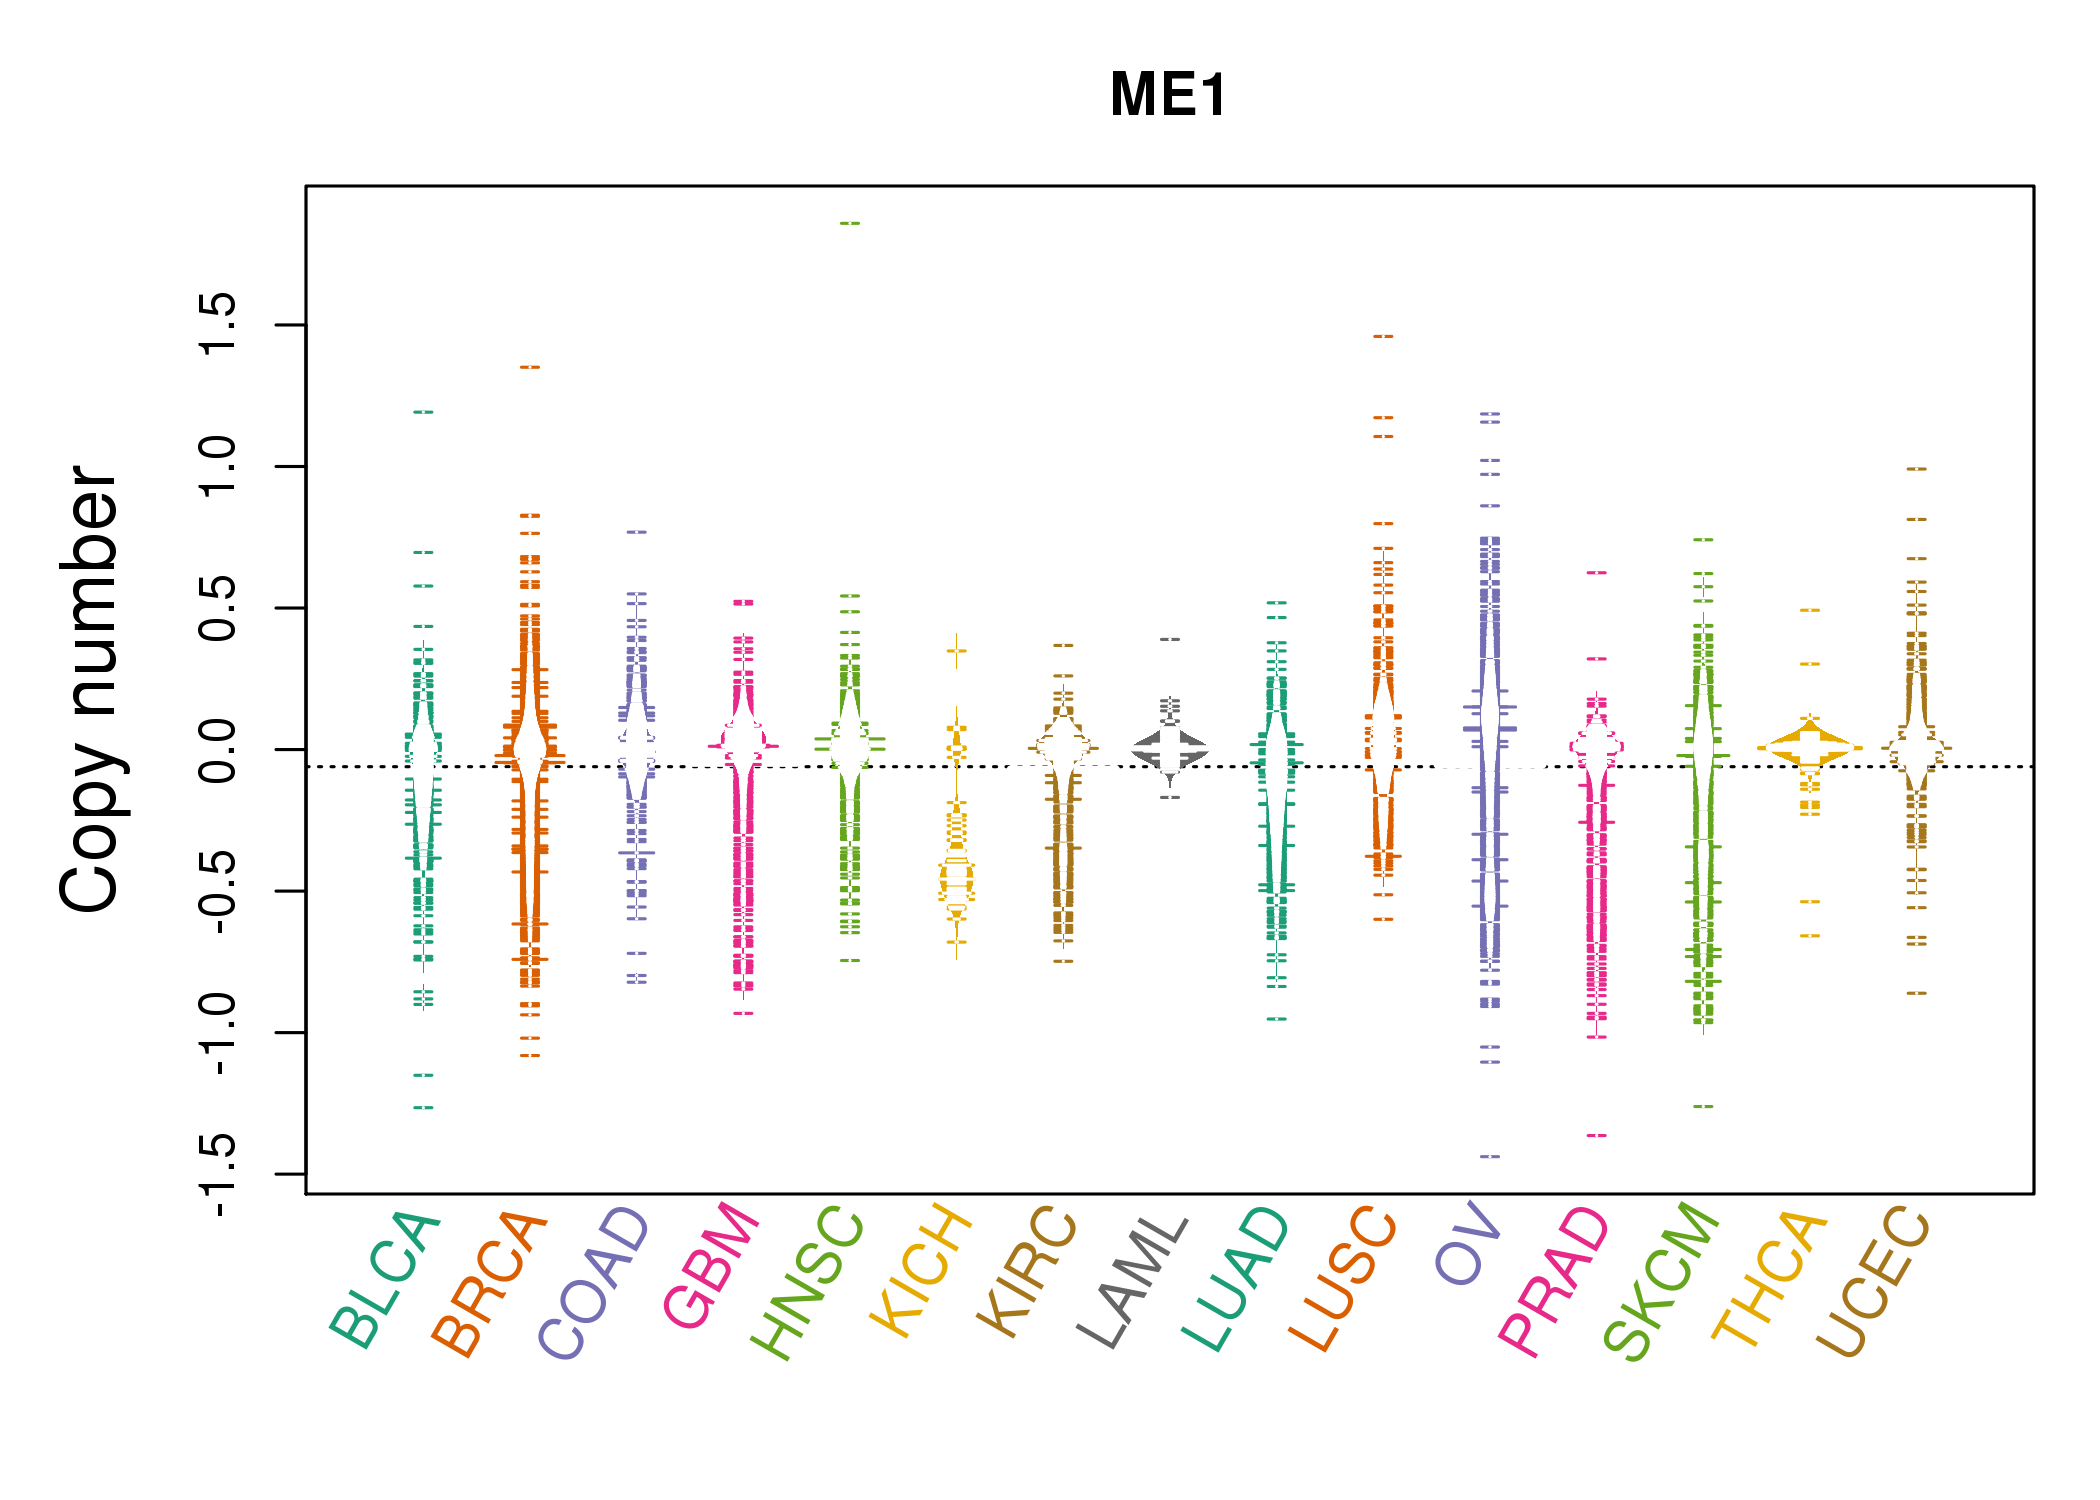 |
| cf) Tissue ID[Tissue type]: BLCA[Bladder Urothelial Carcinoma], BRCA[Breast invasive carcinoma], CESC[Cervical squamous cell carcinoma and endocervical adenocarcinoma], COAD[Colon adenocarcinoma], GBM[Glioblastoma multiforme], Glioma Low Grade, HNSC[Head and Neck squamous cell carcinoma], KICH[Kidney Chromophobe], KIRC[Kidney renal clear cell carcinoma], KIRP[Kidney renal papillary cell carcinoma], LAML[Acute Myeloid Leukemia], LUAD[Lung adenocarcinoma], LUSC[Lung squamous cell carcinoma], OV[Ovarian serous cystadenocarcinoma ], PAAD[Pancreatic adenocarcinoma], PRAD[Prostate adenocarcinoma], SKCM[Skin Cutaneous Melanoma], STAD[Stomach adenocarcinoma], THCA[Thyroid carcinoma], UCEC[Uterine Corpus Endometrial Carcinoma] |
| Top |
| Gene Expression for ME1 |
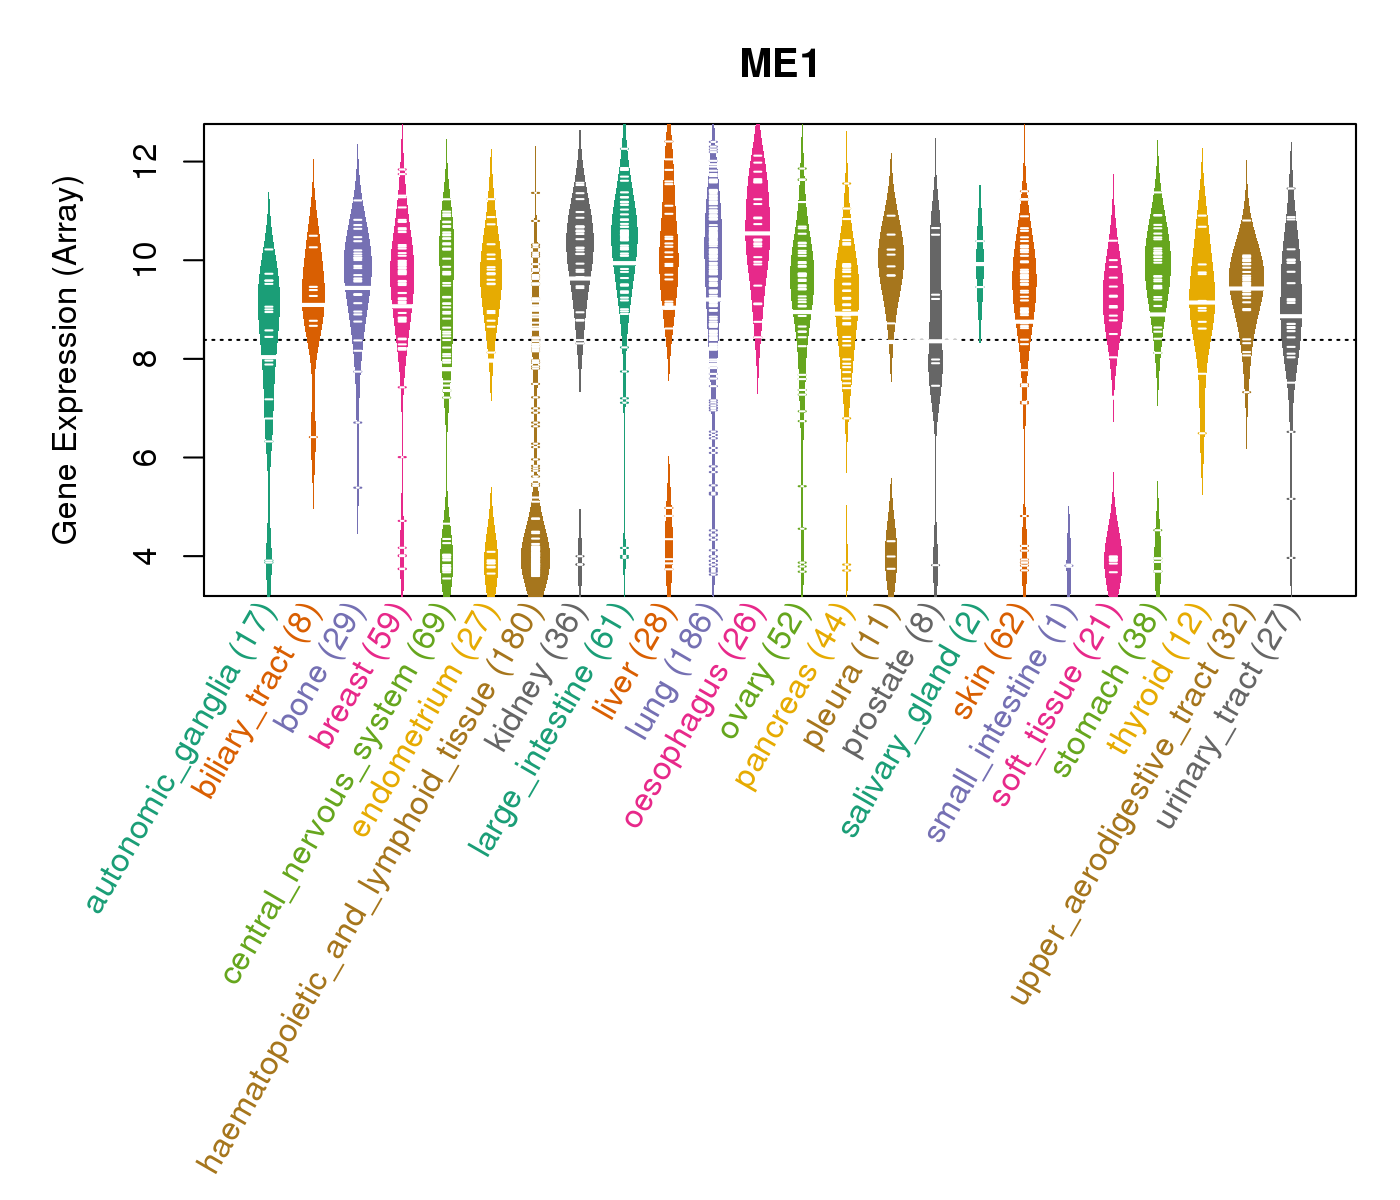
| * CCLE gene expression data were extracted from CCLE_Expression_Entrez_2012-10-18.res: Gene-centric RMA-normalized mRNA expression data. |
 |
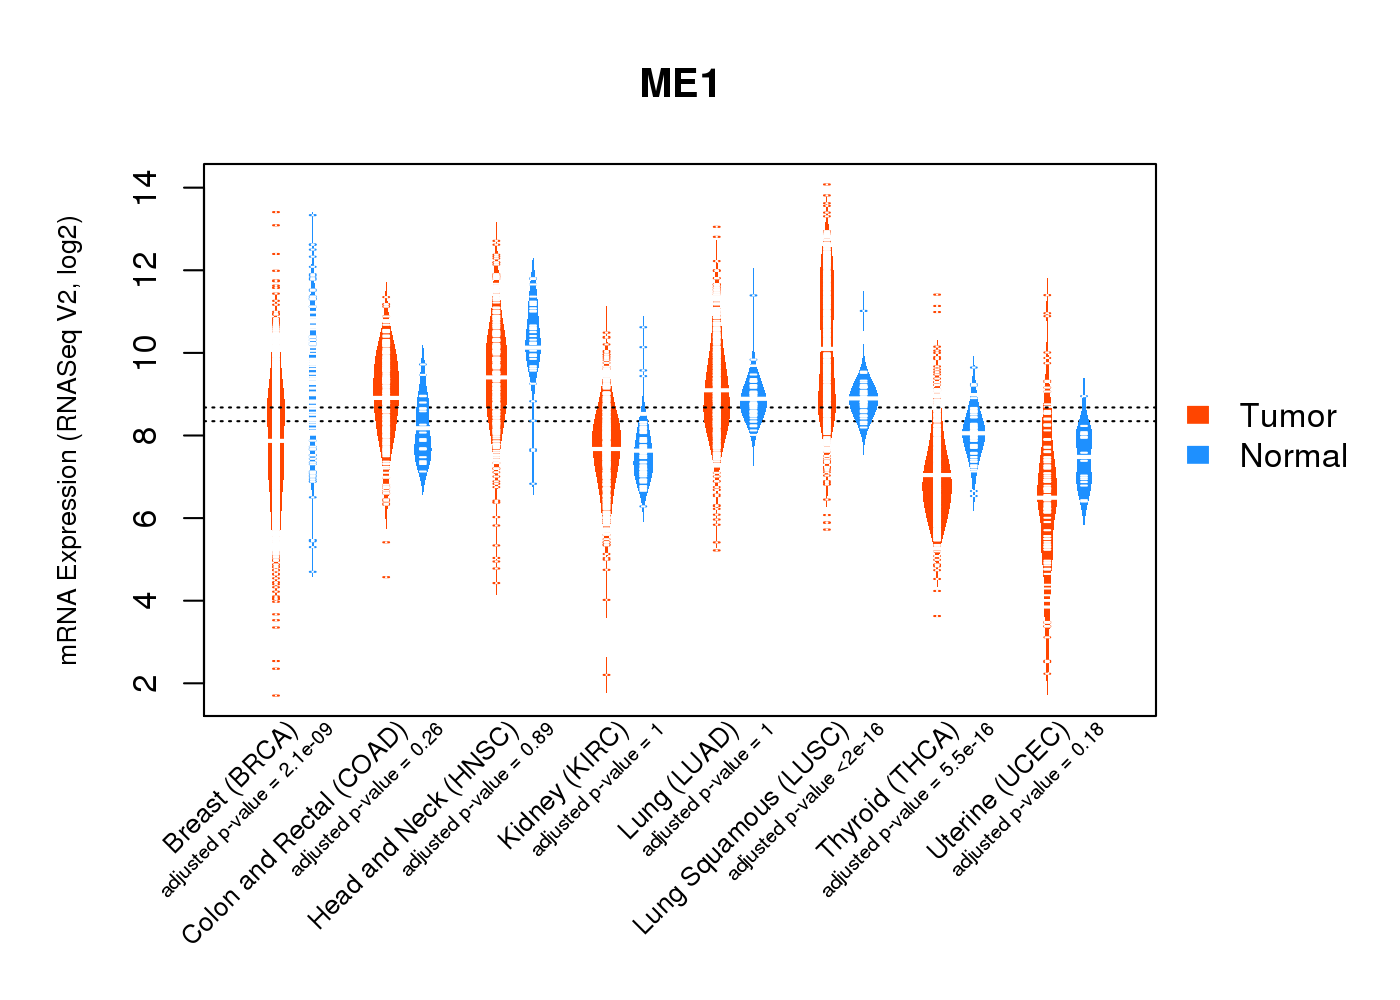
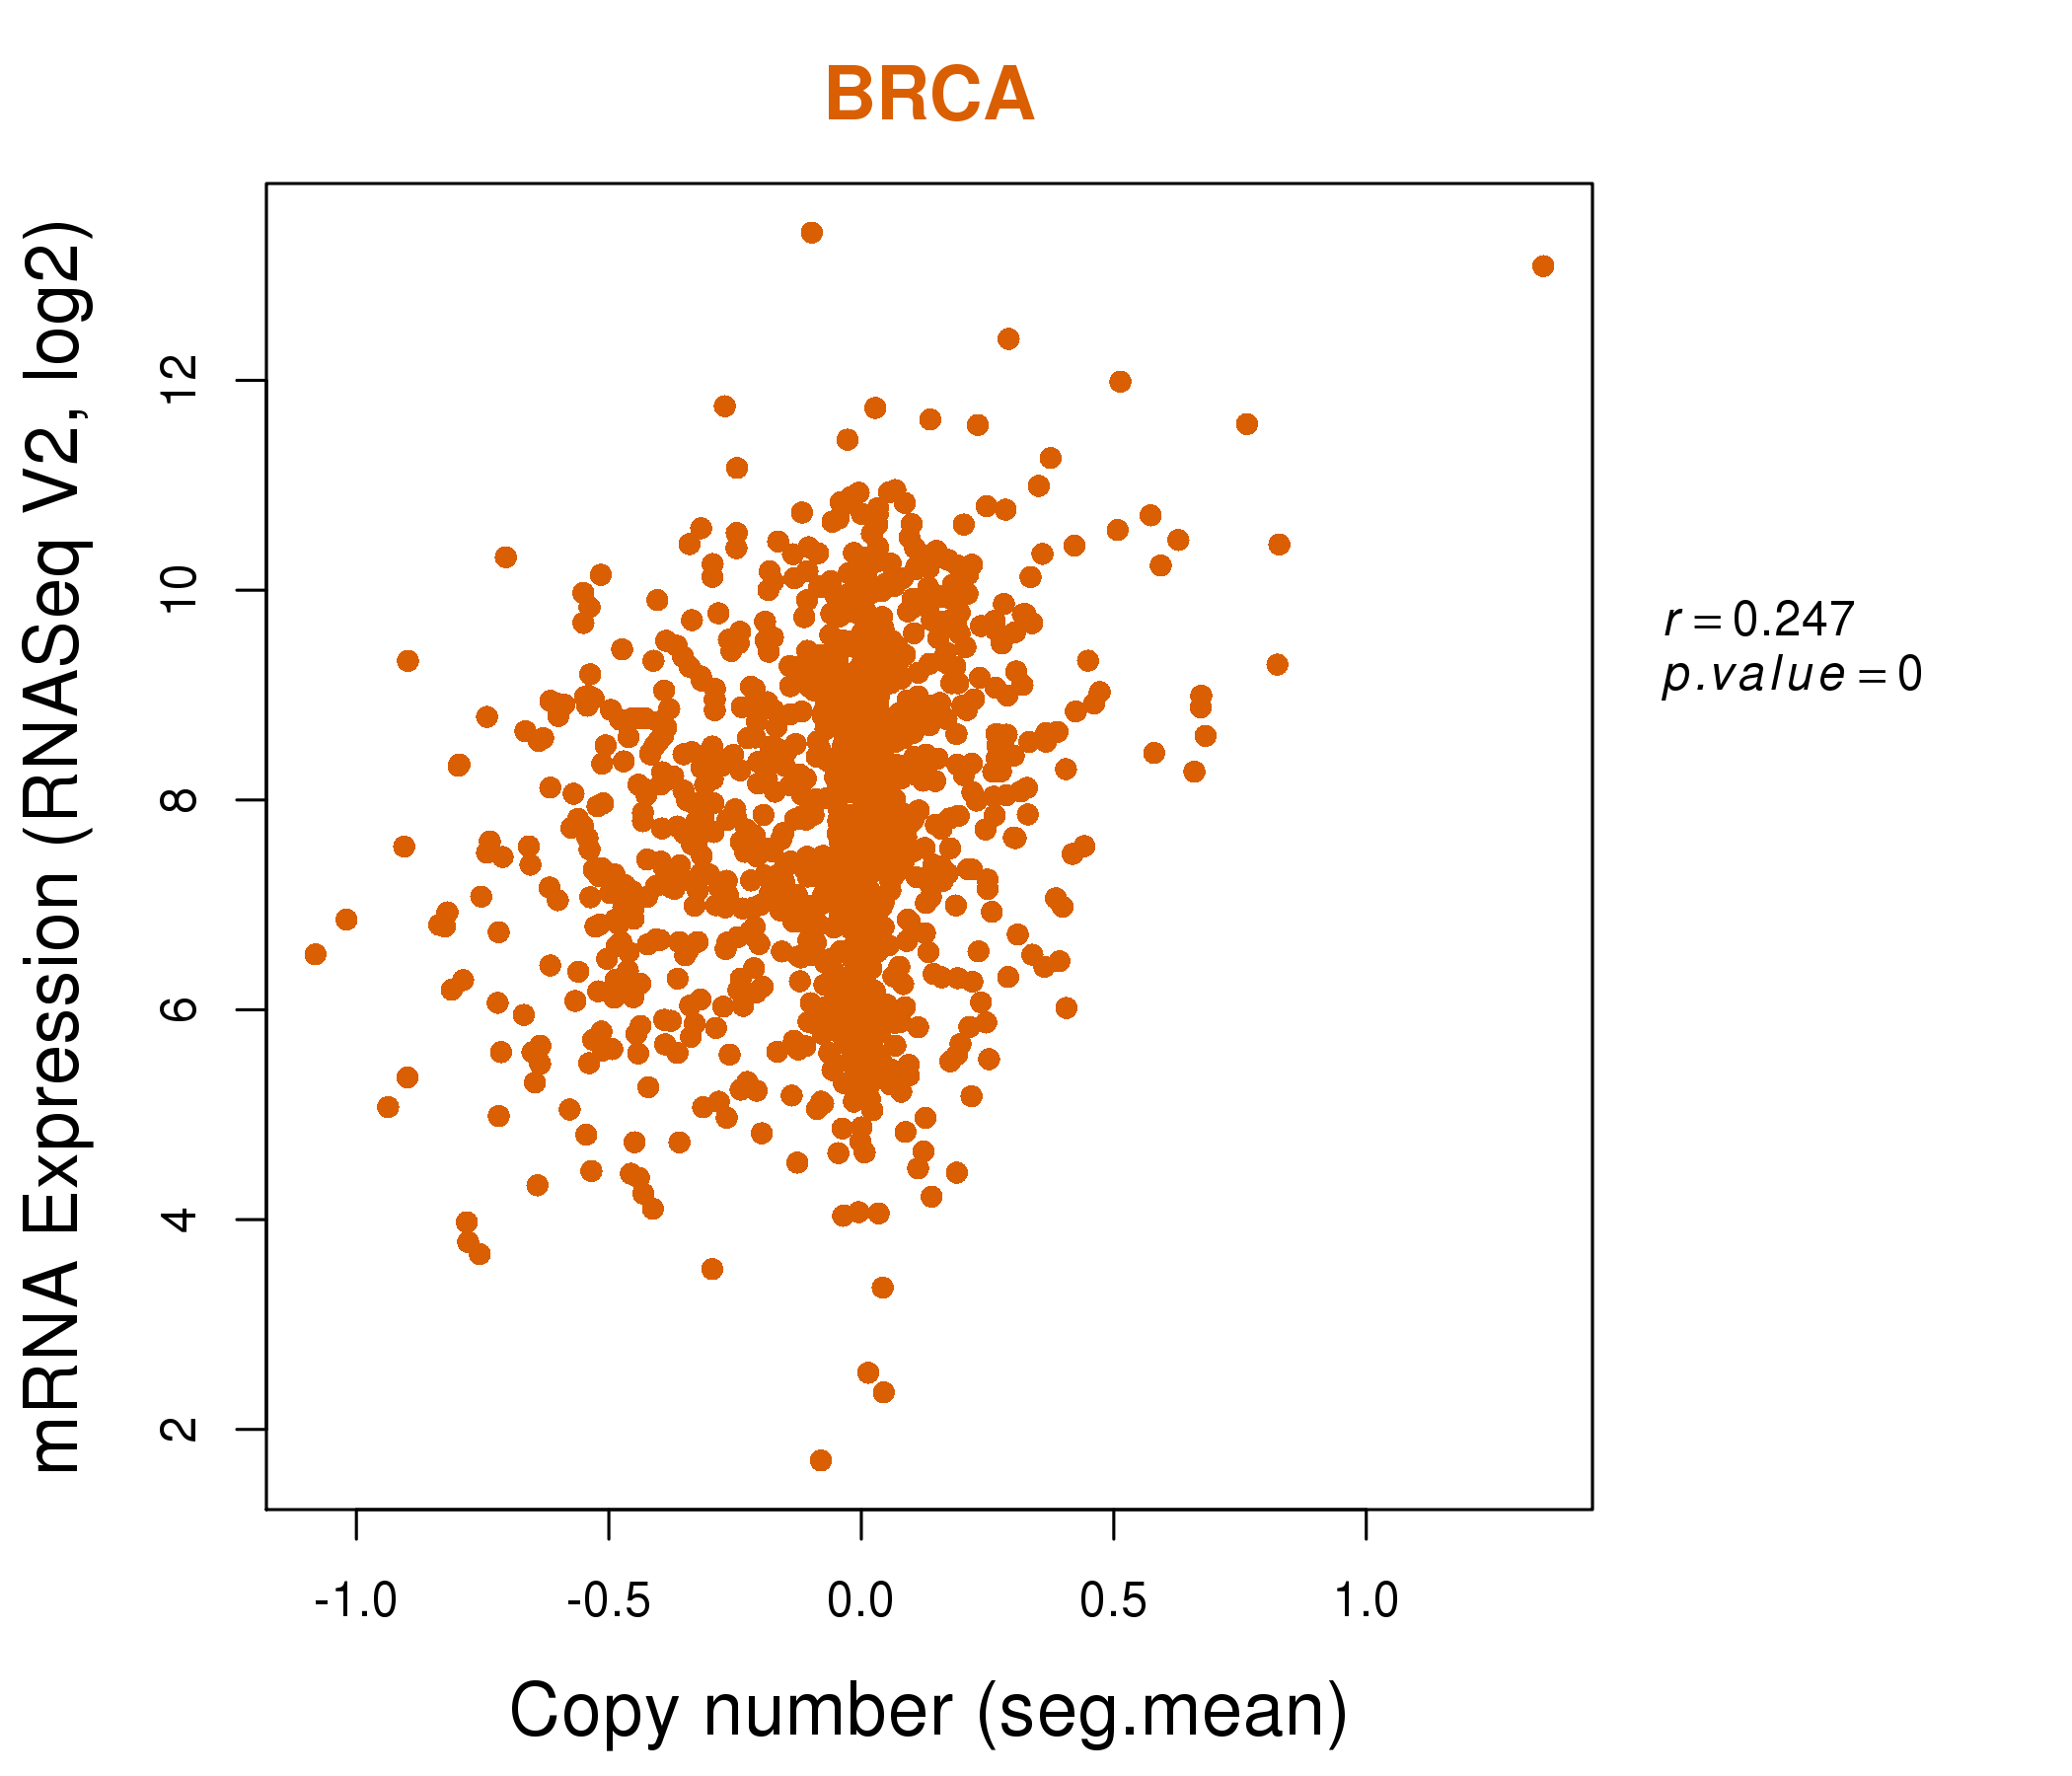
| * Normalized gene expression data of RNASeqV2 was extracted from TCGA using R package TCGA-Assembler. The URLs of all public data files on TCGA DCC data server were gathered at Jan-05-2015. Only eight cancer types have enough normal control samples for differential expression analysis. (t test, adjusted p<0.05 (using Benjamini-Hochberg FDR)) |
 |
| Top |
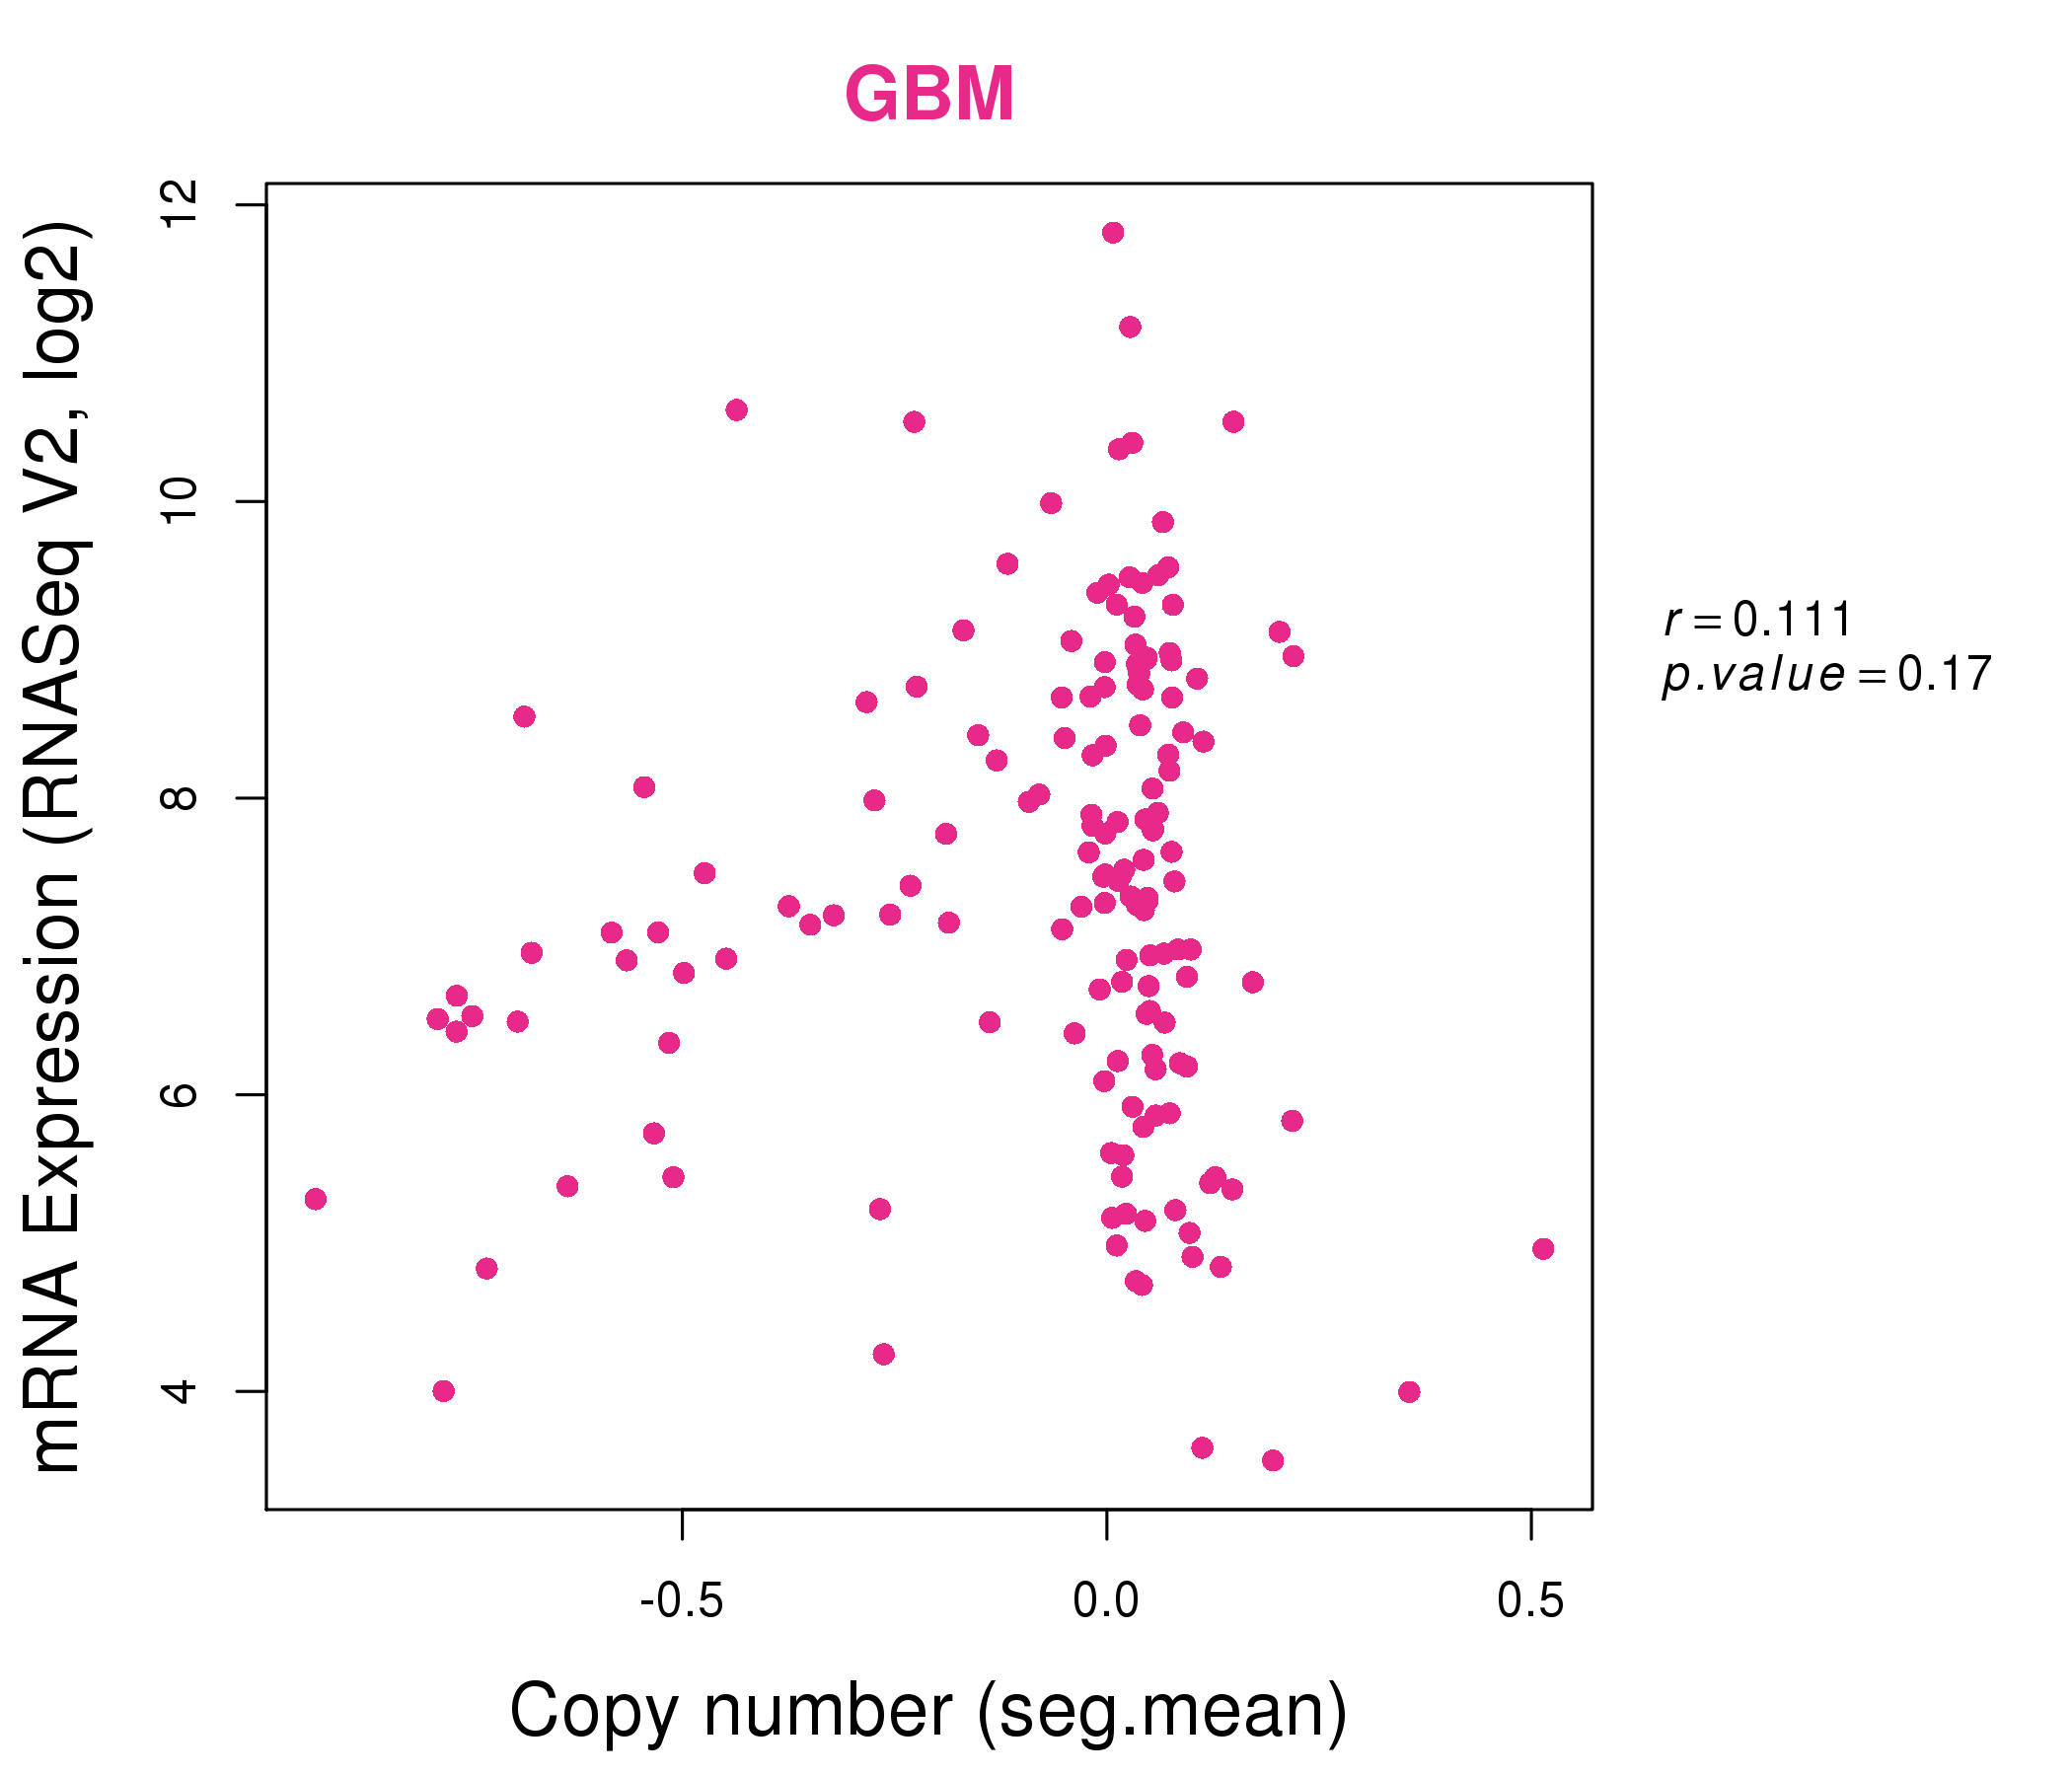
| * This plots show the correlation between CNV and gene expression. |
: Open all plots for all cancer types
 |
|
 |
|
| Top |
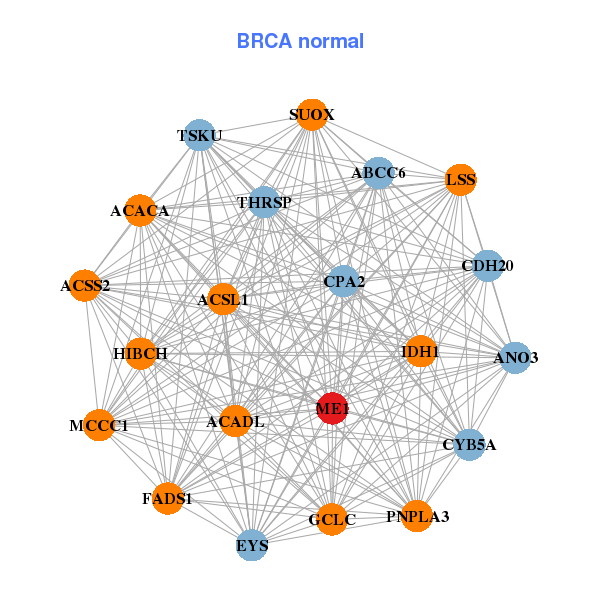
| Gene-Gene Network Information |
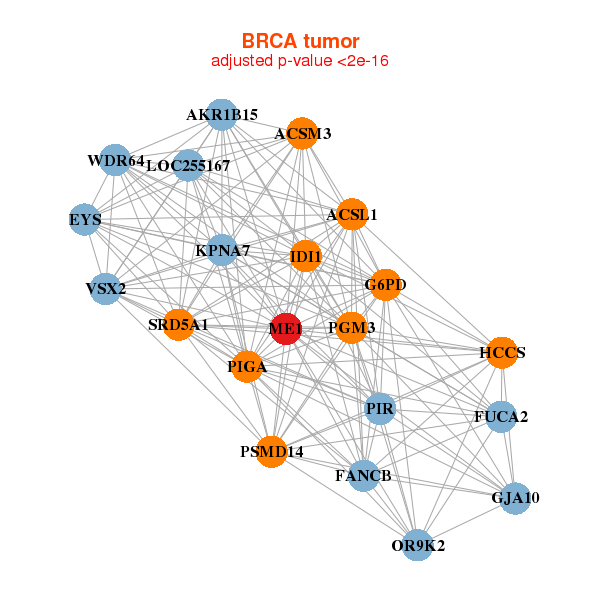
| * Co-Expression network figures were drawn using R package igraph. Only the top 20 genes with the highest correlations were shown. Red circle: input gene, orange circle: cell metabolism gene, sky circle: other gene |
: Open all plots for all cancer types
 |
| ||||
| ACSL1,ACSM3,AKR1B15,EYS,FANCB,FUCA2,G6PD, GJA10,HCCS,IDI1,KPNA7,LOC255167,ME1,OR9K2, PGM3,PIGA,PIR,PSMD14,SRD5A1,VSX2,WDR64 | ABCC6,ACACA,ACADL,ACSL1,ACSS2,ANO3,CDH20, CPA2,CYB5A,EYS,FADS1,GCLC,HIBCH,IDH1, LSS,MCCC1,ME1,PNPLA3,SUOX,THRSP,TSKU | ||||
 |
| ||||
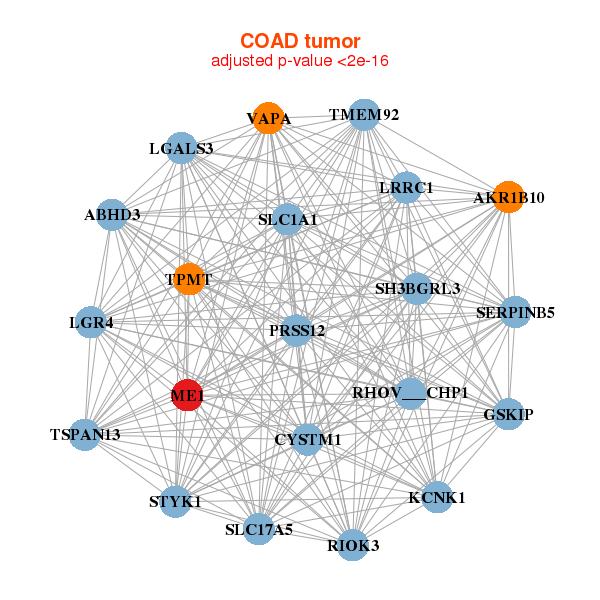
| ABHD3,AKR1B10,GSKIP,CYSTM1,RHOV___CHP1,KCNK1,LGALS3, LGR4,LRRC1,ME1,PRSS12,RIOK3,SERPINB5,SH3BGRL3, SLC17A5,SLC1A1,STYK1,TMEM92,TPMT,TSPAN13,VAPA | C6orf223,CEACAM4,CHRNA5,CLEC4E,CTPS1,EPHA6,FER, FREM2,JAKMIP2,LOC100302640,ME1,NXNL1,TENM2,P4HA3, RSPO2,S100A11,SNORA47,ST7,SYT12,UPF3B,WBP4 |
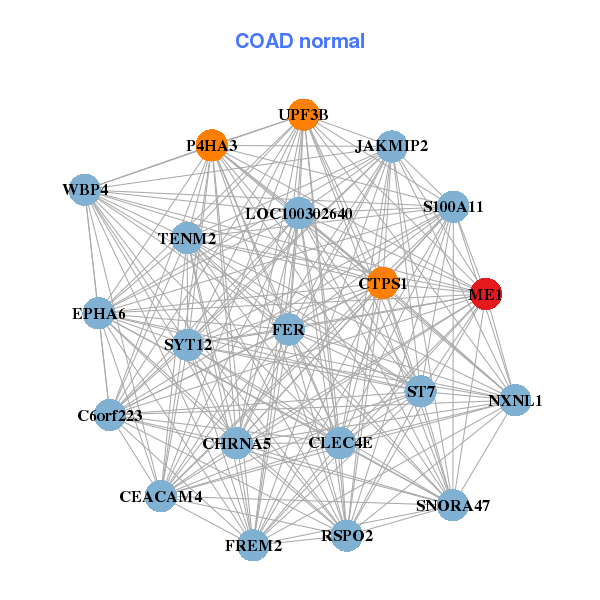
| * Co-Expression network figures were drawn using R package igraph. Only the top 20 genes with the highest correlations were shown. Red circle: input gene, orange circle: cell metabolism gene, sky circle: other gene |
: Open all plots for all cancer types
| Top |
: Open all interacting genes' information including KEGG pathway for all interacting genes from DAVID
| Top |
| Pharmacological Information for ME1 |
| DB Category | DB Name | DB's ID and Url link |
| * Gene Centered Interaction Network. |
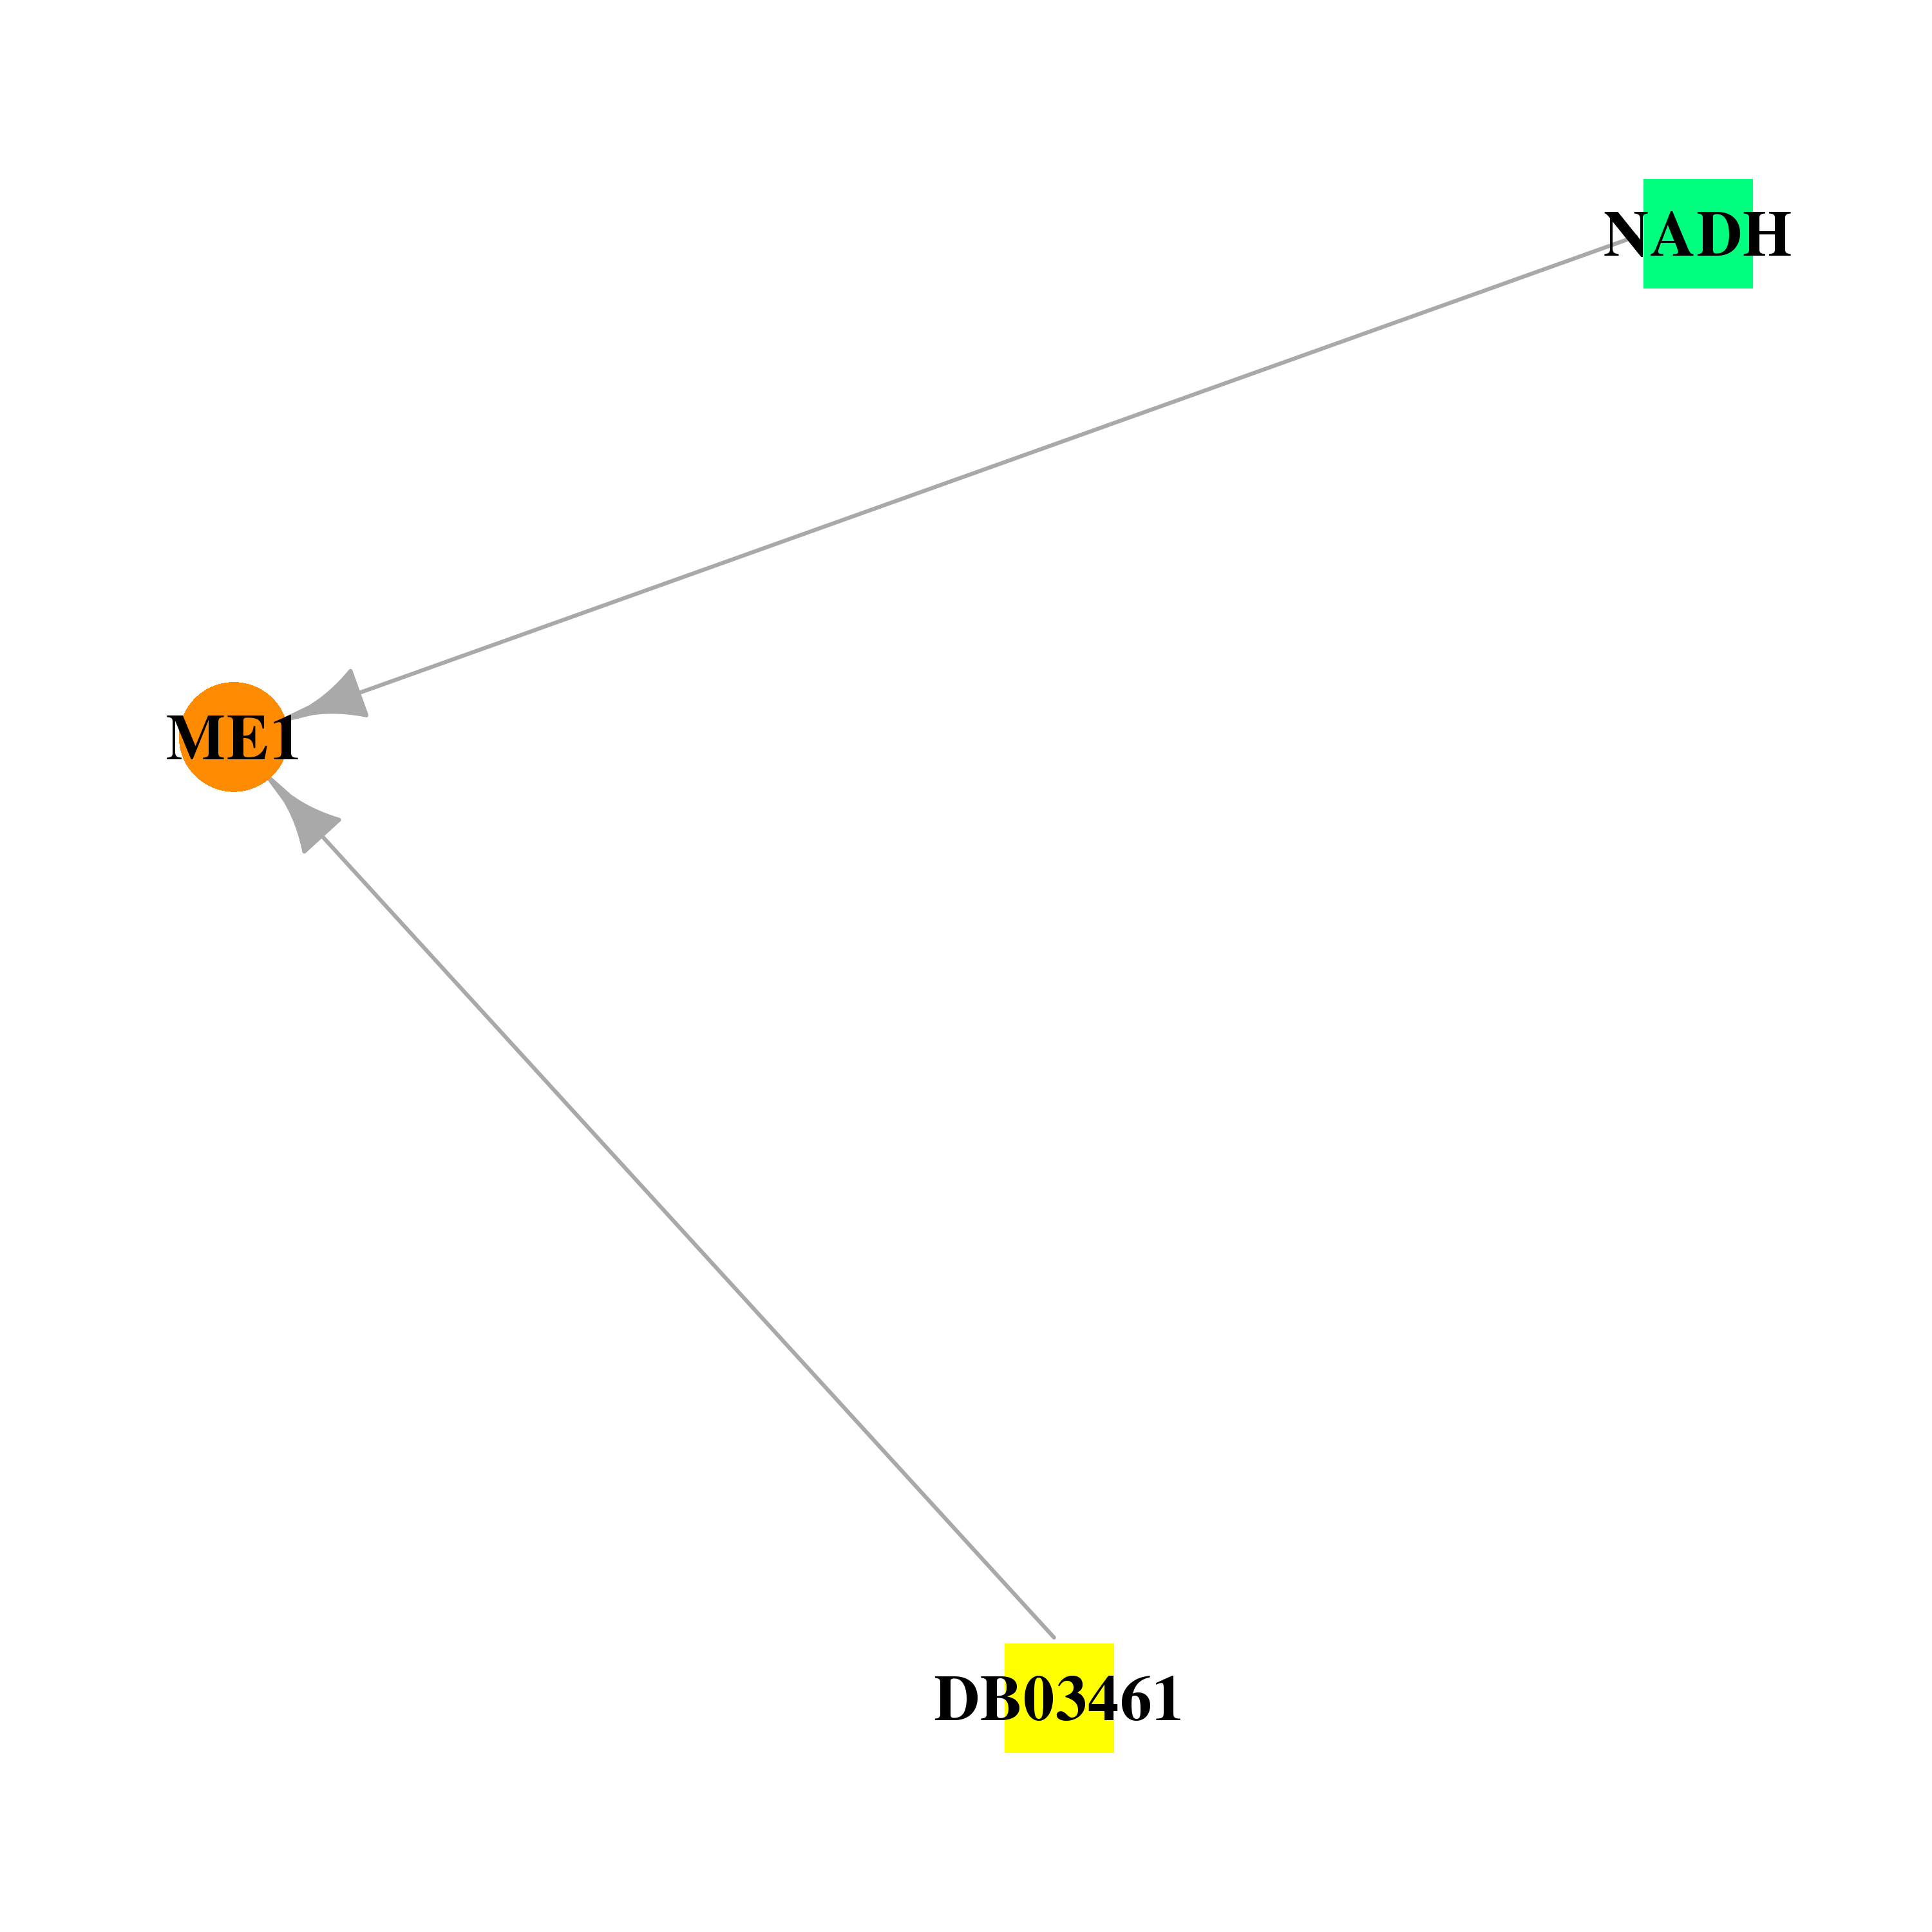 |
| * Drug Centered Interaction Network. |
| DrugBank ID | Target Name | Drug Groups | Generic Name | Drug Centered Network | Drug Structure |
| DB00157 | malic enzyme 1, NADP(+)-dependent, cytosolic | approved; nutraceutical | NADH |  |  |
| DB03461 | malic enzyme 1, NADP(+)-dependent, cytosolic | experimental | 2'-Monophosphoadenosine 5'-Diphosphoribose | 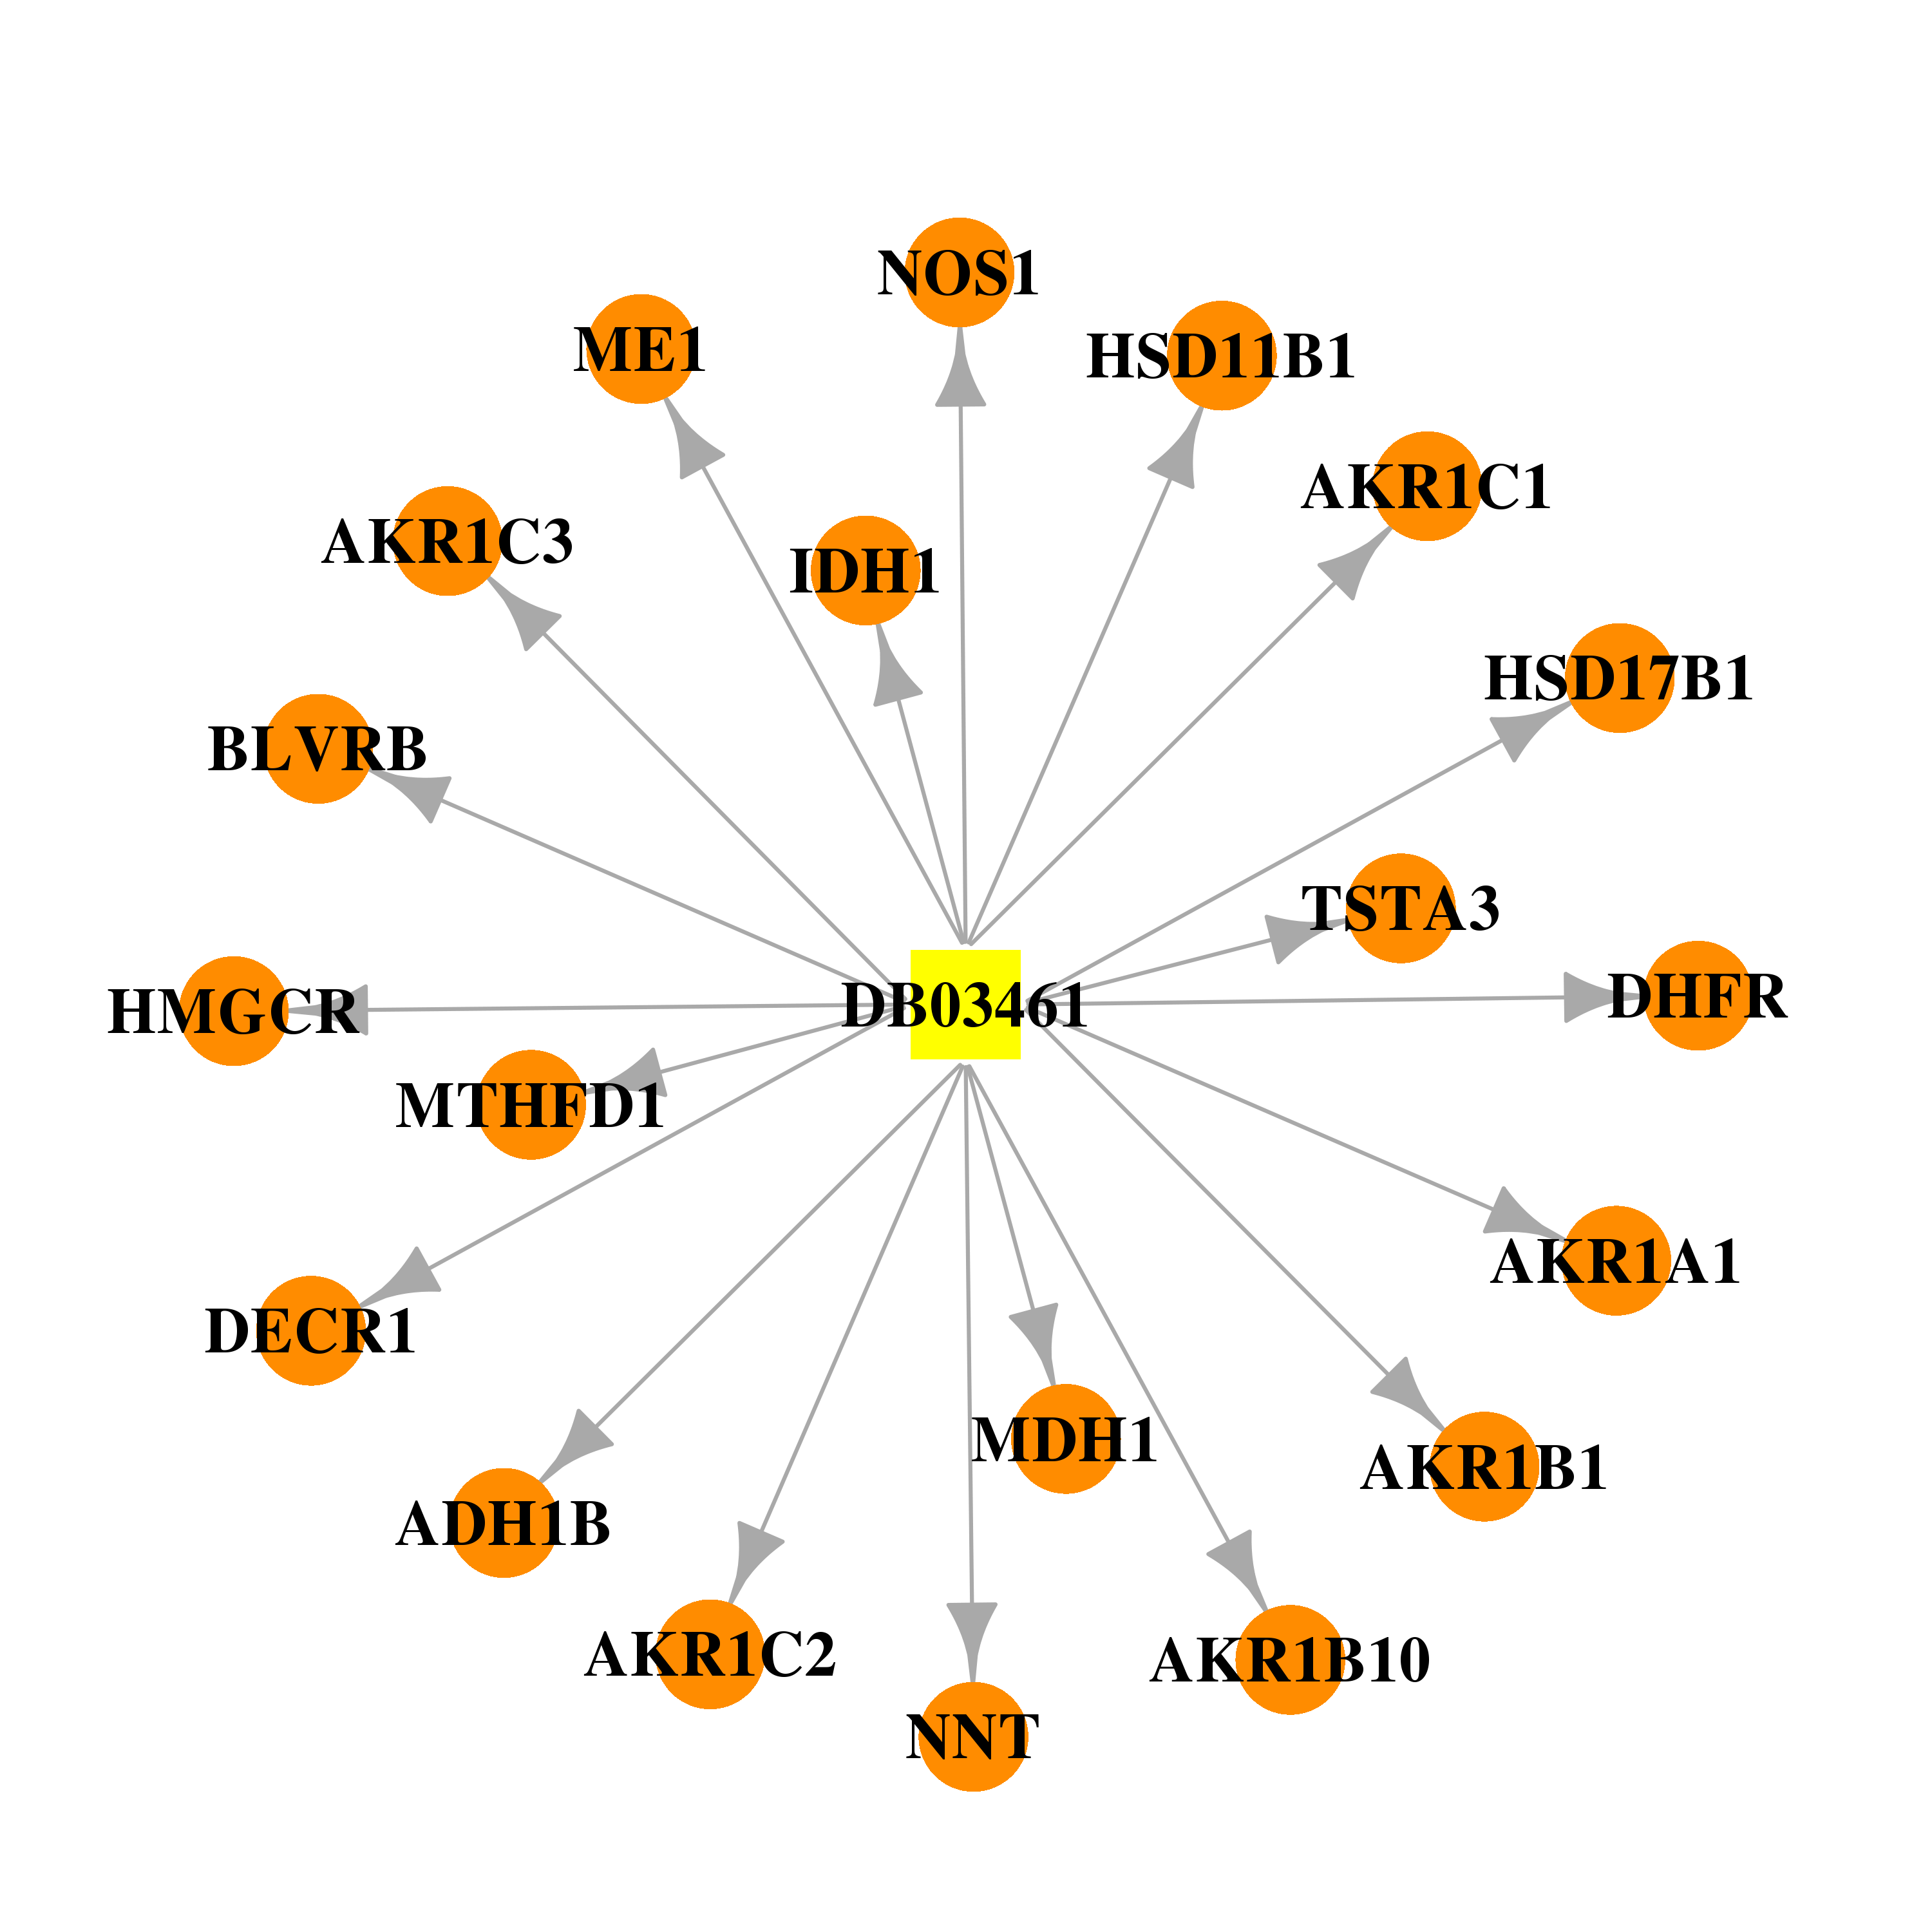 |  |
| Top |
| Cross referenced IDs for ME1 |
| * We obtained these cross-references from Uniprot database. It covers 150 different DBs, 18 categories. http://www.uniprot.org/help/cross_references_section |
: Open all cross reference information
|
Copyright © 2016-Present - The Univsersity of Texas Health Science Center at Houston @ |