|
||||||||||||||||||||||||||||||||||||||||||||||||||||||||||||||||||||||||||||||||||||||||||||||||||||||||||||||||||||||||||||||||||||||||||||||||||||||||||||||||||||||||||||||||||||||||||||||||||||||||||||||||||||||||||||||||||||||||||||||||||||||||||||||||||||||||||||||||||||||||||||||||||||||||||||||||||||||||||
| |
| Phenotypic Information (metabolism pathway, cancer, disease, phenome) |
| |
| |
| Gene-Gene Network Information: Co-Expression Network, Interacting Genes & KEGG |
| |
|


| Gene Summary for MGAT1 |
| Basic gene info. | Gene symbol | MGAT1 |
| Gene name | mannosyl (alpha-1,3-)-glycoprotein beta-1,2-N-acetylglucosaminyltransferase | |
| Synonyms | GLCNAC-TI|GLCT1|GLYT1|GNT-1|GNT-I|MGAT | |
| Cytomap | UCSC genome browser: 5q35 | |
| Genomic location | chr5 :180217540-180236817 | |
| Type of gene | protein-coding | |
| RefGenes | NM_001114617.1, NM_001114618.1,NM_001114619.1,NM_001114620.1,NM_002406.3, | |
| Ensembl id | ENSG00000131446 | |
| Description | N-glycosyl-oligosaccharide-glycoprotein N-acetylglucosaminyltransferase Ialpha-1,3-mannosyl-glycoprotein 2-beta-N-acetylglucosaminyltransferaseglcNAc-T I | |
| Modification date | 20141207 | |
| dbXrefs | MIM : 160995 | |
| HGNC : HGNC | ||
| Ensembl : ENSG00000131446 | ||
| HPRD : 01189 | ||
| Vega : OTTHUMG00000130937 | ||
| Protein | UniProt: go to UniProt's Cross Reference DB Table | |
| Expression | CleanEX: HS_MGAT1 | |
| BioGPS: 4245 | ||
| Gene Expression Atlas: ENSG00000131446 | ||
| The Human Protein Atlas: ENSG00000131446 | ||
| Pathway | NCI Pathway Interaction Database: MGAT1 | |
| KEGG: MGAT1 | ||
| REACTOME: MGAT1 | ||
| ConsensusPathDB | ||
| Pathway Commons: MGAT1 | ||
| Metabolism | MetaCyc: MGAT1 | |
| HUMANCyc: MGAT1 | ||
| Regulation | Ensembl's Regulation: ENSG00000131446 | |
| miRBase: chr5 :180,217,540-180,236,817 | ||
| TargetScan: NM_001114617 | ||
| cisRED: ENSG00000131446 | ||
| Context | iHOP: MGAT1 | |
| cancer metabolism search in PubMed: MGAT1 | ||
| UCL Cancer Institute: MGAT1 | ||
| Assigned class in ccmGDB | C | |
| Top |
| Phenotypic Information for MGAT1(metabolism pathway, cancer, disease, phenome) |
| Cancer | CGAP: MGAT1 |
| Familial Cancer Database: MGAT1 | |
| * This gene is included in those cancer gene databases. |
|
|
|
|
|
| . | ||||||||||||||||||||||||||||||||||||||||||||||||||||||||||||||||||||||||||||||||||||||||||||||||||||||||||||||||||||||||||||||||||||||||||||||||||||||||||||||||||||||||||||||||||||||||||||||||||||||||||||||||||||||||||||||||||||||||||||||||||||||||||||||||||||||||||||||||||||||||||||||||||||||||||||||||||||
Oncogene 1 | Significant driver gene in | |||||||||||||||||||||||||||||||||||||||||||||||||||||||||||||||||||||||||||||||||||||||||||||||||||||||||||||||||||||||||||||||||||||||||||||||||||||||||||||||||||||||||||||||||||||||||||||||||||||||||||||||||||||||||||||||||||||||||||||||||||||||||||||||||||||||||||||||||||||||||||||||||||||||||||||||||||||||||
| cf) number; DB name 1 Oncogene; http://nar.oxfordjournals.org/content/35/suppl_1/D721.long, 2 Tumor Suppressor gene; https://bioinfo.uth.edu/TSGene/, 3 Cancer Gene Census; http://www.nature.com/nrc/journal/v4/n3/abs/nrc1299.html, 4 CancerGenes; http://nar.oxfordjournals.org/content/35/suppl_1/D721.long, 5 Network of Cancer Gene; http://ncg.kcl.ac.uk/index.php, 1Therapeutic Vulnerabilities in Cancer; http://cbio.mskcc.org/cancergenomics/statius/ |
| REACTOME_METABOLISM_OF_PROTEINS | |
| OMIM | |
| Orphanet | |
| Disease | KEGG Disease: MGAT1 |
| MedGen: MGAT1 (Human Medical Genetics with Condition) | |
| ClinVar: MGAT1 | |
| Phenotype | MGI: MGAT1 (International Mouse Phenotyping Consortium) |
| PhenomicDB: MGAT1 | |
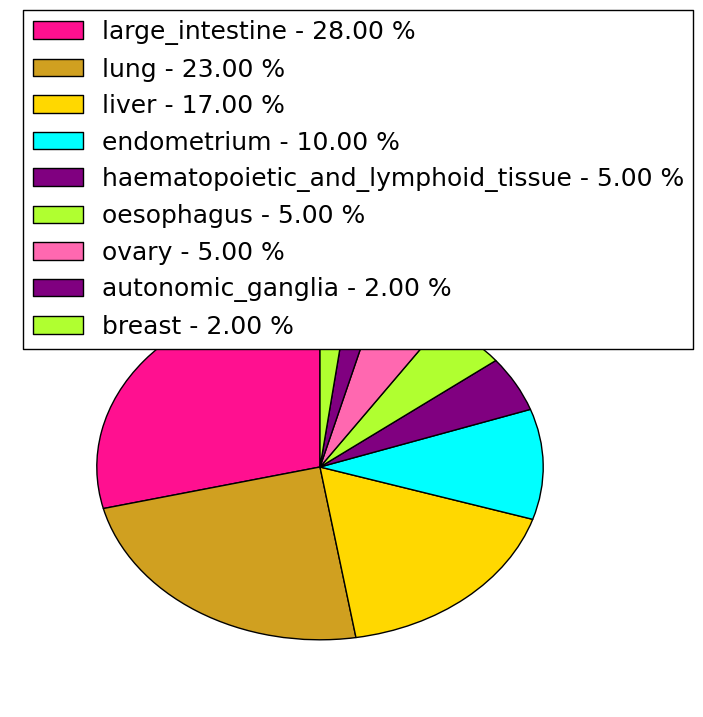
| Mutations for MGAT1 |
| * Under tables are showing count per each tissue to give us broad intuition about tissue specific mutation patterns.You can go to the detailed page for each mutation database's web site. |
| - Statistics for Tissue and Mutation type | Top |
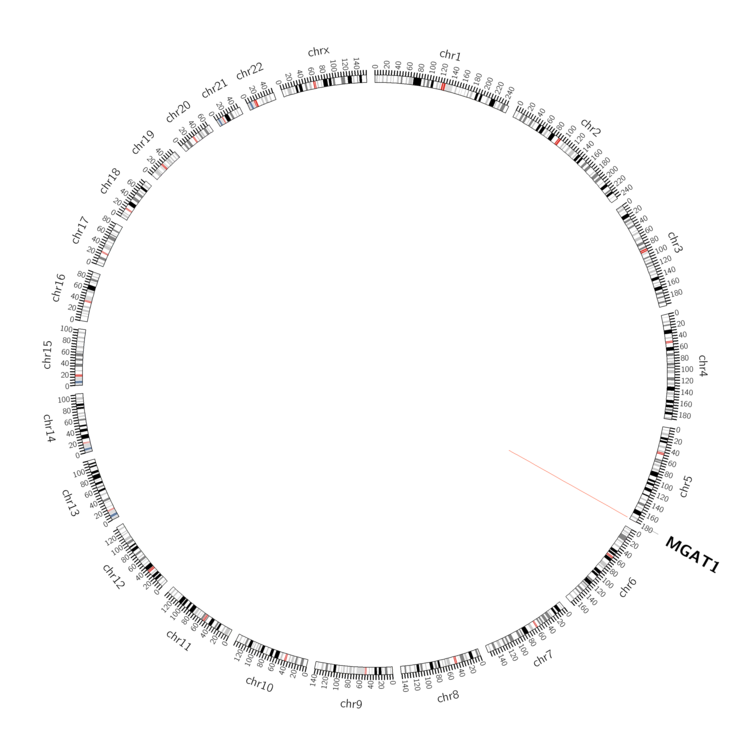 |
| - For Inter-chromosomal Variations |
| There's no inter-chromosomal structural variation. |
| - For Intra-chromosomal Variations |
| * Intra-chromosomal variantions includes 'intrachromosomal amplicon to amplicon', 'intrachromosomal amplicon to non-amplified dna', 'intrachromosomal deletion', 'intrachromosomal fold-back inversion', 'intrachromosomal inversion', 'intrachromosomal tandem duplication', 'Intrachromosomal unknown type', 'intrachromosomal with inverted orientation', 'intrachromosomal with non-inverted orientation'. |
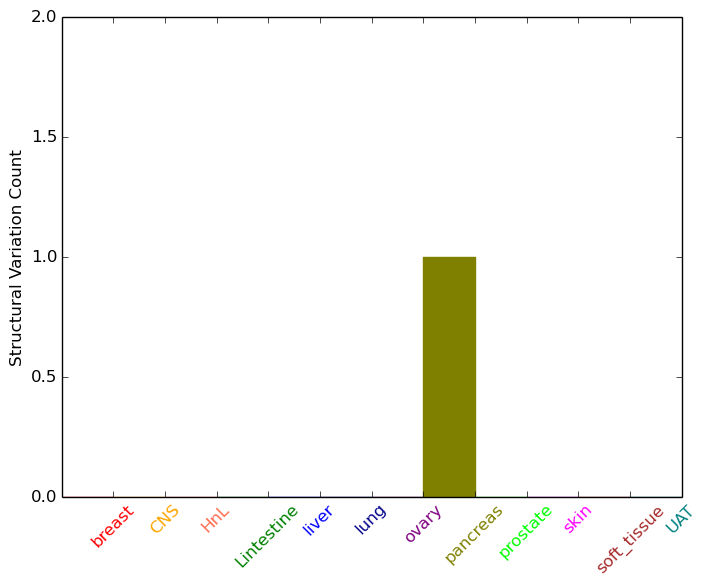 |
| Sample | Symbol_a | Chr_a | Start_a | End_a | Symbol_b | Chr_b | Start_b | End_b |
| pancreas | MGAT1 | chr5 | 180221094 | 180221114 | MGAT1 | chr5 | 180221405 | 180221425 |
| cf) Tissue number; Tissue name (1;Breast, 2;Central_nervous_system, 3;Haematopoietic_and_lymphoid_tissue, 4;Large_intestine, 5;Liver, 6;Lung, 7;Ovary, 8;Pancreas, 9;Prostate, 10;Skin, 11;Soft_tissue, 12;Upper_aerodigestive_tract) |
| * From mRNA Sanger sequences, Chitars2.0 arranged chimeric transcripts. This table shows MGAT1 related fusion information. |
| ID | Head Gene | Tail Gene | Accession | Gene_a | qStart_a | qEnd_a | Chromosome_a | tStart_a | tEnd_a | Gene_a | qStart_a | qEnd_a | Chromosome_a | tStart_a | tEnd_a |
| AA730426 | MGAT1 | 1 | 67 | 5 | 180217737 | 180217802 | MGAT1 | 65 | 163 | 5 | 180217811 | 180217909 | |
| DA351137 | MGAT1 | 1 | 316 | 5 | 180235839 | 180237117 | DCAF8 | 315 | 594 | 1 | 160209991 | 160231942 | |
| AW818318 | SLC2A10 | 29 | 61 | 20 | 45361542 | 45361575 | MGAT1 | 59 | 156 | 5 | 180224026 | 180224123 | |
| Top |
| Mutation type/ Tissue ID | brca | cns | cerv | endome | haematopo | kidn | Lintest | liver | lung | ns | ovary | pancre | prost | skin | stoma | thyro | urina | |||
| Total # sample | 1 | |||||||||||||||||||
| GAIN (# sample) | 1 | |||||||||||||||||||
| LOSS (# sample) |
| cf) Tissue ID; Tissue type (1; Breast, 2; Central_nervous_system, 3; Cervix, 4; Endometrium, 5; Haematopoietic_and_lymphoid_tissue, 6; Kidney, 7; Large_intestine, 8; Liver, 9; Lung, 10; NS, 11; Ovary, 12; Pancreas, 13; Prostate, 14; Skin, 15; Stomach, 16; Thyroid, 17; Urinary_tract) |
| Top |
|
 |
| Top |
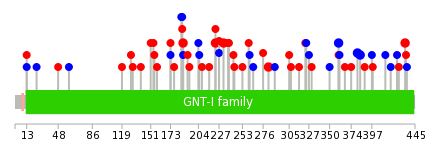
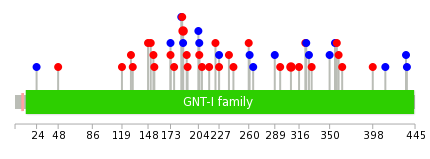
| Stat. for Non-Synonymous SNVs (# total SNVs=39) | (# total SNVs=19) |
 |  |
(# total SNVs=0) | (# total SNVs=0) |
| Top |
| * When you move the cursor on each content, you can see more deailed mutation information on the Tooltip. Those are primary_site,primary_histology,mutation(aa),pubmedID. |
| GRCh37 position | Mutation(aa) | Unique sampleID count |
| chr5:180218820-180218820 | p.V384V | 2 |
| chr5:180218831-180218831 | p.L381L | 2 |
| chr5:180218671-180218671 | p.P434Q | 2 |
| chr5:180219278-180219278 | p.D232N | 2 |
| chr5:180218892-180218892 | p.A360A | 2 |
| chr5:180219127-180219127 | p.K282T | 2 |
| chr5:180219413-180219413 | p.R187C | 2 |
| chr5:180219304-180219304 | p.R223Q | 2 |
| chr5:180219193-180219193 | p.R260H | 1 |
| chr5:180219580-180219580 | p.S131L | 1 |
| Top |
|
 |
| Point Mutation/ Tissue ID | 1 | 2 | 3 | 4 | 5 | 6 | 7 | 8 | 9 | 10 | 11 | 12 | 13 | 14 | 15 | 16 | 17 | 18 | 19 | 20 |
| # sample | 4 | 12 | 2 | 3 | 4 | 2 | 1 | 3 | 8 | 6 | ||||||||||
| # mutation | 5 | 11 | 2 | 3 | 4 | 2 | 1 | 3 | 8 | 8 | ||||||||||
| nonsynonymous SNV | 5 | 8 | 1 | 3 | 2 | 2 | 1 | 2 | 2 | 4 | ||||||||||
| synonymous SNV | 3 | 1 | 2 | 1 | 6 | 4 |
| cf) Tissue ID; Tissue type (1; BLCA[Bladder Urothelial Carcinoma], 2; BRCA[Breast invasive carcinoma], 3; CESC[Cervical squamous cell carcinoma and endocervical adenocarcinoma], 4; COAD[Colon adenocarcinoma], 5; GBM[Glioblastoma multiforme], 6; Glioma Low Grade, 7; HNSC[Head and Neck squamous cell carcinoma], 8; KICH[Kidney Chromophobe], 9; KIRC[Kidney renal clear cell carcinoma], 10; KIRP[Kidney renal papillary cell carcinoma], 11; LAML[Acute Myeloid Leukemia], 12; LUAD[Lung adenocarcinoma], 13; LUSC[Lung squamous cell carcinoma], 14; OV[Ovarian serous cystadenocarcinoma ], 15; PAAD[Pancreatic adenocarcinoma], 16; PRAD[Prostate adenocarcinoma], 17; SKCM[Skin Cutaneous Melanoma], 18:STAD[Stomach adenocarcinoma], 19:THCA[Thyroid carcinoma], 20:UCEC[Uterine Corpus Endometrial Carcinoma]) |
| Top |
| * We represented just top 10 SNVs. When you move the cursor on each content, you can see more deailed mutation information on the Tooltip. Those are primary_site, primary_histology, mutation(aa), pubmedID. |
| Genomic Position | Mutation(aa) | Unique sampleID count |
| chr5:180219413 | p.E307A,MGAT1 | 2 |
| chr5:180219052 | p.R187C,MGAT1 | 2 |
| chr5:180219397 | p.R316H,MGAT1 | 1 |
| chr5:180218983 | p.A204A,MGAT1 | 1 |
| chr5:180219521 | p.R119W,MGAT1 | 1 |
| chr5:180219243 | p.A192V,MGAT1 | 1 |
| chr5:180219400 | p.A48T,MGAT1 | 1 |
| chr5:180218991 | p.P295Q,MGAT1 | 1 |
| chr5:180219529 | p.W191L,MGAT1 | 1 |
| chr5:180219260 | p.L24L,MGAT1 | 1 |
| * Copy number data were extracted from TCGA using R package TCGA-Assembler. The URLs of all public data files on TCGA DCC data server were gathered on Jan-05-2015. Function ProcessCNAData in TCGA-Assembler package was used to obtain gene-level copy number value which is calculated as the average copy number of the genomic region of a gene. |
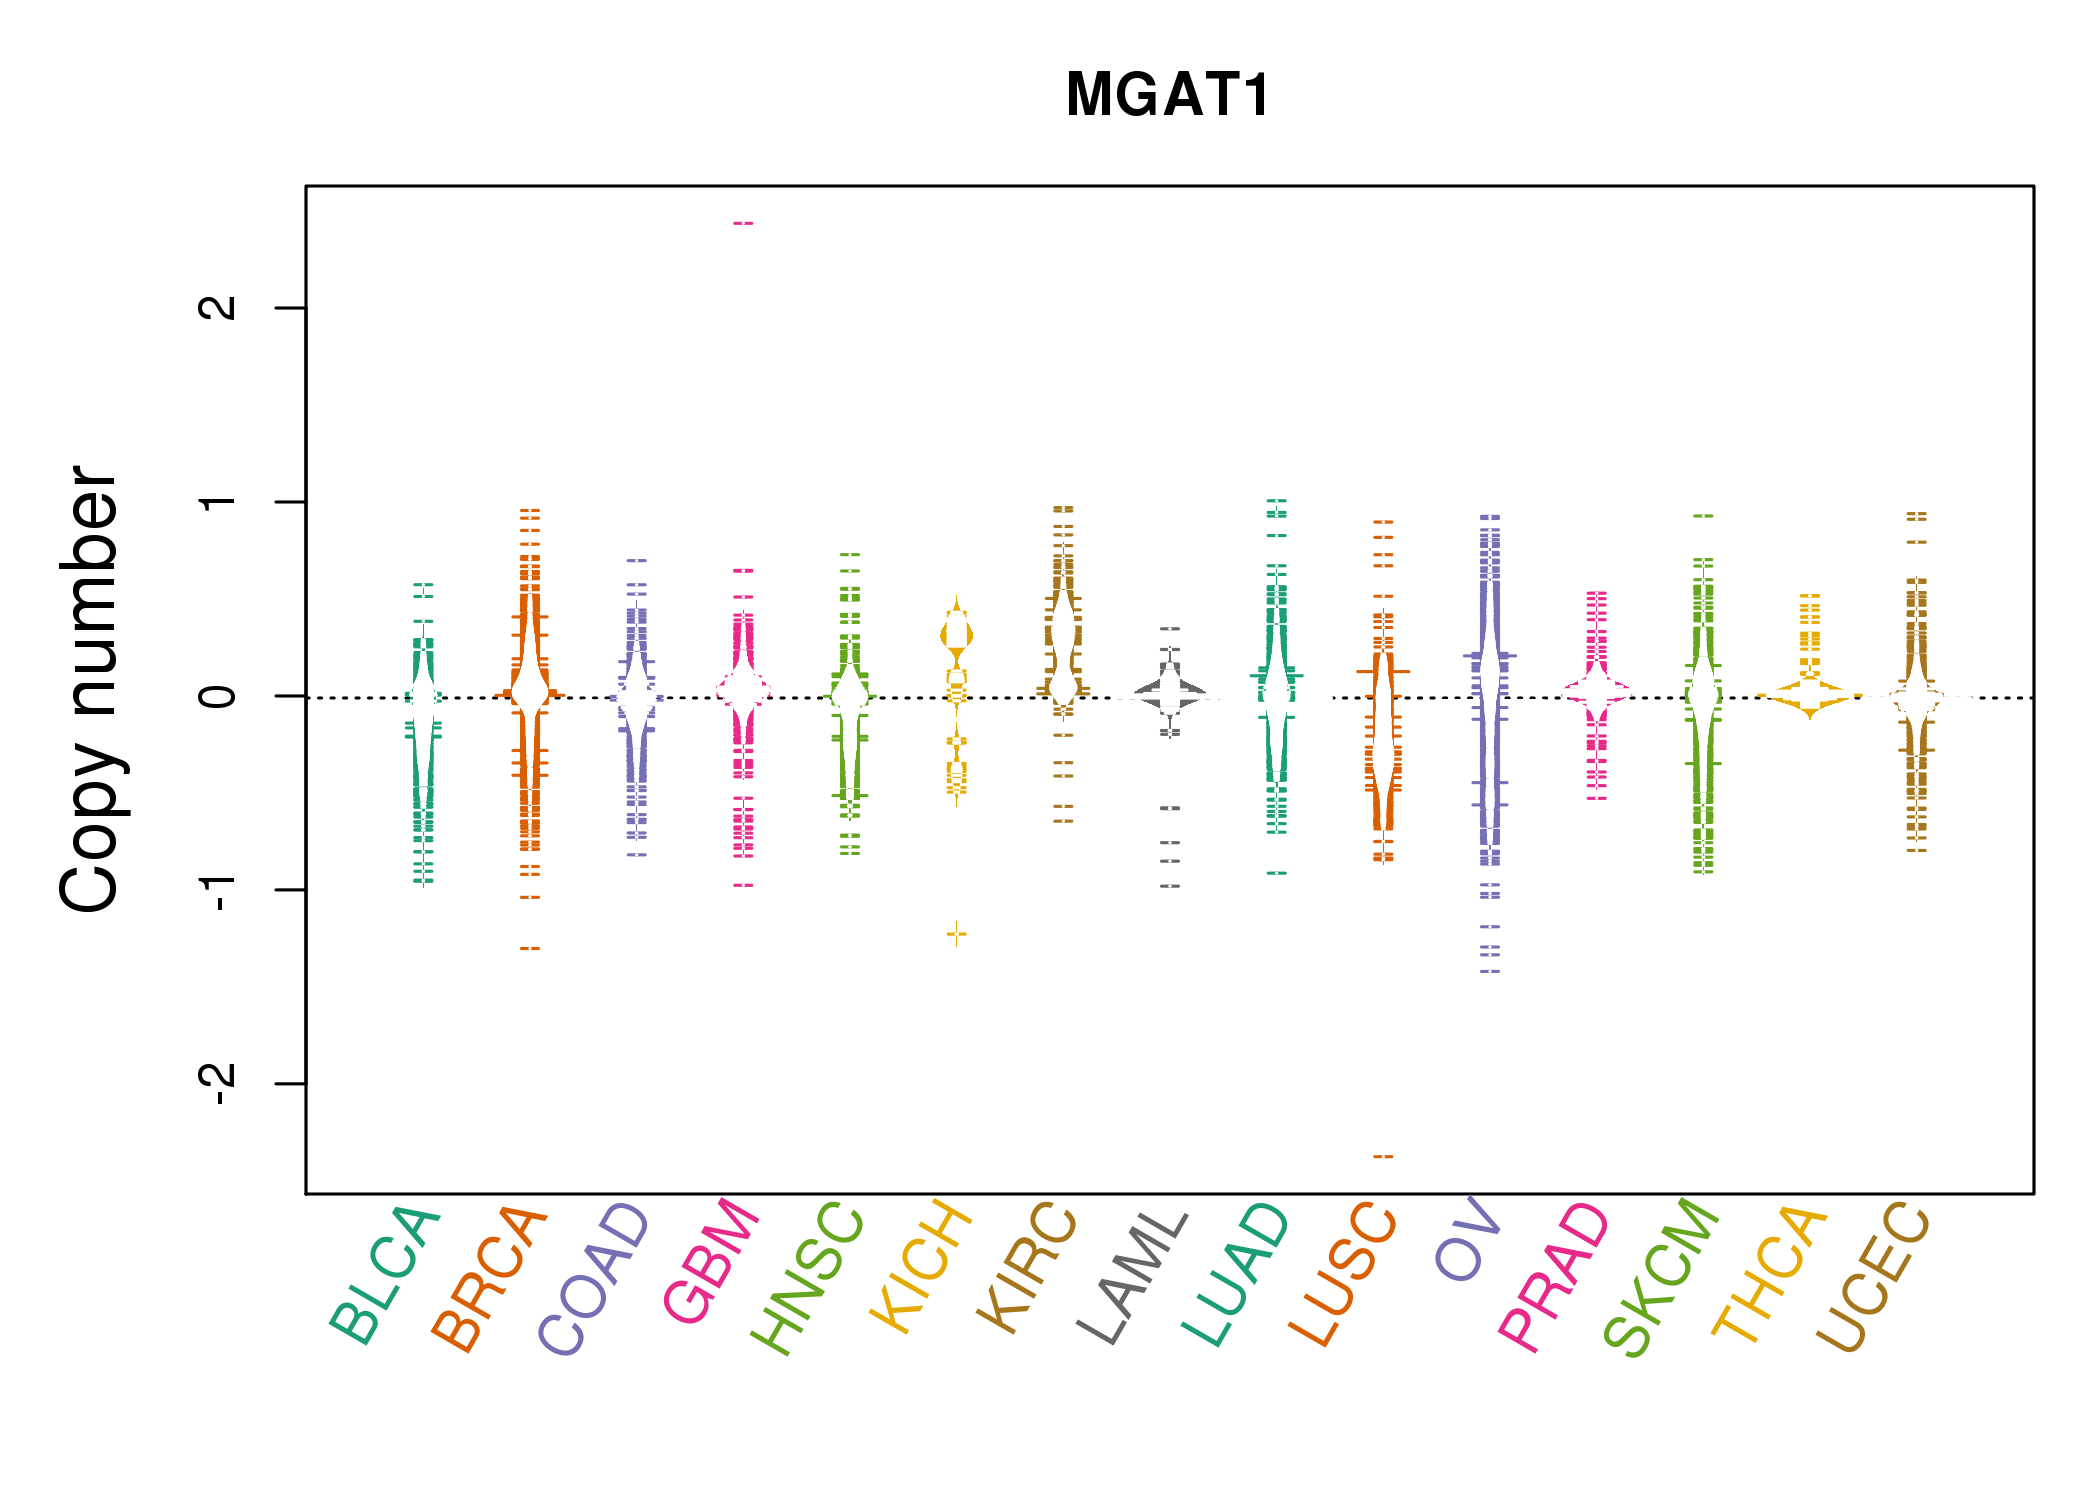 |
| cf) Tissue ID[Tissue type]: BLCA[Bladder Urothelial Carcinoma], BRCA[Breast invasive carcinoma], CESC[Cervical squamous cell carcinoma and endocervical adenocarcinoma], COAD[Colon adenocarcinoma], GBM[Glioblastoma multiforme], Glioma Low Grade, HNSC[Head and Neck squamous cell carcinoma], KICH[Kidney Chromophobe], KIRC[Kidney renal clear cell carcinoma], KIRP[Kidney renal papillary cell carcinoma], LAML[Acute Myeloid Leukemia], LUAD[Lung adenocarcinoma], LUSC[Lung squamous cell carcinoma], OV[Ovarian serous cystadenocarcinoma ], PAAD[Pancreatic adenocarcinoma], PRAD[Prostate adenocarcinoma], SKCM[Skin Cutaneous Melanoma], STAD[Stomach adenocarcinoma], THCA[Thyroid carcinoma], UCEC[Uterine Corpus Endometrial Carcinoma] |
| Top |
| Gene Expression for MGAT1 |
| * CCLE gene expression data were extracted from CCLE_Expression_Entrez_2012-10-18.res: Gene-centric RMA-normalized mRNA expression data. |
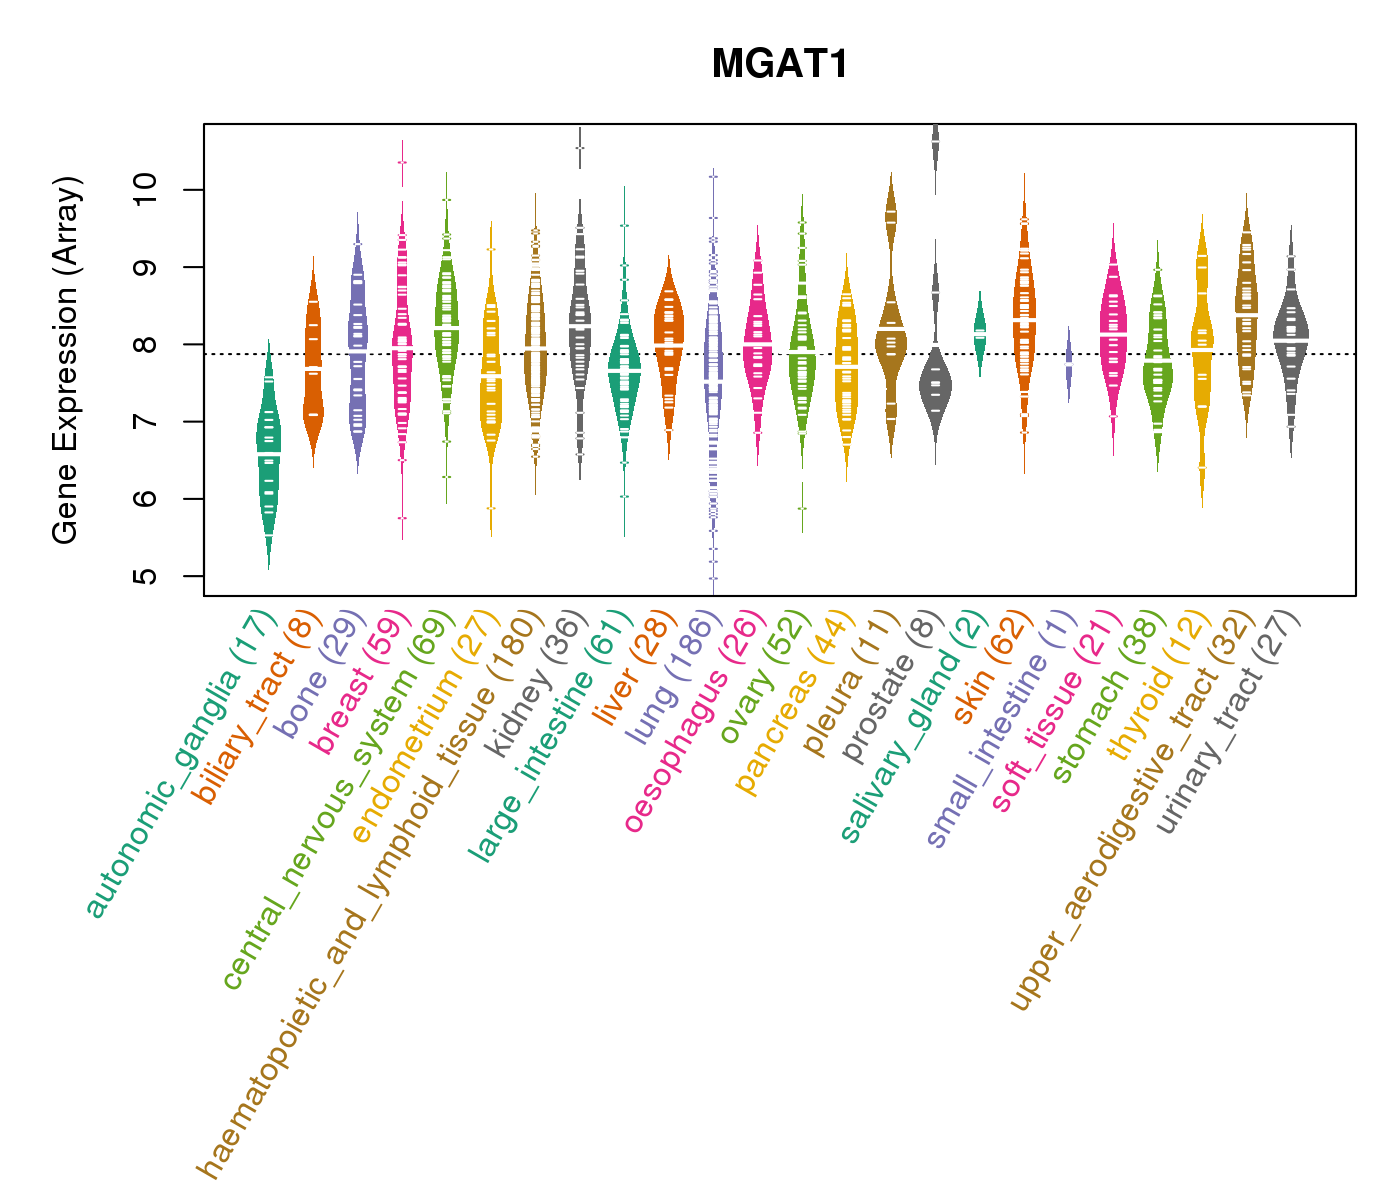 |
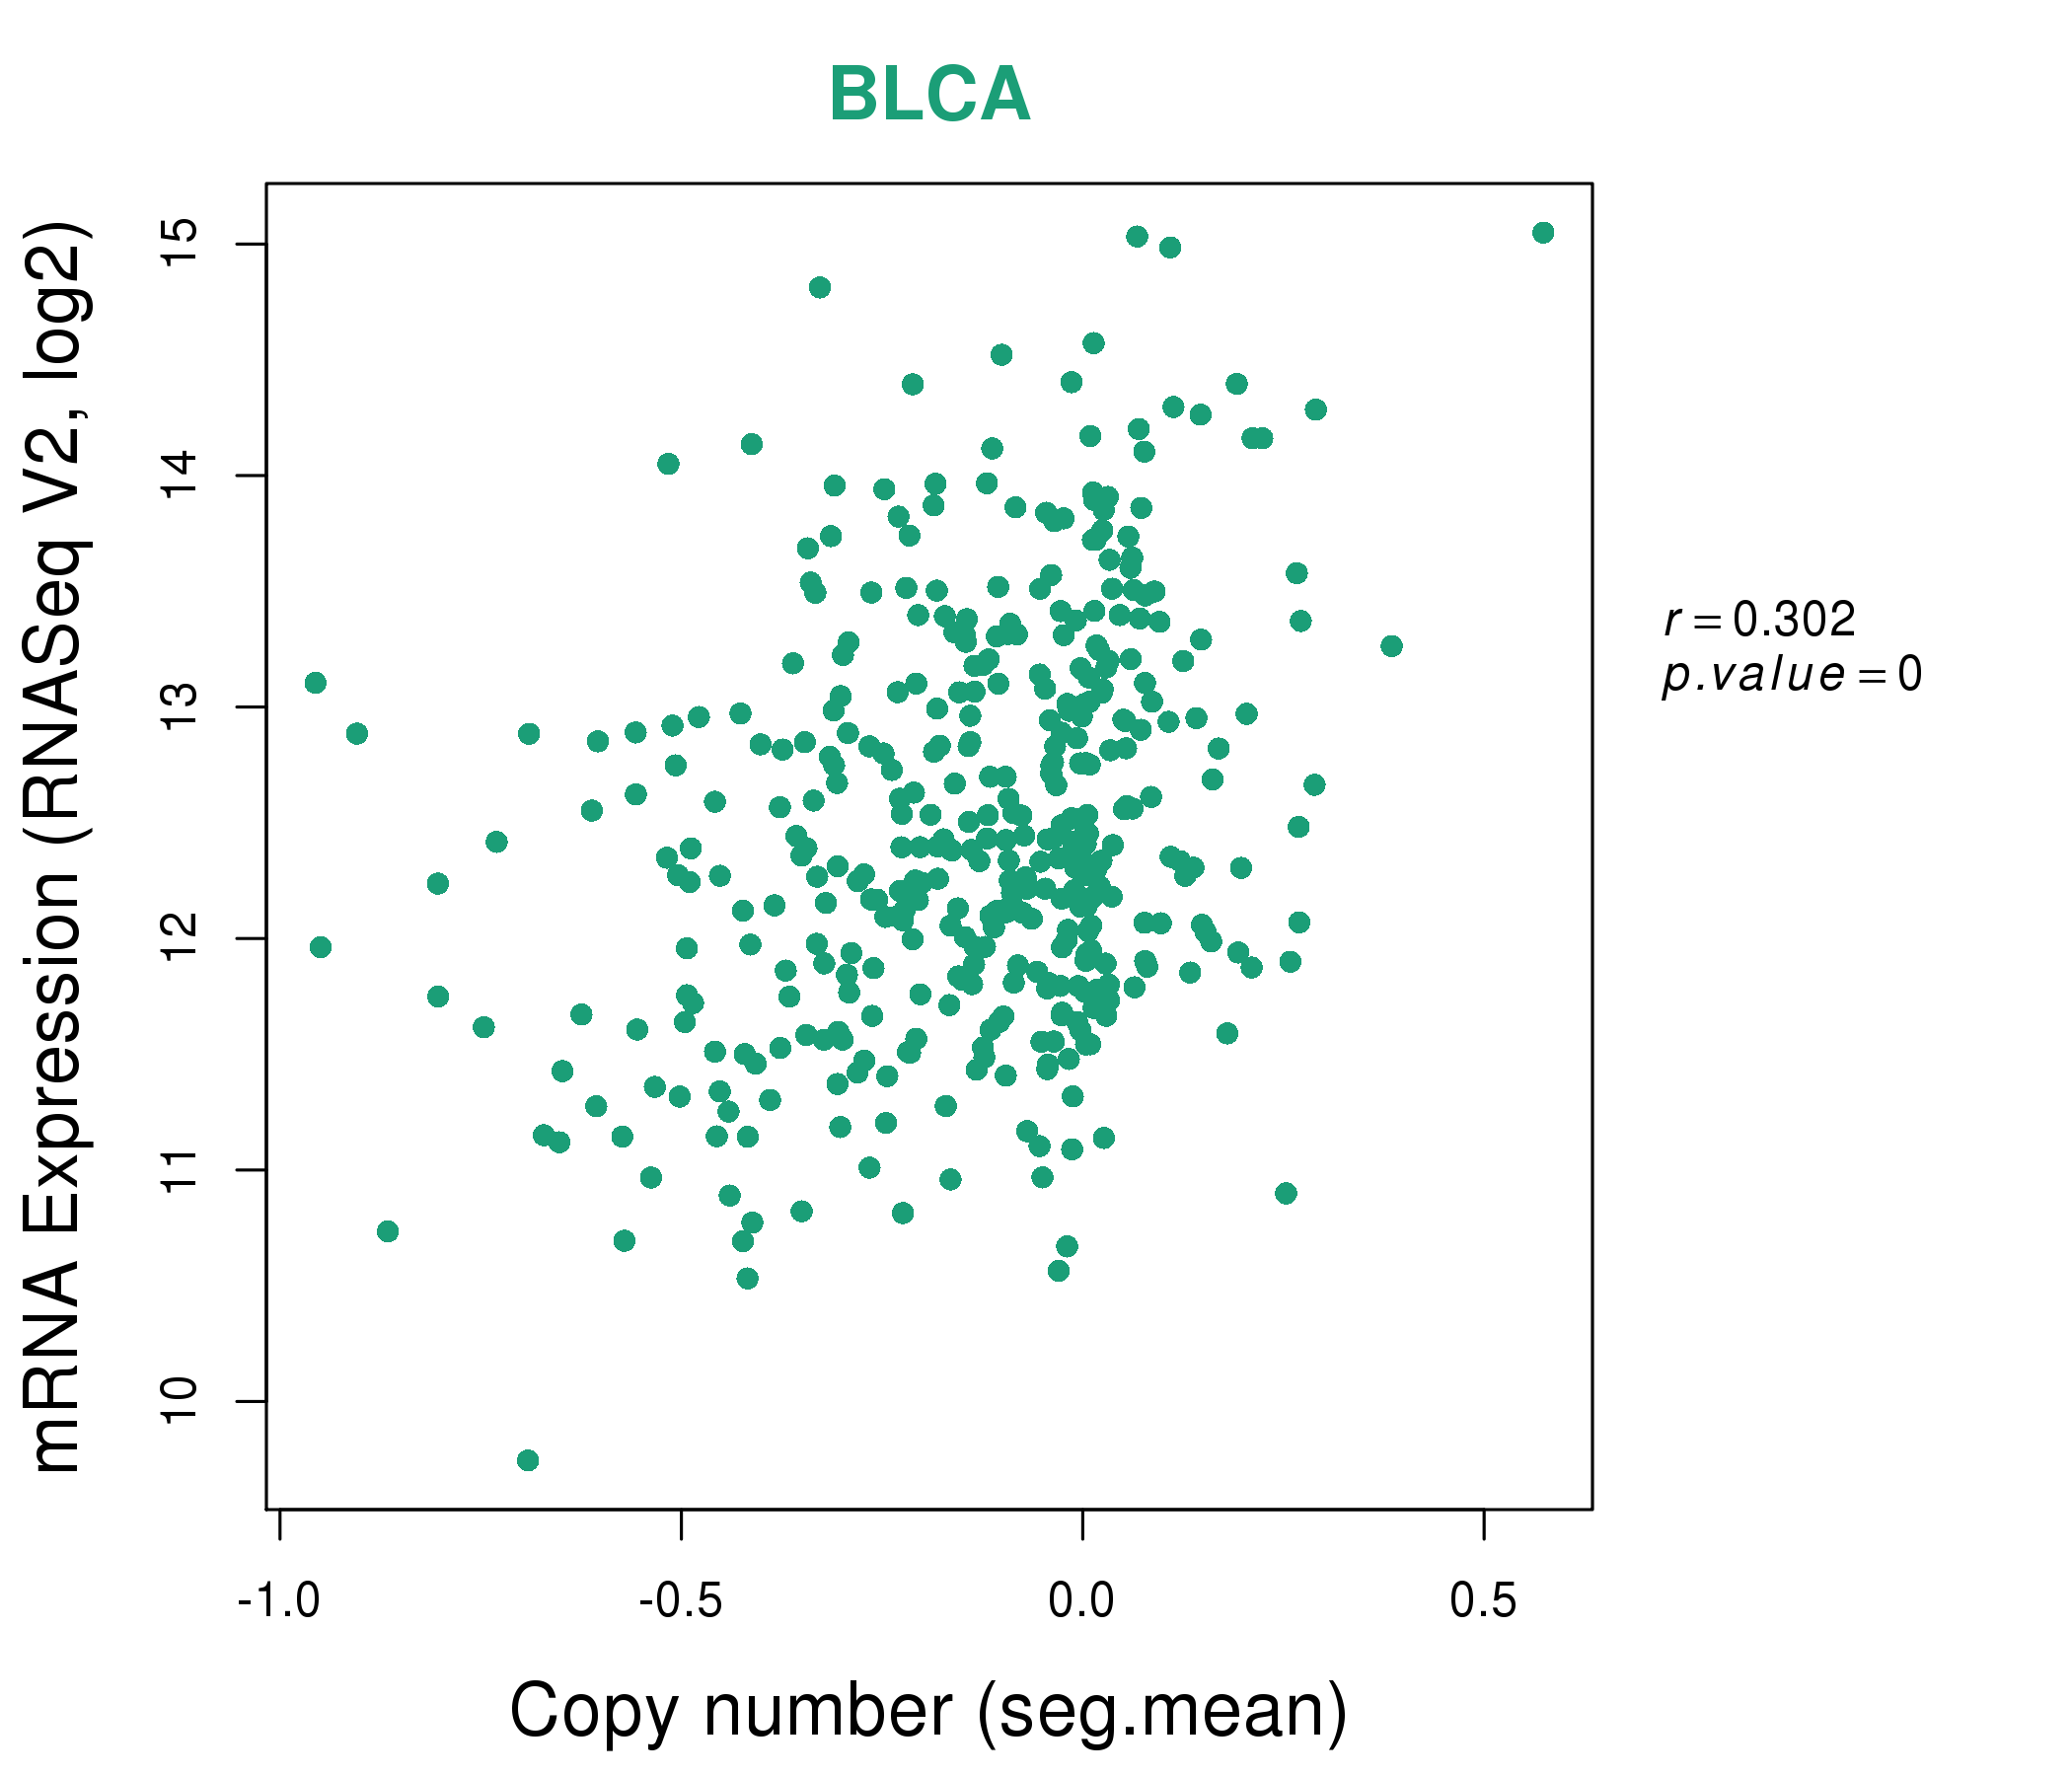
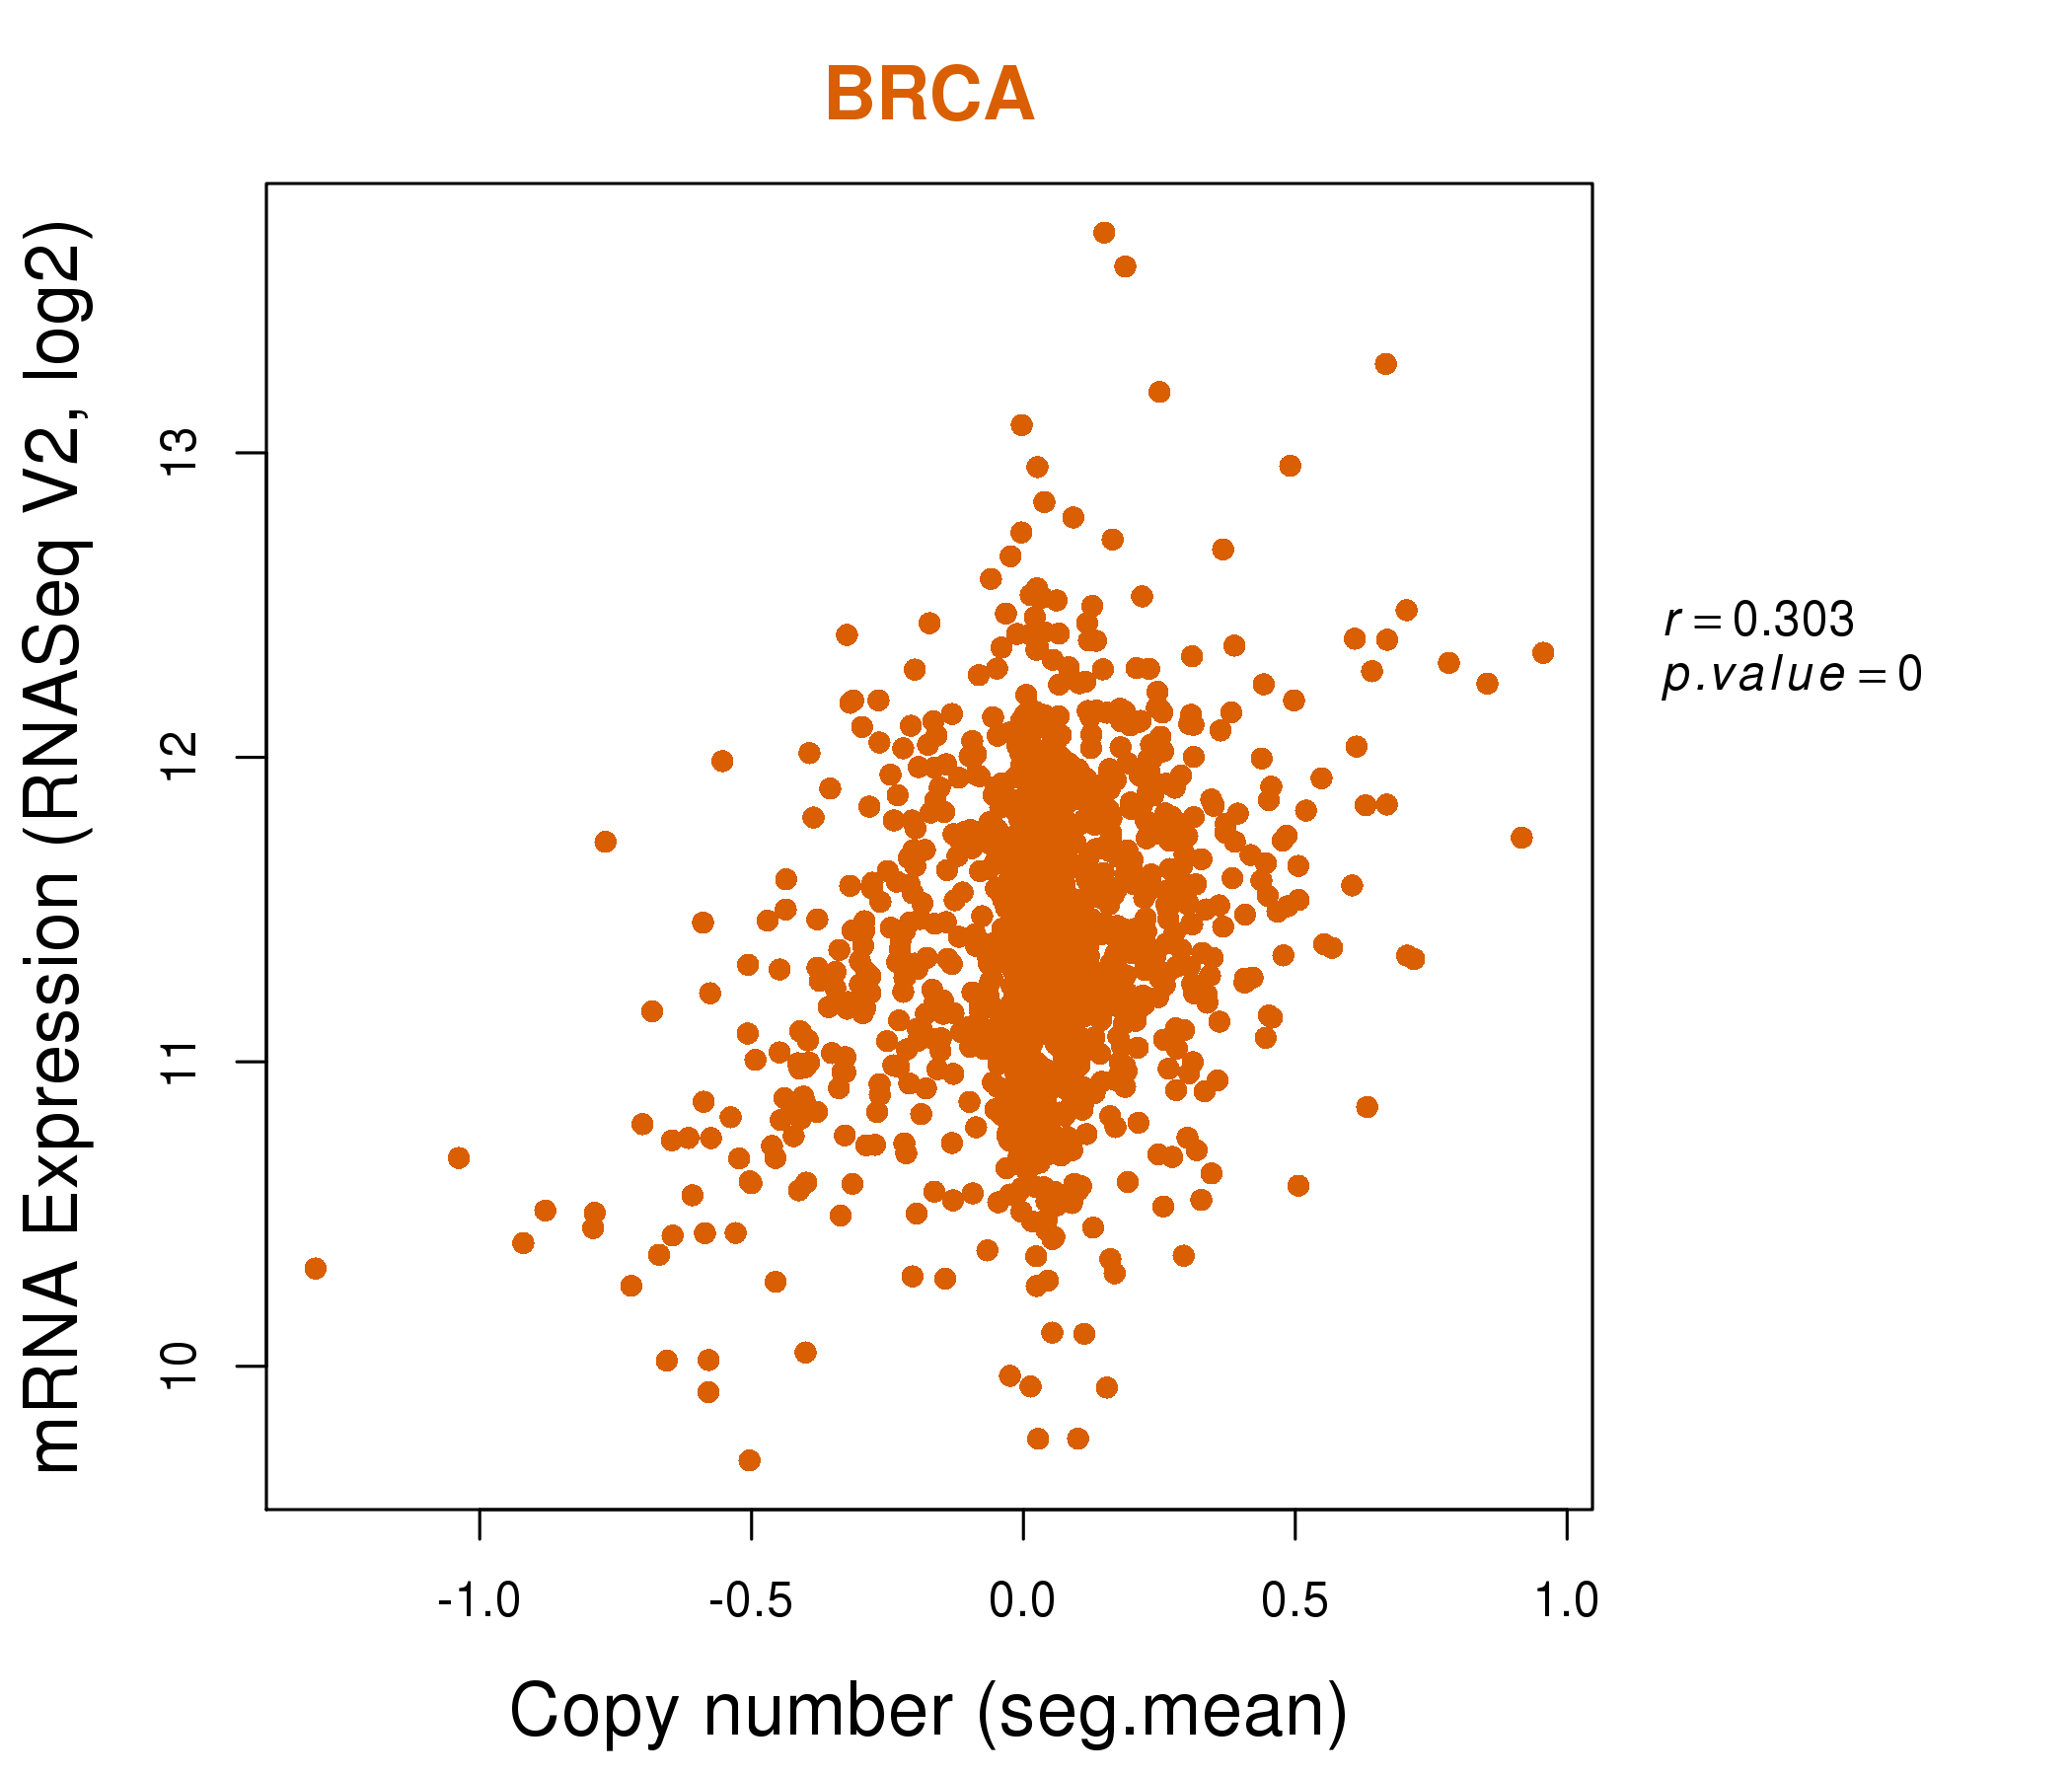
| * Normalized gene expression data of RNASeqV2 was extracted from TCGA using R package TCGA-Assembler. The URLs of all public data files on TCGA DCC data server were gathered at Jan-05-2015. Only eight cancer types have enough normal control samples for differential expression analysis. (t test, adjusted p<0.05 (using Benjamini-Hochberg FDR)) |
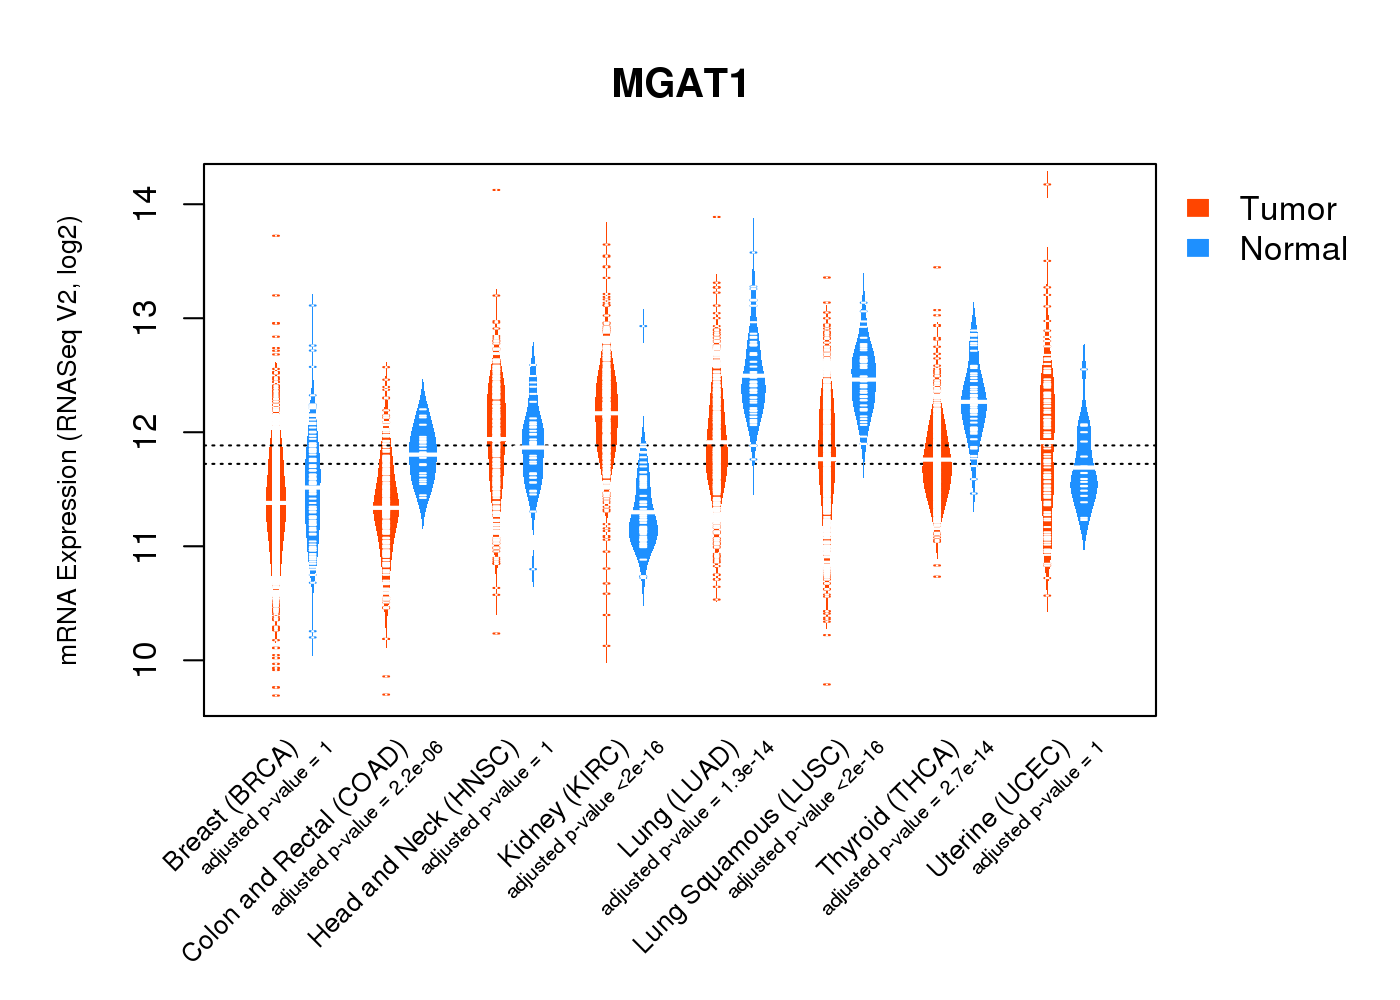 |
| Top |
| * This plots show the correlation between CNV and gene expression. |
: Open all plots for all cancer types
 |
|
 |
|

| Top |
| Gene-Gene Network Information |
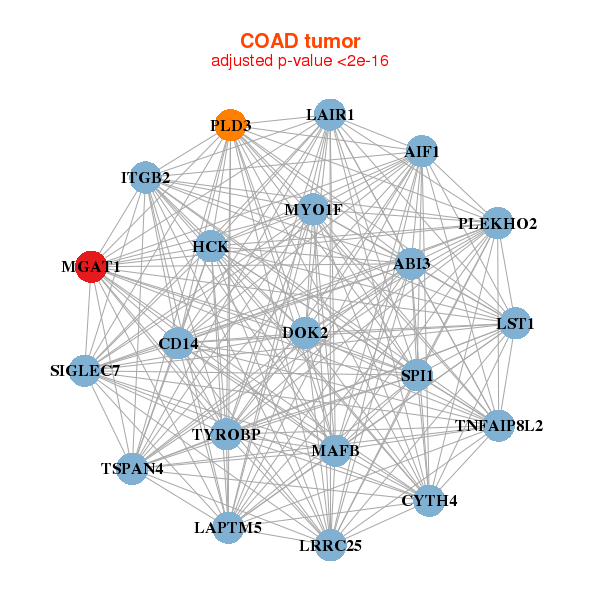
| * Co-Expression network figures were drawn using R package igraph. Only the top 20 genes with the highest correlations were shown. Red circle: input gene, orange circle: cell metabolism gene, sky circle: other gene |
: Open all plots for all cancer types
 |
|
| ABI3,AIF1,C10orf54,C1QA,CCM2,CYTH4,DOK2, EMP3,FERMT3,IFFO1,LRRC25,MAP7D1,MGAT1,MYO1F, NCF4,PLEKHO2,RHOG,SPI1,TGFB1,TYROBP,VAMP5 | ACVRL1,AP2A2,C1QA,TOR4A,CST3,DOK2,FCGRT, COLGALT1,GMFG,GNAI2,HSD3B7,NRROS,MGAT1,NCF4, PSAP,RENBP,TCN2,TNFRSF1B,TRPV2,TSPAN4,VAT1 |
 |
|
| ABI3,AIF1,CD14,CYTH4,DOK2,HCK,ITGB2, LAIR1,LAPTM5,LRRC25,LST1,MAFB,MGAT1,MYO1F, PLD3,PLEKHO2,SIGLEC7,SPI1,TNFAIP8L2,TSPAN4,TYROBP | ACP5,ARRB2,C17orf62,C1QC,CD68,CLPP,CTSB, CTSH,DNASE1L1,ABHD17A,EVA1A,FTL,HLA-DMB,HLA-DRA, IMP3,MGAT1,ORAI1,TBL2,TPST2,TTYH3,YIF1A |
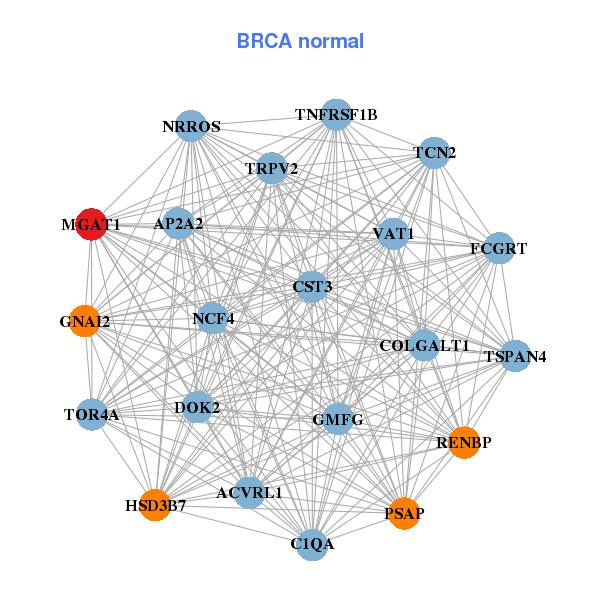
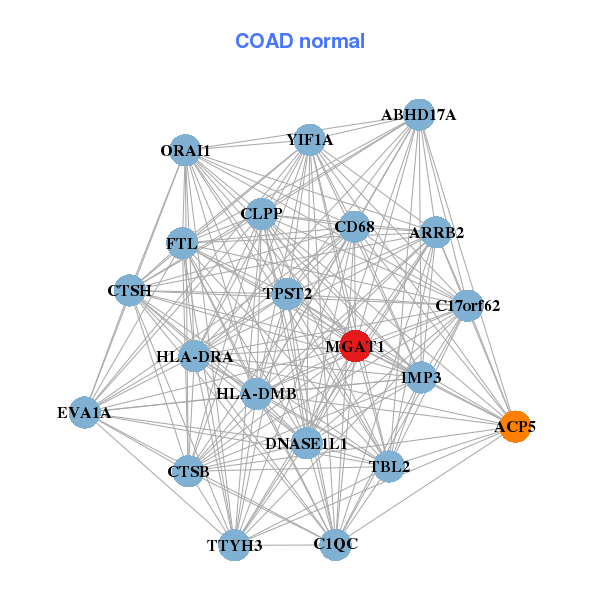
| * Co-Expression network figures were drawn using R package igraph. Only the top 20 genes with the highest correlations were shown. Red circle: input gene, orange circle: cell metabolism gene, sky circle: other gene |
: Open all plots for all cancer types
| Top |
: Open all interacting genes' information including KEGG pathway for all interacting genes from DAVID
| Top |
| Pharmacological Information for MGAT1 |
| There's no related Drug. |
| Top |
| Cross referenced IDs for MGAT1 |
| * We obtained these cross-references from Uniprot database. It covers 150 different DBs, 18 categories. http://www.uniprot.org/help/cross_references_section |
: Open all cross reference information
|
Copyright © 2016-Present - The Univsersity of Texas Health Science Center at Houston @ |