|
||||||||||||||||||||
| |
| Phenotypic Information (metabolism pathway, cancer, disease, phenome) |
| |
| |
| Gene-Gene Network Information: Co-Expression Network, Interacting Genes & KEGG |
| |
|


| Gene Summary for MGAT2 |
| Basic gene info. | Gene symbol | MGAT2 |
| Gene name | mannosyl (alpha-1,6-)-glycoprotein beta-1,2-N-acetylglucosaminyltransferase | |
| Synonyms | CDG2A|CDGS2|GLCNACTII|GNT-II|GNT2 | |
| Cytomap | UCSC genome browser: 14q21 | |
| Genomic location | chr14 :50087488-50090199 | |
| Type of gene | protein-coding | |
| RefGenes | NM_002408.3, NM_001015883.1, | |
| Ensembl id | ENSG00000168282 | |
| Description | Beta-1,2-N-acetylglucosaminyltransferase IIN-glycosyl-oligosaccharide-glycoprotein N-acetylglucosaminyltransferase IIUDP-N-acetylglucosamine:alpha-6-D-mannoside beta-1,2-N-acetylglucosaminyltransferase IIalpha-1,6-mannosyl-glycoprotein 2-beta-N-acetylg | |
| Modification date | 20141219 | |
| dbXrefs | MIM : 602616 | |
| HGNC : HGNC | ||
| Ensembl : ENSG00000168282 | ||
| HPRD : 04013 | ||
| Vega : OTTHUMG00000140271 | ||
| Protein | UniProt: go to UniProt's Cross Reference DB Table | |
| Expression | CleanEX: HS_MGAT2 | |
| BioGPS: 4247 | ||
| Gene Expression Atlas: ENSG00000168282 | ||
| The Human Protein Atlas: ENSG00000168282 | ||
| Pathway | NCI Pathway Interaction Database: MGAT2 | |
| KEGG: MGAT2 | ||
| REACTOME: MGAT2 | ||
| ConsensusPathDB | ||
| Pathway Commons: MGAT2 | ||
| Metabolism | MetaCyc: MGAT2 | |
| HUMANCyc: MGAT2 | ||
| Regulation | Ensembl's Regulation: ENSG00000168282 | |
| miRBase: chr14 :50,087,488-50,090,199 | ||
| TargetScan: NM_002408 | ||
| cisRED: ENSG00000168282 | ||
| Context | iHOP: MGAT2 | |
| cancer metabolism search in PubMed: MGAT2 | ||
| UCL Cancer Institute: MGAT2 | ||
| Assigned class in ccmGDB | C | |
| Top |
| Phenotypic Information for MGAT2(metabolism pathway, cancer, disease, phenome) |
| Cancer | CGAP: MGAT2 |
| Familial Cancer Database: MGAT2 | |
| * This gene is included in those cancer gene databases. |
|
|
|
|
|
| . | ||||||||||||||
Oncogene 1 | Significant driver gene in | |||||||||||||||||||
| cf) number; DB name 1 Oncogene; http://nar.oxfordjournals.org/content/35/suppl_1/D721.long, 2 Tumor Suppressor gene; https://bioinfo.uth.edu/TSGene/, 3 Cancer Gene Census; http://www.nature.com/nrc/journal/v4/n3/abs/nrc1299.html, 4 CancerGenes; http://nar.oxfordjournals.org/content/35/suppl_1/D721.long, 5 Network of Cancer Gene; http://ncg.kcl.ac.uk/index.php, 1Therapeutic Vulnerabilities in Cancer; http://cbio.mskcc.org/cancergenomics/statius/ |
| REACTOME_METABOLISM_OF_PROTEINS | |
| OMIM | |
| Orphanet | |
| Disease | KEGG Disease: MGAT2 |
| MedGen: MGAT2 (Human Medical Genetics with Condition) | |
| ClinVar: MGAT2 | |
| Phenotype | MGI: MGAT2 (International Mouse Phenotyping Consortium) |
| PhenomicDB: MGAT2 | |
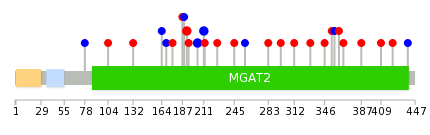
| Mutations for MGAT2 |
| * Under tables are showing count per each tissue to give us broad intuition about tissue specific mutation patterns.You can go to the detailed page for each mutation database's web site. |
| There's no structural variation information in COSMIC data for this gene. |
| * From mRNA Sanger sequences, Chitars2.0 arranged chimeric transcripts. This table shows MGAT2 related fusion information. |
| ID | Head Gene | Tail Gene | Accession | Gene_a | qStart_a | qEnd_a | Chromosome_a | tStart_a | tEnd_a | Gene_a | qStart_a | qEnd_a | Chromosome_a | tStart_a | tEnd_a |
| Top |
| There's no copy number variation information in COSMIC data for this gene. |
| Top |
|
 |
| Top |
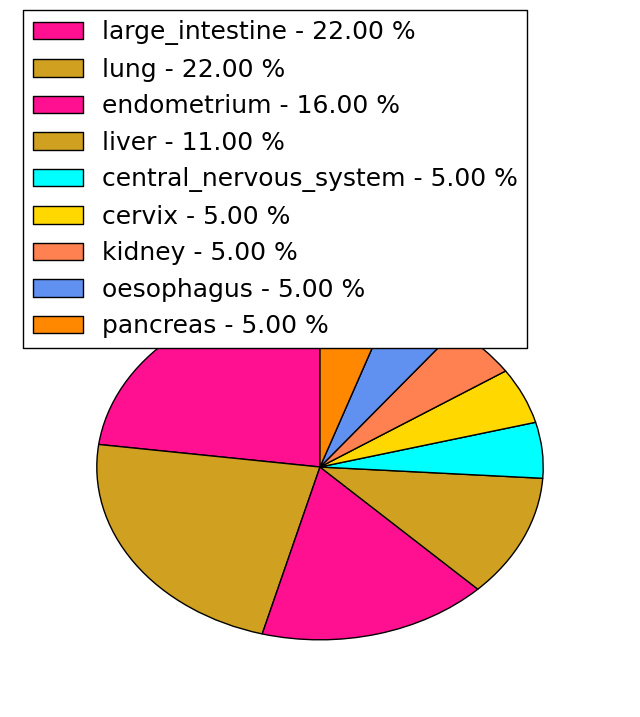
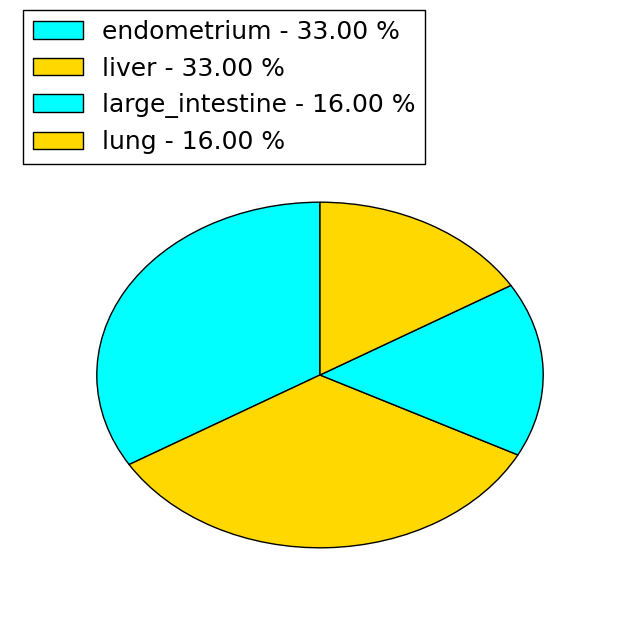
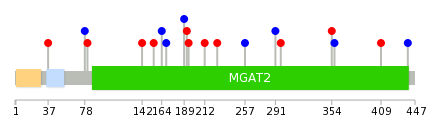
| Stat. for Non-Synonymous SNVs (# total SNVs=18) | (# total SNVs=6) |
 |  |
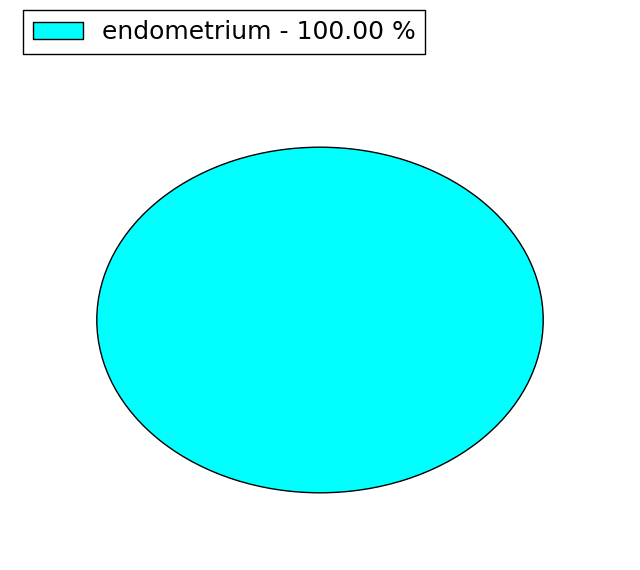
(# total SNVs=1) | (# total SNVs=1) |
 |  |
| Top |
| * When you move the cursor on each content, you can see more deailed mutation information on the Tooltip. Those are primary_site,primary_histology,mutation(aa),pubmedID. |
| GRCh37 position | Mutation(aa) | Unique sampleID count |
| chr14:50088560-50088560 | p.D192N | 2 |
| chr14:50088598-50088598 | p.A204A | 2 |
| chr14:50088619-50088619 | p.I211I | 2 |
| chr14:50089070-50089070 | p.W362R | 1 |
| chr14:50088834-50088834 | p.C283S | 1 |
| chr14:50089072-50089072 | p.W362* | 1 |
| chr14:50088567-50088567 | p.R194T | 1 |
| chr14:50088877-50088877 | p.S297R | 1 |
| chr14:50089085-50089085 | p.P367S | 1 |
| chr14:50088220-50088220 | p.A78A | 1 |
| Top |
|
 |
| Point Mutation/ Tissue ID | 1 | 2 | 3 | 4 | 5 | 6 | 7 | 8 | 9 | 10 | 11 | 12 | 13 | 14 | 15 | 16 | 17 | 18 | 19 | 20 |
| # sample | 1 | 1 | 1 | 1 | 3 | 3 | 3 | 1 | 3 | |||||||||||
| # mutation | 1 | 1 | 1 | 1 | 3 | 3 | 3 | 1 | 4 | |||||||||||
| nonsynonymous SNV | 1 | 1 | 2 | 1 | 2 | 1 | 2 | |||||||||||||
| synonymous SNV | 1 | 1 | 1 | 2 | 1 | 2 |
| cf) Tissue ID; Tissue type (1; BLCA[Bladder Urothelial Carcinoma], 2; BRCA[Breast invasive carcinoma], 3; CESC[Cervical squamous cell carcinoma and endocervical adenocarcinoma], 4; COAD[Colon adenocarcinoma], 5; GBM[Glioblastoma multiforme], 6; Glioma Low Grade, 7; HNSC[Head and Neck squamous cell carcinoma], 8; KICH[Kidney Chromophobe], 9; KIRC[Kidney renal clear cell carcinoma], 10; KIRP[Kidney renal papillary cell carcinoma], 11; LAML[Acute Myeloid Leukemia], 12; LUAD[Lung adenocarcinoma], 13; LUSC[Lung squamous cell carcinoma], 14; OV[Ovarian serous cystadenocarcinoma ], 15; PAAD[Pancreatic adenocarcinoma], 16; PRAD[Prostate adenocarcinoma], 17; SKCM[Skin Cutaneous Melanoma], 18:STAD[Stomach adenocarcinoma], 19:THCA[Thyroid carcinoma], 20:UCEC[Uterine Corpus Endometrial Carcinoma]) |
| Top |
| * We represented just top 10 SNVs. When you move the cursor on each content, you can see more deailed mutation information on the Tooltip. Those are primary_site, primary_histology, mutation(aa), pubmedID. |
| Genomic Position | Mutation(aa) | Unique sampleID count |
| chr14:50088567 | p.D192N | 1 |
| chr14:50088621 | p.R194T | 1 |
| chr14:50088095 | p.N212S | 1 |
| chr14:50088664 | p.K226N | 1 |
| chr14:50088220 | p.F257F | 1 |
| chr14:50088757 | p.L291L | 1 |
| chr14:50088228 | p.S297R | 1 |
| chr14:50088859 | p.T354I | 1 |
| chr14:50088410 | p.L37I | 1 |
| chr14:50088877 | p.C357C | 1 |
| * Copy number data were extracted from TCGA using R package TCGA-Assembler. The URLs of all public data files on TCGA DCC data server were gathered on Jan-05-2015. Function ProcessCNAData in TCGA-Assembler package was used to obtain gene-level copy number value which is calculated as the average copy number of the genomic region of a gene. |
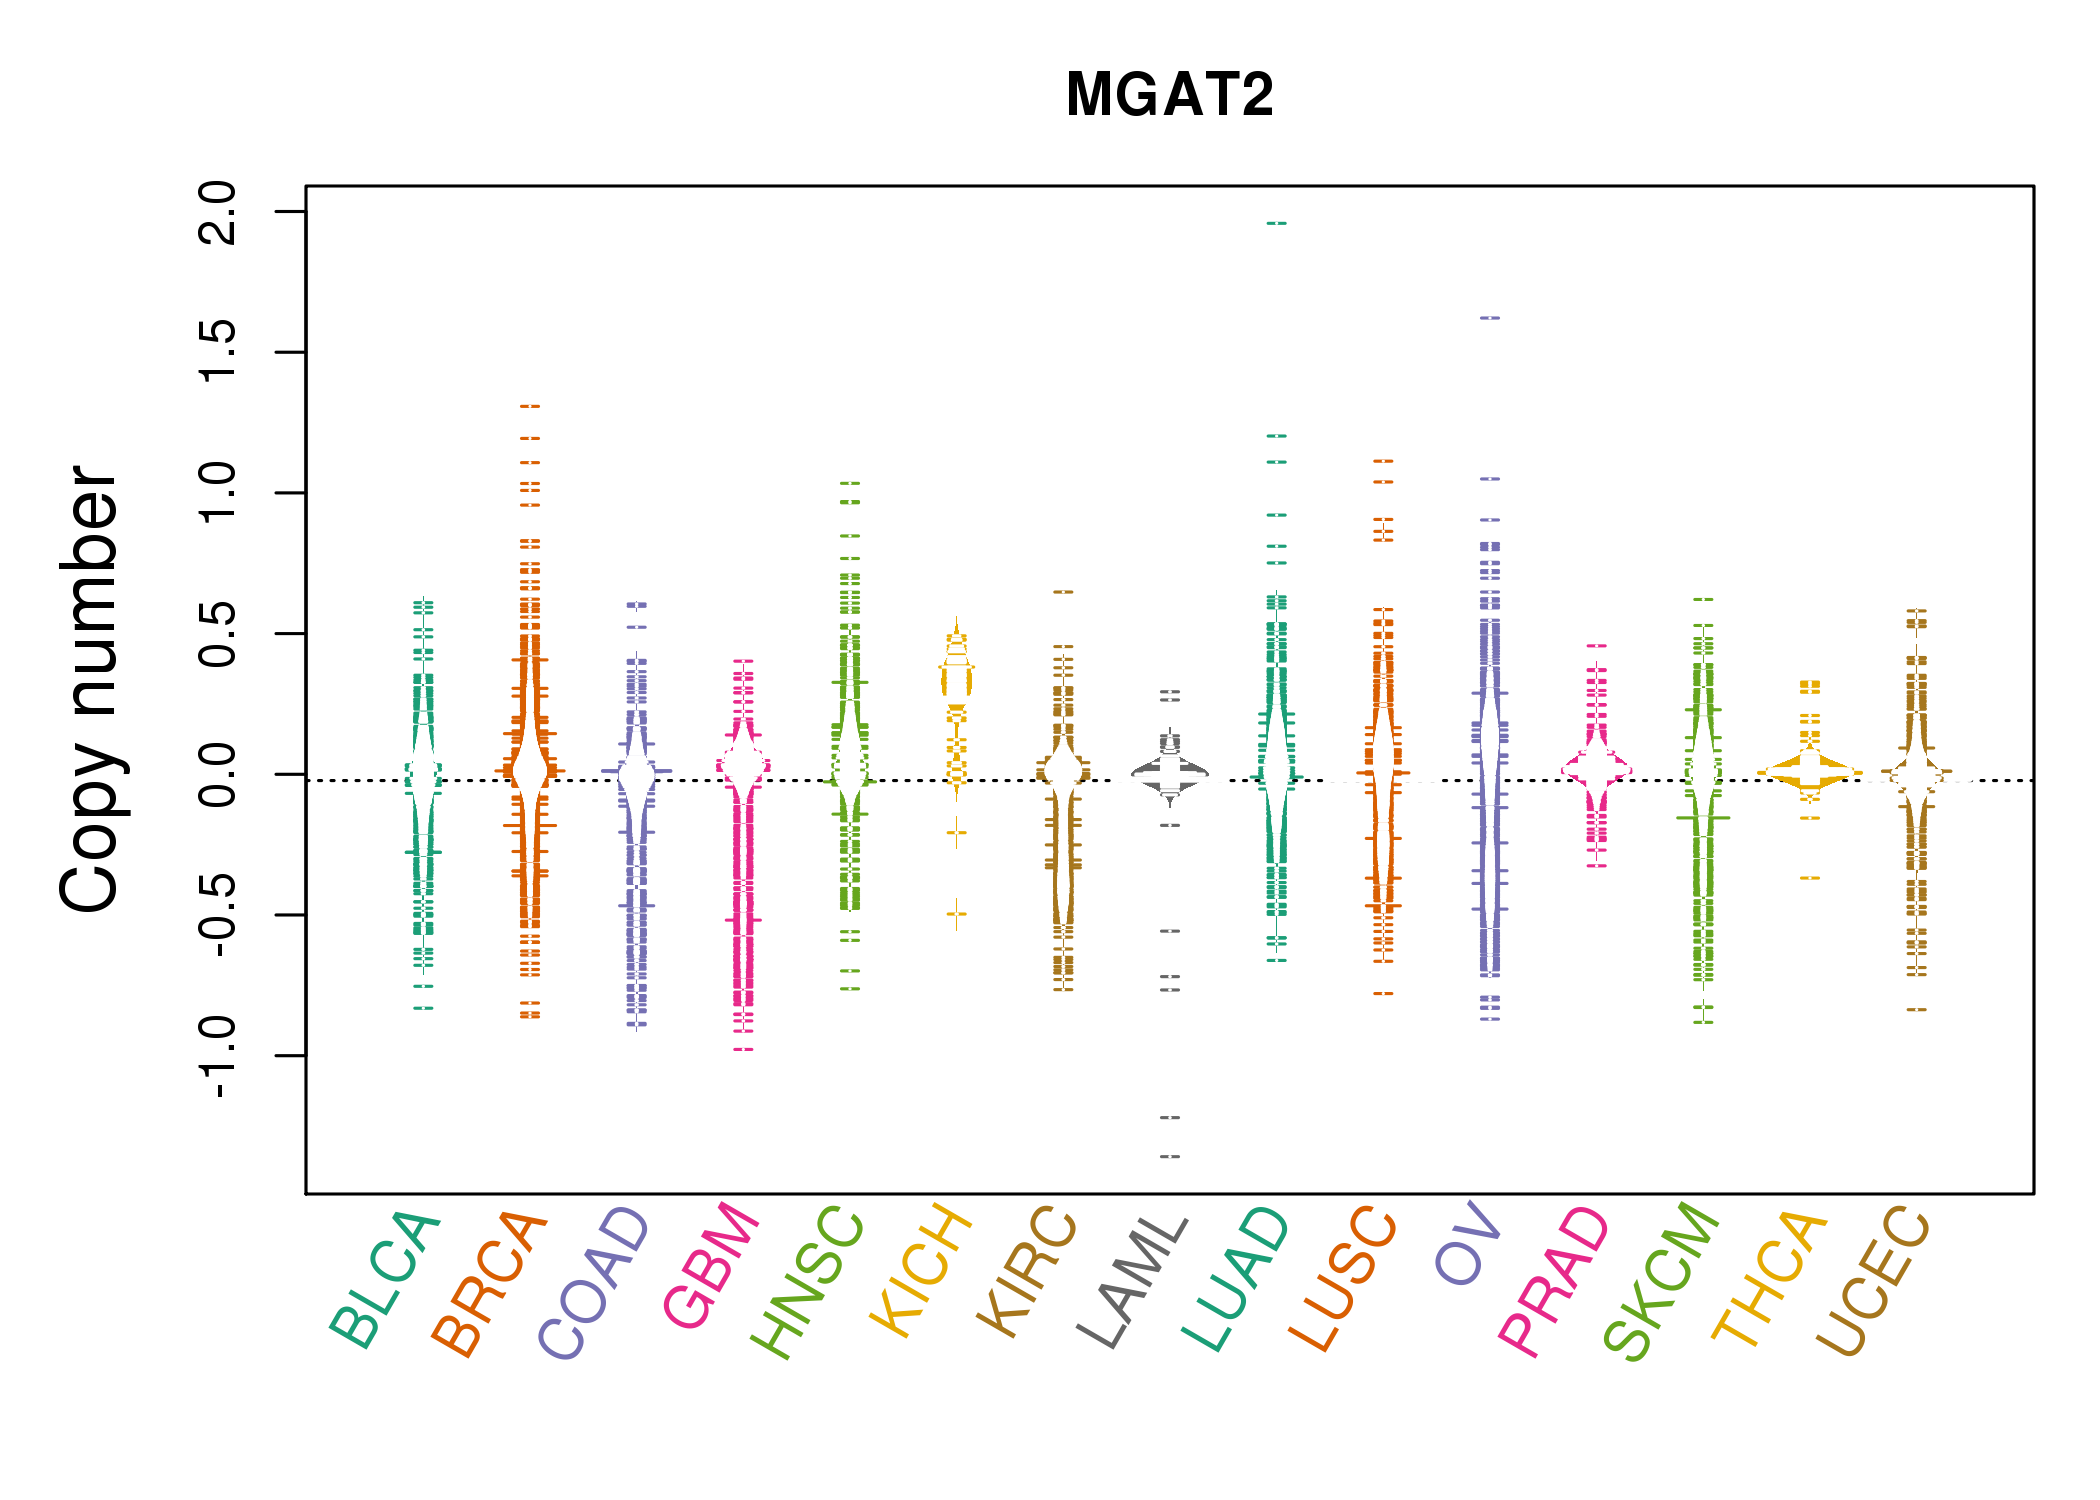 |
| cf) Tissue ID[Tissue type]: BLCA[Bladder Urothelial Carcinoma], BRCA[Breast invasive carcinoma], CESC[Cervical squamous cell carcinoma and endocervical adenocarcinoma], COAD[Colon adenocarcinoma], GBM[Glioblastoma multiforme], Glioma Low Grade, HNSC[Head and Neck squamous cell carcinoma], KICH[Kidney Chromophobe], KIRC[Kidney renal clear cell carcinoma], KIRP[Kidney renal papillary cell carcinoma], LAML[Acute Myeloid Leukemia], LUAD[Lung adenocarcinoma], LUSC[Lung squamous cell carcinoma], OV[Ovarian serous cystadenocarcinoma ], PAAD[Pancreatic adenocarcinoma], PRAD[Prostate adenocarcinoma], SKCM[Skin Cutaneous Melanoma], STAD[Stomach adenocarcinoma], THCA[Thyroid carcinoma], UCEC[Uterine Corpus Endometrial Carcinoma] |
| Top |
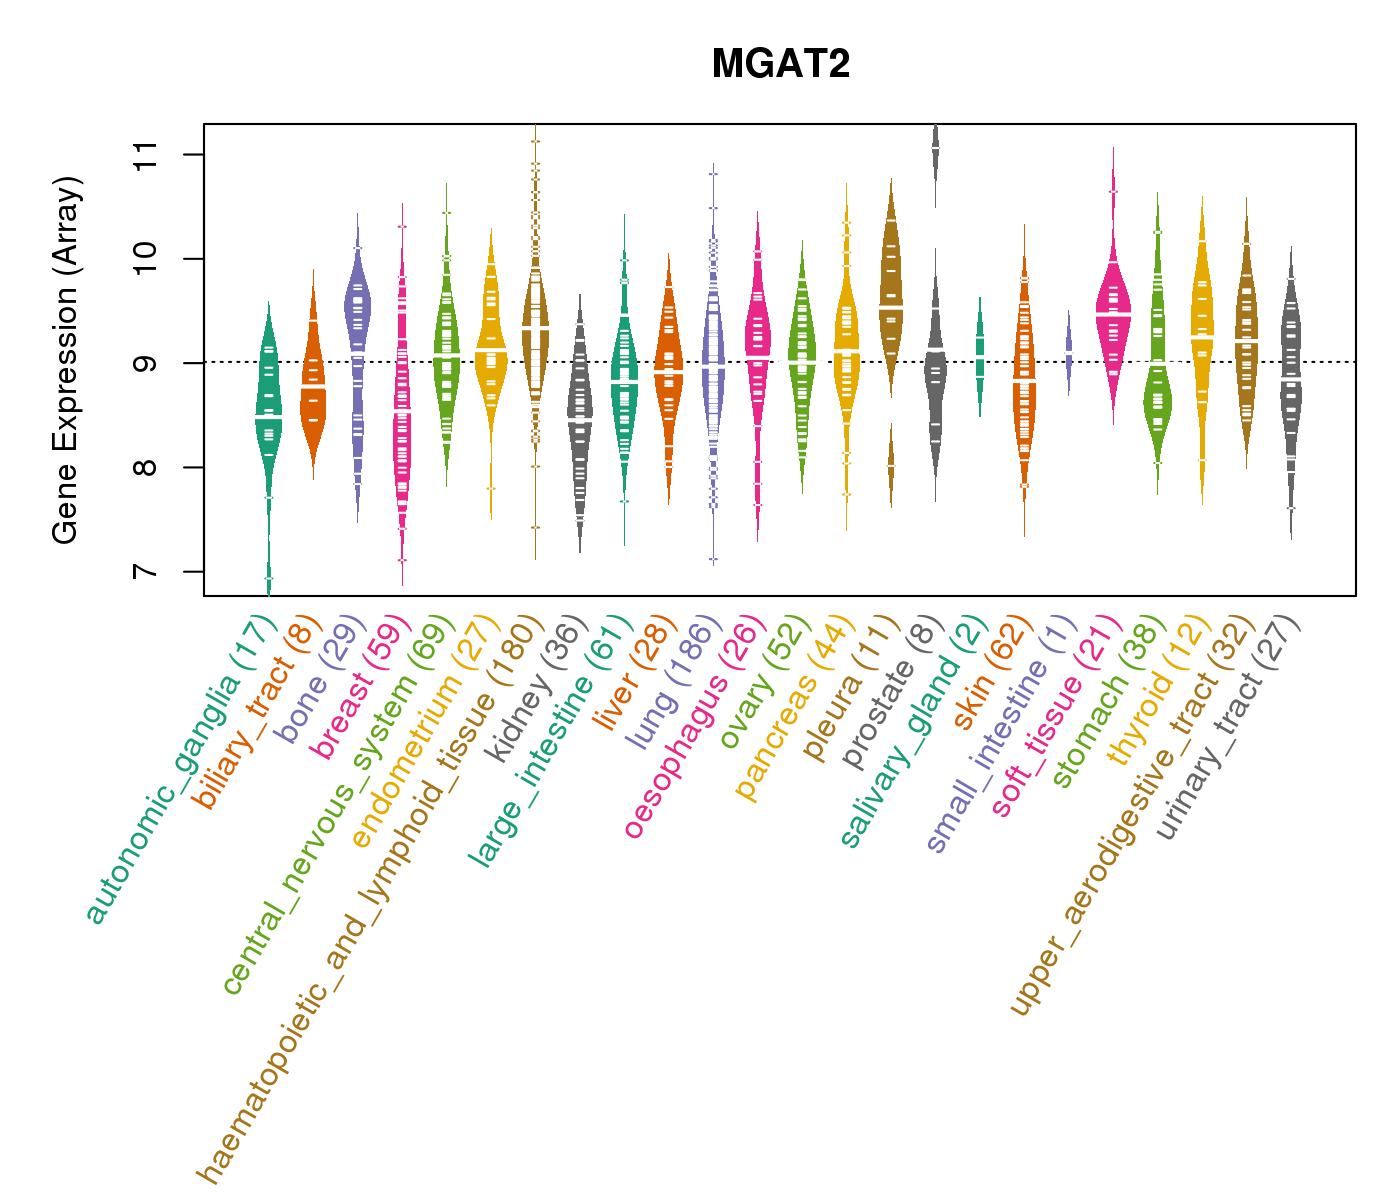
| Gene Expression for MGAT2 |
| * CCLE gene expression data were extracted from CCLE_Expression_Entrez_2012-10-18.res: Gene-centric RMA-normalized mRNA expression data. |
 |
| * Normalized gene expression data of RNASeqV2 was extracted from TCGA using R package TCGA-Assembler. The URLs of all public data files on TCGA DCC data server were gathered at Jan-05-2015. Only eight cancer types have enough normal control samples for differential expression analysis. (t test, adjusted p<0.05 (using Benjamini-Hochberg FDR)) |
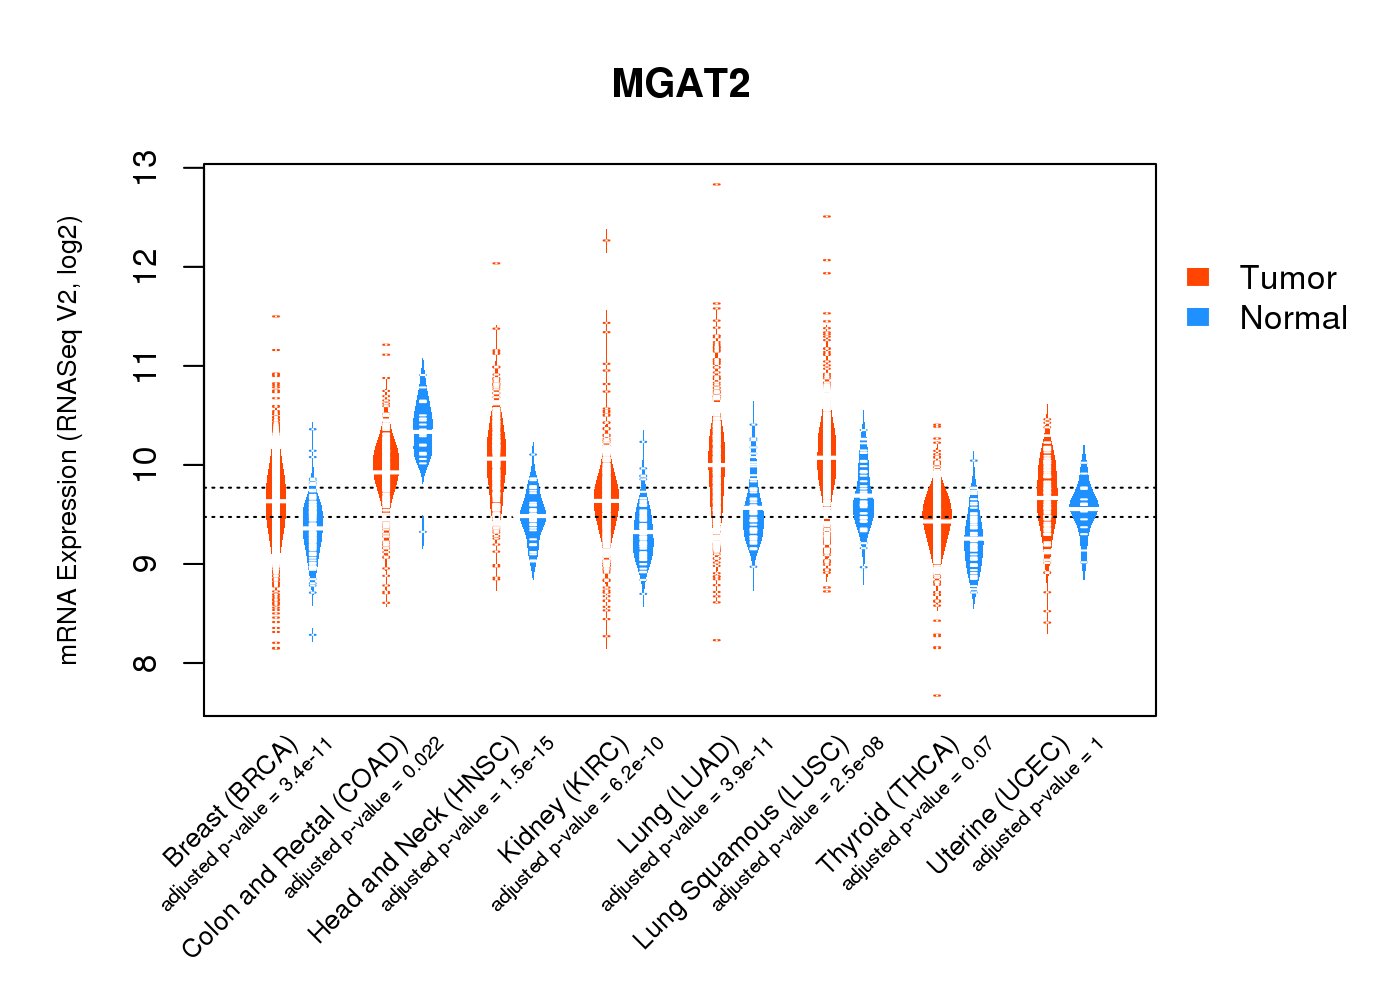 |
| Top |
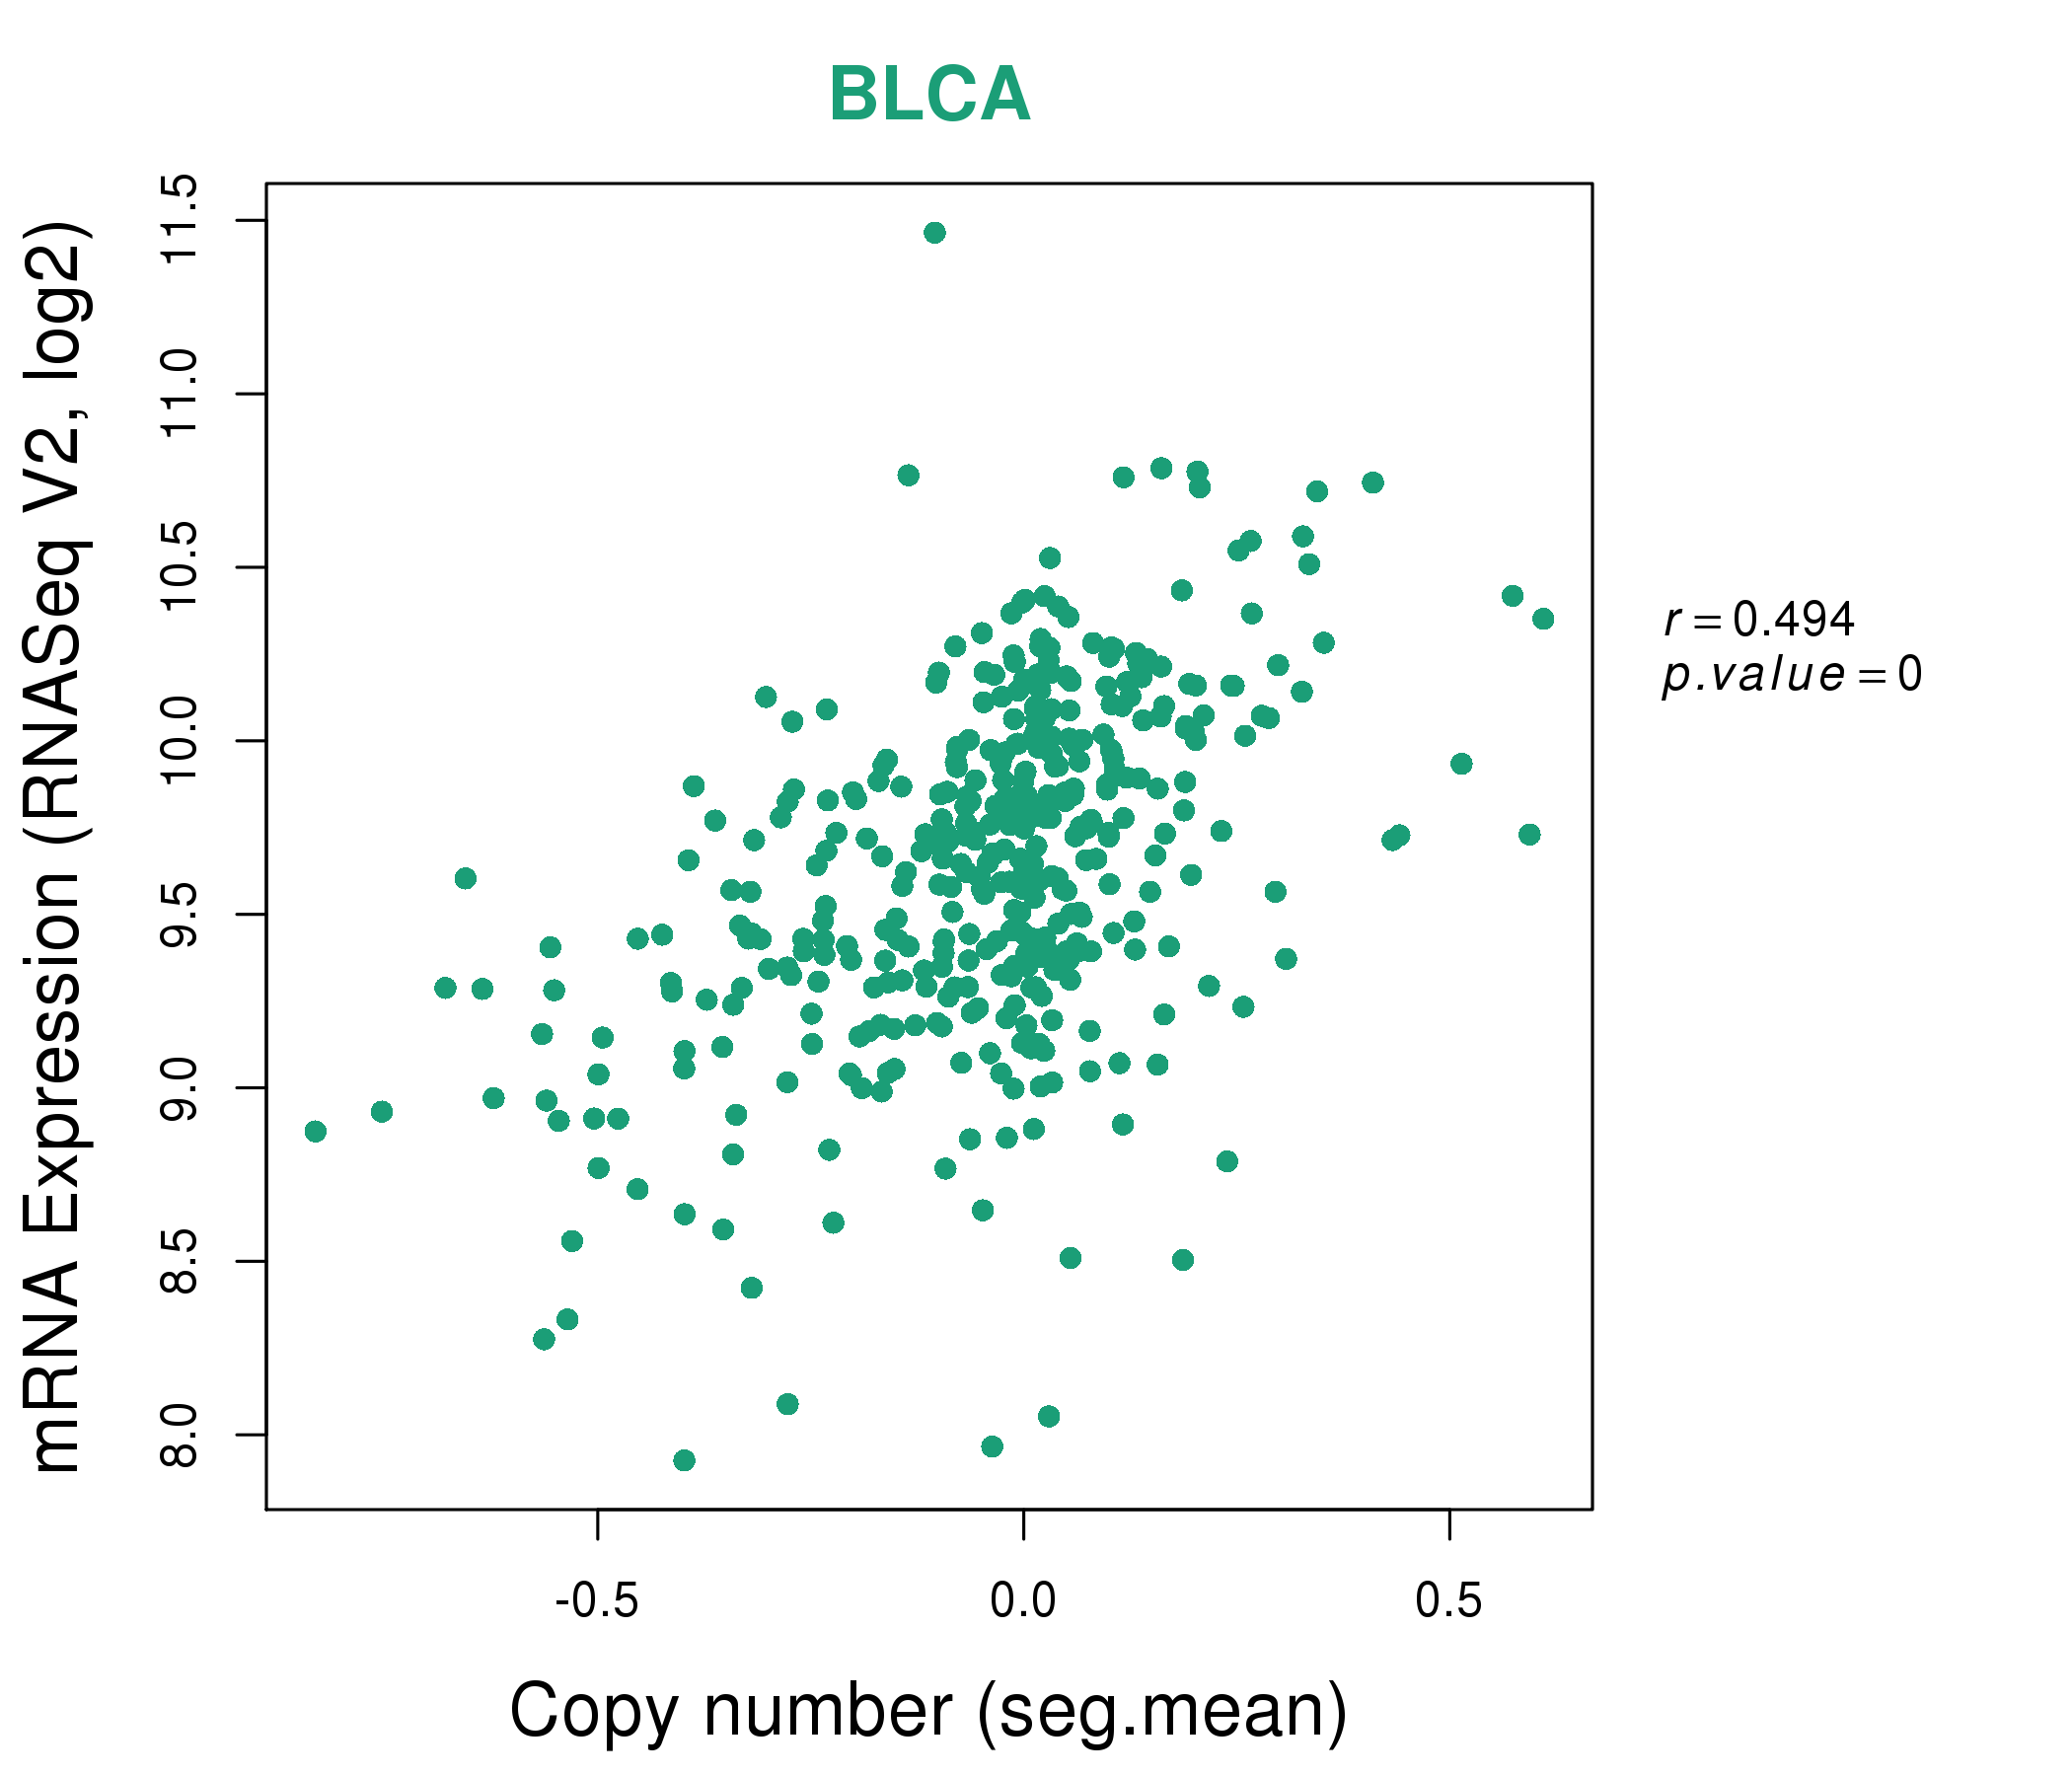
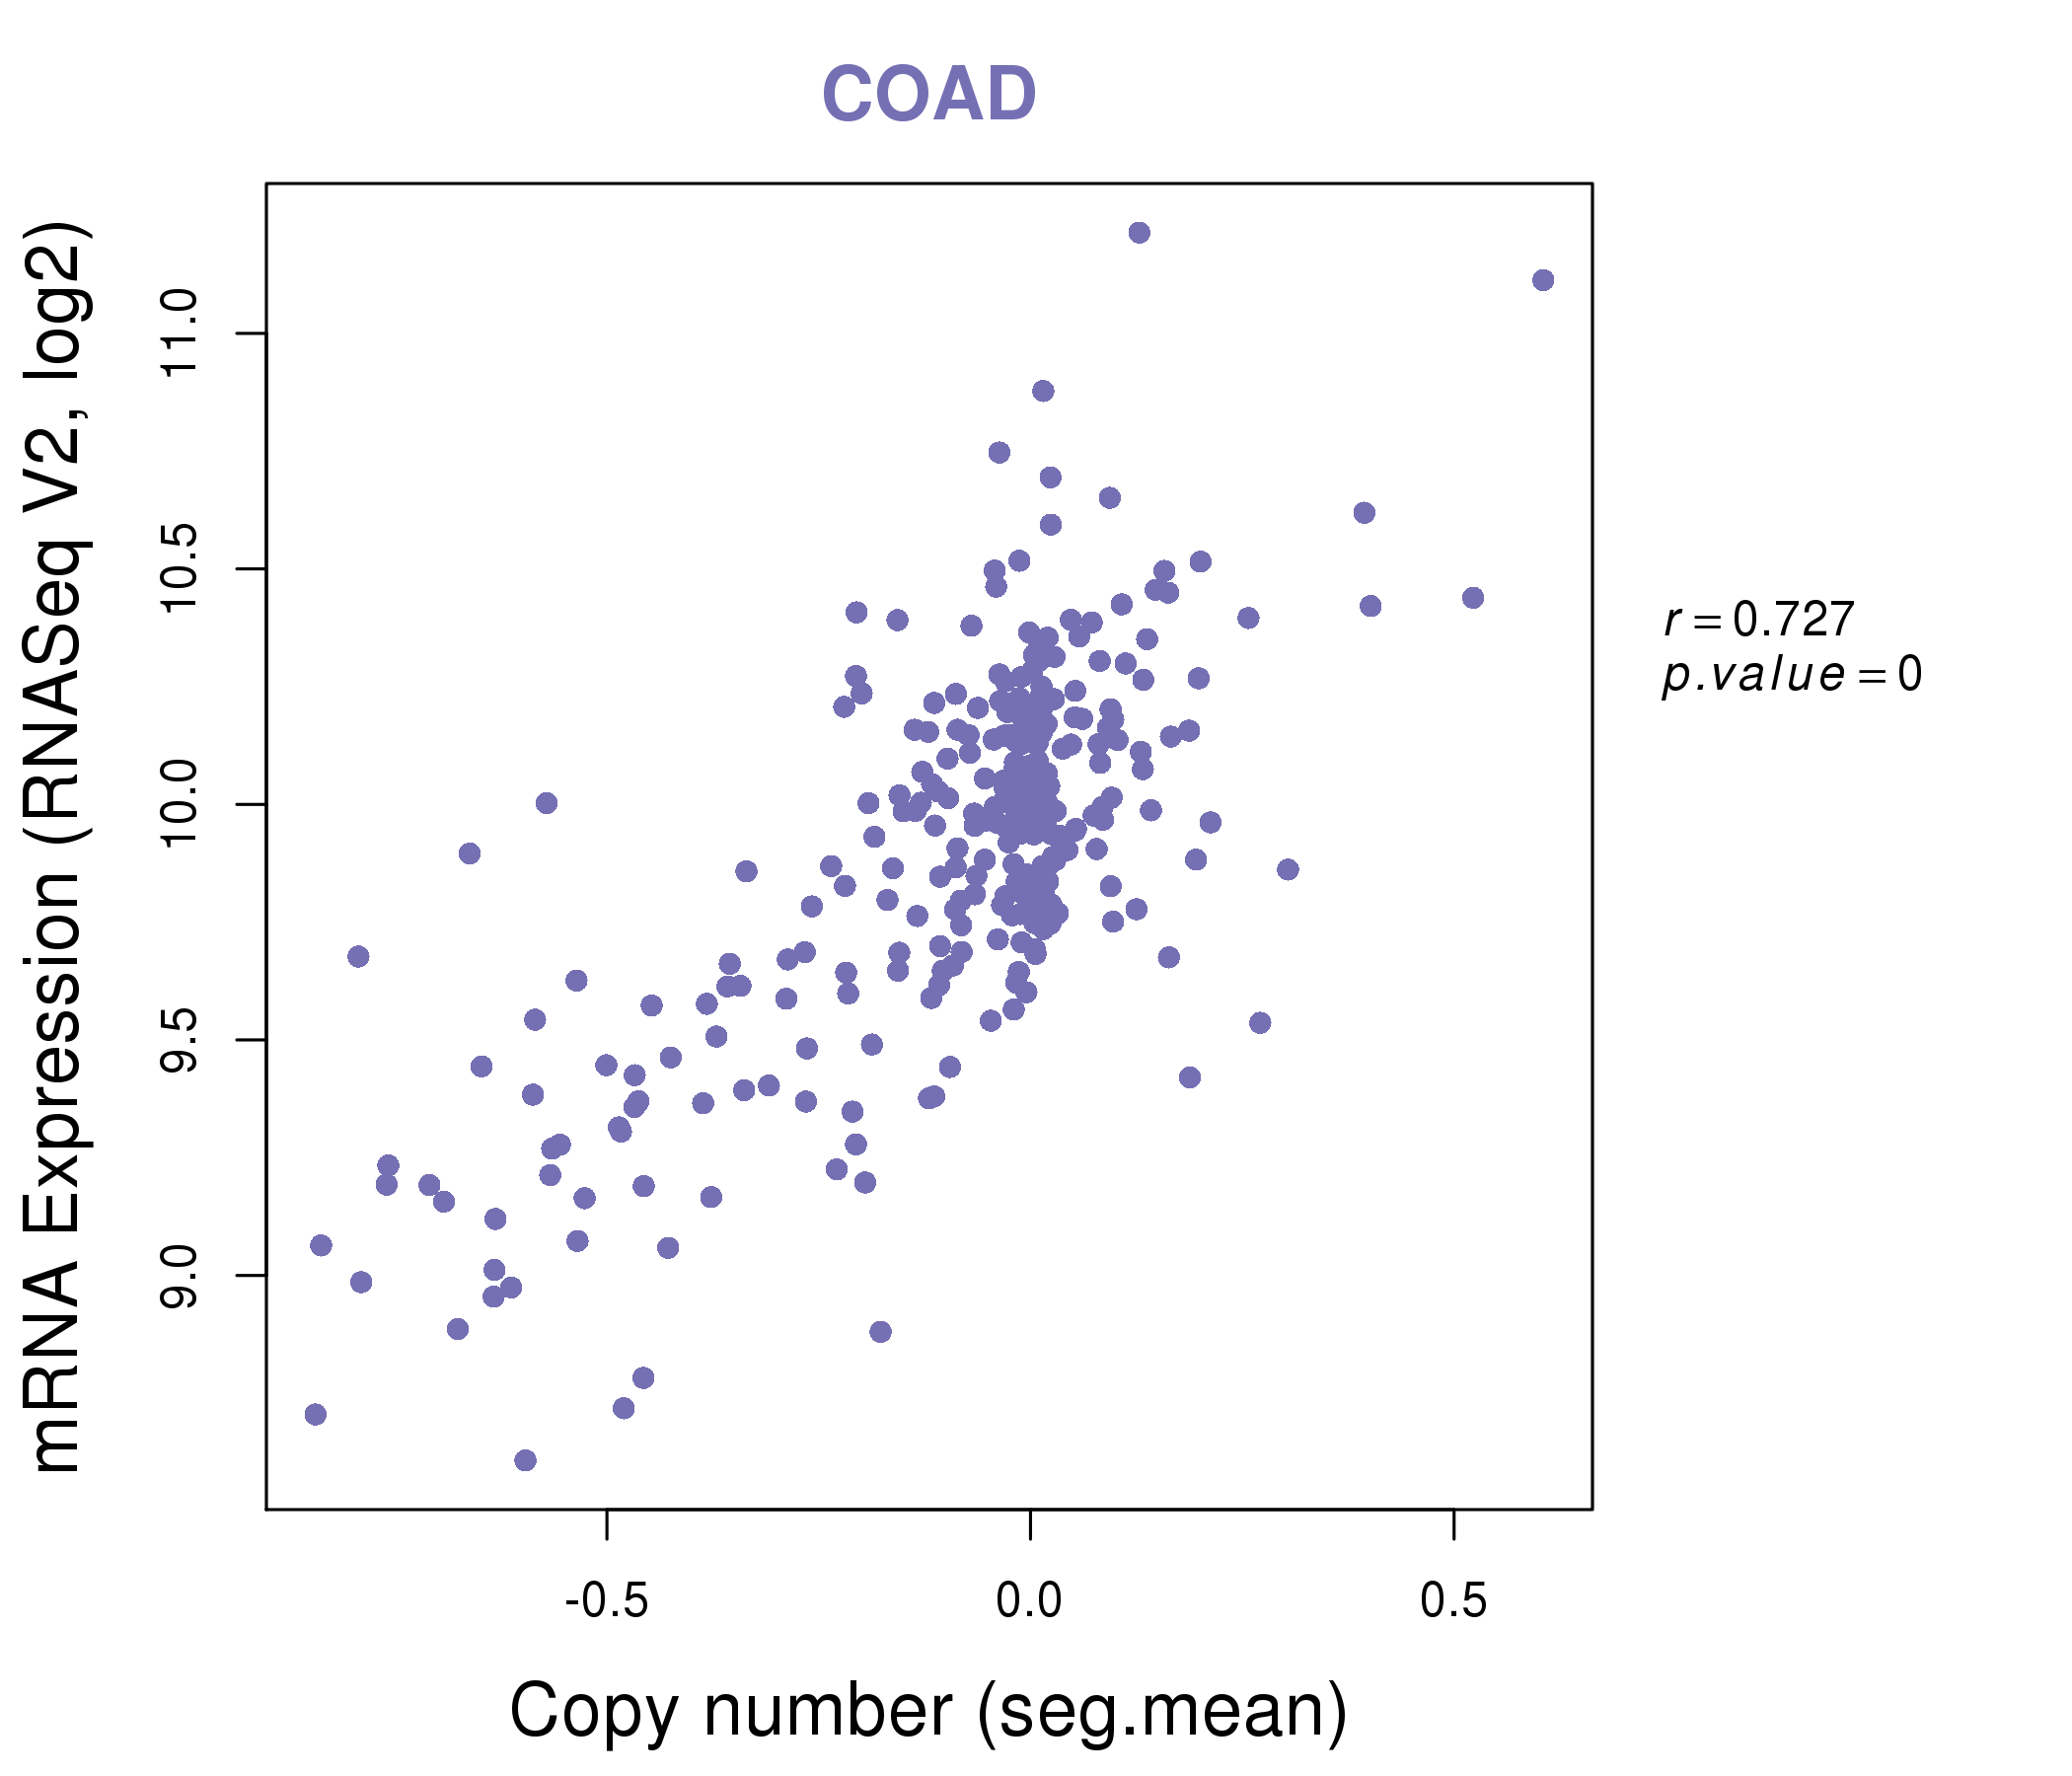
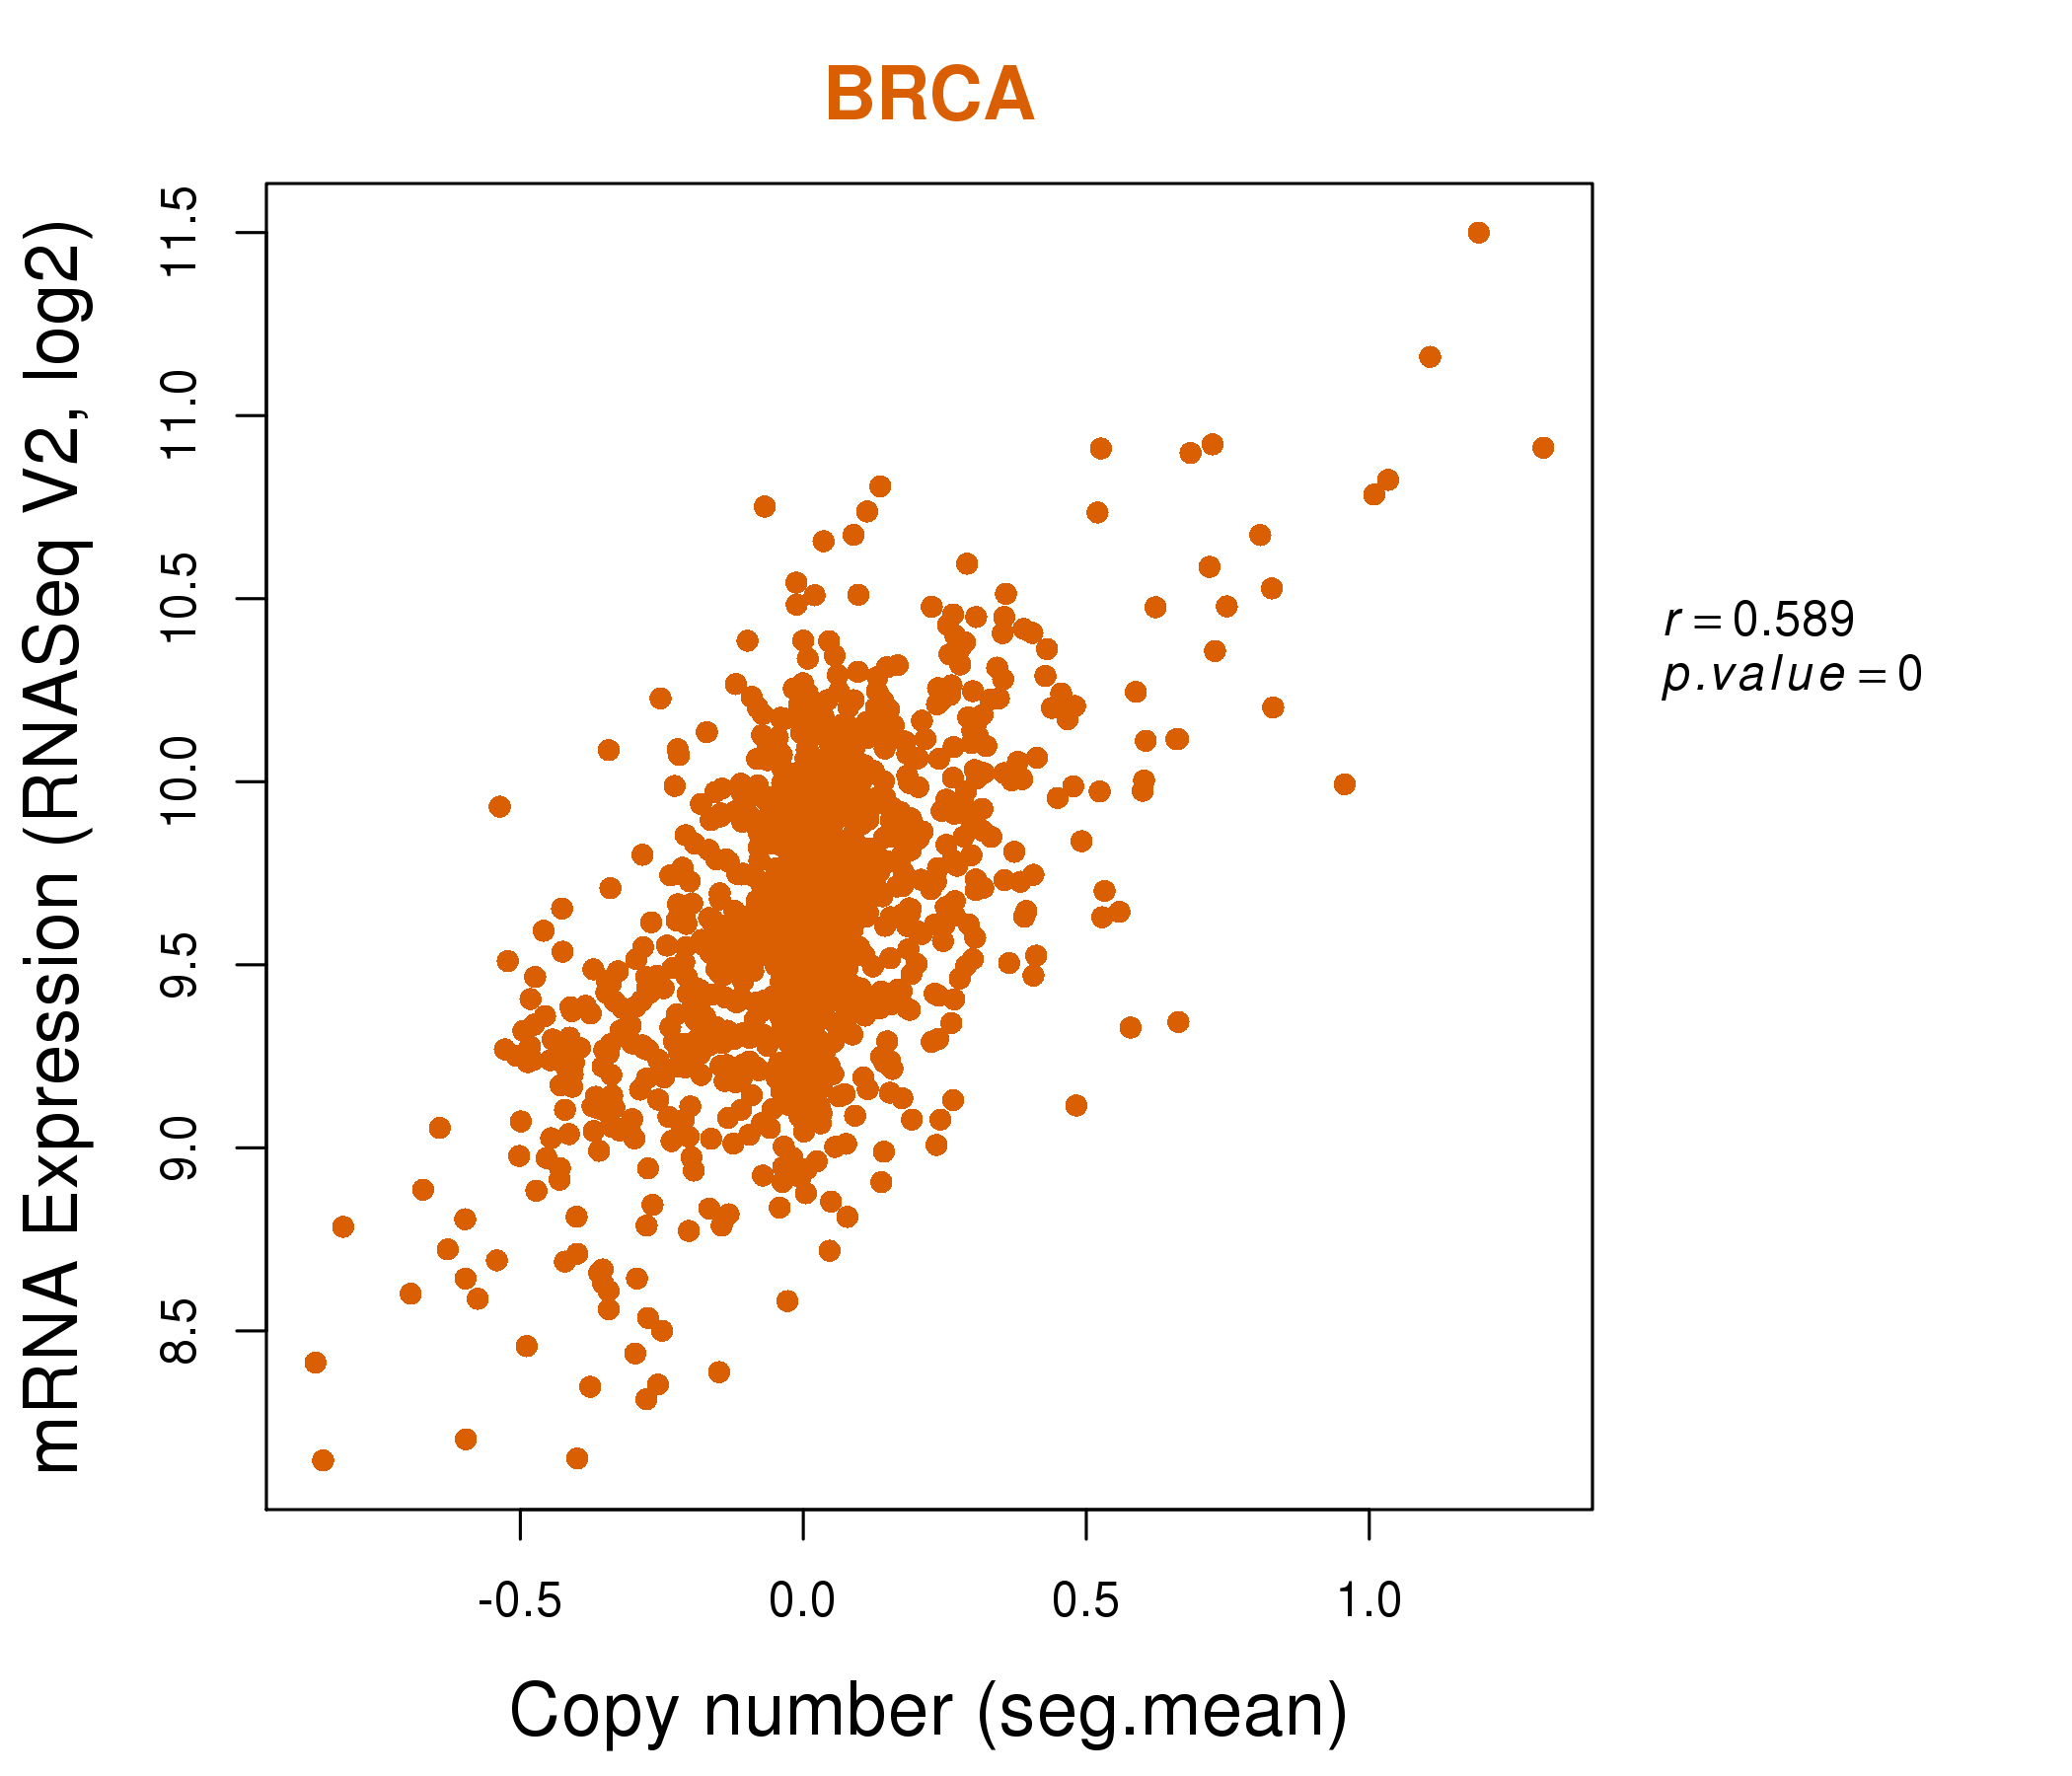
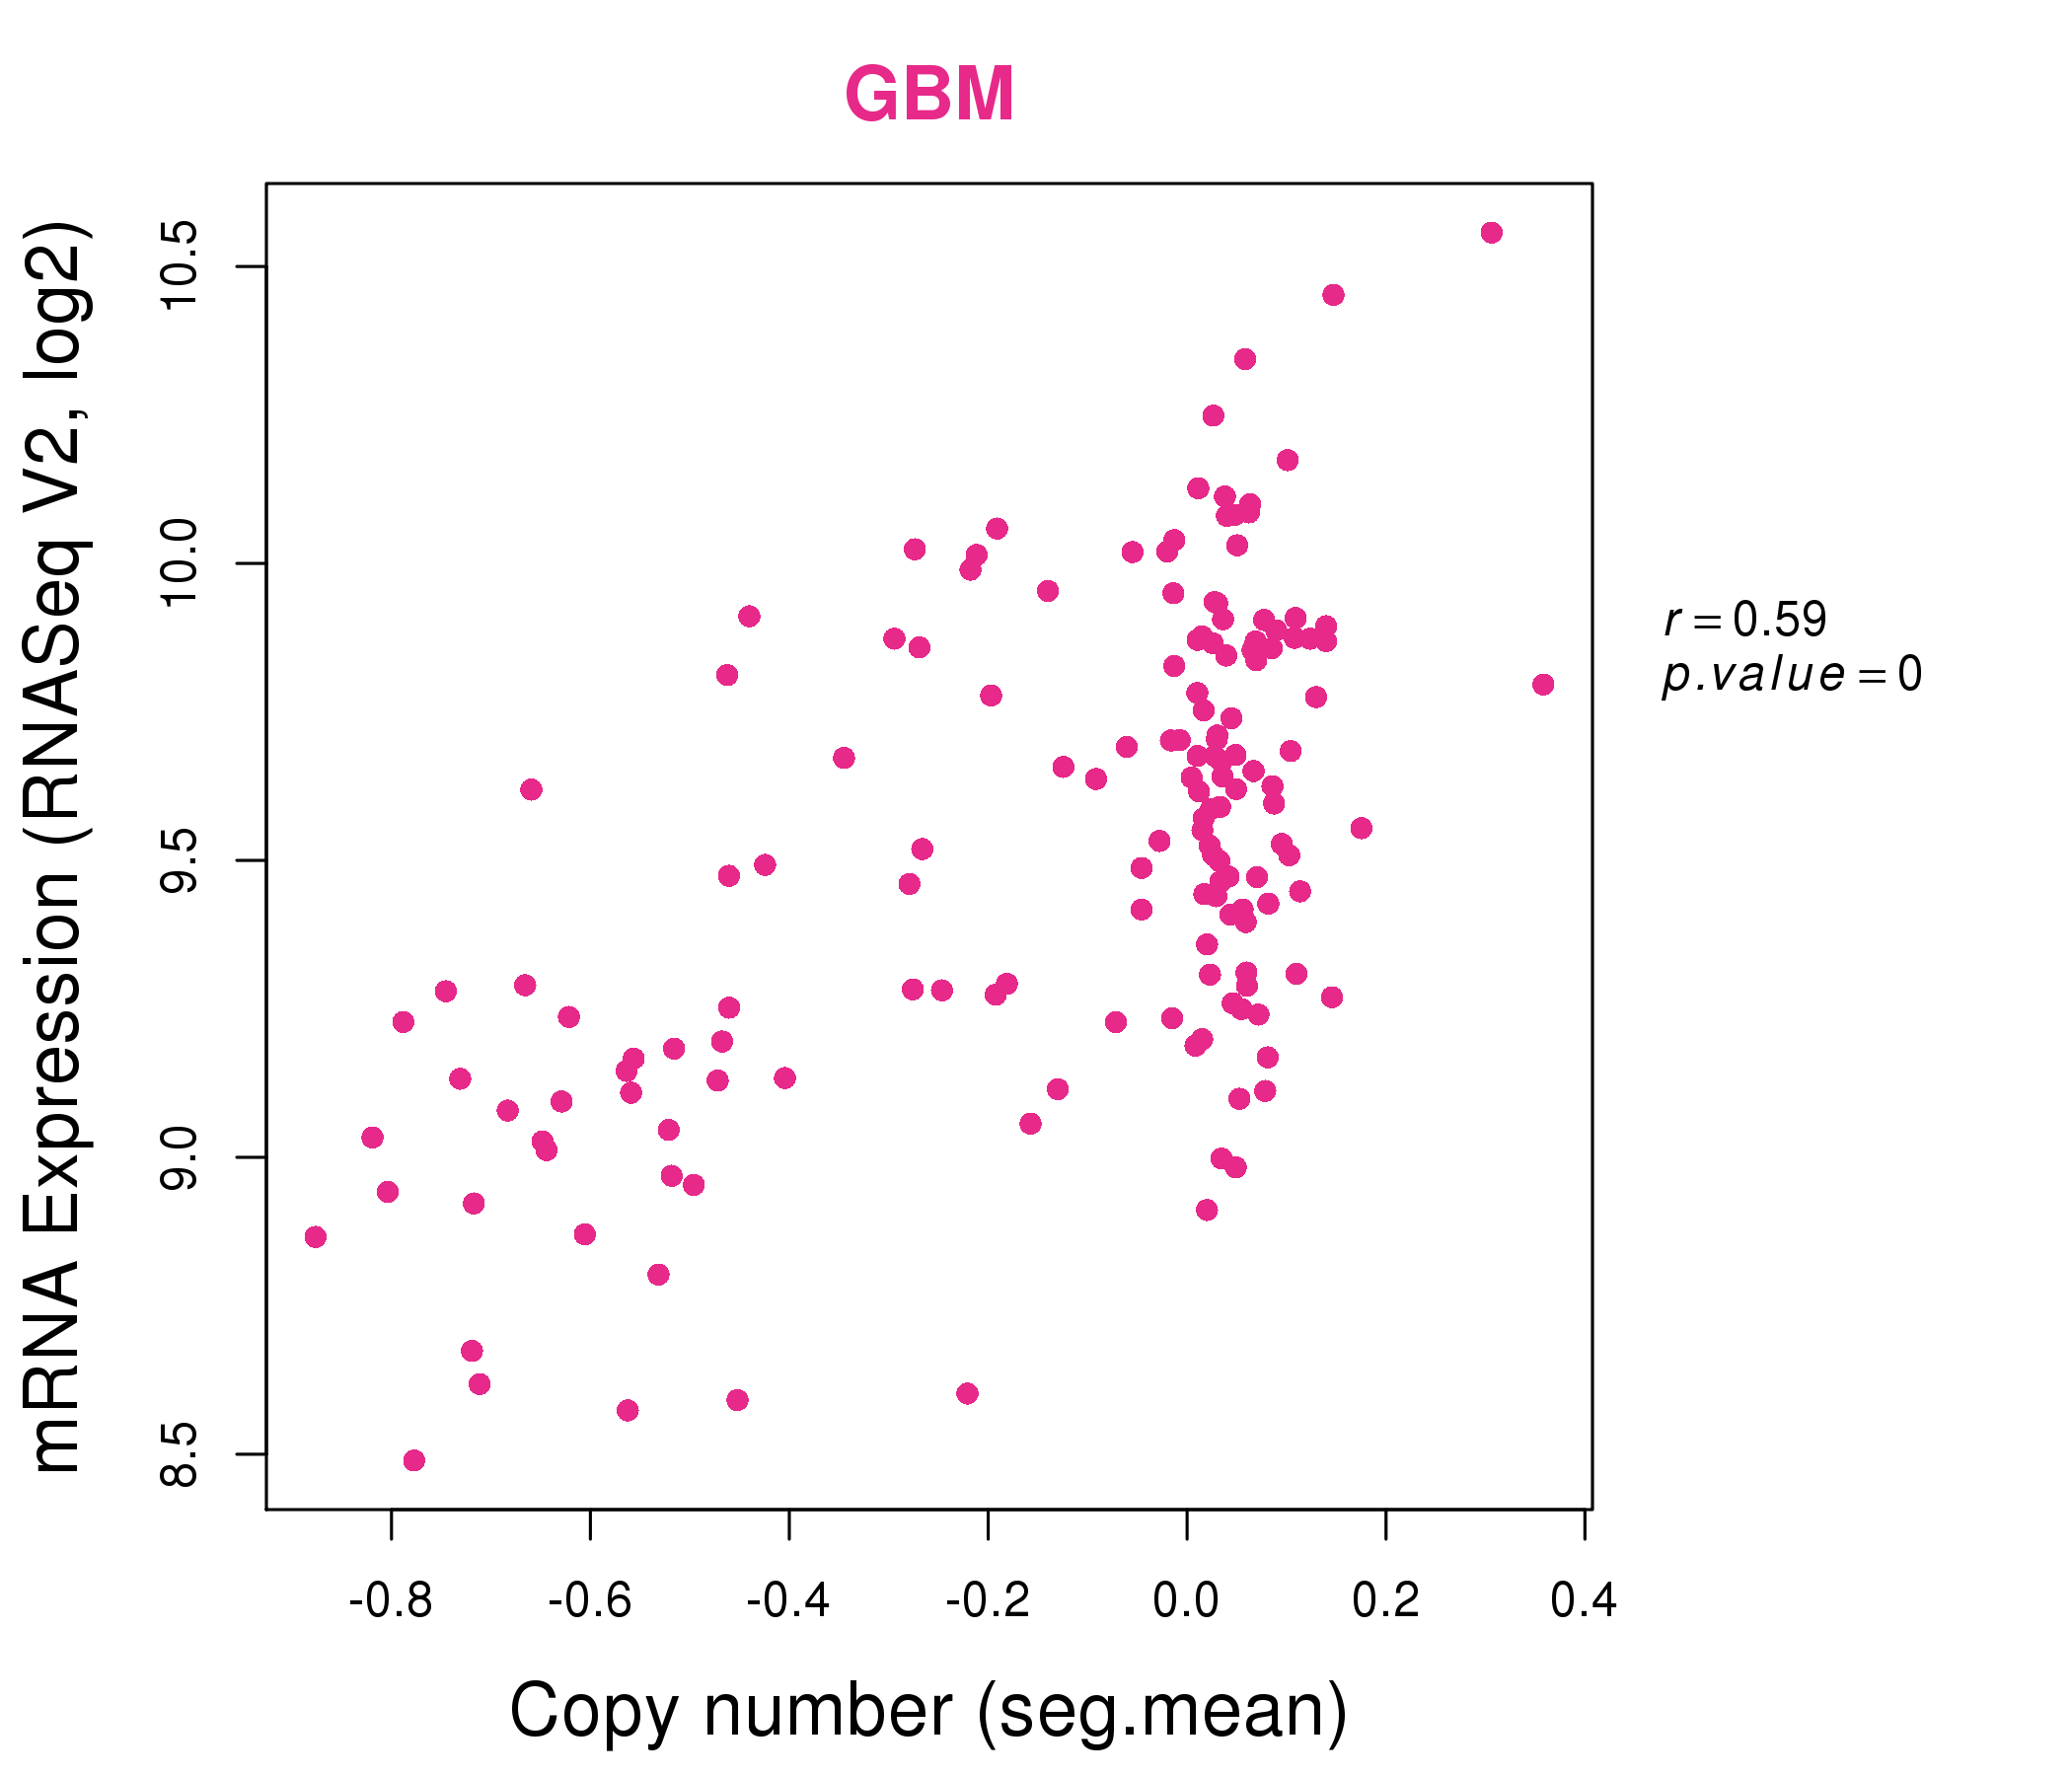
| * This plots show the correlation between CNV and gene expression. |
: Open all plots for all cancer types
 |
|
 |
|
| Top |
| Gene-Gene Network Information |
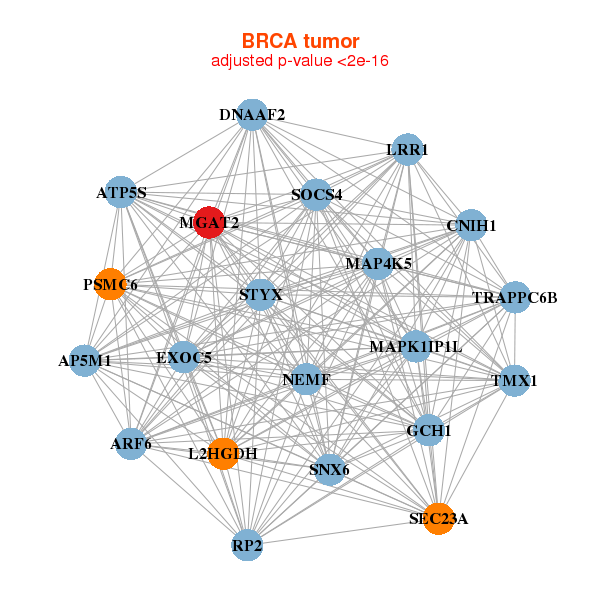
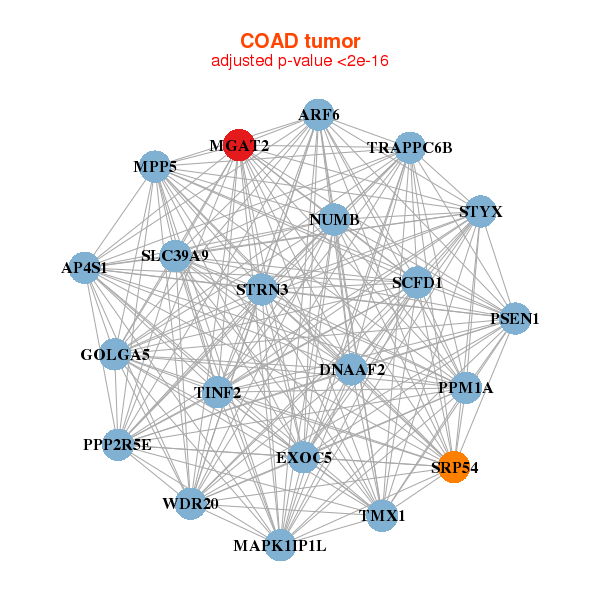
| * Co-Expression network figures were drawn using R package igraph. Only the top 20 genes with the highest correlations were shown. Red circle: input gene, orange circle: cell metabolism gene, sky circle: other gene |
: Open all plots for all cancer types
 |
|
| ARF6,ATP5S,DNAAF2,CNIH1,EXOC5,GCH1,L2HGDH, MAP4K5,MAPK1IP1L,MGAT2,AP5M1,LRR1,PSMC6,RP2, NEMF,SEC23A,SNX6,SOCS4,STYX,TMX1,TRAPPC6B | AP3S1,ARF4,ATP6AP2,CAPZA1,CCNY,COMMD8,ERI1, FKBP1A,GNG10,GOLT1B,KDELR2,LY96,MGAT2,PRCP, RAB1A,RALB,RAP1A,RAP1B,SDCBP,SGPP1,YWHAB |
 |
|
| AP4S1,ARF6,DNAAF2,EXOC5,GOLGA5,MAPK1IP1L,MGAT2, MPP5,NUMB,PPM1A,PPP2R5E,PSEN1,SCFD1,SLC39A9, SRP54,STRN3,STYX,TINF2,TMX1,TRAPPC6B,WDR20 | ARF6,MCU,CDC42SE2,EHD4,FAM104A,FAM105A,FUCA2, HOXA1,MAD2L1BP,MGAT2,MOB1A,NRAS,PRKCI,RNF138, SLC35B3,TOR2A,TPD52,TXNDC11,ZDHHC13,ZDHHC3,ZNRF2 |

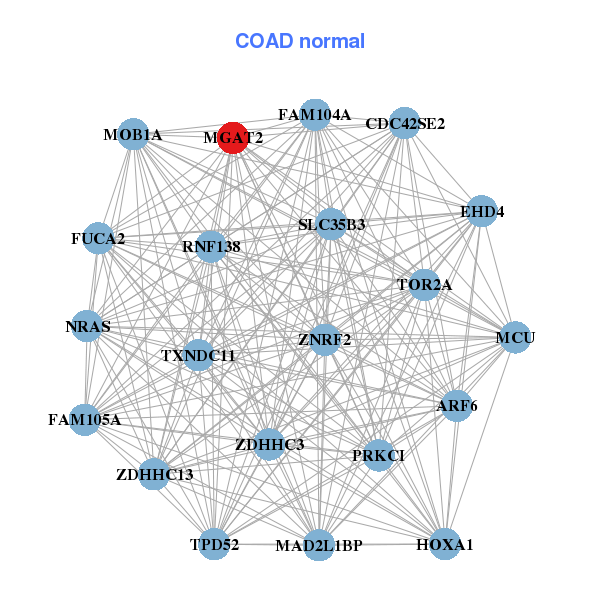
| * Co-Expression network figures were drawn using R package igraph. Only the top 20 genes with the highest correlations were shown. Red circle: input gene, orange circle: cell metabolism gene, sky circle: other gene |
: Open all plots for all cancer types
| Top |
: Open all interacting genes' information including KEGG pathway for all interacting genes from DAVID
| Top |
| Pharmacological Information for MGAT2 |
| There's no related Drug. |
| Top |
| Cross referenced IDs for MGAT2 |
| * We obtained these cross-references from Uniprot database. It covers 150 different DBs, 18 categories. http://www.uniprot.org/help/cross_references_section |
: Open all cross reference information
|
Copyright © 2016-Present - The Univsersity of Texas Health Science Center at Houston @ |