|
||||||||||||||||||||||||||||||||||||||||||||||||||||||||||||||||||||||||||||||||||||||||||||||||||||||||||||||||||||||||||||||||||||||||||||||||||||||||||||||||||||||||||||||||||||||||||||||||||||||||||||||||||||||||||||||||||||||||||||||||||||||||||||||||||||||||||||||||||||||||||||||||||||||||||||||||||||||||||
| |
| Phenotypic Information (metabolism pathway, cancer, disease, phenome) |
| |
| |
| Gene-Gene Network Information: Co-Expression Network, Interacting Genes & KEGG |
| |
|


| Gene Summary for MGAT3 |
| Basic gene info. | Gene symbol | MGAT3 |
| Gene name | mannosyl (beta-1,4-)-glycoprotein beta-1,4-N-acetylglucosaminyltransferase | |
| Synonyms | GNT-III|GNT3 | |
| Cytomap | UCSC genome browser: 22q13.1 | |
| Genomic location | chr22 :39853324-39888199 | |
| Type of gene | protein-coding | |
| RefGenes | NM_001098270.1, NM_002409.4, | |
| Ensembl id | ENSG00000128268 | |
| Description | GlcNAc-T IIIN-acetylglucosaminyltransferase IIIN-glycosyl-oligosaccharide-glycoprotein N-acetylglucosaminyltransferase IIIbeta-1,4-mannosyl-glycoprotein 4-beta-N-acetylglucosaminyltransferase | |
| Modification date | 20141207 | |
| dbXrefs | MIM : 604621 | |
| HGNC : HGNC | ||
| Ensembl : ENSG00000128268 | ||
| HPRD : 07058 | ||
| Vega : OTTHUMG00000030185 | ||
| Protein | UniProt: go to UniProt's Cross Reference DB Table | |
| Expression | CleanEX: HS_MGAT3 | |
| BioGPS: 4248 | ||
| Gene Expression Atlas: ENSG00000128268 | ||
| The Human Protein Atlas: ENSG00000128268 | ||
| Pathway | NCI Pathway Interaction Database: MGAT3 | |
| KEGG: MGAT3 | ||
| REACTOME: MGAT3 | ||
| ConsensusPathDB | ||
| Pathway Commons: MGAT3 | ||
| Metabolism | MetaCyc: MGAT3 | |
| HUMANCyc: MGAT3 | ||
| Regulation | Ensembl's Regulation: ENSG00000128268 | |
| miRBase: chr22 :39,853,324-39,888,199 | ||
| TargetScan: NM_001098270 | ||
| cisRED: ENSG00000128268 | ||
| Context | iHOP: MGAT3 | |
| cancer metabolism search in PubMed: MGAT3 | ||
| UCL Cancer Institute: MGAT3 | ||
| Assigned class in ccmGDB | C | |
| Top |
| Phenotypic Information for MGAT3(metabolism pathway, cancer, disease, phenome) |
| Cancer | CGAP: MGAT3 |
| Familial Cancer Database: MGAT3 | |
| * This gene is included in those cancer gene databases. |
|
|
|
|
|
| . | ||||||||||||||||||||||||||||||||||||||||||||||||||||||||||||||||||||||||||||||||||||||||||||||||||||||||||||||||||||||||||||||||||||||||||||||||||||||||||||||||||||||||||||||||||||||||||||||||||||||||||||||||||||||||||||||||||||||||||||||||||||||||||||||||||||||||||||||||||||||||||||||||||||||||||||||||||||
Oncogene 1 | Significant driver gene in | |||||||||||||||||||||||||||||||||||||||||||||||||||||||||||||||||||||||||||||||||||||||||||||||||||||||||||||||||||||||||||||||||||||||||||||||||||||||||||||||||||||||||||||||||||||||||||||||||||||||||||||||||||||||||||||||||||||||||||||||||||||||||||||||||||||||||||||||||||||||||||||||||||||||||||||||||||||||||
| cf) number; DB name 1 Oncogene; http://nar.oxfordjournals.org/content/35/suppl_1/D721.long, 2 Tumor Suppressor gene; https://bioinfo.uth.edu/TSGene/, 3 Cancer Gene Census; http://www.nature.com/nrc/journal/v4/n3/abs/nrc1299.html, 4 CancerGenes; http://nar.oxfordjournals.org/content/35/suppl_1/D721.long, 5 Network of Cancer Gene; http://ncg.kcl.ac.uk/index.php, 1Therapeutic Vulnerabilities in Cancer; http://cbio.mskcc.org/cancergenomics/statius/ |
| REACTOME_METABOLISM_OF_PROTEINS | |
| OMIM | |
| Orphanet | |
| Disease | KEGG Disease: MGAT3 |
| MedGen: MGAT3 (Human Medical Genetics with Condition) | |
| ClinVar: MGAT3 | |
| Phenotype | MGI: MGAT3 (International Mouse Phenotyping Consortium) |
| PhenomicDB: MGAT3 | |
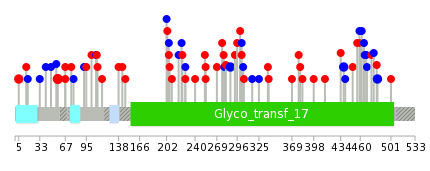
| Mutations for MGAT3 |
| * Under tables are showing count per each tissue to give us broad intuition about tissue specific mutation patterns.You can go to the detailed page for each mutation database's web site. |
| There's no structural variation information in COSMIC data for this gene. |
| * From mRNA Sanger sequences, Chitars2.0 arranged chimeric transcripts. This table shows MGAT3 related fusion information. |
| ID | Head Gene | Tail Gene | Accession | Gene_a | qStart_a | qEnd_a | Chromosome_a | tStart_a | tEnd_a | Gene_a | qStart_a | qEnd_a | Chromosome_a | tStart_a | tEnd_a |
| DR422998 | MGAT3 | 15 | 340 | 22 | 39885783 | 39886108 | TTC31 | 334 | 415 | 2 | 74721605 | 74721686 | |
| Top |
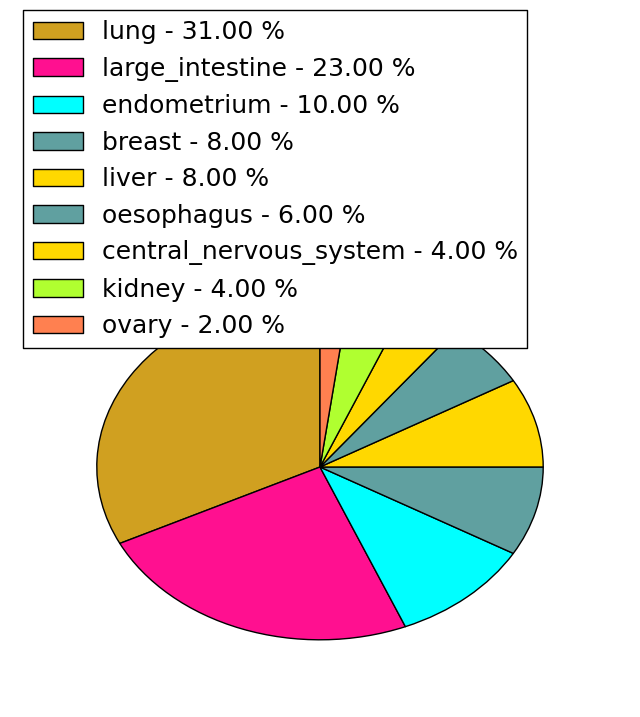
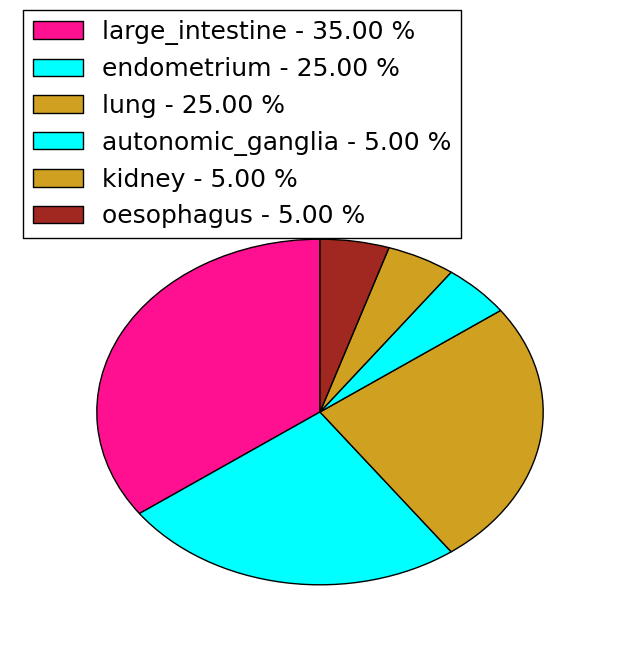
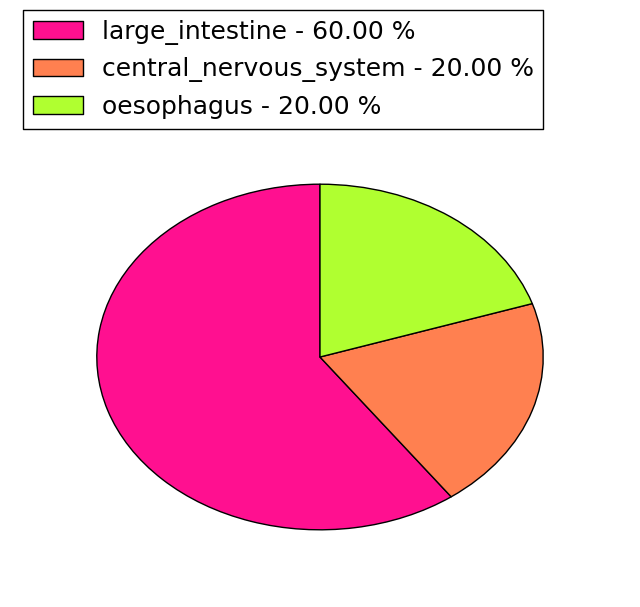
| Mutation type/ Tissue ID | brca | cns | cerv | endome | haematopo | kidn | Lintest | liver | lung | ns | ovary | pancre | prost | skin | stoma | thyro | urina | |||
| Total # sample | 1 | 1 | ||||||||||||||||||
| GAIN (# sample) | 1 | 1 | ||||||||||||||||||
| LOSS (# sample) |
| cf) Tissue ID; Tissue type (1; Breast, 2; Central_nervous_system, 3; Cervix, 4; Endometrium, 5; Haematopoietic_and_lymphoid_tissue, 6; Kidney, 7; Large_intestine, 8; Liver, 9; Lung, 10; NS, 11; Ovary, 12; Pancreas, 13; Prostate, 14; Skin, 15; Stomach, 16; Thyroid, 17; Urinary_tract) |
| Top |
|
 |
| Top |
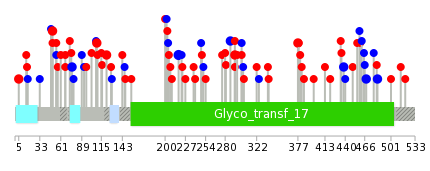
| Stat. for Non-Synonymous SNVs (# total SNVs=47) | (# total SNVs=20) |
 |  |
(# total SNVs=5) | (# total SNVs=0) |
 |
| Top |
| * When you move the cursor on each content, you can see more deailed mutation information on the Tooltip. Those are primary_site,primary_histology,mutation(aa),pubmedID. |
| GRCh37 position | Mutation(aa) | Unique sampleID count |
| chr22:39883736-39883736 | p.P130fs*24 | 4 |
| chr22:39884006-39884006 | p.F218F | 3 |
| chr22:39884229-39884229 | p.R293C | 3 |
| chr22:39883366-39883366 | p.R5H | 2 |
| chr22:39883677-39883677 | p.V109M | 2 |
| chr22:39884213-39884213 | p.I287I | 2 |
| chr22:39884756-39884756 | p.T468T | 2 |
| chr22:39883951-39883951 | p.V200fs*58 | 2 |
| chr22:39884481-39884481 | p.D377N | 2 |
| chr22:39884666-39884666 | p.G438G | 2 |
| Top |
|
 |
| Point Mutation/ Tissue ID | 1 | 2 | 3 | 4 | 5 | 6 | 7 | 8 | 9 | 10 | 11 | 12 | 13 | 14 | 15 | 16 | 17 | 18 | 19 | 20 |
| # sample | 1 | 2 | 12 | 5 | 1 | 2 | 1 | 11 | 5 | 1 | 11 | 10 | 10 | |||||||
| # mutation | 1 | 2 | 13 | 6 | 1 | 2 | 1 | 12 | 5 | 1 | 15 | 10 | 9 | |||||||
| nonsynonymous SNV | 1 | 2 | 7 | 4 | 1 | 1 | 9 | 3 | 1 | 8 | 6 | 5 | ||||||||
| synonymous SNV | 6 | 2 | 1 | 1 | 3 | 2 | 7 | 4 | 4 |
| cf) Tissue ID; Tissue type (1; BLCA[Bladder Urothelial Carcinoma], 2; BRCA[Breast invasive carcinoma], 3; CESC[Cervical squamous cell carcinoma and endocervical adenocarcinoma], 4; COAD[Colon adenocarcinoma], 5; GBM[Glioblastoma multiforme], 6; Glioma Low Grade, 7; HNSC[Head and Neck squamous cell carcinoma], 8; KICH[Kidney Chromophobe], 9; KIRC[Kidney renal clear cell carcinoma], 10; KIRP[Kidney renal papillary cell carcinoma], 11; LAML[Acute Myeloid Leukemia], 12; LUAD[Lung adenocarcinoma], 13; LUSC[Lung squamous cell carcinoma], 14; OV[Ovarian serous cystadenocarcinoma ], 15; PAAD[Pancreatic adenocarcinoma], 16; PRAD[Prostate adenocarcinoma], 17; SKCM[Skin Cutaneous Melanoma], 18:STAD[Stomach adenocarcinoma], 19:THCA[Thyroid carcinoma], 20:UCEC[Uterine Corpus Endometrial Carcinoma]) |
| Top |
| * We represented just top 10 SNVs. When you move the cursor on each content, you can see more deailed mutation information on the Tooltip. Those are primary_site, primary_histology, mutation(aa), pubmedID. |
| Genomic Position | Mutation(aa) | Unique sampleID count |
| chr22:39883522 | p.T57M,MGAT3 | 3 |
| chr22:39884213 | p.R5H,MGAT3 | 2 |
| chr22:39883366 | p.I287I,MGAT3 | 2 |
| chr22:39884801 | p.A483A,MGAT3 | 2 |
| chr22:39884666 | p.G438G,MGAT3 | 2 |
| chr22:39883780 | p.F108F,MGAT3 | 1 |
| chr22:39884361 | p.E227K,MGAT3 | 1 |
| chr22:39884031 | p.S302S,MGAT3 | 1 |
| chr22:39884700 | p.R450W,MGAT3 | 1 |
| chr22:39883576 | p.V109M,MGAT3 | 1 |
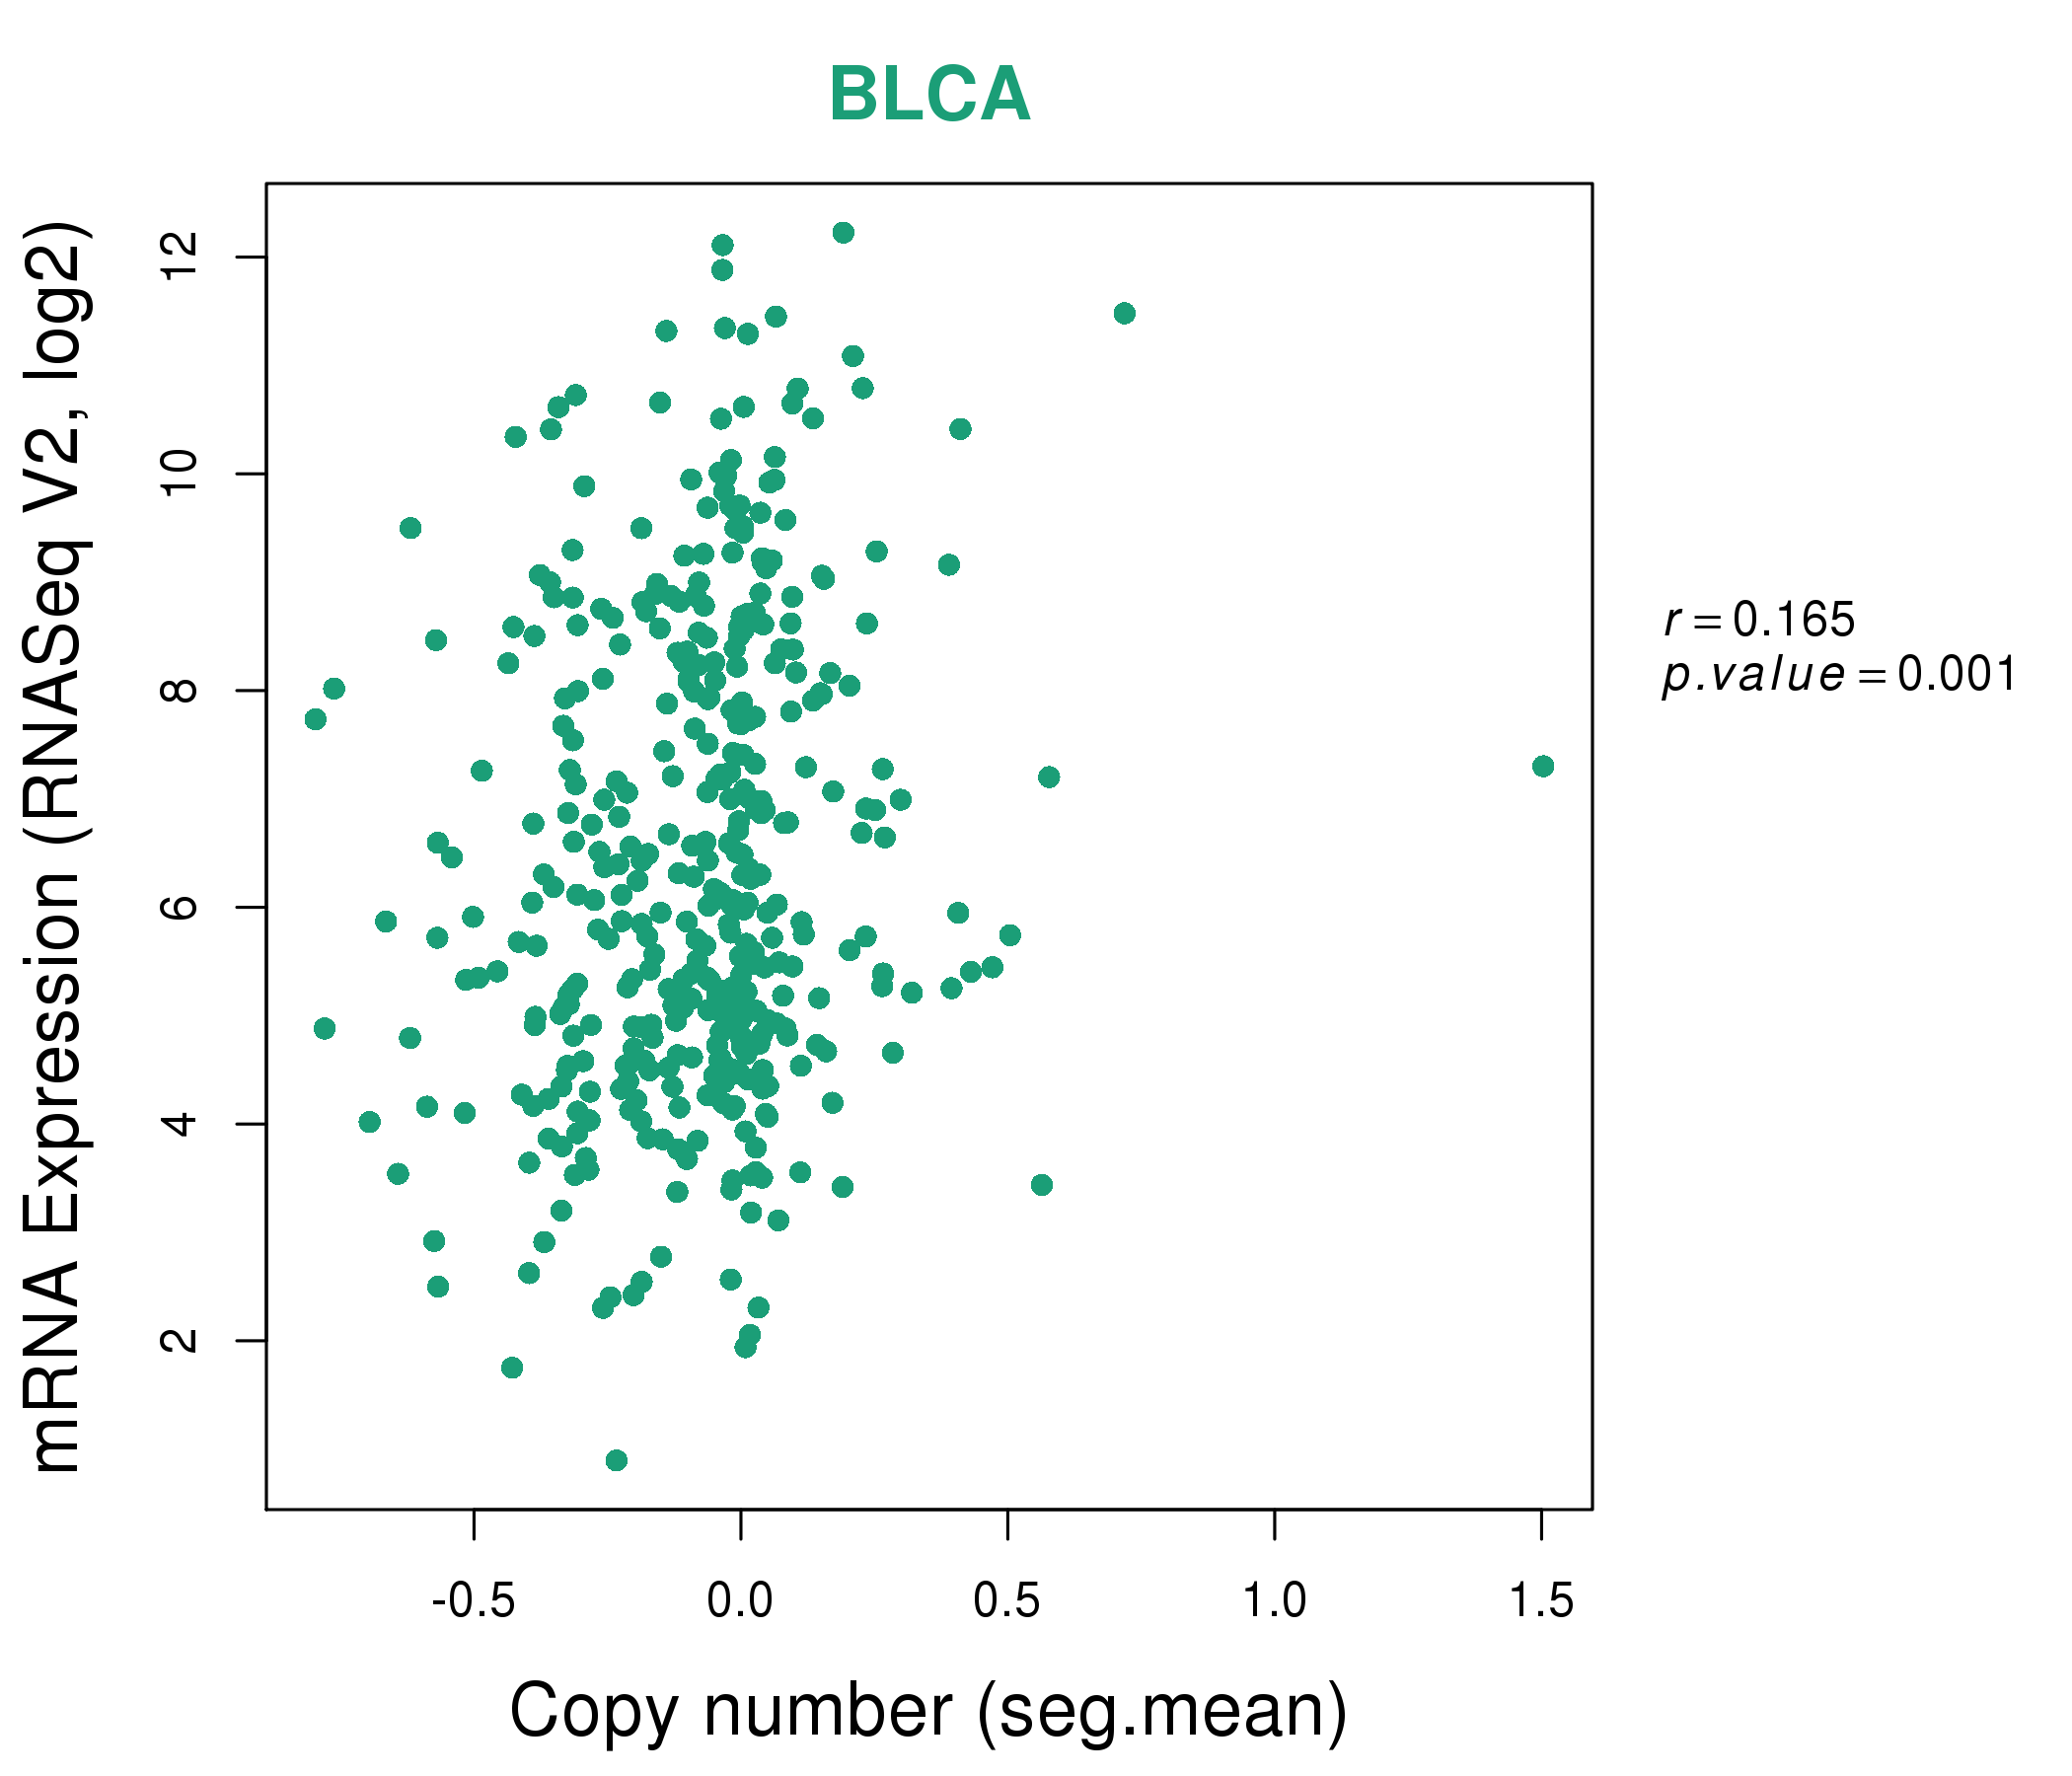
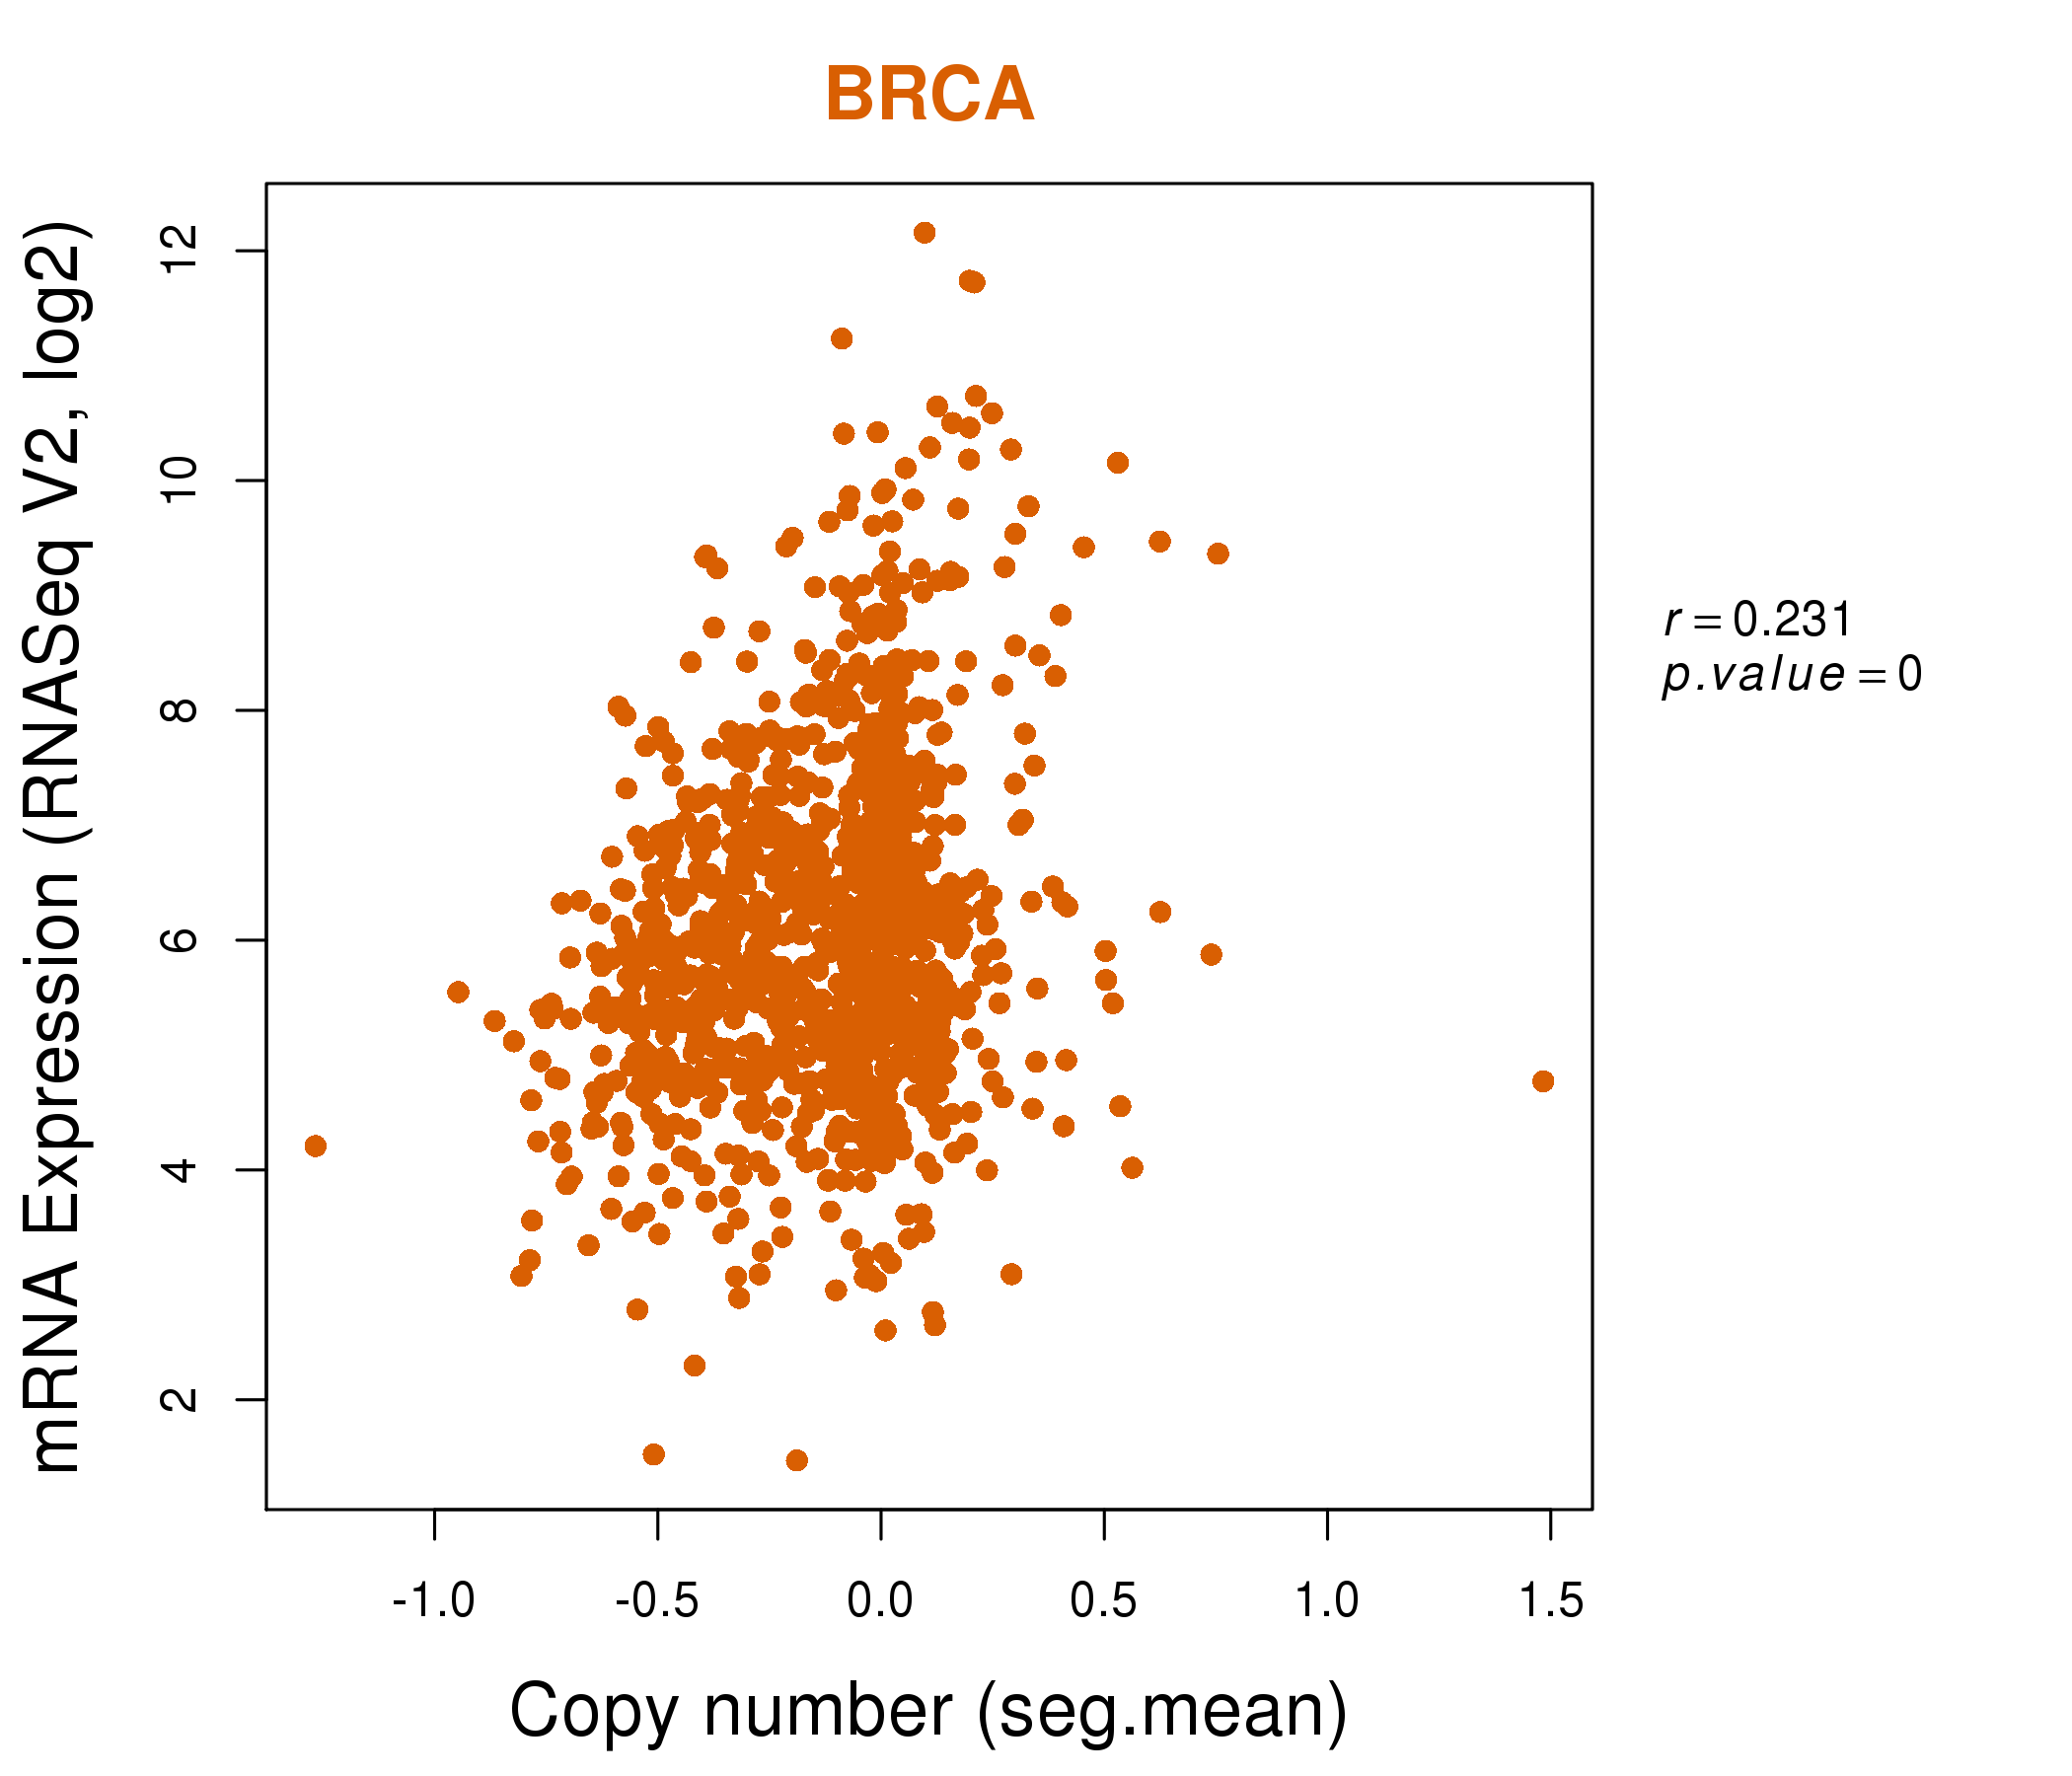
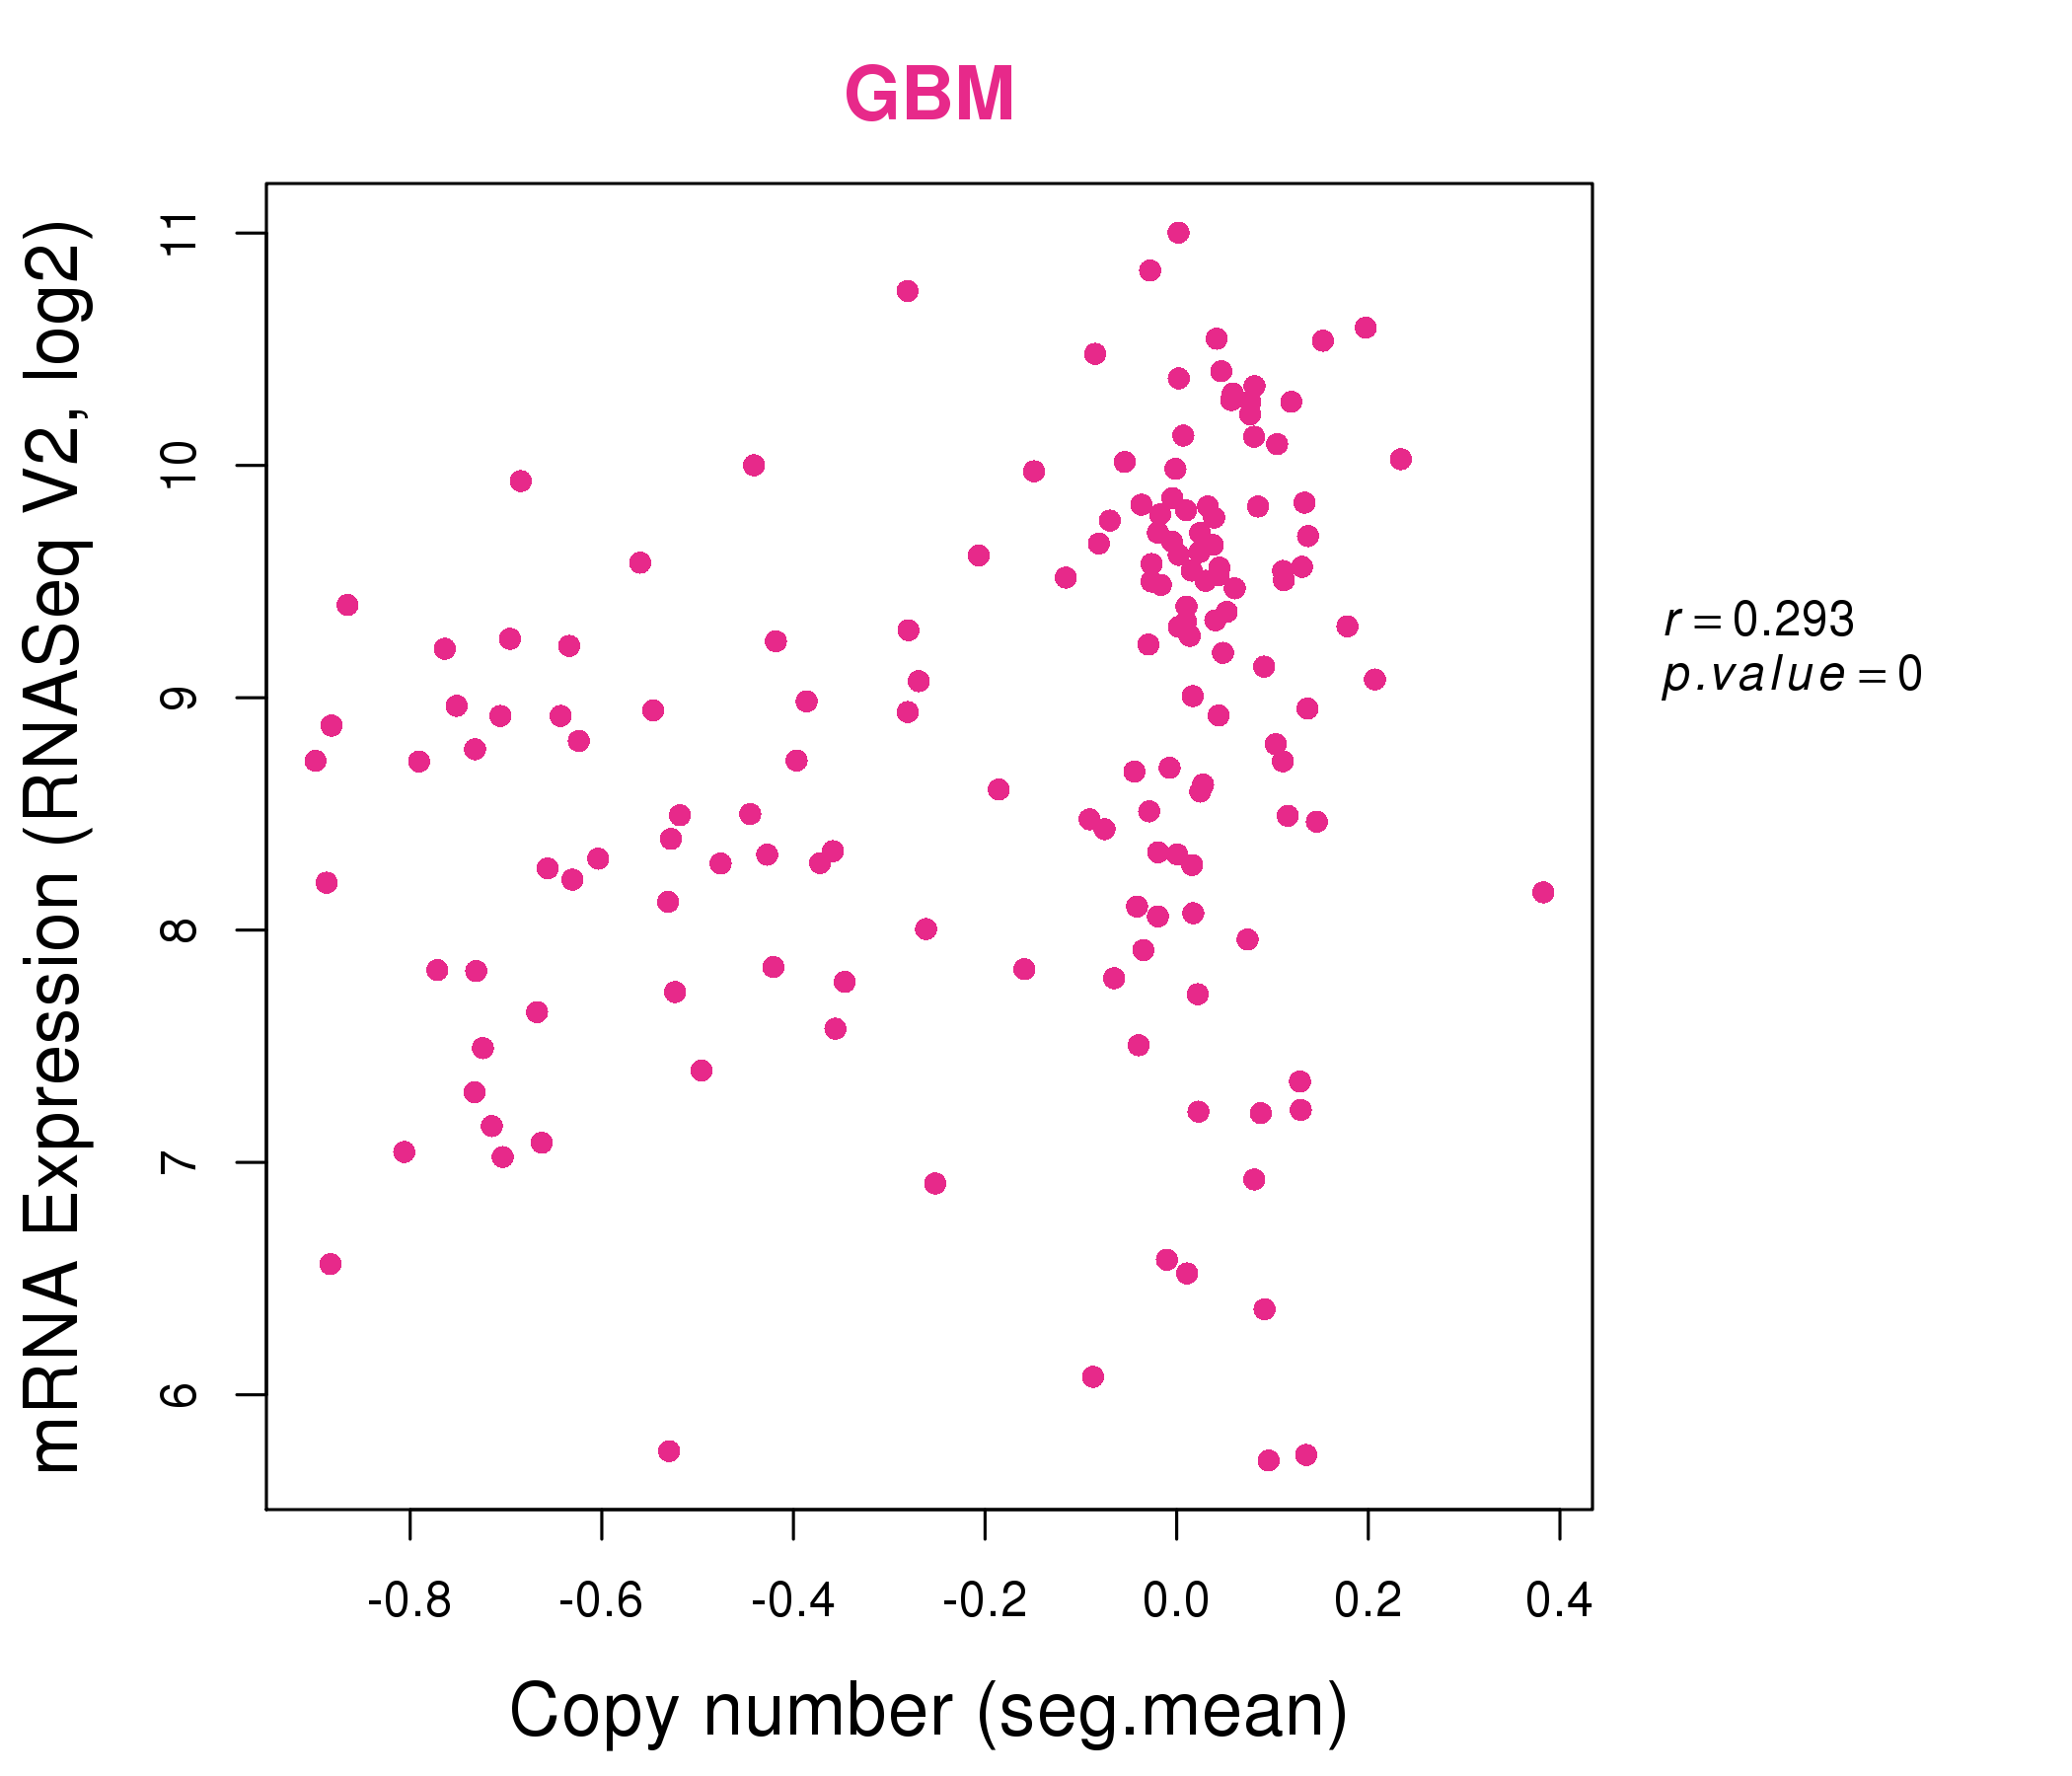
| * Copy number data were extracted from TCGA using R package TCGA-Assembler. The URLs of all public data files on TCGA DCC data server were gathered on Jan-05-2015. Function ProcessCNAData in TCGA-Assembler package was used to obtain gene-level copy number value which is calculated as the average copy number of the genomic region of a gene. |
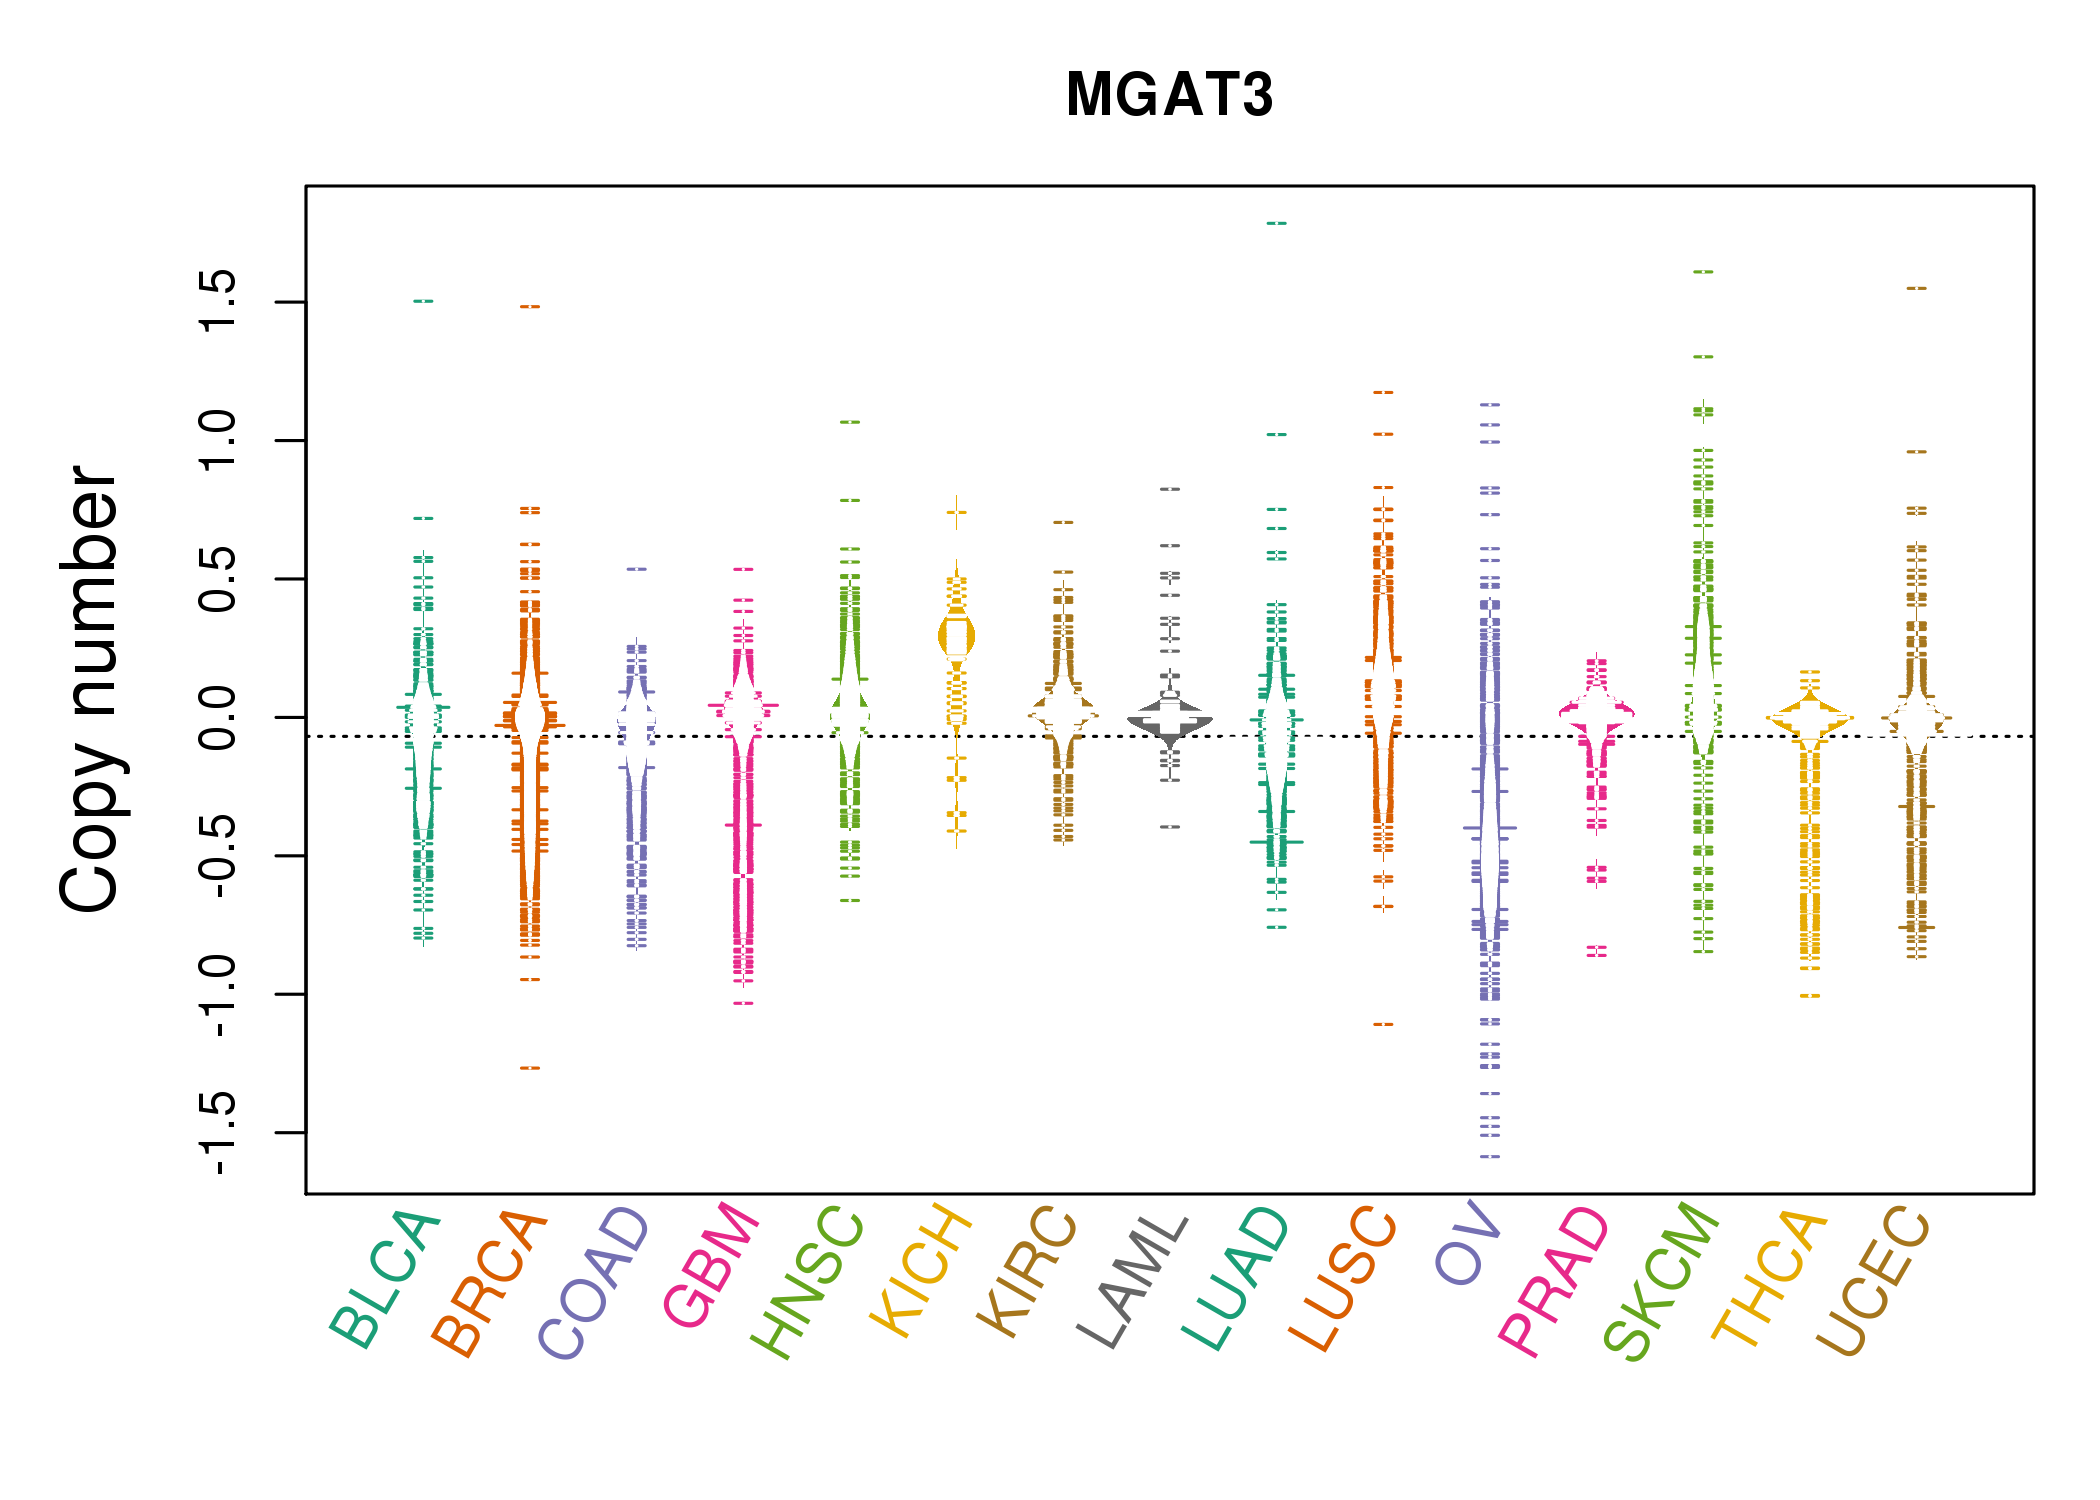 |
| cf) Tissue ID[Tissue type]: BLCA[Bladder Urothelial Carcinoma], BRCA[Breast invasive carcinoma], CESC[Cervical squamous cell carcinoma and endocervical adenocarcinoma], COAD[Colon adenocarcinoma], GBM[Glioblastoma multiforme], Glioma Low Grade, HNSC[Head and Neck squamous cell carcinoma], KICH[Kidney Chromophobe], KIRC[Kidney renal clear cell carcinoma], KIRP[Kidney renal papillary cell carcinoma], LAML[Acute Myeloid Leukemia], LUAD[Lung adenocarcinoma], LUSC[Lung squamous cell carcinoma], OV[Ovarian serous cystadenocarcinoma ], PAAD[Pancreatic adenocarcinoma], PRAD[Prostate adenocarcinoma], SKCM[Skin Cutaneous Melanoma], STAD[Stomach adenocarcinoma], THCA[Thyroid carcinoma], UCEC[Uterine Corpus Endometrial Carcinoma] |
| Top |
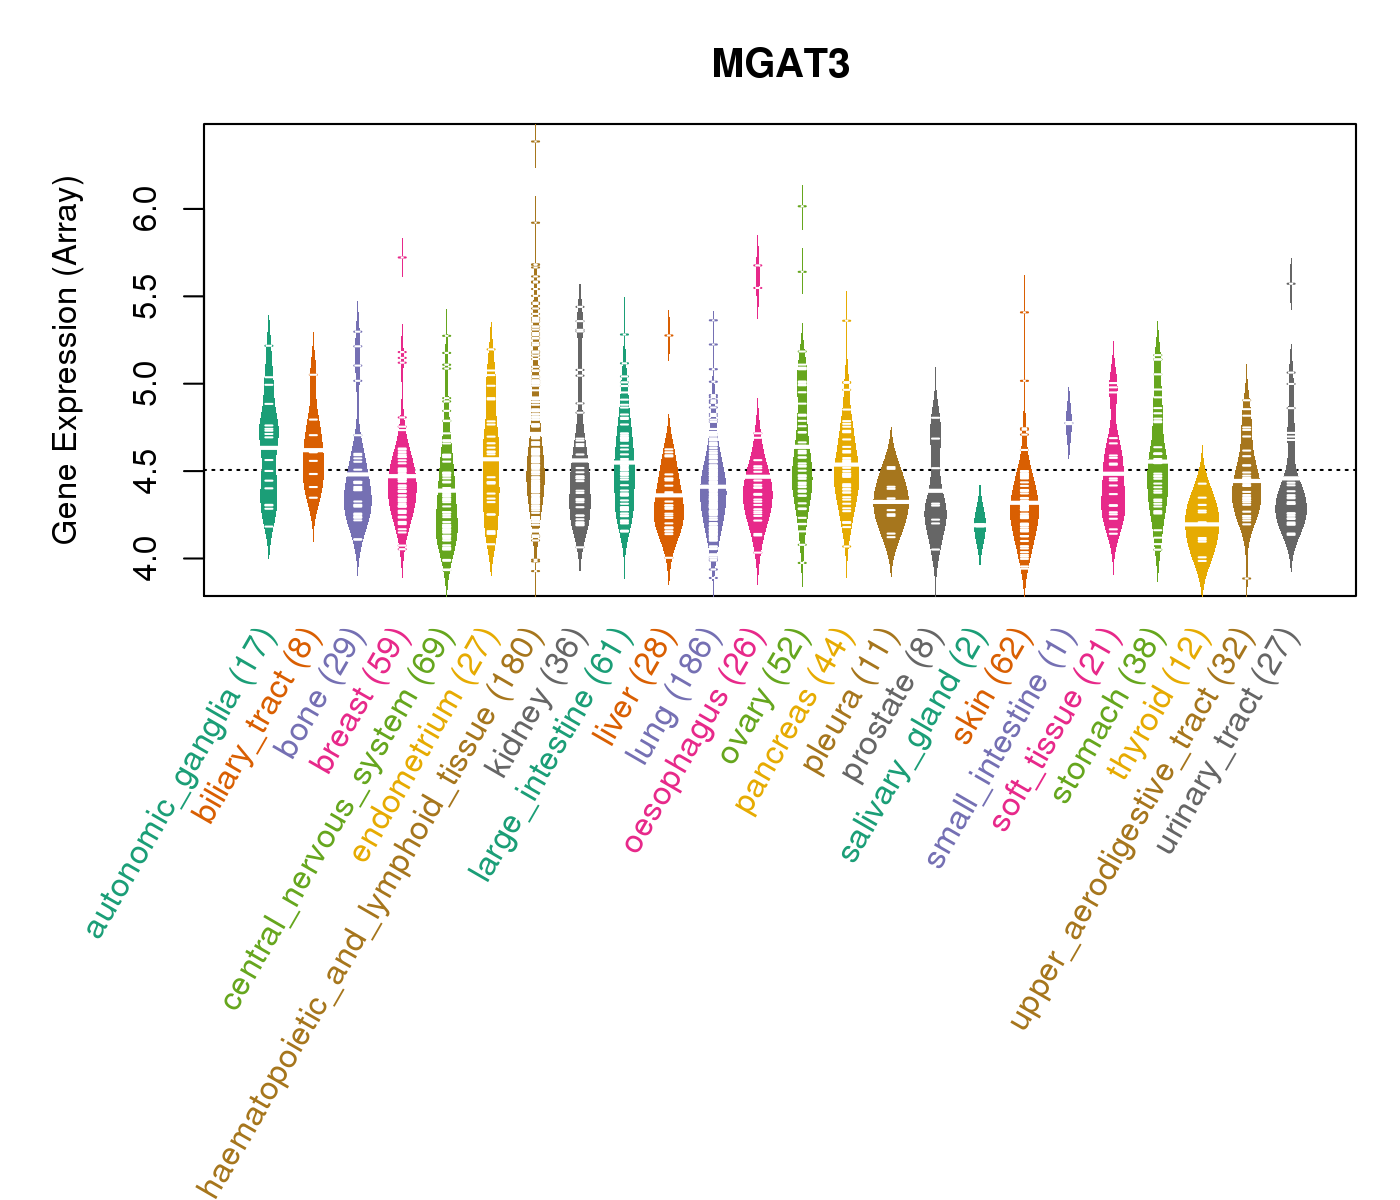
| Gene Expression for MGAT3 |
| * CCLE gene expression data were extracted from CCLE_Expression_Entrez_2012-10-18.res: Gene-centric RMA-normalized mRNA expression data. |
 |
| * Normalized gene expression data of RNASeqV2 was extracted from TCGA using R package TCGA-Assembler. The URLs of all public data files on TCGA DCC data server were gathered at Jan-05-2015. Only eight cancer types have enough normal control samples for differential expression analysis. (t test, adjusted p<0.05 (using Benjamini-Hochberg FDR)) |
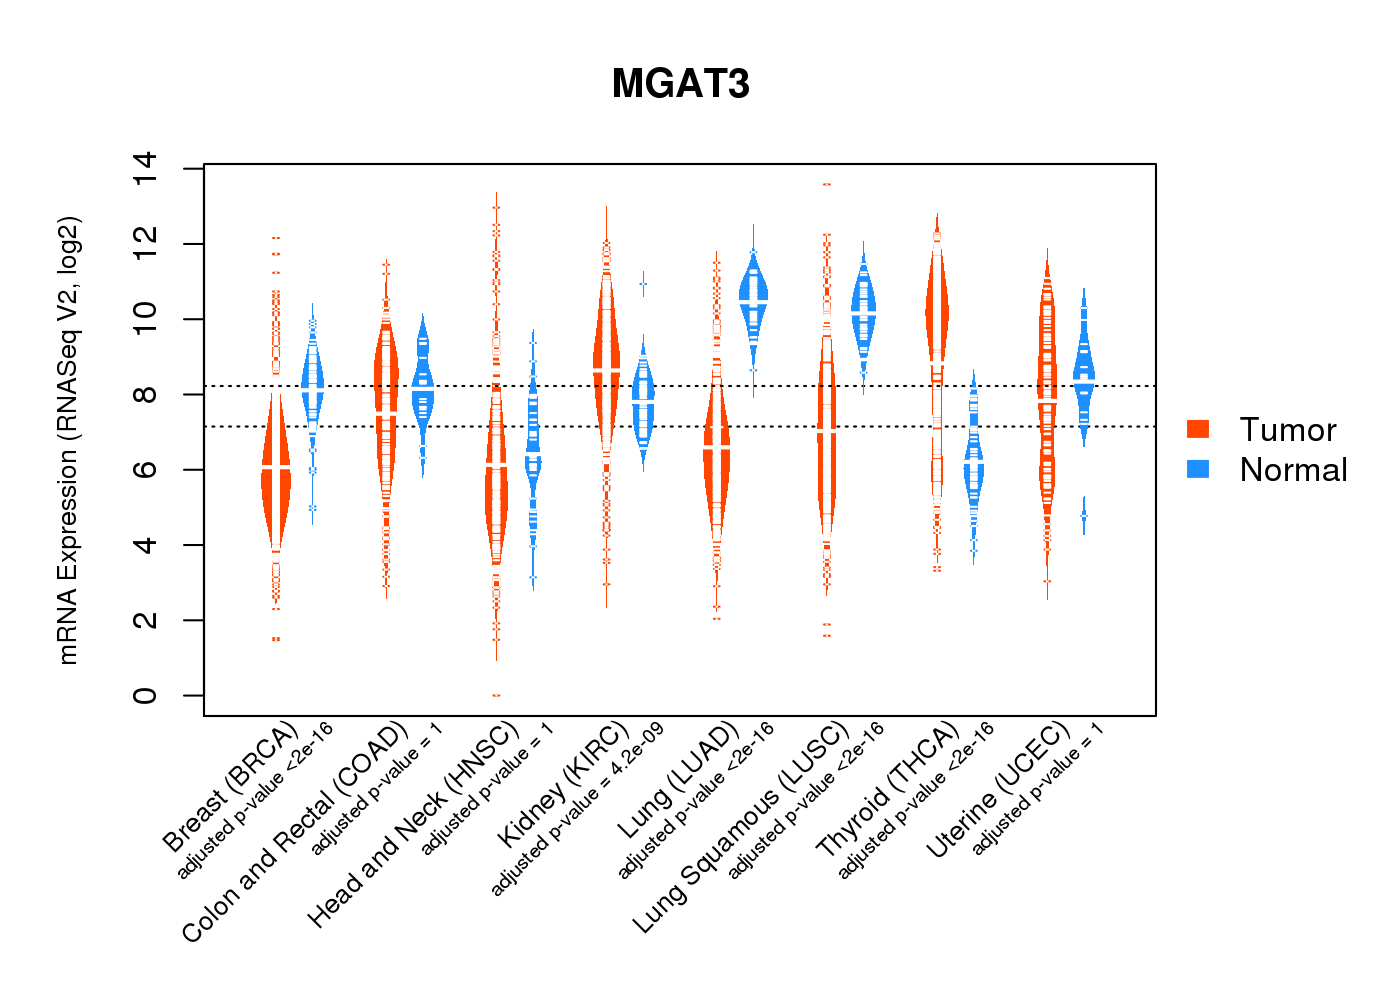 |
| Top |
| * This plots show the correlation between CNV and gene expression. |
: Open all plots for all cancer types
 |
|
 |
|
| Top |
| Gene-Gene Network Information |
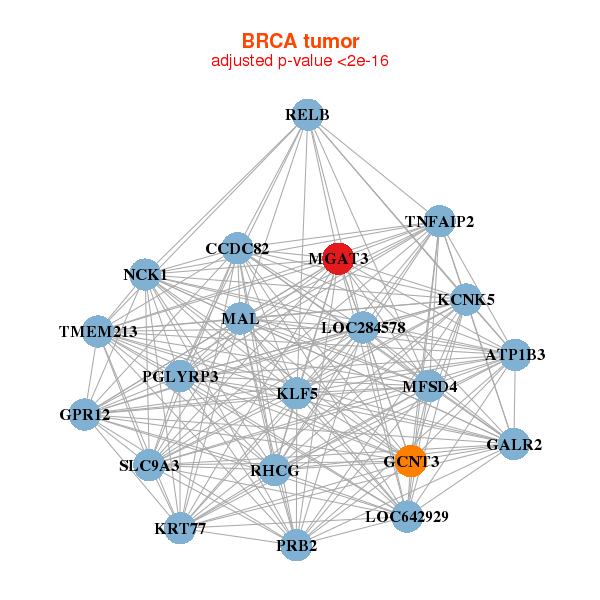
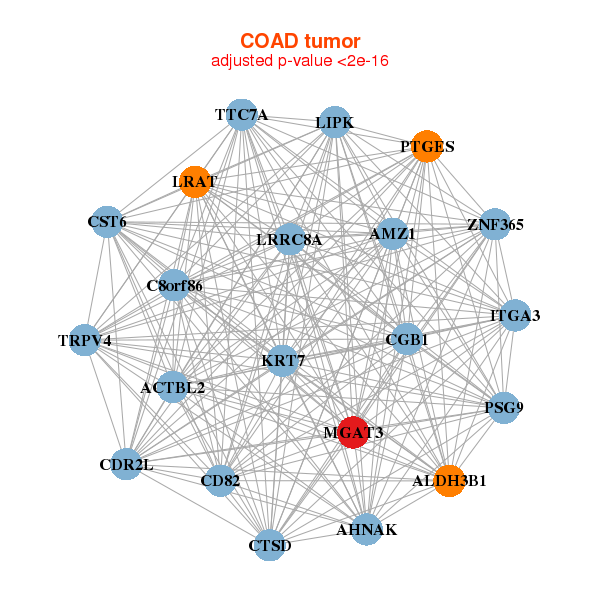
| * Co-Expression network figures were drawn using R package igraph. Only the top 20 genes with the highest correlations were shown. Red circle: input gene, orange circle: cell metabolism gene, sky circle: other gene |
: Open all plots for all cancer types
 |
|
| ATP1B3,CCDC82,GALR2,GCNT3,GPR12,KCNK5,KLF5, KRT77,LOC284578,LOC642929,MAL,MFSD4,MGAT3,NCK1, PGLYRP3,PRB2,RELB,RHCG,SLC9A3,TMEM213,TNFAIP2 | ANKS6,AP1M1,APOL3,BEST1,SYNE3,C1QTNF1,CYP26B1, DTX1,GPBAR1,MGAT3,NADK,PALM,PTRF,SLC35C1, SMAD6,ST6GALNAC6,TFE3,TMBIM1,TMEM140,TNIP1,ZDHHC18 |
 |
|
| ACTBL2,AHNAK,ALDH3B1,AMZ1,C8orf86,CD82,CDR2L, CGB1,CST6,CTSD,ITGA3,KRT7,LIPK,LRAT, LRRC8A,MGAT3,PSG9,PTGES,TRPV4,TTC7A,ZNF365 | AQP3,TMEM74B,CCDC108,CD82,CRIP1,DNASE1,EMB, GALNT6,GRAMD1B,KDM8,KCNH6,MGAT3,MLXIPL,MST1, PFKFB4,PLB1,PNLIPRP2,SI,SLC28A2,TIGD3,ZNF488 |
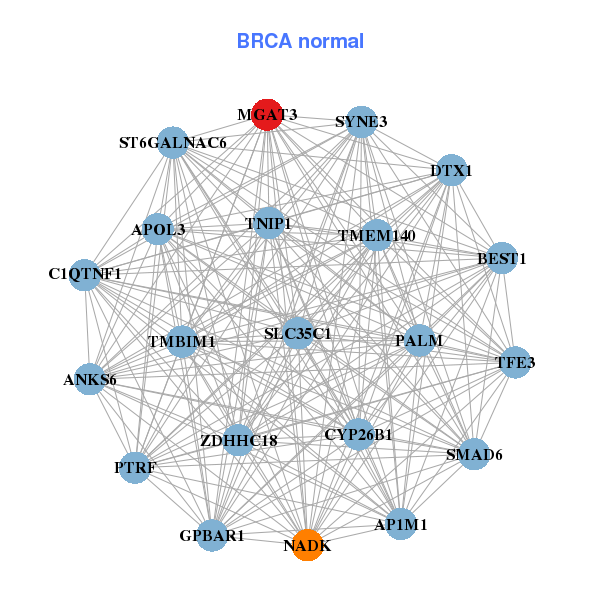
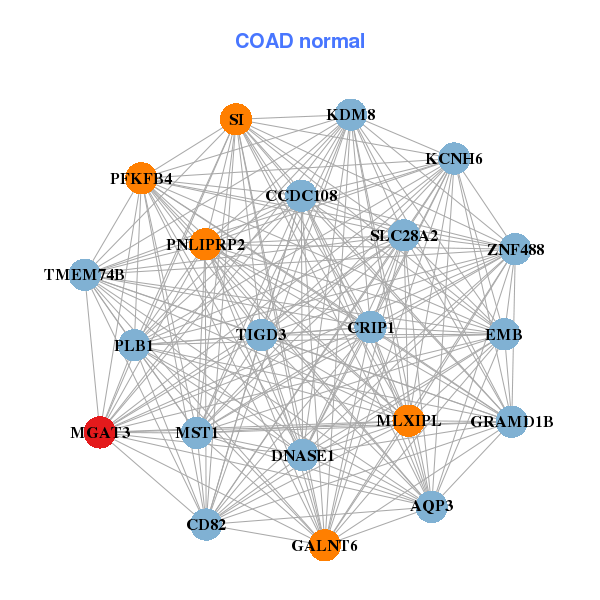
| * Co-Expression network figures were drawn using R package igraph. Only the top 20 genes with the highest correlations were shown. Red circle: input gene, orange circle: cell metabolism gene, sky circle: other gene |
: Open all plots for all cancer types
| Top |
: Open all interacting genes' information including KEGG pathway for all interacting genes from DAVID
| Top |
| Pharmacological Information for MGAT3 |
| There's no related Drug. |
| Top |
| Cross referenced IDs for MGAT3 |
| * We obtained these cross-references from Uniprot database. It covers 150 different DBs, 18 categories. http://www.uniprot.org/help/cross_references_section |
: Open all cross reference information
|
Copyright © 2016-Present - The Univsersity of Texas Health Science Center at Houston @ |