|
||||||||||||||||||||||||||||||||||||||||||||||||||||||||||||||||||||||||||||||||||||||||||||||||||||||||||||||||||||||||||||||||||||||||||||||||||||||||||||||||||||||||||||||||||||||||||||||||||||||||||||||||||||||||||||||||||||||||||||||||||||||||||||||||||||||||||||||||||||||||||||||||||||||||||||||||||||||||||
| |
| Phenotypic Information (metabolism pathway, cancer, disease, phenome) |
| |
| |
| Gene-Gene Network Information: Co-Expression Network, Interacting Genes & KEGG |
| |
|


| Gene Summary for MGAT5 |
| Basic gene info. | Gene symbol | MGAT5 |
| Gene name | mannosyl (alpha-1,6-)-glycoprotein beta-1,6-N-acetyl-glucosaminyltransferase | |
| Synonyms | GNT-V|GNT-VA | |
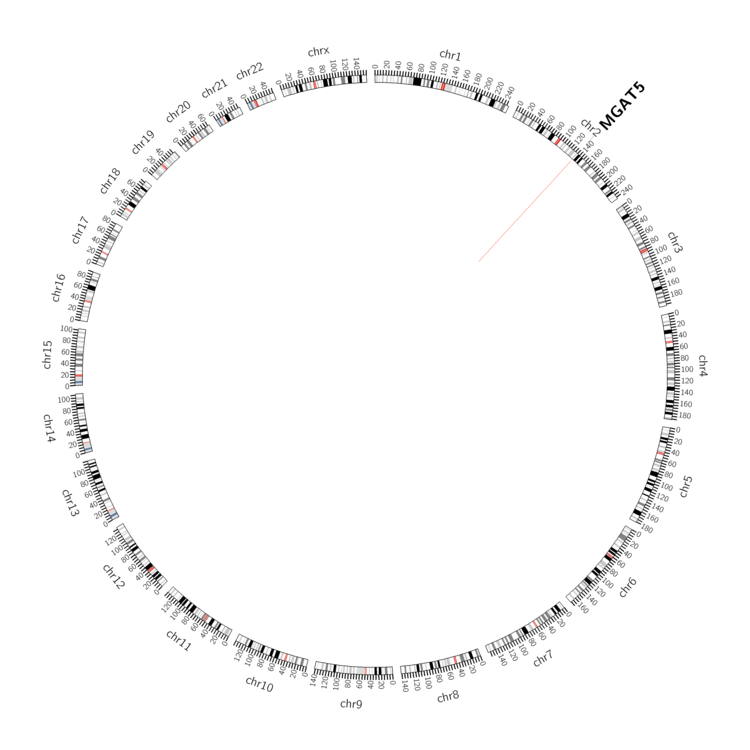
| Cytomap | UCSC genome browser: 2q21.3 | |
| Genomic location | chr2 :135011829-135212192 | |
| Type of gene | protein-coding | |
| RefGenes | NM_002410.4, | |
| Ensembl id | ENSG00000152127 | |
| Description | N-acetylglucosaminyl-transferase Valpha-1,6-mannosylglycoprotein 6-beta-N-acetylglucosaminyltransferase Aalpha-mannoside beta-1,6-N-acetylglucosaminyltransferaseglcNAc-T Vmannoside acetylglucosaminyltransferase 5 | |
| Modification date | 20141222 | |
| dbXrefs | MIM : 601774 | |
| HGNC : HGNC | ||
| Ensembl : ENSG00000152127 | ||
| HPRD : 03467 | ||
| Vega : OTTHUMG00000131681 | ||
| Protein | UniProt: Q09328 go to UniProt's Cross Reference DB Table | |
| Expression | CleanEX: HS_MGAT5 | |
| BioGPS: 4249 | ||
| Gene Expression Atlas: ENSG00000152127 | ||
| The Human Protein Atlas: ENSG00000152127 | ||
| Pathway | NCI Pathway Interaction Database: MGAT5 | |
| KEGG: MGAT5 | ||
| REACTOME: MGAT5 | ||
| ConsensusPathDB | ||
| Pathway Commons: MGAT5 | ||
| Metabolism | MetaCyc: MGAT5 | |
| HUMANCyc: MGAT5 | ||
| Regulation | Ensembl's Regulation: ENSG00000152127 | |
| miRBase: chr2 :135,011,829-135,212,192 | ||
| TargetScan: NM_002410 | ||
| cisRED: ENSG00000152127 | ||
| Context | iHOP: MGAT5 | |
| cancer metabolism search in PubMed: MGAT5 | ||
| UCL Cancer Institute: MGAT5 | ||
| Assigned class in ccmGDB | A - This gene has a literature evidence and it belongs to cancer gene. | |
| References showing role of MGAT5 in cancer cell metabolism | 1. Lau KS, Dennis JW (2008) N-Glycans in cancer progression. Glycobiology 18: 750-760. go to article | |
| Top |
| Phenotypic Information for MGAT5(metabolism pathway, cancer, disease, phenome) |
| Cancer | CGAP: MGAT5 |
| Familial Cancer Database: MGAT5 | |
| * This gene is included in those cancer gene databases. |
|
|
|
|
|
| . | ||||||||||||||||||||||||||||||||||||||||||||||||||||||||||||||||||||||||||||||||||||||||||||||||||||||||||||||||||||||||||||||||||||||||||||||||||||||||||||||||||||||||||||||||||||||||||||||||||||||||||||||||||||||||||||||||||||||||||||||||||||||||||||||||||||||||||||||||||||||||||||||||||||||||||||||||||||
Oncogene 1 | Significant driver gene in | |||||||||||||||||||||||||||||||||||||||||||||||||||||||||||||||||||||||||||||||||||||||||||||||||||||||||||||||||||||||||||||||||||||||||||||||||||||||||||||||||||||||||||||||||||||||||||||||||||||||||||||||||||||||||||||||||||||||||||||||||||||||||||||||||||||||||||||||||||||||||||||||||||||||||||||||||||||||||
| cf) number; DB name 1 Oncogene; http://nar.oxfordjournals.org/content/35/suppl_1/D721.long, 2 Tumor Suppressor gene; https://bioinfo.uth.edu/TSGene/, 3 Cancer Gene Census; http://www.nature.com/nrc/journal/v4/n3/abs/nrc1299.html, 4 CancerGenes; http://nar.oxfordjournals.org/content/35/suppl_1/D721.long, 5 Network of Cancer Gene; http://ncg.kcl.ac.uk/index.php, 1Therapeutic Vulnerabilities in Cancer; http://cbio.mskcc.org/cancergenomics/statius/ |
| REACTOME_METABOLISM_OF_PROTEINS | |
| OMIM | 601774; gene. |
| Orphanet | |
| Disease | KEGG Disease: MGAT5 |
| MedGen: MGAT5 (Human Medical Genetics with Condition) | |
| ClinVar: MGAT5 | |
| Phenotype | MGI: MGAT5 (International Mouse Phenotyping Consortium) |
| PhenomicDB: MGAT5 | |
| Mutations for MGAT5 |
| * Under tables are showing count per each tissue to give us broad intuition about tissue specific mutation patterns.You can go to the detailed page for each mutation database's web site. |
| - Statistics for Tissue and Mutation type | Top |
 |
| - For Inter-chromosomal Variations |
| There's no inter-chromosomal structural variation. |
| - For Intra-chromosomal Variations |
| * Intra-chromosomal variantions includes 'intrachromosomal amplicon to amplicon', 'intrachromosomal amplicon to non-amplified dna', 'intrachromosomal deletion', 'intrachromosomal fold-back inversion', 'intrachromosomal inversion', 'intrachromosomal tandem duplication', 'Intrachromosomal unknown type', 'intrachromosomal with inverted orientation', 'intrachromosomal with non-inverted orientation'. |
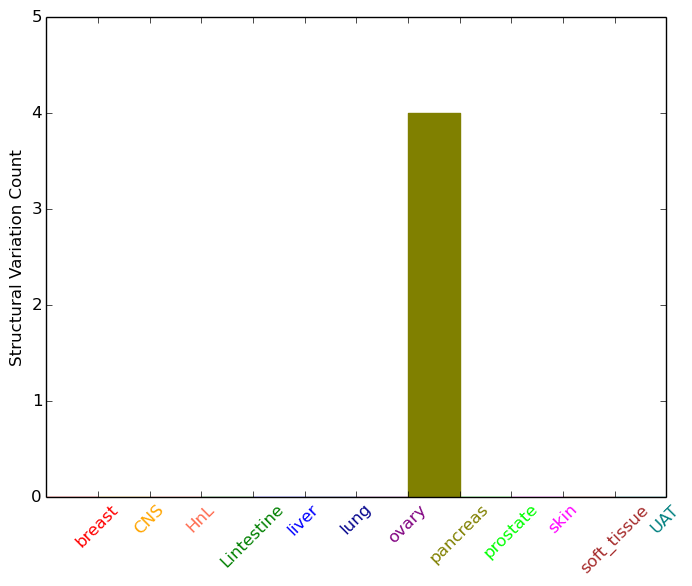 |
| Sample | Symbol_a | Chr_a | Start_a | End_a | Symbol_b | Chr_b | Start_b | End_b |
| pancreas | MGAT5 | chr2 | 135180259 | 135180279 | MGAT5 | chr2 | 135180871 | 135180891 |
| cf) Tissue number; Tissue name (1;Breast, 2;Central_nervous_system, 3;Haematopoietic_and_lymphoid_tissue, 4;Large_intestine, 5;Liver, 6;Lung, 7;Ovary, 8;Pancreas, 9;Prostate, 10;Skin, 11;Soft_tissue, 12;Upper_aerodigestive_tract) |
| * From mRNA Sanger sequences, Chitars2.0 arranged chimeric transcripts. This table shows MGAT5 related fusion information. |
| ID | Head Gene | Tail Gene | Accession | Gene_a | qStart_a | qEnd_a | Chromosome_a | tStart_a | tEnd_a | Gene_a | qStart_a | qEnd_a | Chromosome_a | tStart_a | tEnd_a |
| AI738610 | CENPH | 1 | 150 | 5 | 68506034 | 68506183 | MGAT5 | 150 | 416 | 2 | 135163960 | 135164226 | |
| AA249270 | MGAT5 | 1 | 141 | 2 | 135207519 | 135207659 | RUNX1T1 | 133 | 284 | 8 | 92971503 | 92971654 | |
| BX647087 | MGAT5 | 8 | 74 | 2 | 135207140 | 135207206 | MGAT5 | 71 | 5301 | 2 | 135206960 | 135212192 | |
| M86029 | MGAT5 | 1 | 159 | 2 | 135157585 | 135157743 | MRPL14 | 160 | 338 | 6 | 44081431 | 44081609 | |
| AF088006 | TUG1 | 1 | 625 | 22 | 31371556 | 31372180 | MGAT5 | 617 | 637 | 2 | 135156085 | 135156105 | |
| BF802193 | MGAT5 | 1 | 135 | 2 | 135208384 | 135208519 | KIF1B | 127 | 437 | 1 | 10436676 | 10436988 | |
| Top |
| Mutation type/ Tissue ID | brca | cns | cerv | endome | haematopo | kidn | Lintest | liver | lung | ns | ovary | pancre | prost | skin | stoma | thyro | urina | |||
| Total # sample | 1 | 1 | 1 | 1 | 1 | 2 | 1 | 1 | 1 | |||||||||||
| GAIN (# sample) | 1 | 1 | 1 | 1 | 1 | 1 | 1 | |||||||||||||
| LOSS (# sample) | 1 | 1 | 1 |
| cf) Tissue ID; Tissue type (1; Breast, 2; Central_nervous_system, 3; Cervix, 4; Endometrium, 5; Haematopoietic_and_lymphoid_tissue, 6; Kidney, 7; Large_intestine, 8; Liver, 9; Lung, 10; NS, 11; Ovary, 12; Pancreas, 13; Prostate, 14; Skin, 15; Stomach, 16; Thyroid, 17; Urinary_tract) |
| Top |
|
 |
| Top |
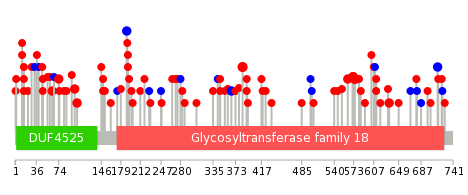
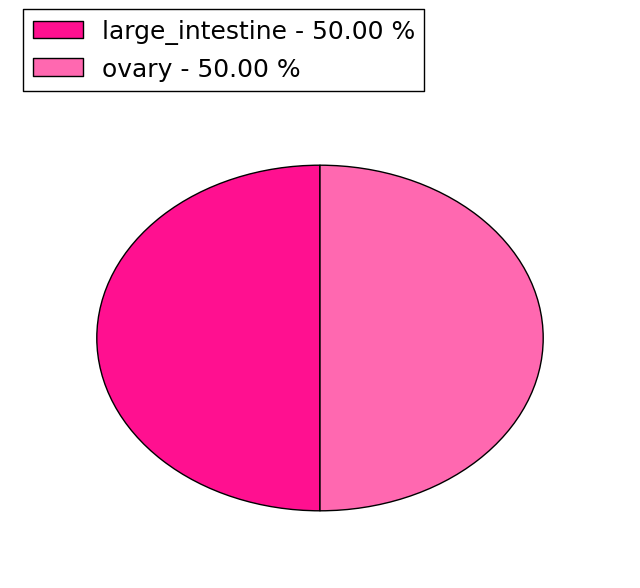
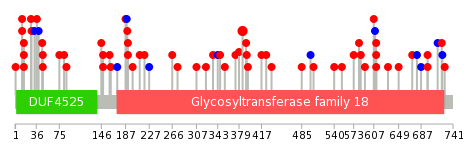
| Stat. for Non-Synonymous SNVs (# total SNVs=79) | (# total SNVs=13) |
 | 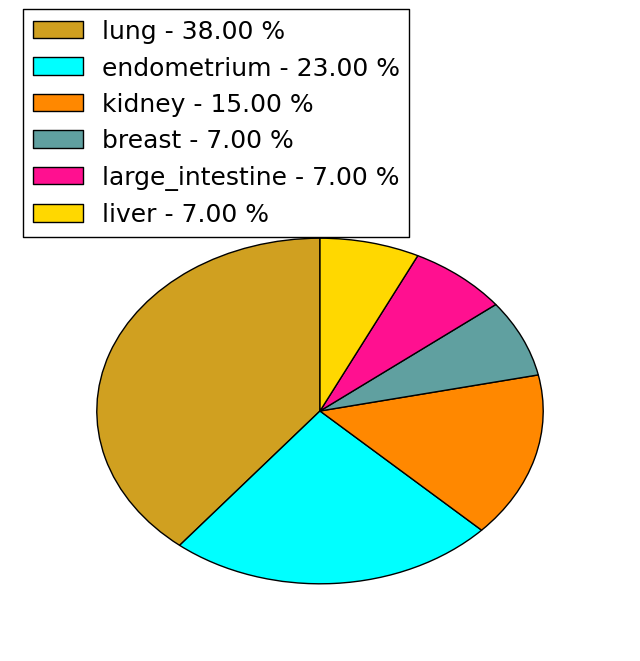 |
(# total SNVs=2) | (# total SNVs=0) |
 |
| Top |
| * When you move the cursor on each content, you can see more deailed mutation information on the Tooltip. Those are primary_site,primary_histology,mutation(aa),pubmedID. |
| GRCh37 position | Mutation(aa) | Unique sampleID count |
| chr2:135180419-135180419 | p.H575Y | 3 |
| chr2:135107416-135107416 | p.E385K | 3 |
| chr2:135028123-135028123 | p.? | 2 |
| chr2:135012161-135012161 | p.E63K | 2 |
| chr2:135012194-135012194 | p.A74T | 2 |
| chr2:135102621-135102621 | p.S366S | 2 |
| chr2:135180384-135180384 | p.Q563R | 2 |
| chr2:135206337-135206337 | p.G715G | 2 |
| chr2:135199357-135199357 | p.P633Q | 2 |
| chr2:135012008-135012008 | p.Q12* | 2 |
| Top |
|
 |
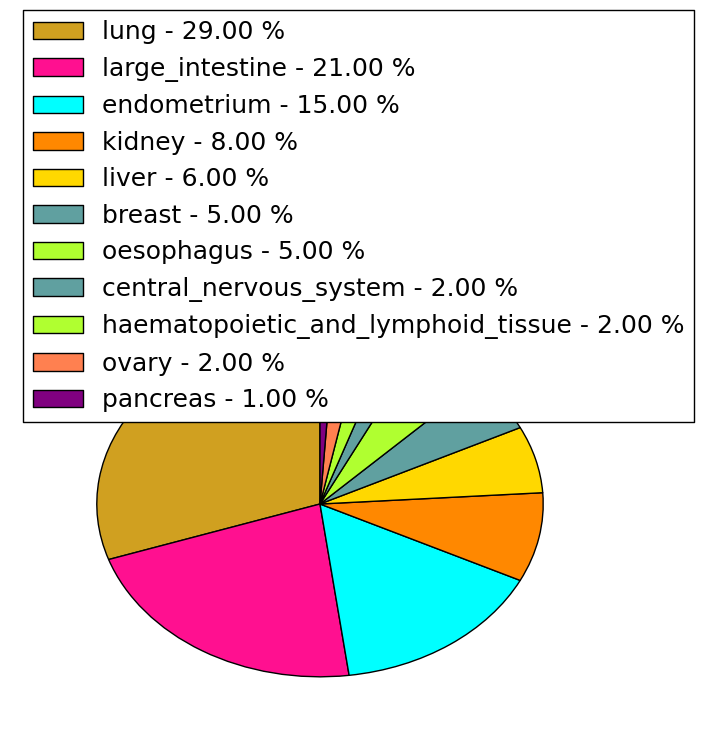
| Point Mutation/ Tissue ID | 1 | 2 | 3 | 4 | 5 | 6 | 7 | 8 | 9 | 10 | 11 | 12 | 13 | 14 | 15 | 16 | 17 | 18 | 19 | 20 |
| # sample | 1 | 3 | 13 | 1 | 1 | 5 | 1 | 11 | 5 | 1 | 6 | 9 | 10 | |||||||
| # mutation | 1 | 3 | 13 | 1 | 1 | 5 | 1 | 11 | 7 | 1 | 6 | 11 | 13 | |||||||
| nonsynonymous SNV | 1 | 2 | 12 | 1 | 1 | 3 | 1 | 9 | 6 | 1 | 5 | 9 | 10 | |||||||
| synonymous SNV | 1 | 1 | 2 | 2 | 1 | 1 | 2 | 3 |
| cf) Tissue ID; Tissue type (1; BLCA[Bladder Urothelial Carcinoma], 2; BRCA[Breast invasive carcinoma], 3; CESC[Cervical squamous cell carcinoma and endocervical adenocarcinoma], 4; COAD[Colon adenocarcinoma], 5; GBM[Glioblastoma multiforme], 6; Glioma Low Grade, 7; HNSC[Head and Neck squamous cell carcinoma], 8; KICH[Kidney Chromophobe], 9; KIRC[Kidney renal clear cell carcinoma], 10; KIRP[Kidney renal papillary cell carcinoma], 11; LAML[Acute Myeloid Leukemia], 12; LUAD[Lung adenocarcinoma], 13; LUSC[Lung squamous cell carcinoma], 14; OV[Ovarian serous cystadenocarcinoma ], 15; PAAD[Pancreatic adenocarcinoma], 16; PRAD[Prostate adenocarcinoma], 17; SKCM[Skin Cutaneous Melanoma], 18:STAD[Stomach adenocarcinoma], 19:THCA[Thyroid carcinoma], 20:UCEC[Uterine Corpus Endometrial Carcinoma]) |
| Top |
| * We represented just top 10 SNVs. When you move the cursor on each content, you can see more deailed mutation information on the Tooltip. Those are primary_site, primary_histology, mutation(aa), pubmedID. |
| Genomic Position | Mutation(aa) | Unique sampleID count |
| chr2:135107416 | p.E385K | 3 |
| chr2:135012017 | p.G15S | 2 |
| chr2:135185960 | p.Y173Y | 1 |
| chr2:135076308 | p.E347Q | 1 |
| chr2:135102552 | p.R573W | 1 |
| chr2:135206337 | p.R722K | 1 |
| chr2:135012054 | p.M28I | 1 |
| chr2:135119899 | p.I187T | 1 |
| chr2:135027974 | p.G355R | 1 |
| chr2:135185968 | p.N582K | 1 |
| * Copy number data were extracted from TCGA using R package TCGA-Assembler. The URLs of all public data files on TCGA DCC data server were gathered on Jan-05-2015. Function ProcessCNAData in TCGA-Assembler package was used to obtain gene-level copy number value which is calculated as the average copy number of the genomic region of a gene. |
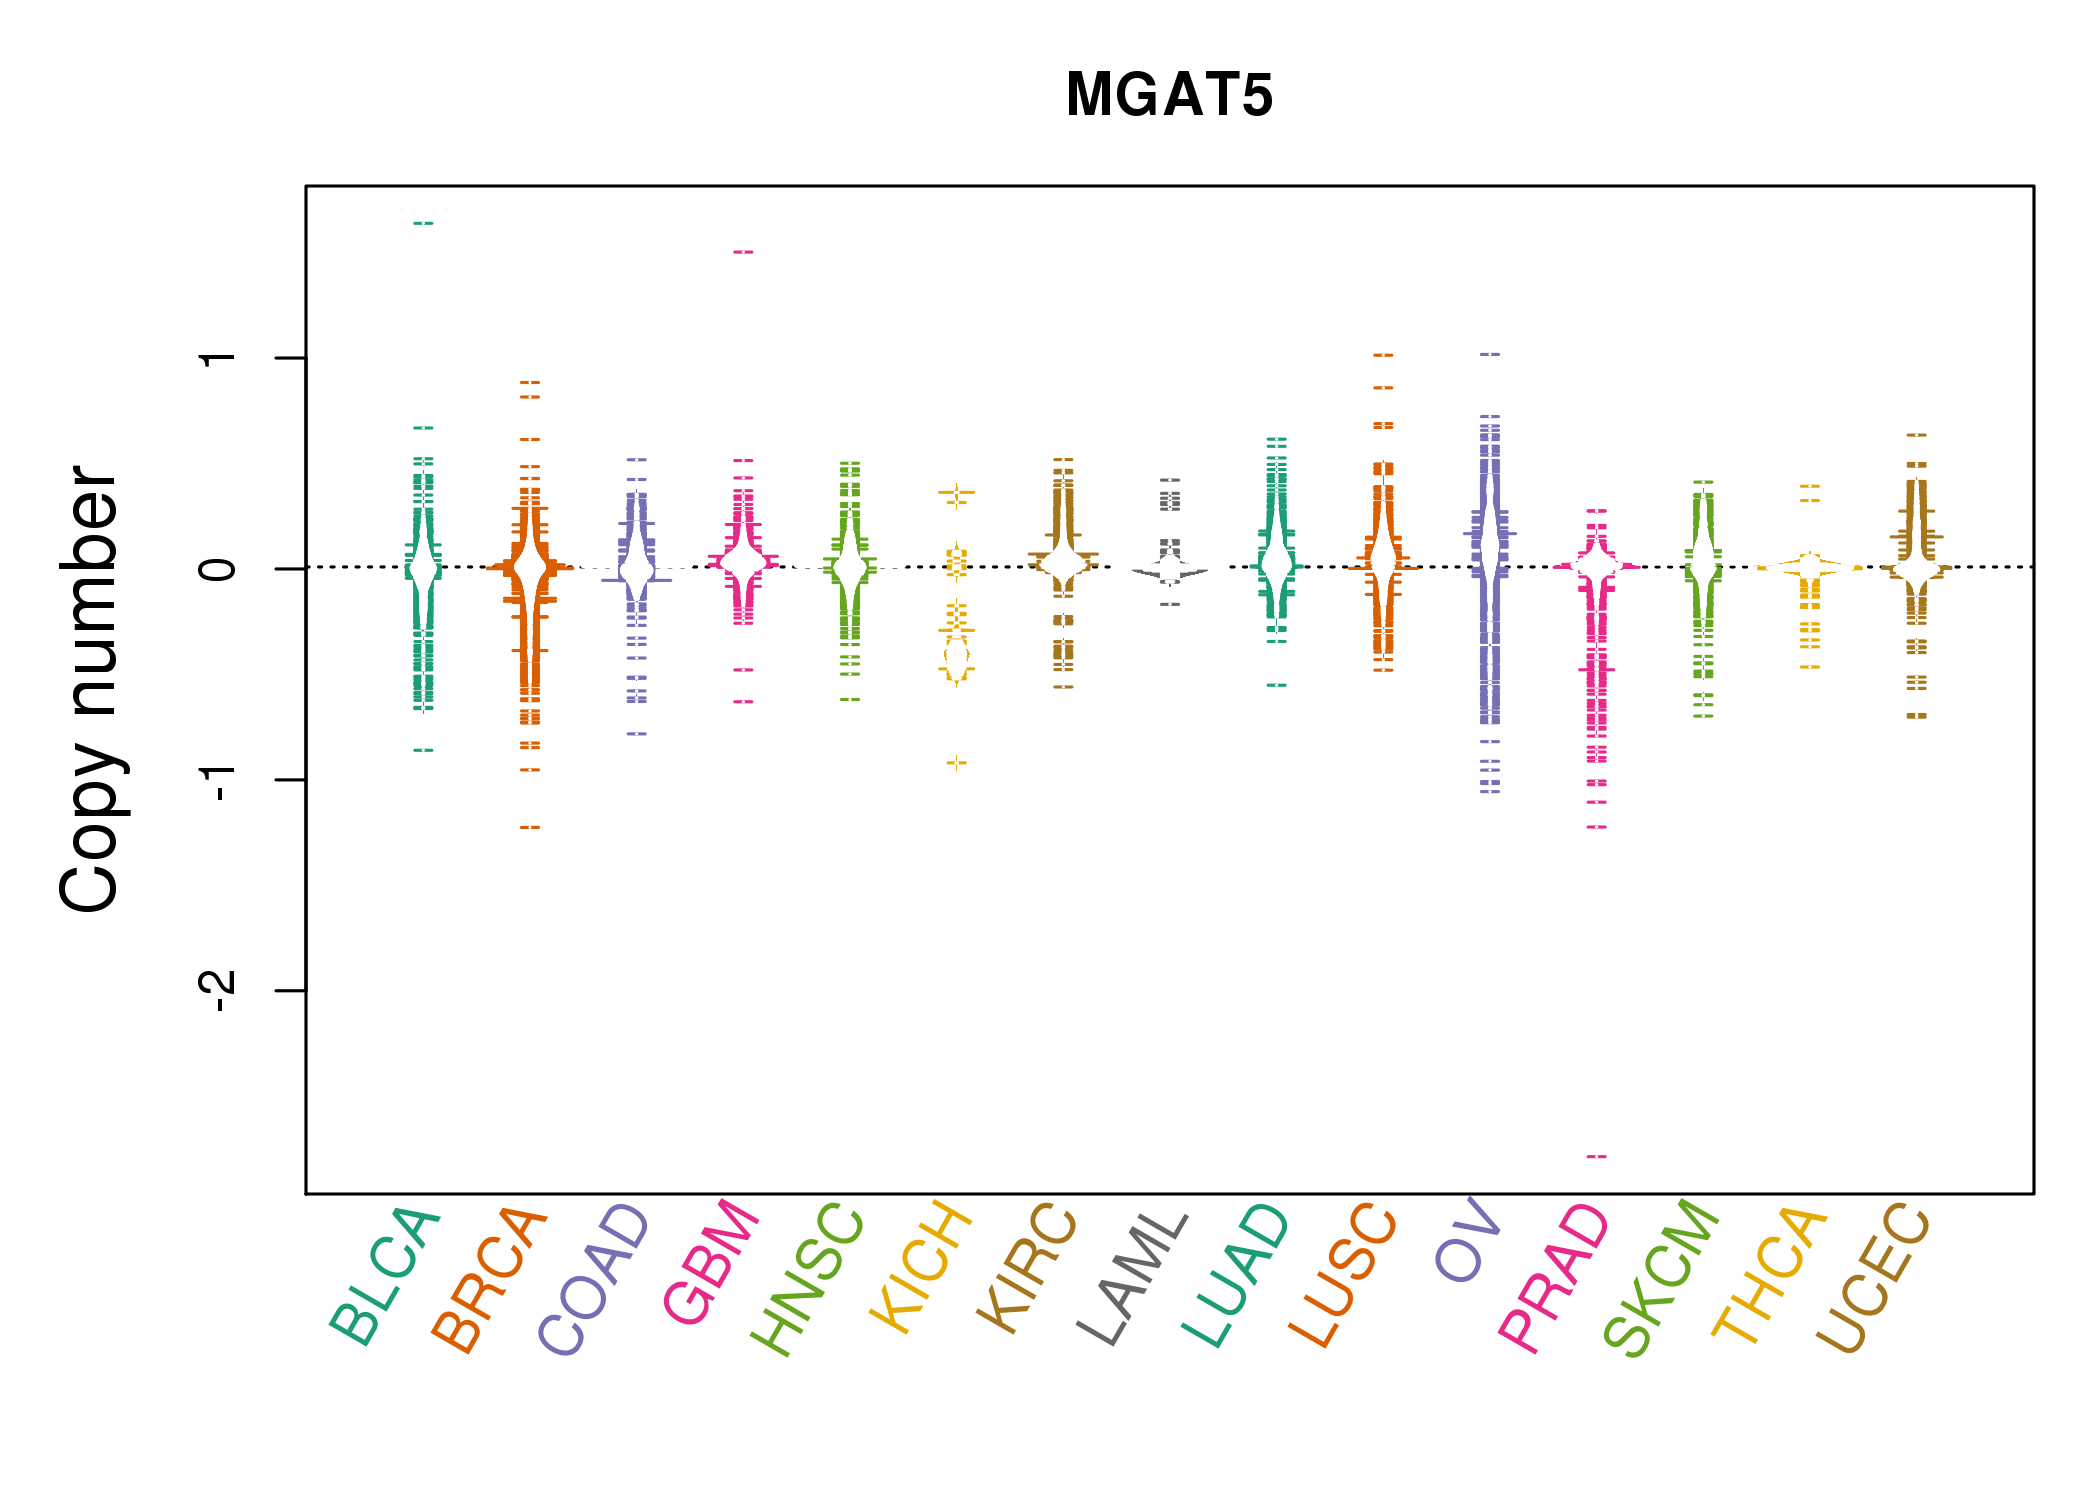 |
| cf) Tissue ID[Tissue type]: BLCA[Bladder Urothelial Carcinoma], BRCA[Breast invasive carcinoma], CESC[Cervical squamous cell carcinoma and endocervical adenocarcinoma], COAD[Colon adenocarcinoma], GBM[Glioblastoma multiforme], Glioma Low Grade, HNSC[Head and Neck squamous cell carcinoma], KICH[Kidney Chromophobe], KIRC[Kidney renal clear cell carcinoma], KIRP[Kidney renal papillary cell carcinoma], LAML[Acute Myeloid Leukemia], LUAD[Lung adenocarcinoma], LUSC[Lung squamous cell carcinoma], OV[Ovarian serous cystadenocarcinoma ], PAAD[Pancreatic adenocarcinoma], PRAD[Prostate adenocarcinoma], SKCM[Skin Cutaneous Melanoma], STAD[Stomach adenocarcinoma], THCA[Thyroid carcinoma], UCEC[Uterine Corpus Endometrial Carcinoma] |
| Top |
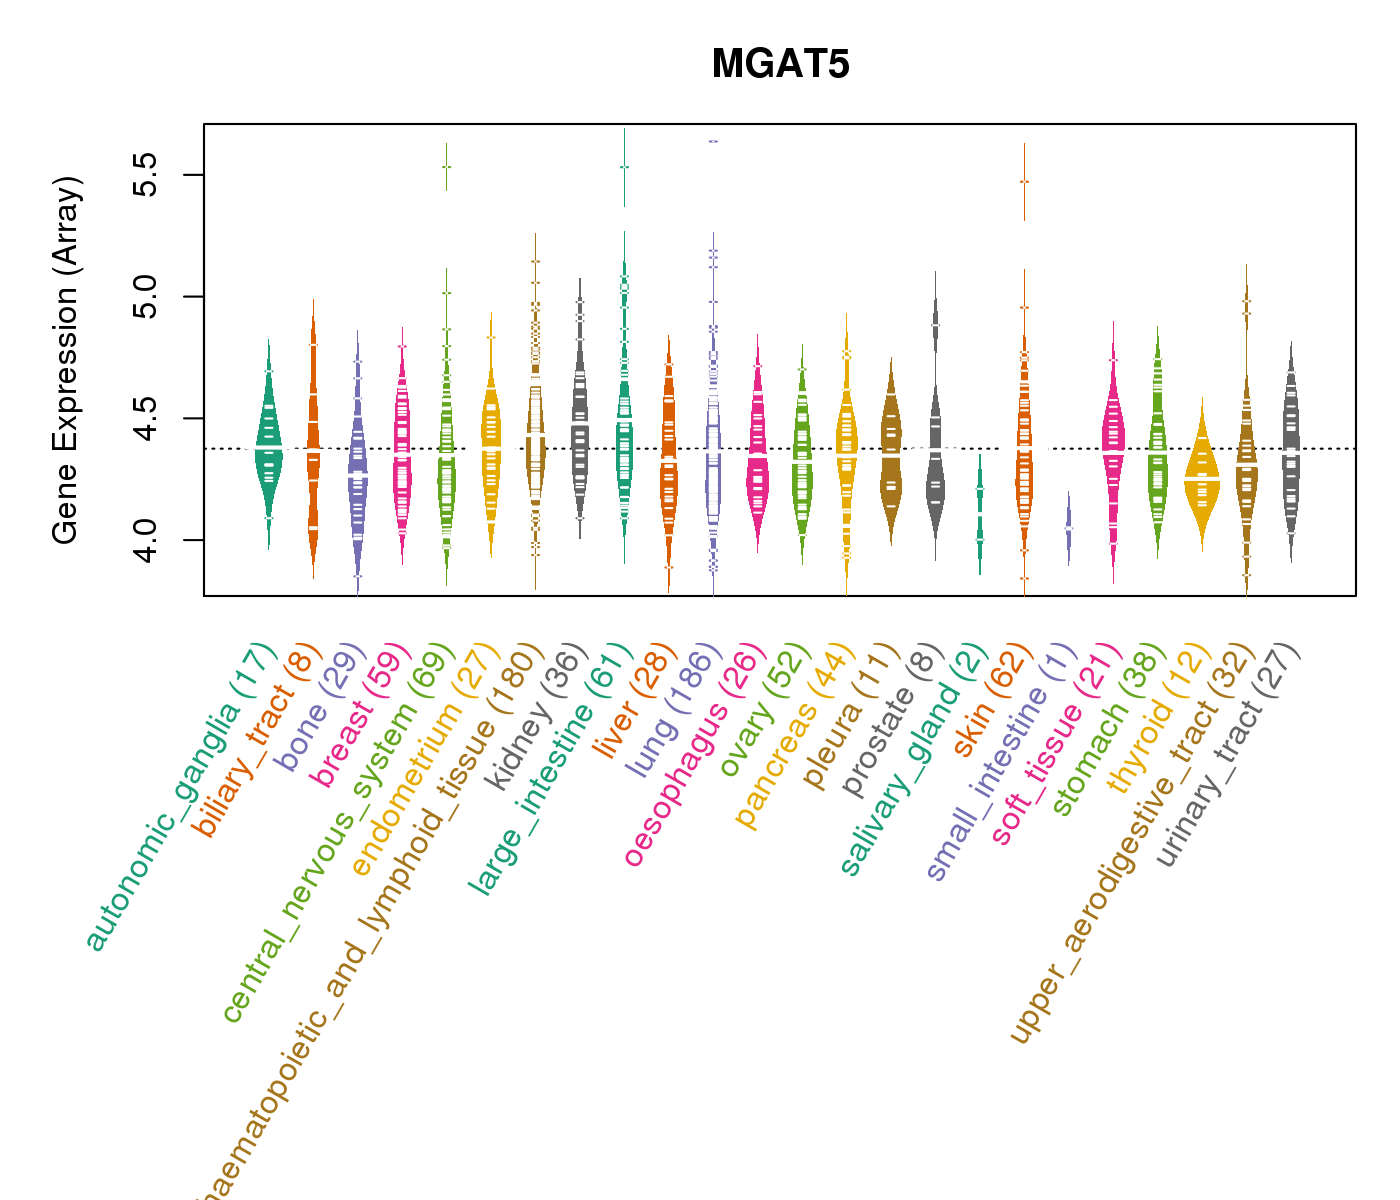
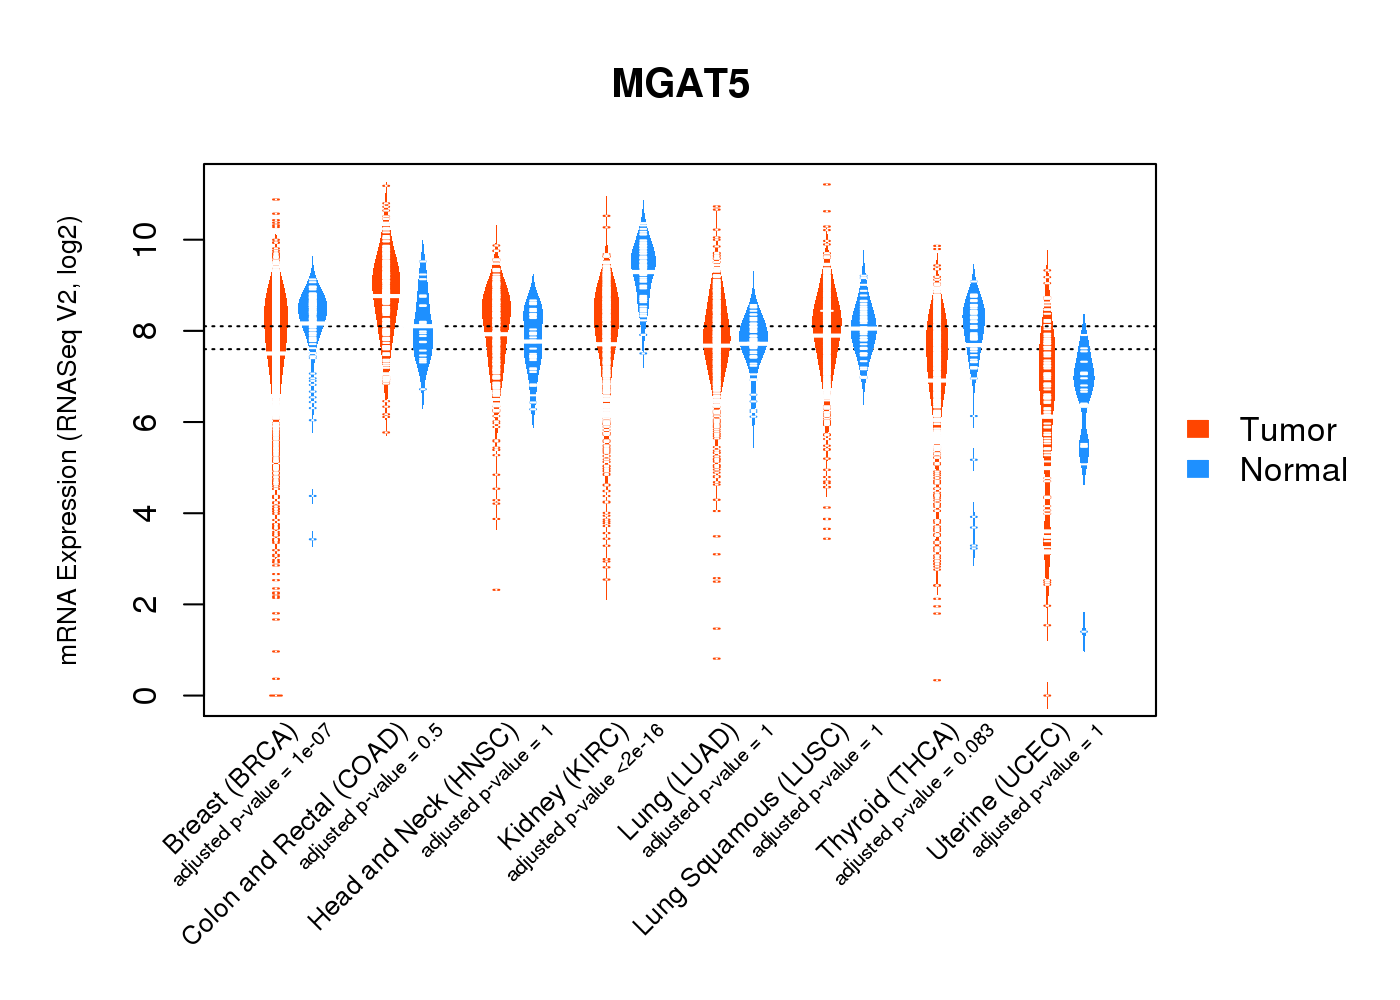
| Gene Expression for MGAT5 |
| * CCLE gene expression data were extracted from CCLE_Expression_Entrez_2012-10-18.res: Gene-centric RMA-normalized mRNA expression data. |
 |
| * Normalized gene expression data of RNASeqV2 was extracted from TCGA using R package TCGA-Assembler. The URLs of all public data files on TCGA DCC data server were gathered at Jan-05-2015. Only eight cancer types have enough normal control samples for differential expression analysis. (t test, adjusted p<0.05 (using Benjamini-Hochberg FDR)) |
 |
| Top |
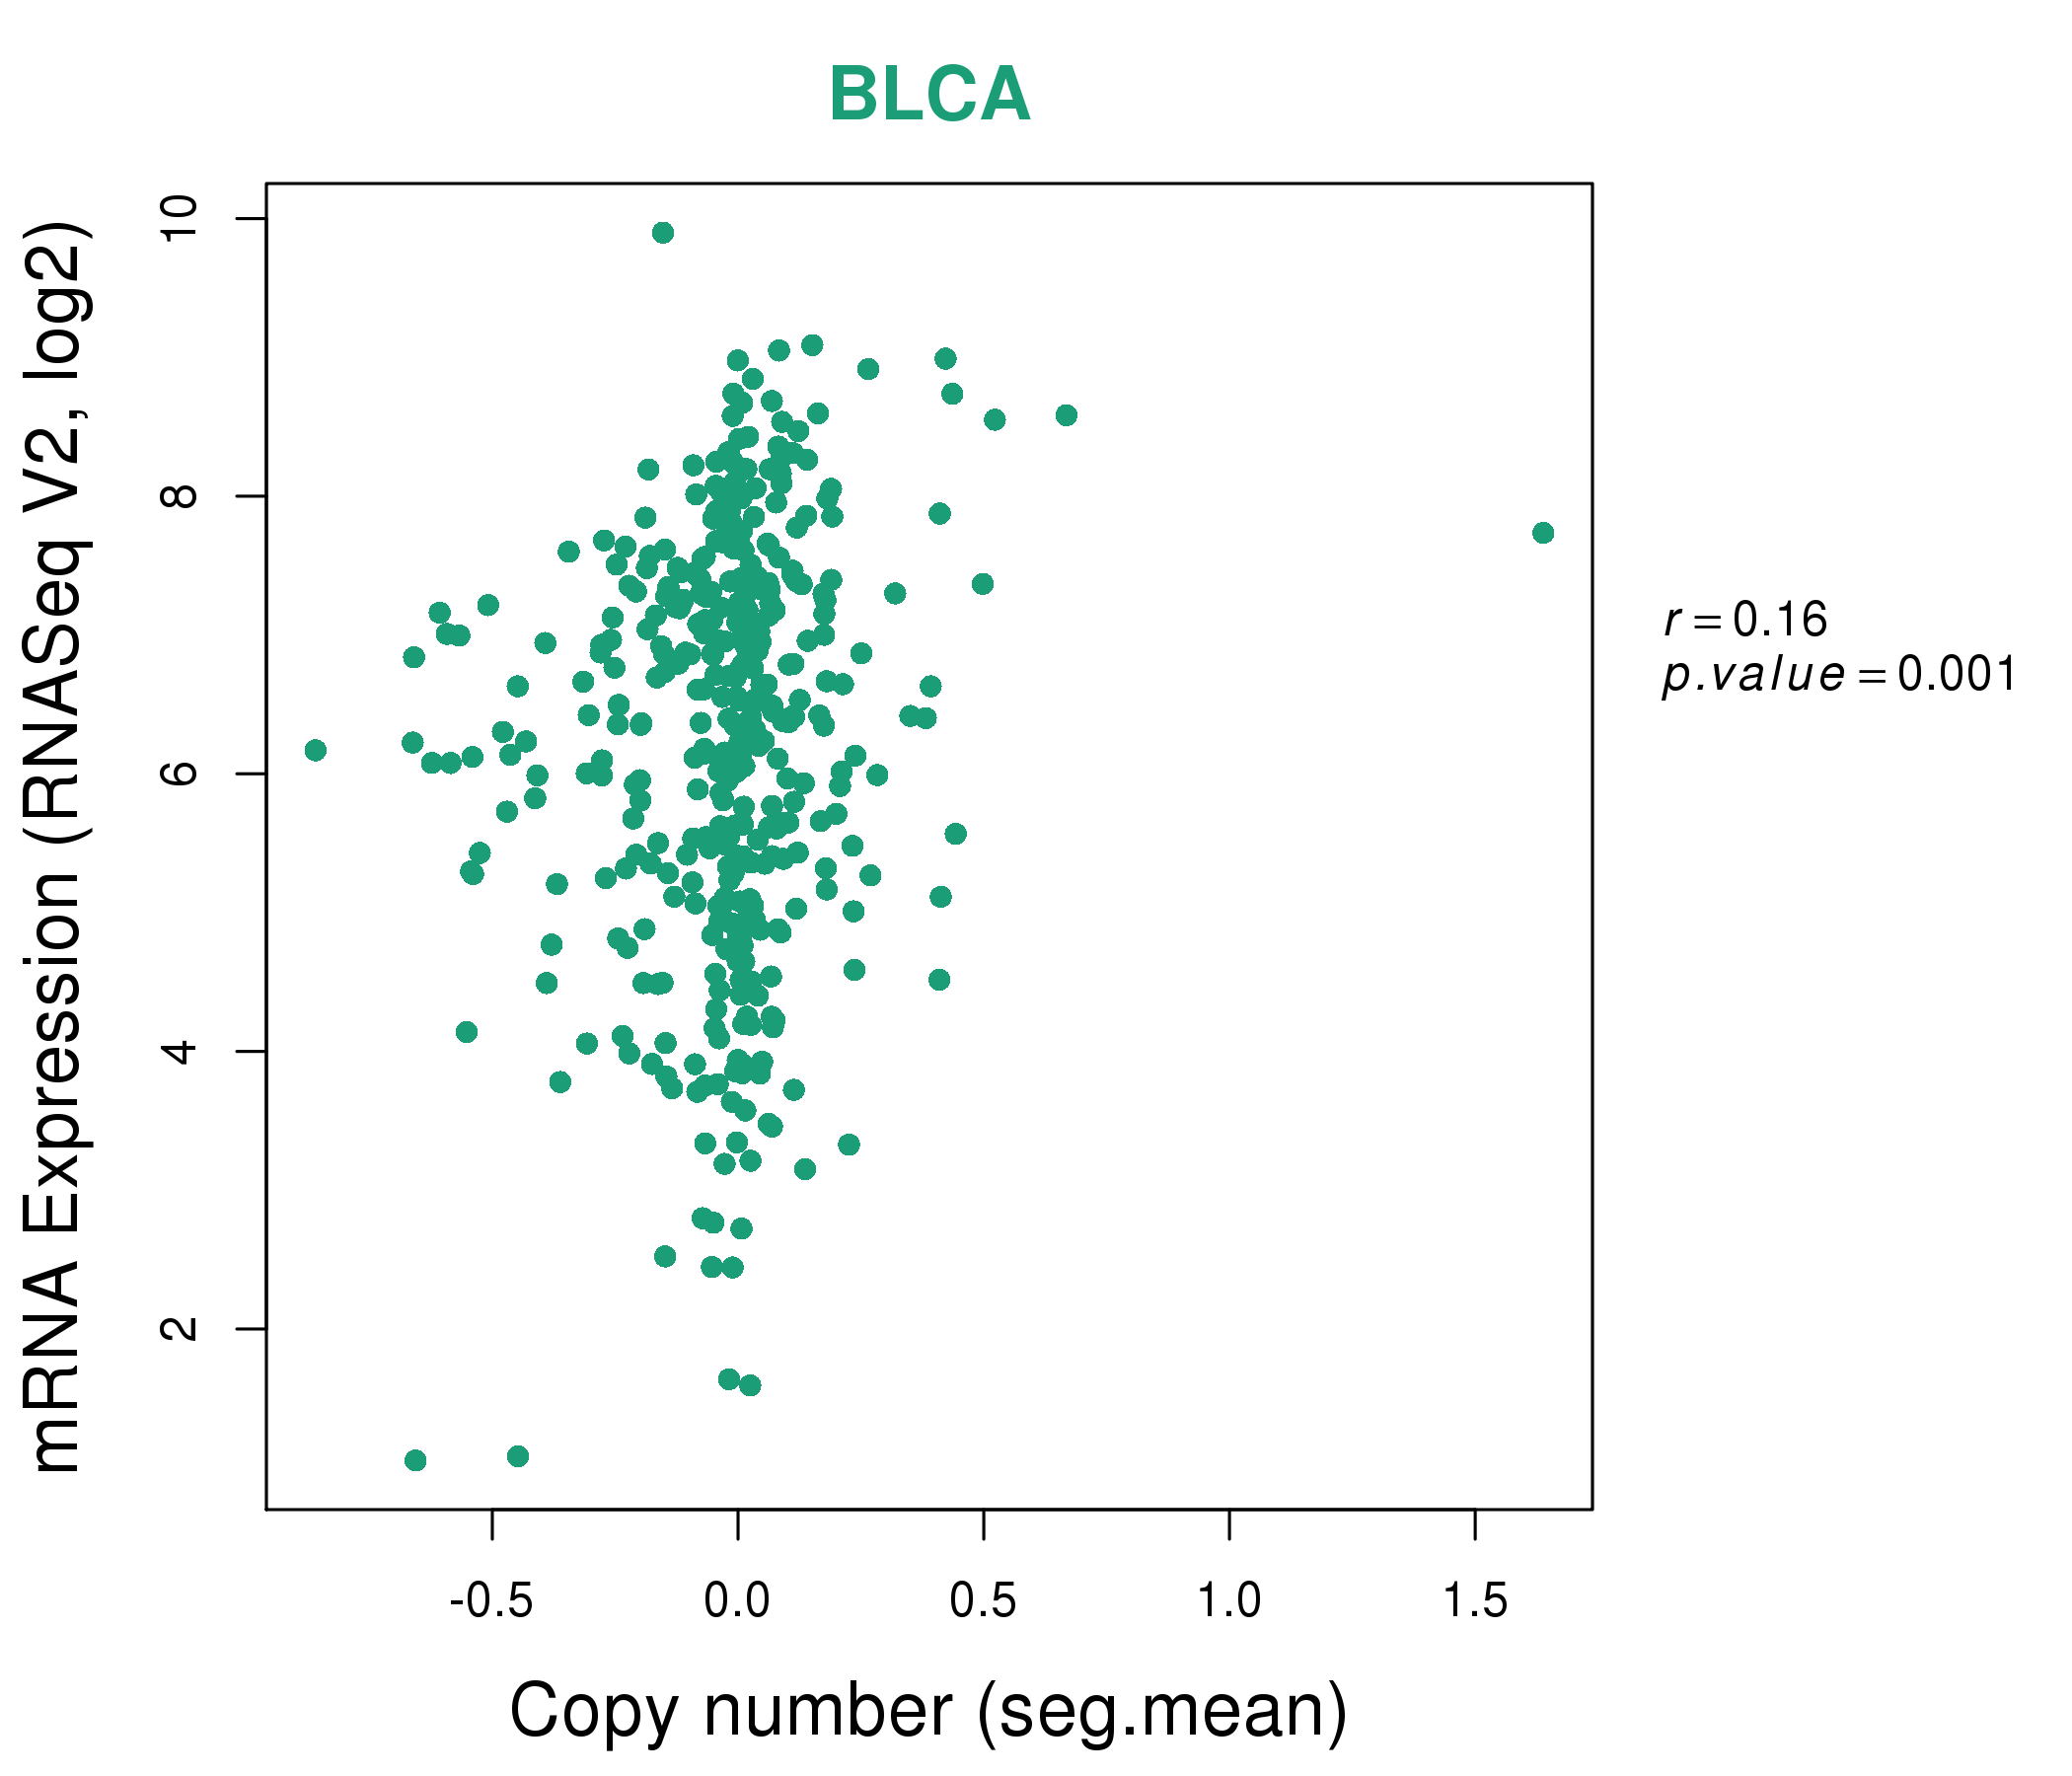
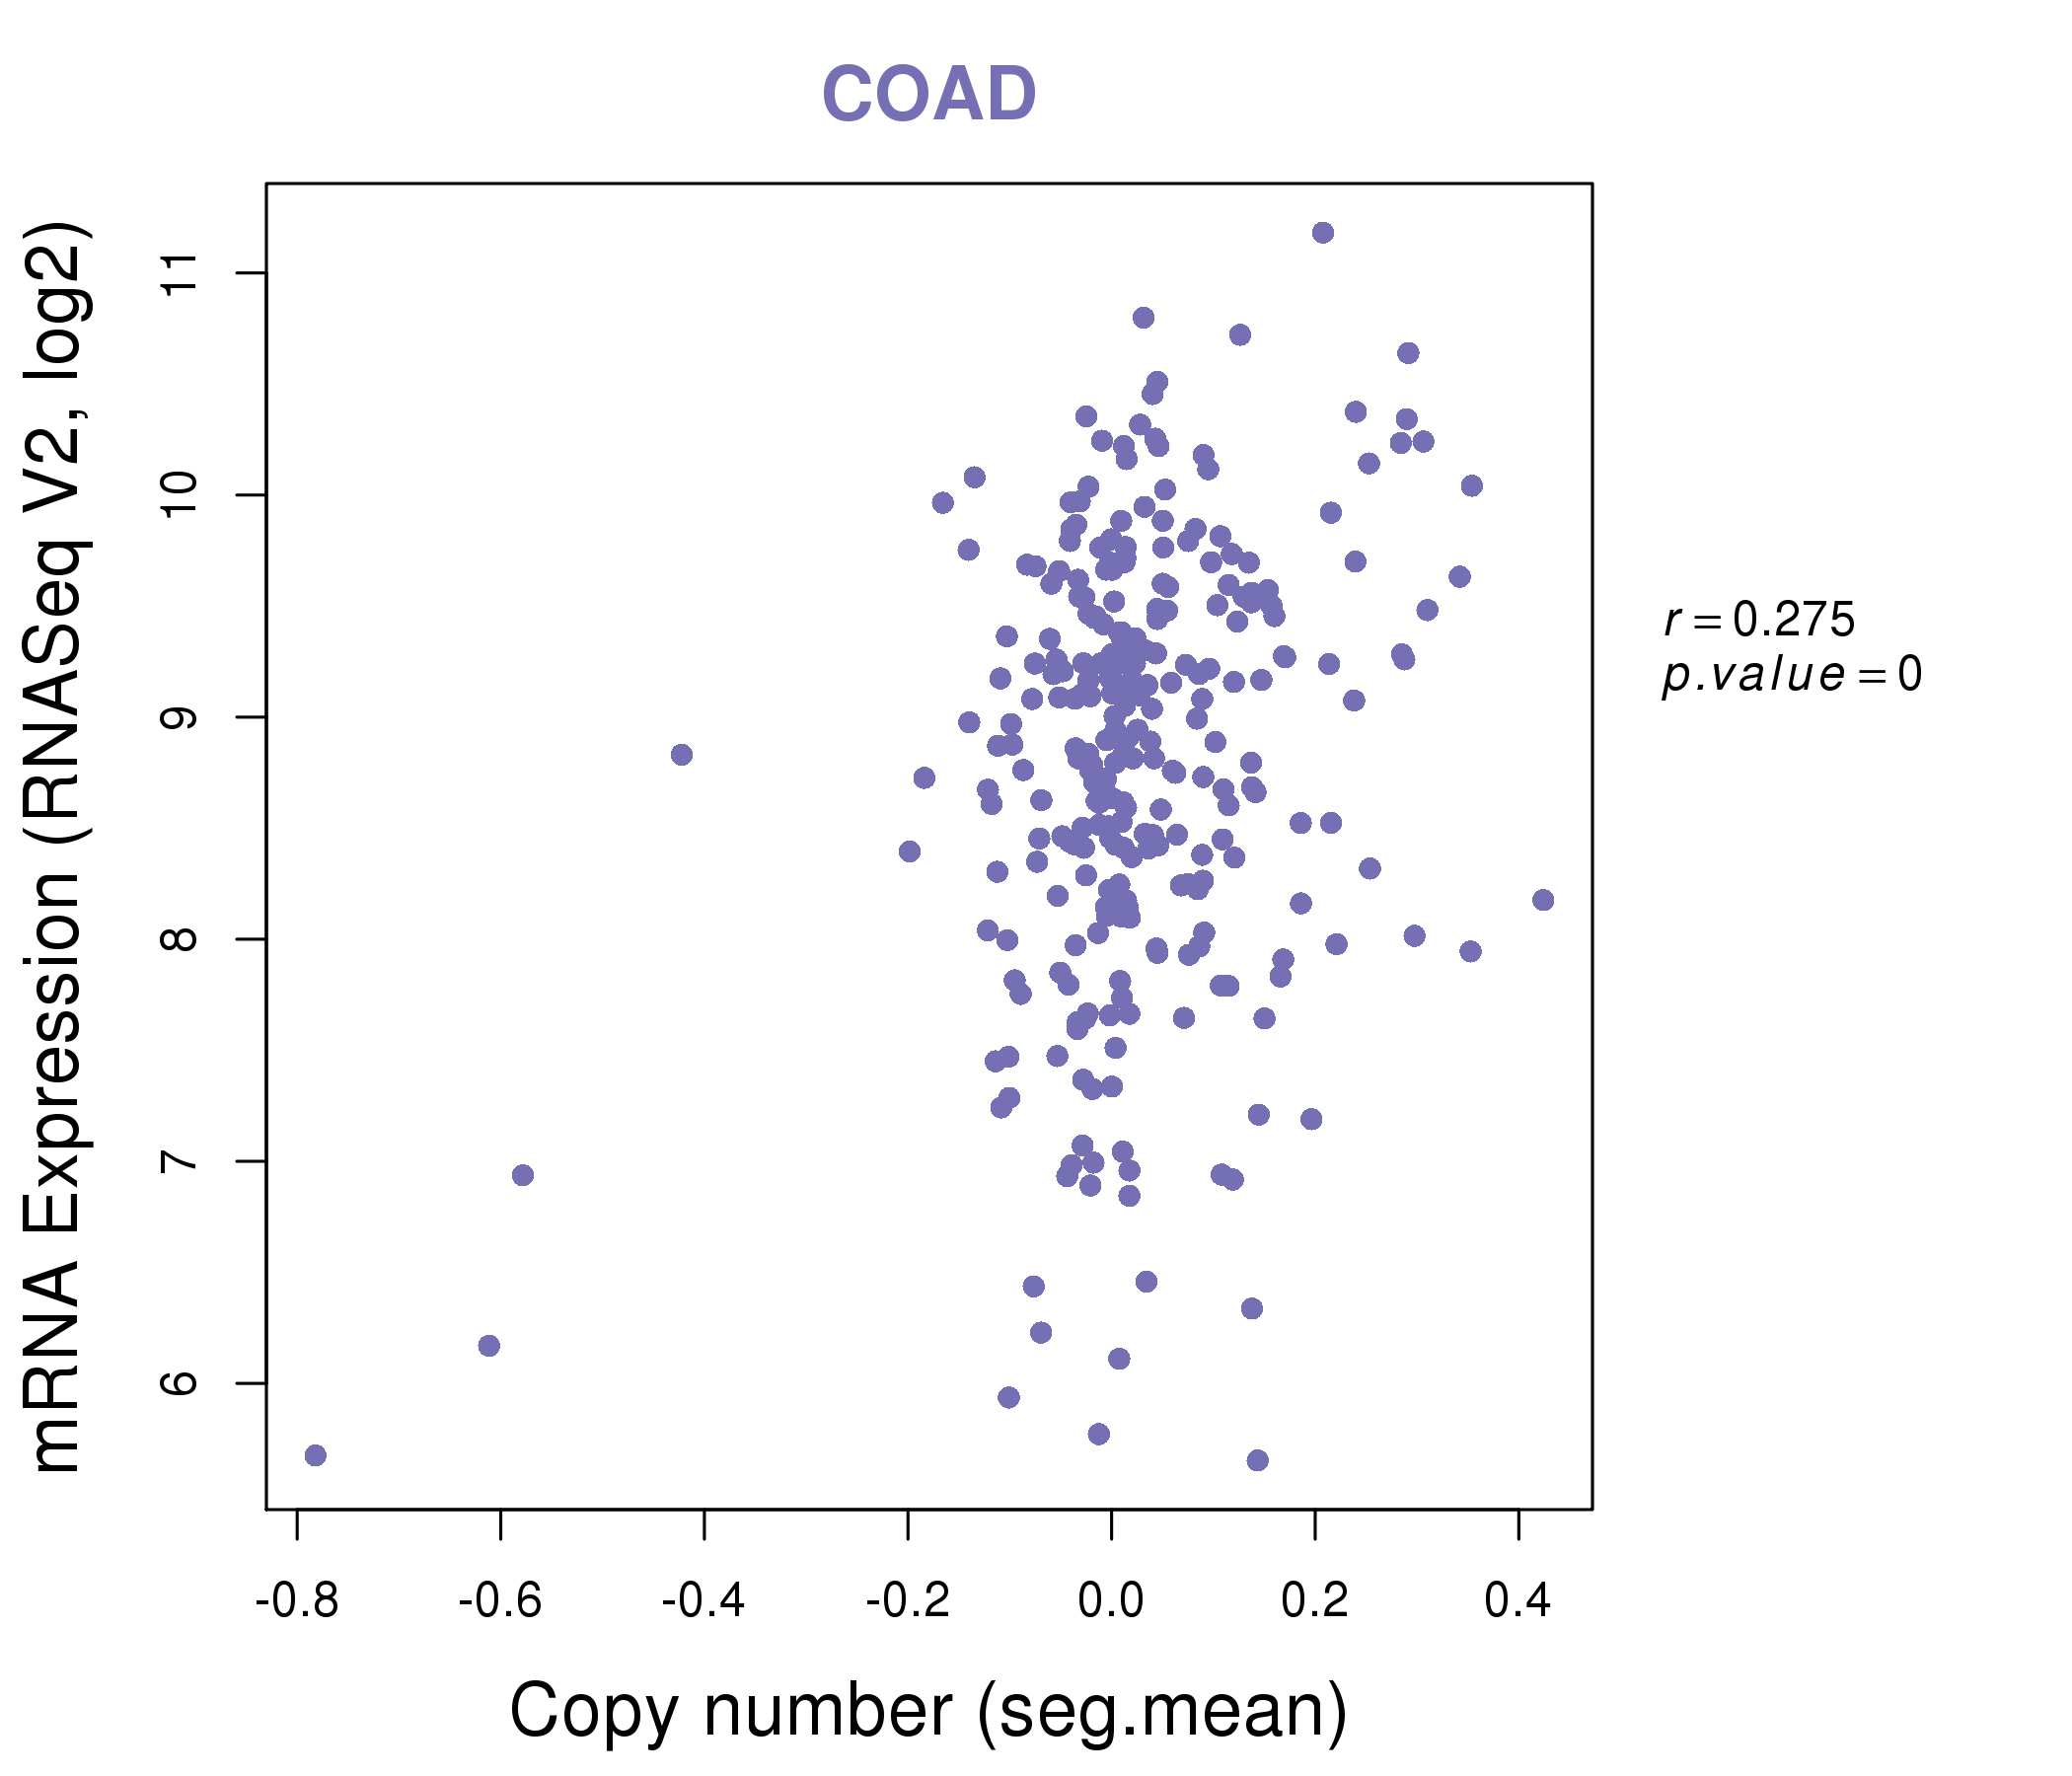
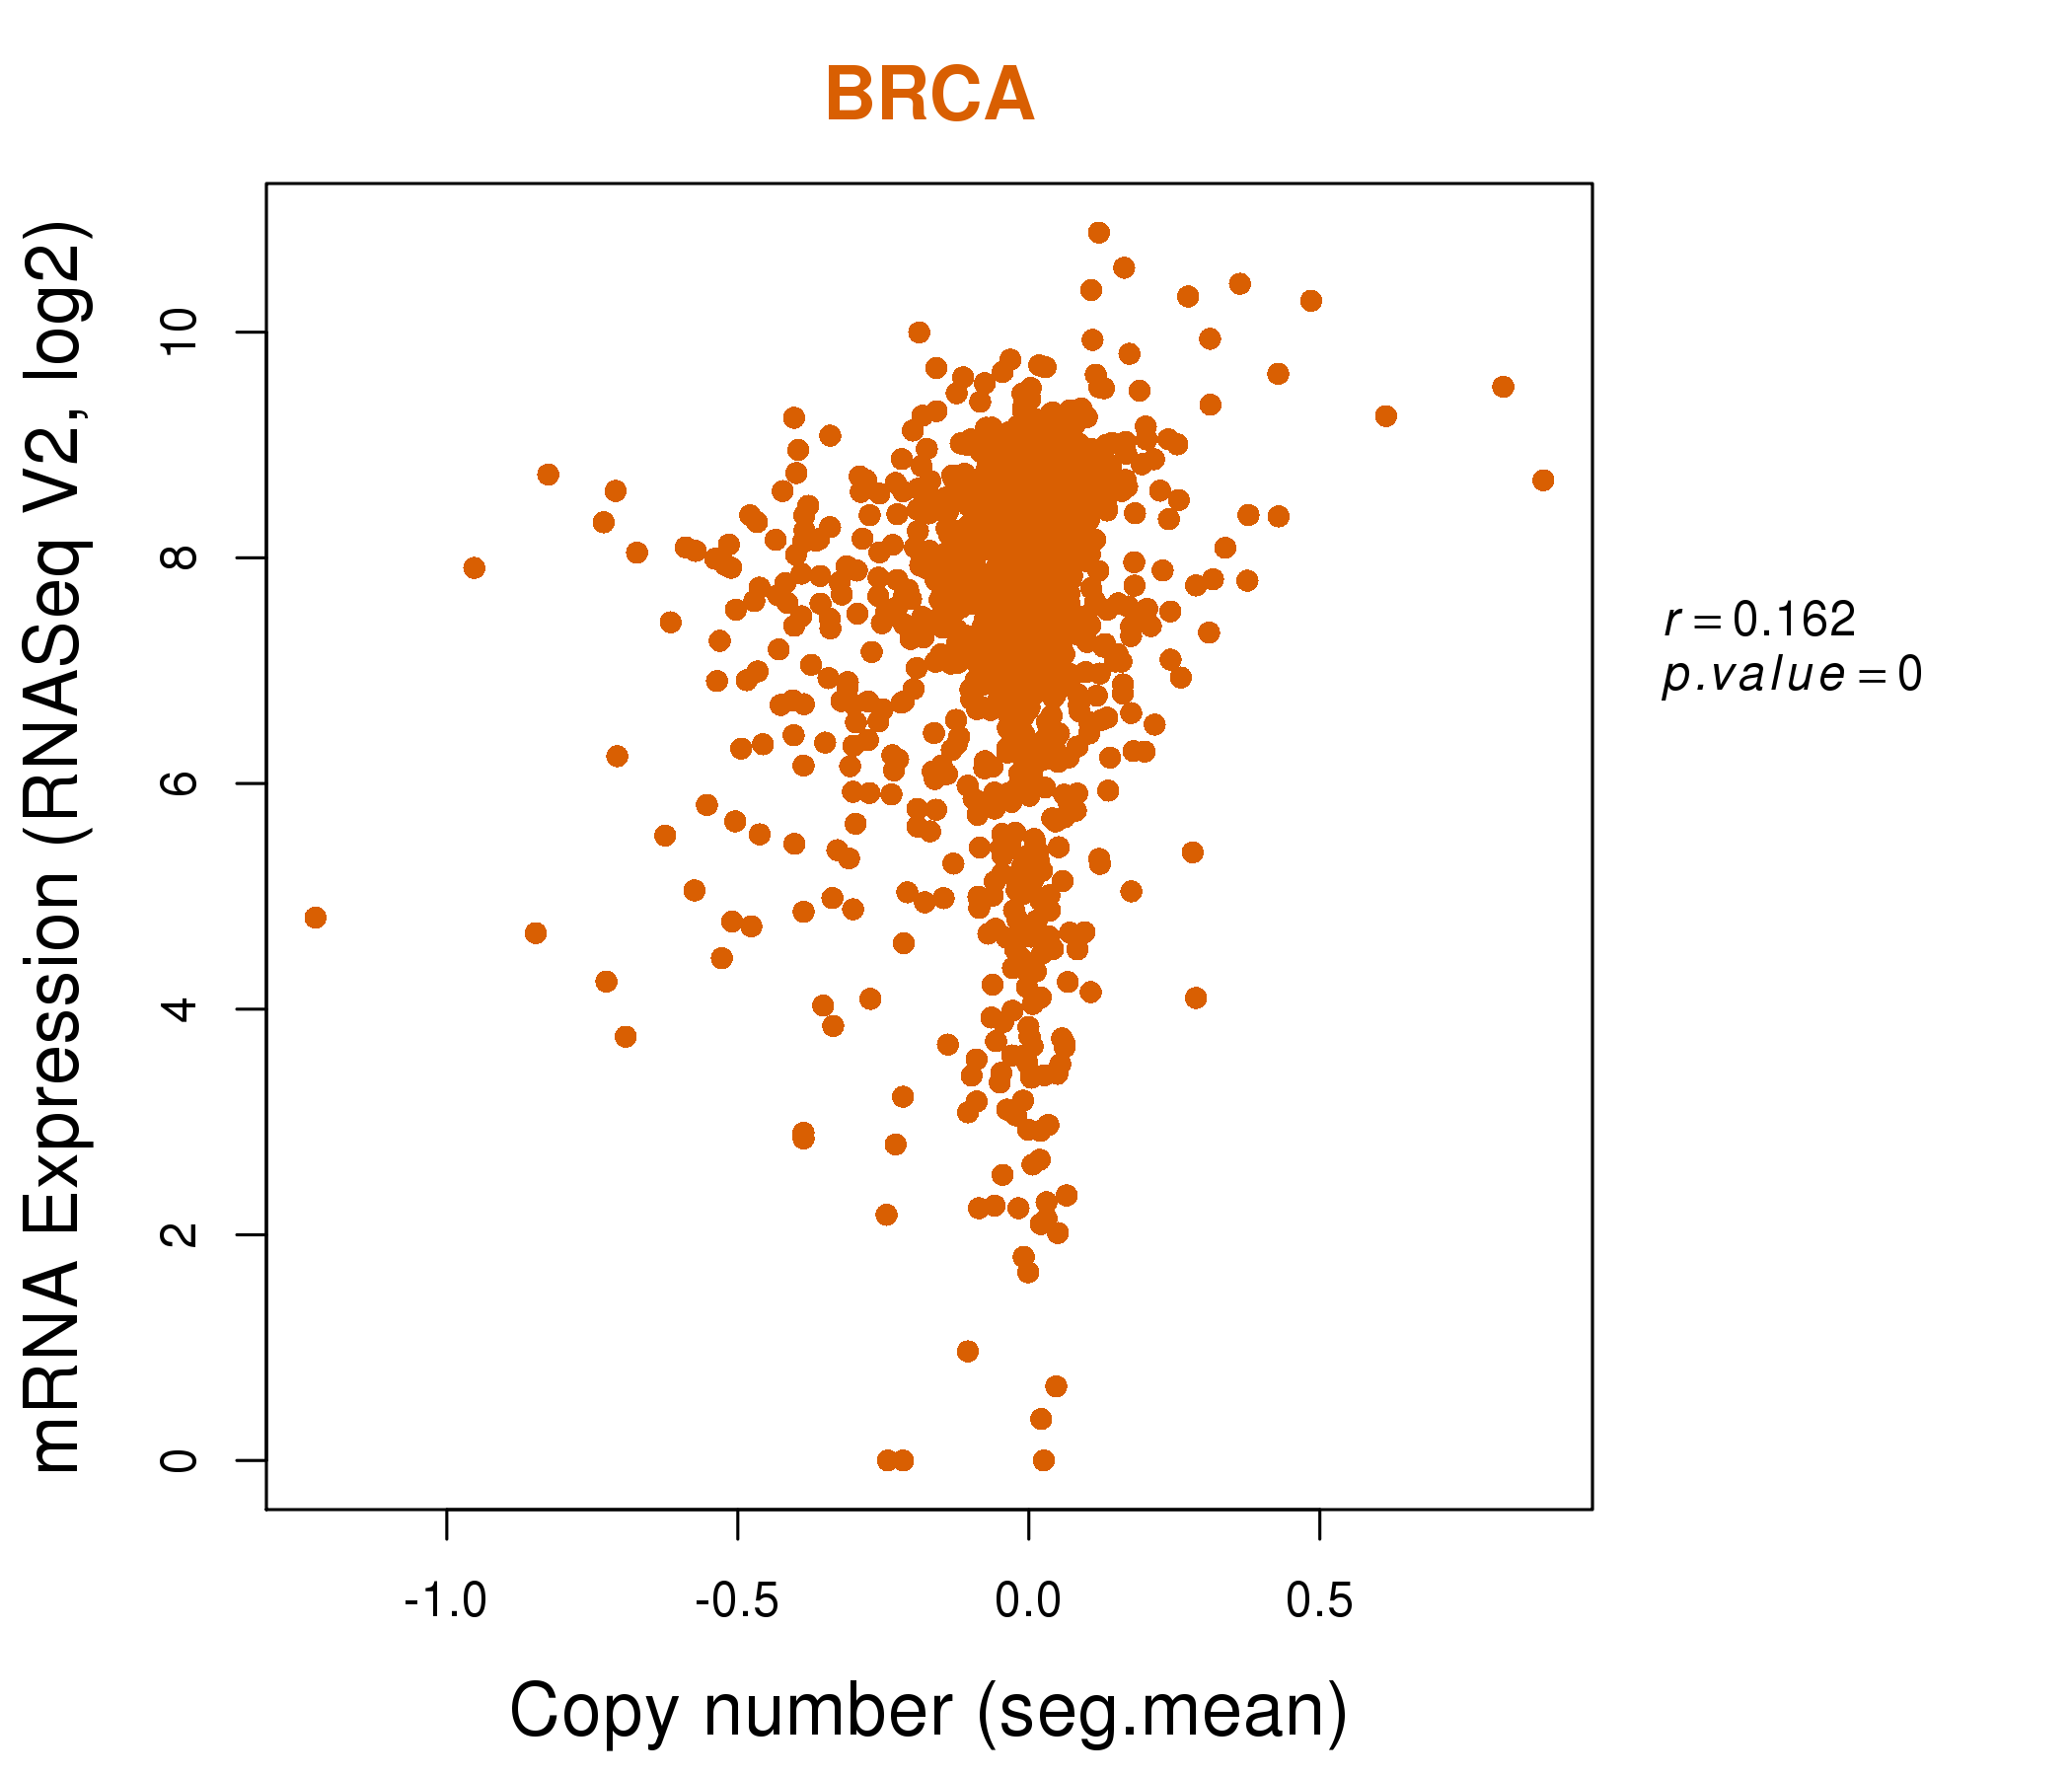
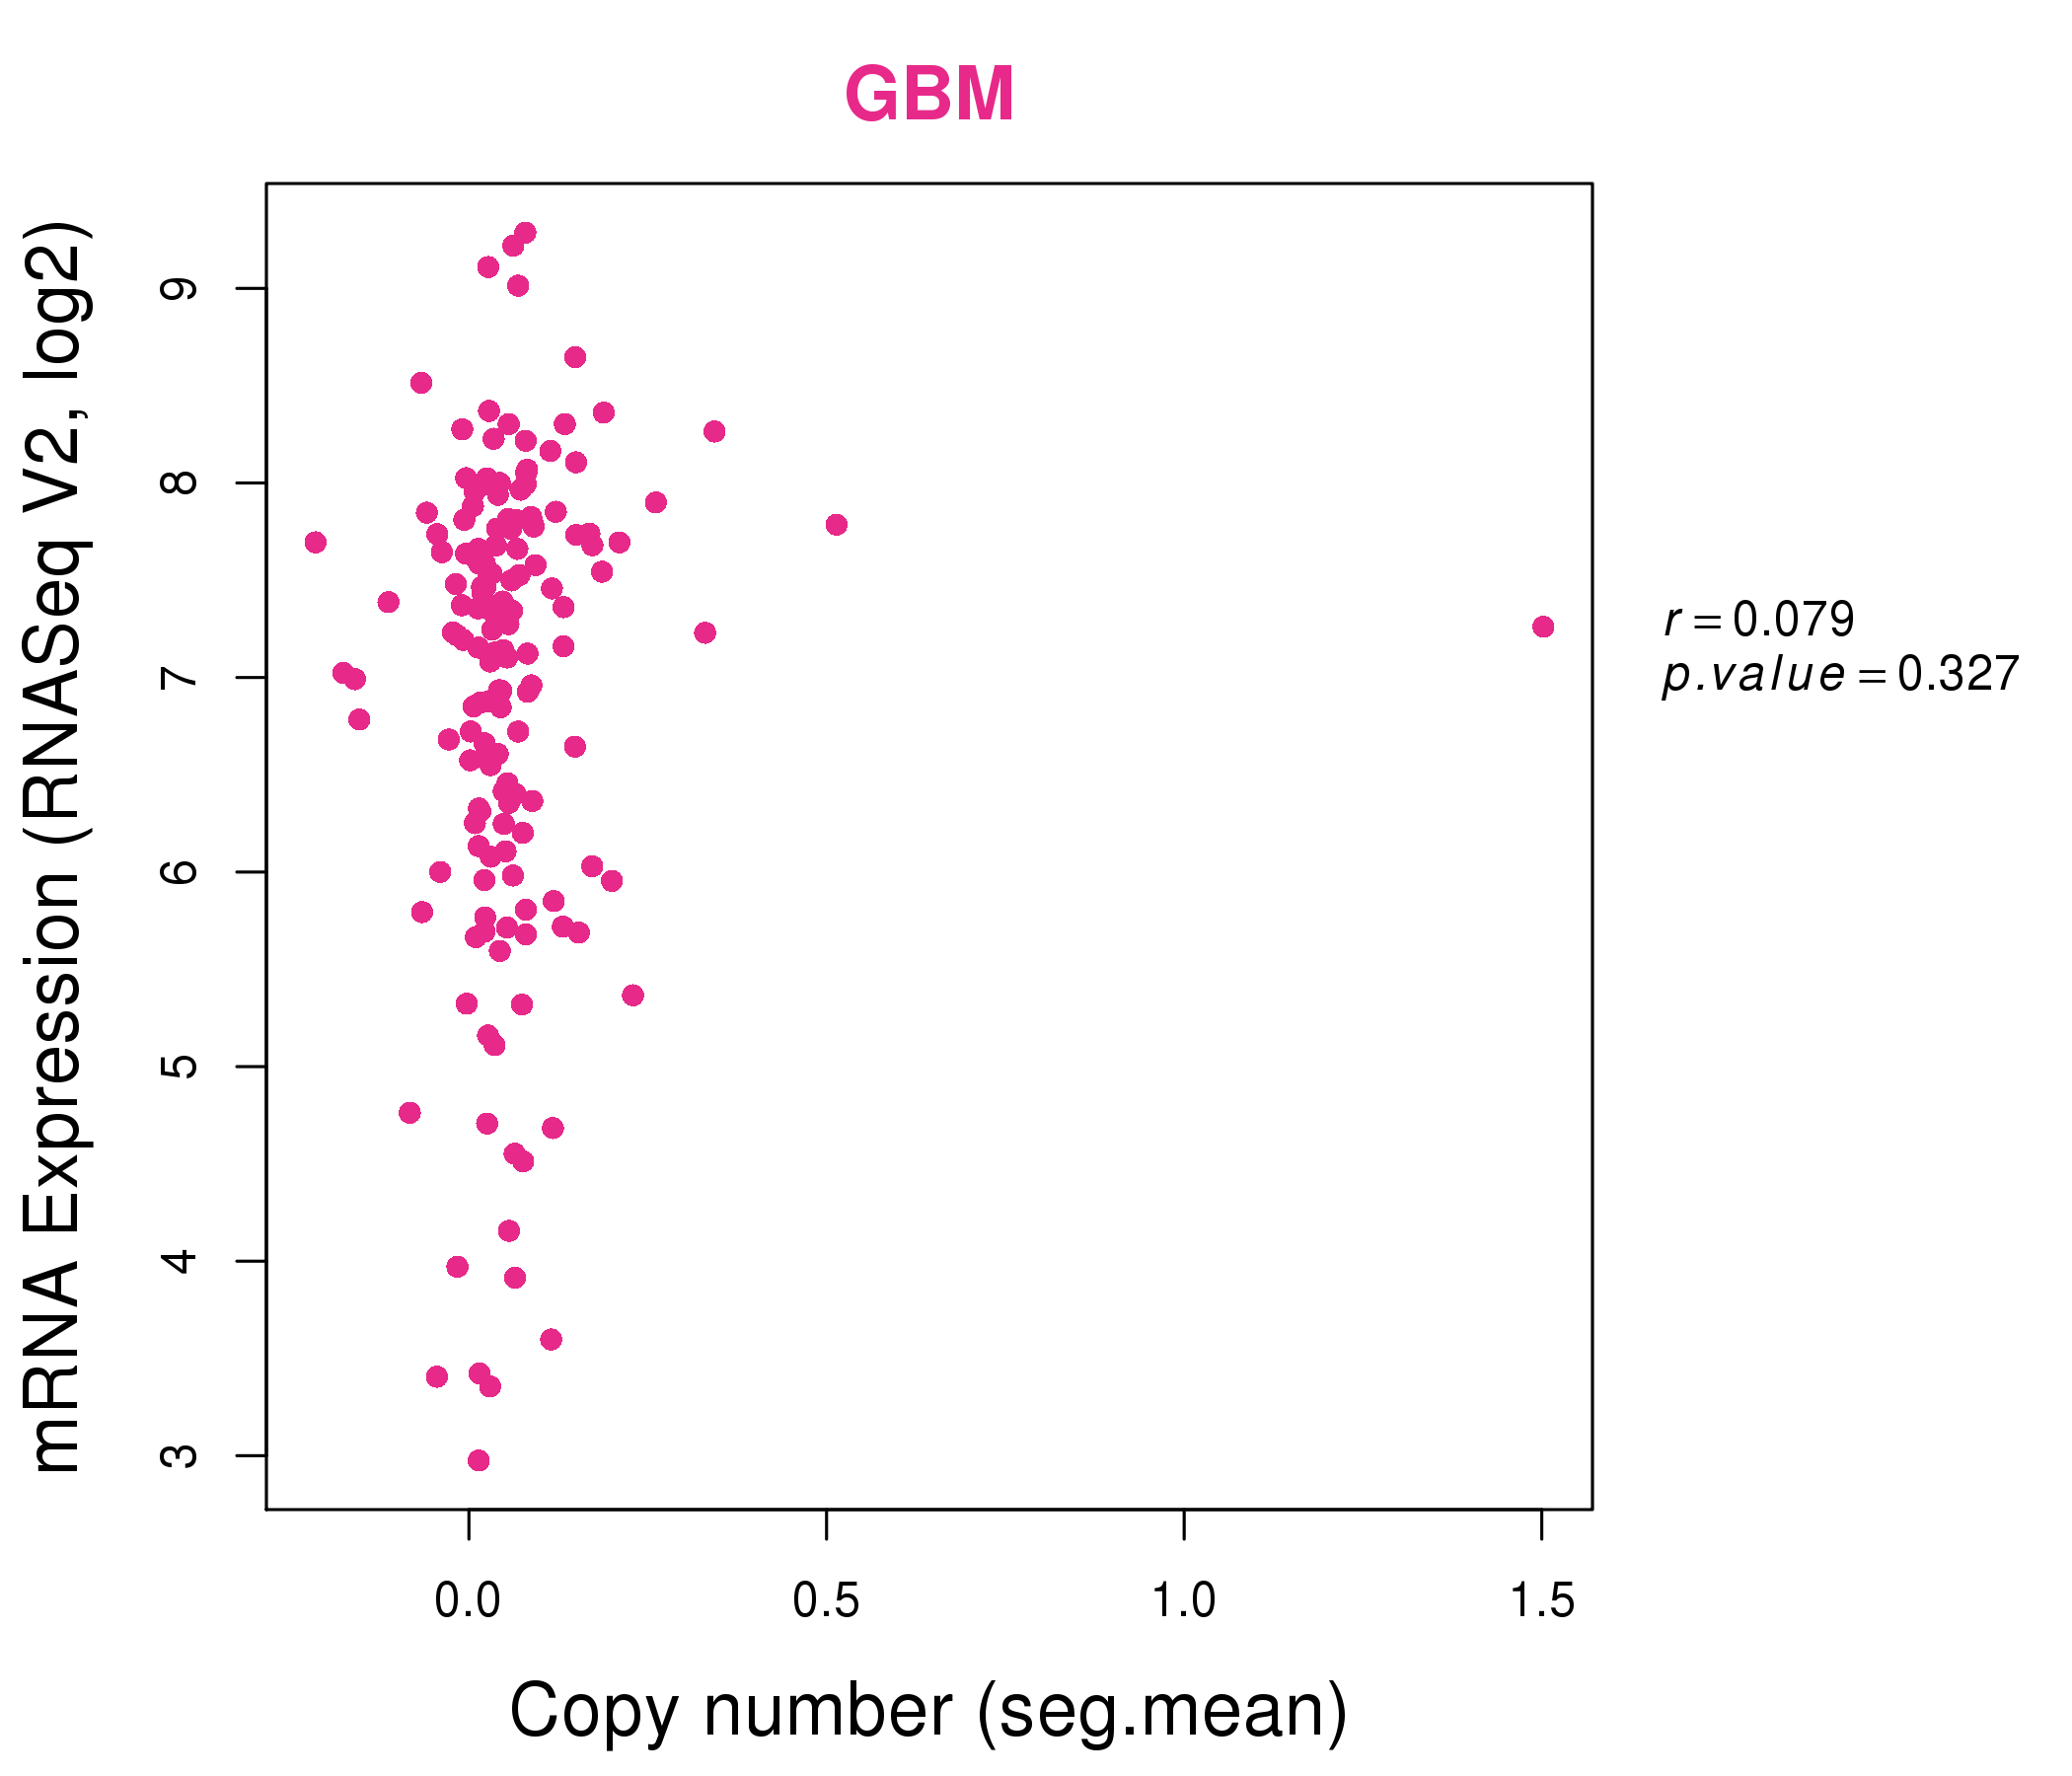
| * This plots show the correlation between CNV and gene expression. |
: Open all plots for all cancer types
 |
|
 |
|
| Top |
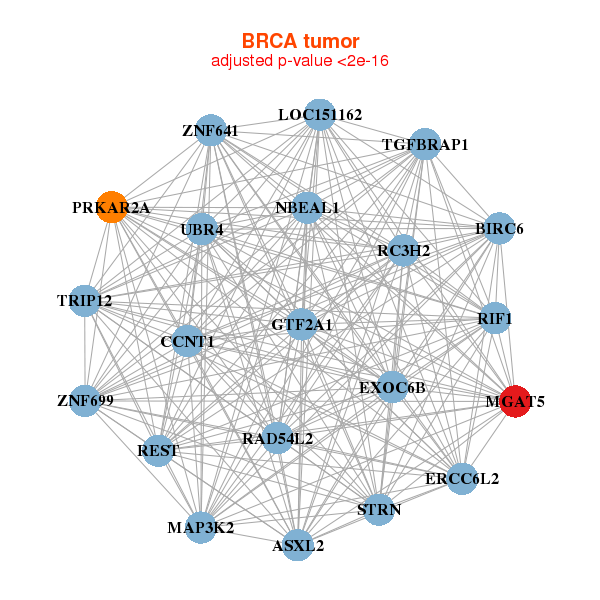
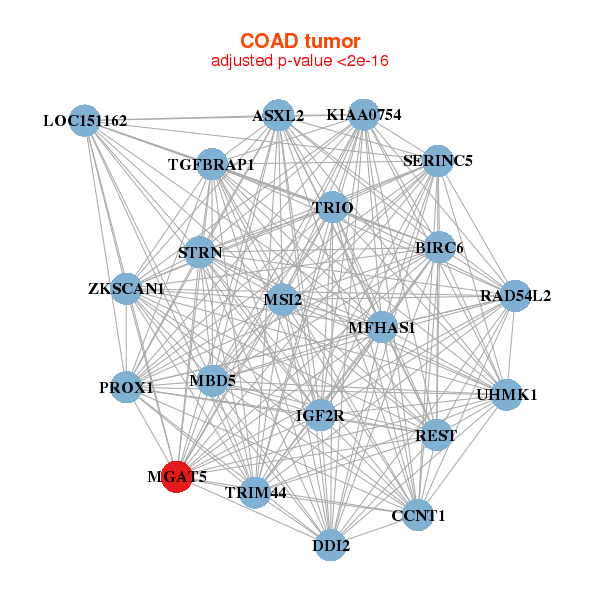
| Gene-Gene Network Information |
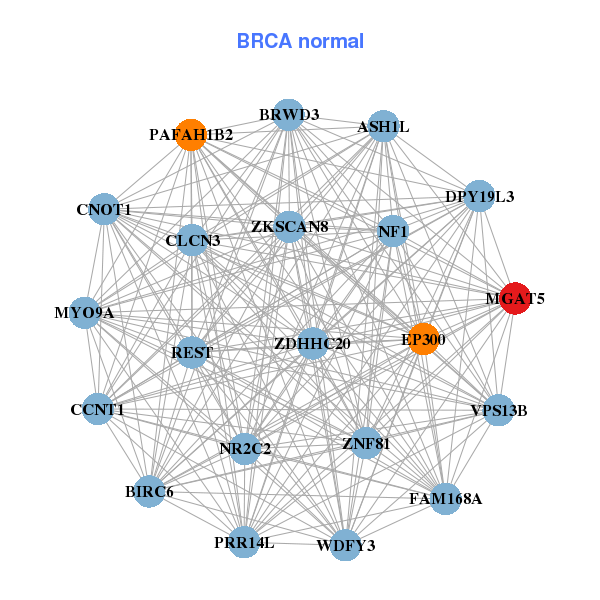
| * Co-Expression network figures were drawn using R package igraph. Only the top 20 genes with the highest correlations were shown. Red circle: input gene, orange circle: cell metabolism gene, sky circle: other gene |
: Open all plots for all cancer types
 |
|
| ASXL2,BIRC6,ERCC6L2,CCNT1,EXOC6B,GTF2A1,LOC151162, MAP3K2,MGAT5,NBEAL1,PRKAR2A,RAD54L2,RC3H2,REST, RIF1,STRN,TGFBRAP1,TRIP12,UBR4,ZNF641,ZNF699 | ASH1L,BIRC6,BRWD3,PRR14L,CCNT1,CLCN3,CNOT1, DPY19L3,EP300,FAM168A,MGAT5,MYO9A,NF1,NR2C2, PAFAH1B2,REST,VPS13B,WDFY3,ZDHHC20,ZKSCAN8,ZNF81 |
 |
|
| ASXL2,BIRC6,CCNT1,DDI2,IGF2R,KIAA0754,LOC151162, MBD5,MFHAS1,MGAT5,MSI2,PROX1,RAD54L2,REST, SERINC5,STRN,TGFBRAP1,TRIM44,TRIO,UHMK1,ZKSCAN1 | AAK1,AKAP13,BMP2K,C10orf12,SPECC1L,DIP2B,EGFR, FOXJ3,KDM5A,LCOR,LMTK2,LOC151162,MGAT5,MICAL2, MICAL3,NBPF1,NCOA2,RAPGEF2,SMCHD1,TRPM6,ZMYND8 |
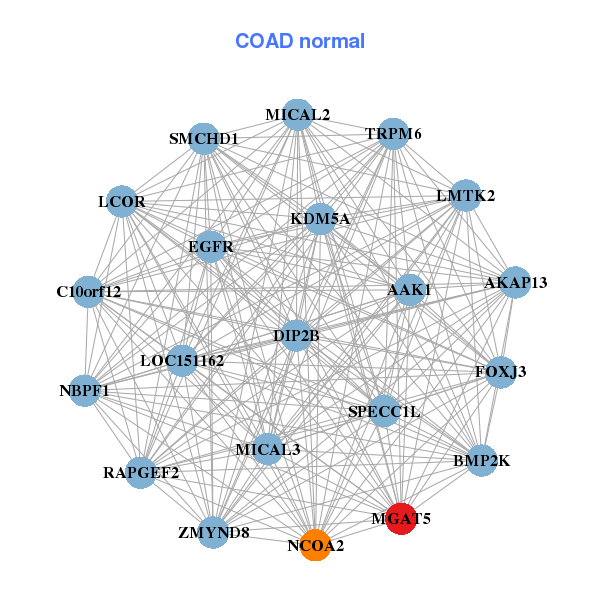
| * Co-Expression network figures were drawn using R package igraph. Only the top 20 genes with the highest correlations were shown. Red circle: input gene, orange circle: cell metabolism gene, sky circle: other gene |
: Open all plots for all cancer types
| Top |
: Open all interacting genes' information including KEGG pathway for all interacting genes from DAVID
| Top |
| Pharmacological Information for MGAT5 |
| There's no related Drug. |
| Top |
| Cross referenced IDs for MGAT5 |
| * We obtained these cross-references from Uniprot database. It covers 150 different DBs, 18 categories. http://www.uniprot.org/help/cross_references_section |
: Open all cross reference information
|
Copyright © 2016-Present - The Univsersity of Texas Health Science Center at Houston @ |