|
||||||||||||||||||||
| |
| Phenotypic Information (metabolism pathway, cancer, disease, phenome) |
| |
| |
| Gene-Gene Network Information: Co-Expression Network, Interacting Genes & KEGG |
| |
|


| Gene Summary for MGST1 |
| Top |
| Phenotypic Information for MGST1(metabolism pathway, cancer, disease, phenome) |
| Cancer | CGAP: MGST1 |
| Familial Cancer Database: MGST1 | |
| * This gene is included in those cancer gene databases. |
|
|
|
|
|
|
| ||||||||||||||
Oncogene 1 | Significant driver gene in | |||||||||||||||||||
| cf) number; DB name 1 Oncogene; http://nar.oxfordjournals.org/content/35/suppl_1/D721.long, 2 Tumor Suppressor gene; https://bioinfo.uth.edu/TSGene/, 3 Cancer Gene Census; http://www.nature.com/nrc/journal/v4/n3/abs/nrc1299.html, 4 CancerGenes; http://nar.oxfordjournals.org/content/35/suppl_1/D721.long, 5 Network of Cancer Gene; http://ncg.kcl.ac.uk/index.php, 1Therapeutic Vulnerabilities in Cancer; http://cbio.mskcc.org/cancergenomics/statius/ |
| KEGG_GLUTATHIONE_METABOLISM KEGG_METABOLISM_OF_XENOBIOTICS_BY_CYTOCHROME_P450 KEGG_DRUG_METABOLISM_CYTOCHROME_P450 | |
| OMIM | |
| Orphanet | |
| Disease | KEGG Disease: MGST1 |
| MedGen: MGST1 (Human Medical Genetics with Condition) | |
| ClinVar: MGST1 | |
| Phenotype | MGI: MGST1 (International Mouse Phenotyping Consortium) |
| PhenomicDB: MGST1 | |
| Mutations for MGST1 |
| * Under tables are showing count per each tissue to give us broad intuition about tissue specific mutation patterns.You can go to the detailed page for each mutation database's web site. |
| There's no structural variation information in COSMIC data for this gene. |
| * From mRNA Sanger sequences, Chitars2.0 arranged chimeric transcripts. This table shows MGST1 related fusion information. |
| ID | Head Gene | Tail Gene | Accession | Gene_a | qStart_a | qEnd_a | Chromosome_a | tStart_a | tEnd_a | Gene_a | qStart_a | qEnd_a | Chromosome_a | tStart_a | tEnd_a |
| BM983802 | MGST1 | 16 | 296 | 12 | 16517058 | 16517338 | MGST1 | 290 | 517 | 12 | 16516731 | 16516958 | |
| AI910757 | MGST1 | 1 | 270 | 12 | 16517070 | 16517339 | CRYZ | 263 | 369 | 1 | 75172662 | 75172876 | |
| DB298359 | MGST1 | 1 | 110 | 12 | 16517237 | 16517343 | SRGAP2 | 93 | 578 | 1 | 206634771 | 206635257 | |
| Top |
| There's no copy number variation information in COSMIC data for this gene. |
| Top |
|
 |
| Top |
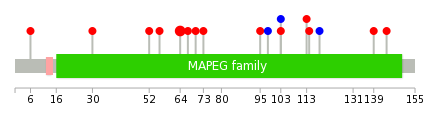
| Stat. for Non-Synonymous SNVs (# total SNVs=16) | (# total SNVs=1) |
 |  |
(# total SNVs=0) | (# total SNVs=0) |
| Top |
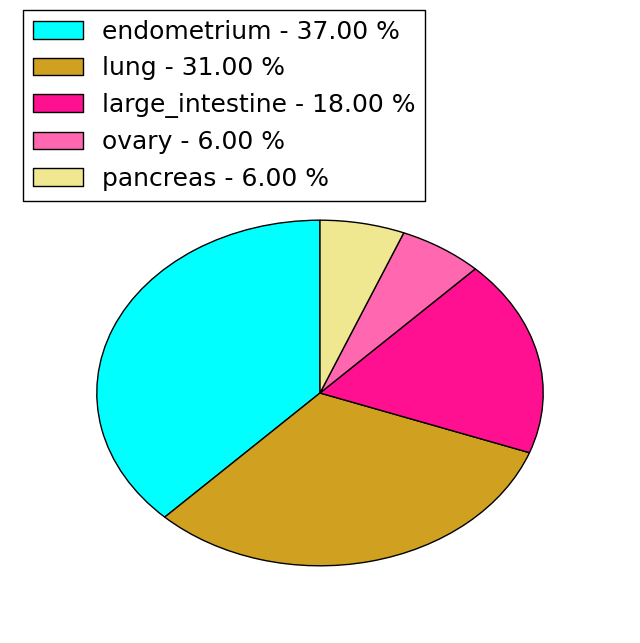
| * When you move the cursor on each content, you can see more deailed mutation information on the Tooltip. Those are primary_site,primary_histology,mutation(aa),pubmedID. |
| GRCh37 position | Mutation(aa) | Unique sampleID count |
| chr12:16510603-16510603 | p.R64Q | 4 |
| chr12:16516725-16516725 | p.? | 2 |
| chr12:16516748-16516748 | p.E81* | 1 |
| chr12:16507203-16507203 | p.Q6L | 1 |
| chr12:16516792-16516792 | p.L95F | 1 |
| chr12:16507276-16507276 | p.M30I | 1 |
| chr12:16516801-16516801 | p.P98P | 1 |
| chr12:16510566-16510566 | p.A52S | 1 |
| chr12:16516815-16516815 | p.A103V | 1 |
| chr12:16510579-16510579 | p.G56V | 1 |
| Top |
|
 |
| Point Mutation/ Tissue ID | 1 | 2 | 3 | 4 | 5 | 6 | 7 | 8 | 9 | 10 | 11 | 12 | 13 | 14 | 15 | 16 | 17 | 18 | 19 | 20 |
| # sample | 2 | 1 | 2 | 2 | 1 | 1 | 3 | 4 | ||||||||||||
| # mutation | 2 | 1 | 2 | 2 | 1 | 1 | 3 | 3 | ||||||||||||
| nonsynonymous SNV | 2 | 1 | 1 | 2 | 1 | 1 | 3 | 3 | ||||||||||||
| synonymous SNV | 1 |
| cf) Tissue ID; Tissue type (1; BLCA[Bladder Urothelial Carcinoma], 2; BRCA[Breast invasive carcinoma], 3; CESC[Cervical squamous cell carcinoma and endocervical adenocarcinoma], 4; COAD[Colon adenocarcinoma], 5; GBM[Glioblastoma multiforme], 6; Glioma Low Grade, 7; HNSC[Head and Neck squamous cell carcinoma], 8; KICH[Kidney Chromophobe], 9; KIRC[Kidney renal clear cell carcinoma], 10; KIRP[Kidney renal papillary cell carcinoma], 11; LAML[Acute Myeloid Leukemia], 12; LUAD[Lung adenocarcinoma], 13; LUSC[Lung squamous cell carcinoma], 14; OV[Ovarian serous cystadenocarcinoma ], 15; PAAD[Pancreatic adenocarcinoma], 16; PRAD[Prostate adenocarcinoma], 17; SKCM[Skin Cutaneous Melanoma], 18:STAD[Stomach adenocarcinoma], 19:THCA[Thyroid carcinoma], 20:UCEC[Uterine Corpus Endometrial Carcinoma]) |
| Top |
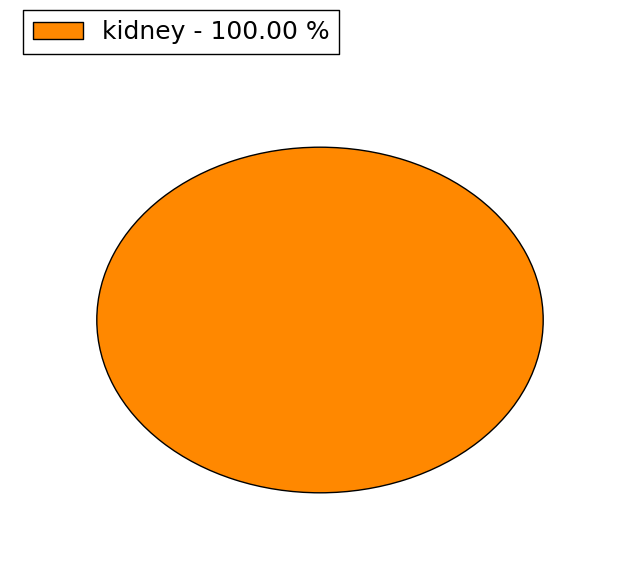
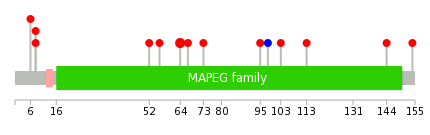
| * We represented just top 10 SNVs. When you move the cursor on each content, you can see more deailed mutation information on the Tooltip. Those are primary_site, primary_histology, mutation(aa), pubmedID. |
| Genomic Position | Mutation(aa) | Unique sampleID count |
| chr12:16510603 | p.R64Q,MGST1 | 3 |
| chr12:16516815 | p.M144I,MGST1 | 1 |
| chr12:16507203 | p.Y154C,MGST1 | 1 |
| chr12:16516845 | p.Q6L,MGST1 | 1 |
| chr12:16507209 | p.M8T,MGST1 | 1 |
| chr12:16516939 | p.M8I,MGST1 | 1 |
| chr12:16507210 | p.A52S,MGST1 | 1 |
| chr12:16516968 | p.G56V,MGST1 | 1 |
| chr12:16510566 | p.D67G,MGST1 | 1 |
| chr12:16510579 | p.R73H,MGST1 | 1 |
| * Copy number data were extracted from TCGA using R package TCGA-Assembler. The URLs of all public data files on TCGA DCC data server were gathered on Jan-05-2015. Function ProcessCNAData in TCGA-Assembler package was used to obtain gene-level copy number value which is calculated as the average copy number of the genomic region of a gene. |
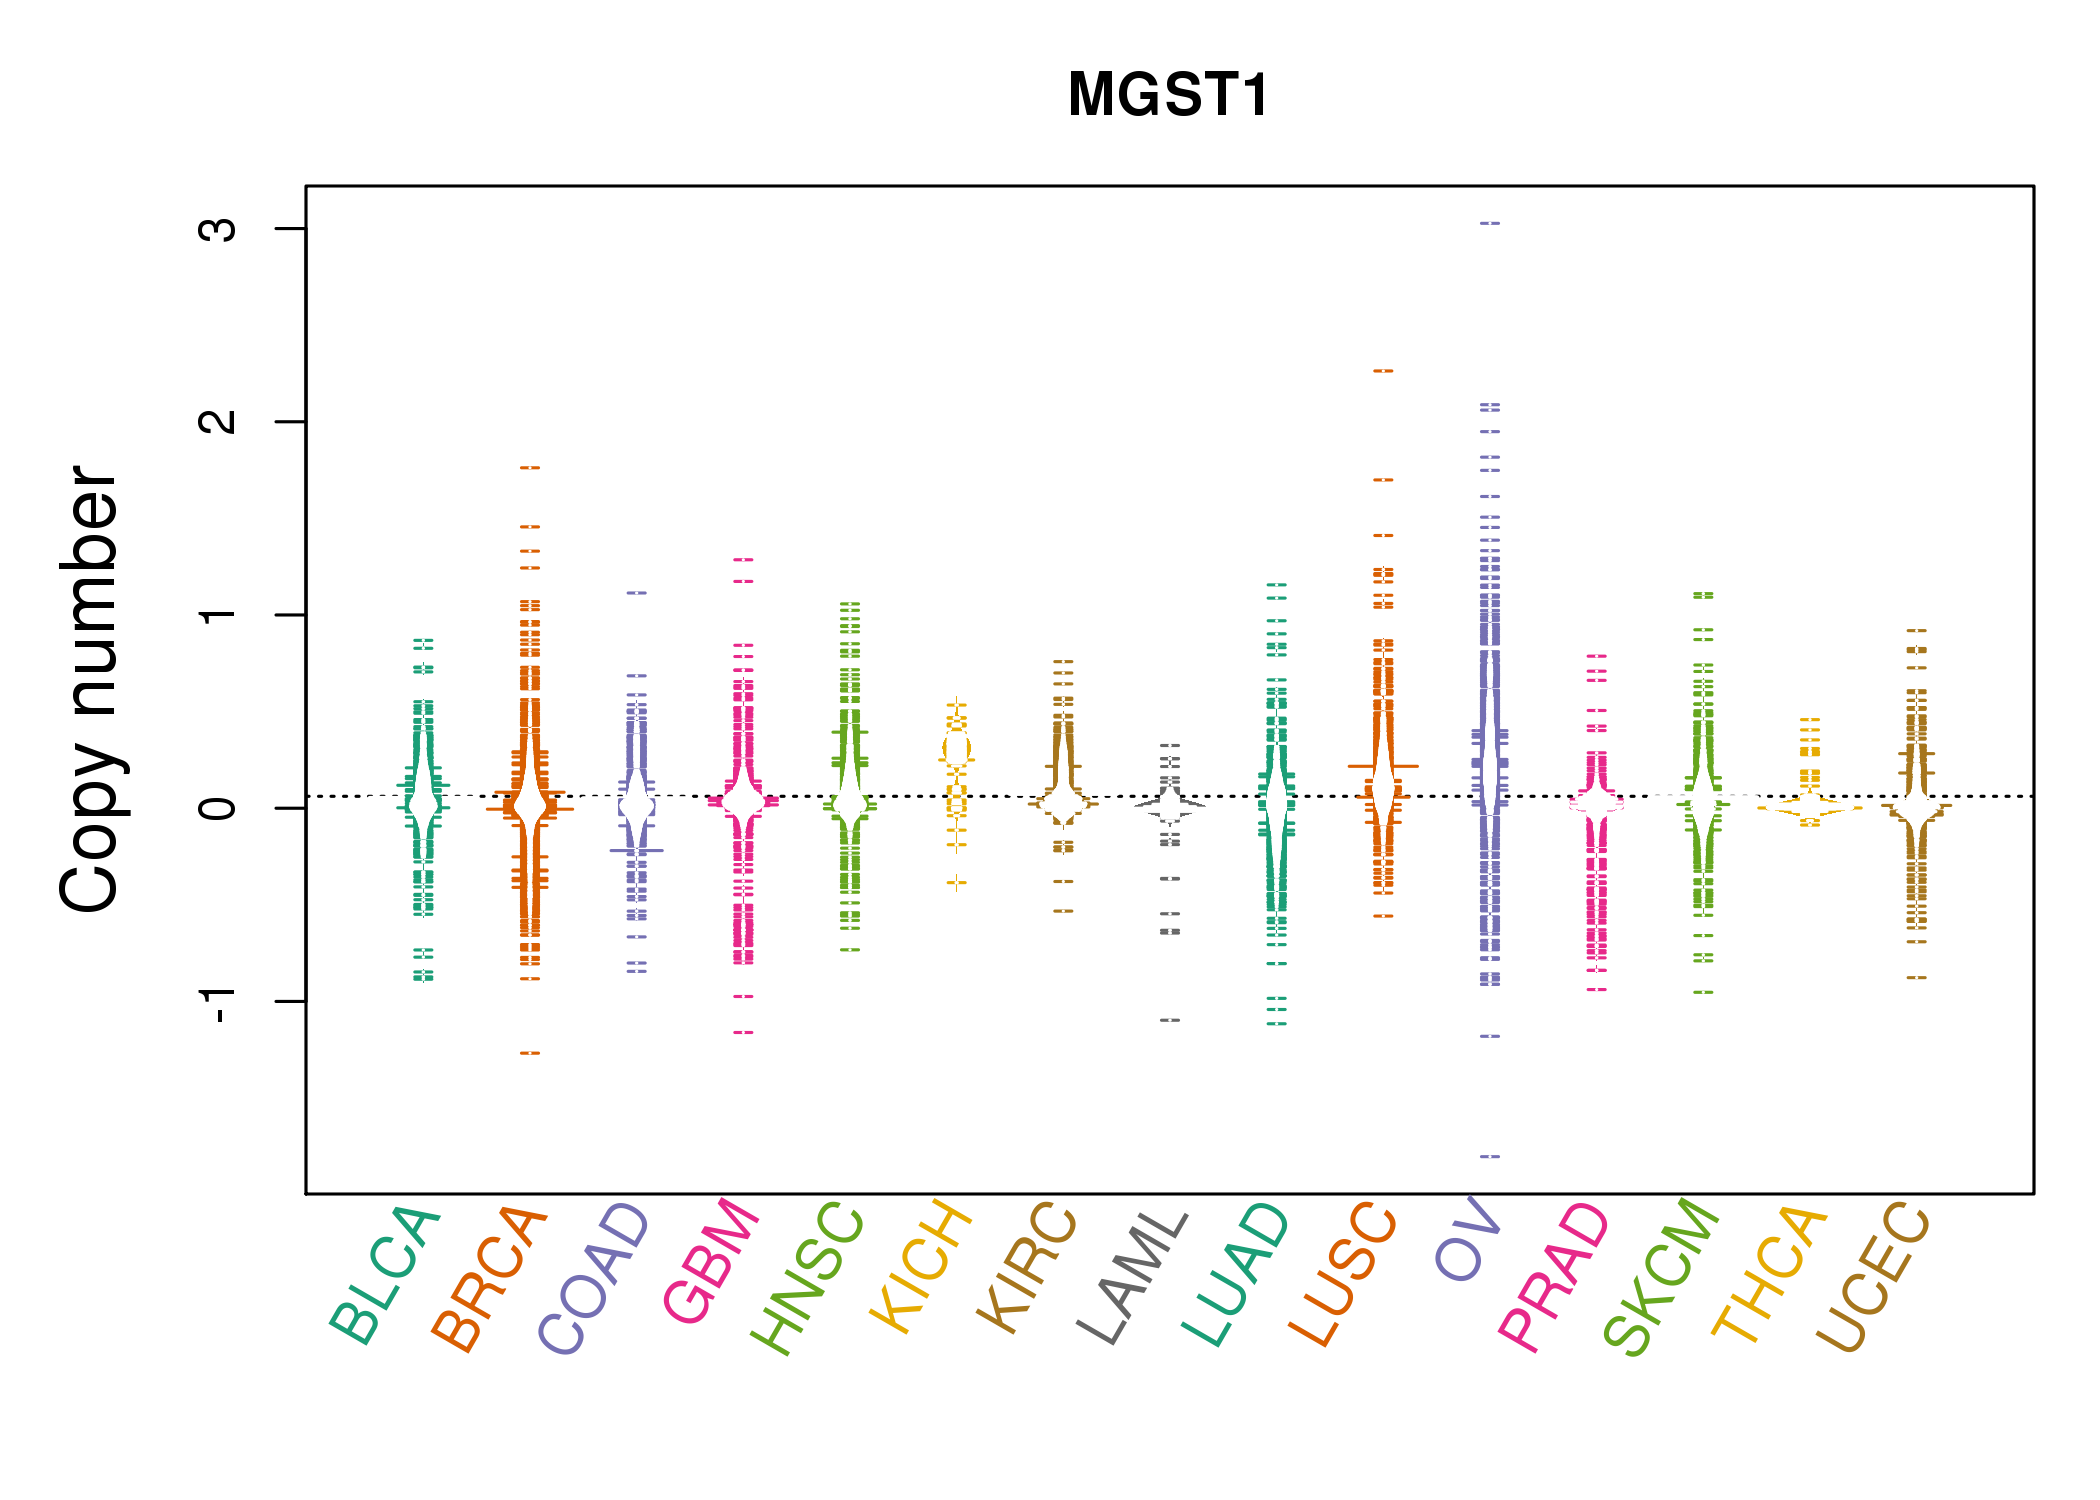 |
| cf) Tissue ID[Tissue type]: BLCA[Bladder Urothelial Carcinoma], BRCA[Breast invasive carcinoma], CESC[Cervical squamous cell carcinoma and endocervical adenocarcinoma], COAD[Colon adenocarcinoma], GBM[Glioblastoma multiforme], Glioma Low Grade, HNSC[Head and Neck squamous cell carcinoma], KICH[Kidney Chromophobe], KIRC[Kidney renal clear cell carcinoma], KIRP[Kidney renal papillary cell carcinoma], LAML[Acute Myeloid Leukemia], LUAD[Lung adenocarcinoma], LUSC[Lung squamous cell carcinoma], OV[Ovarian serous cystadenocarcinoma ], PAAD[Pancreatic adenocarcinoma], PRAD[Prostate adenocarcinoma], SKCM[Skin Cutaneous Melanoma], STAD[Stomach adenocarcinoma], THCA[Thyroid carcinoma], UCEC[Uterine Corpus Endometrial Carcinoma] |
| Top |
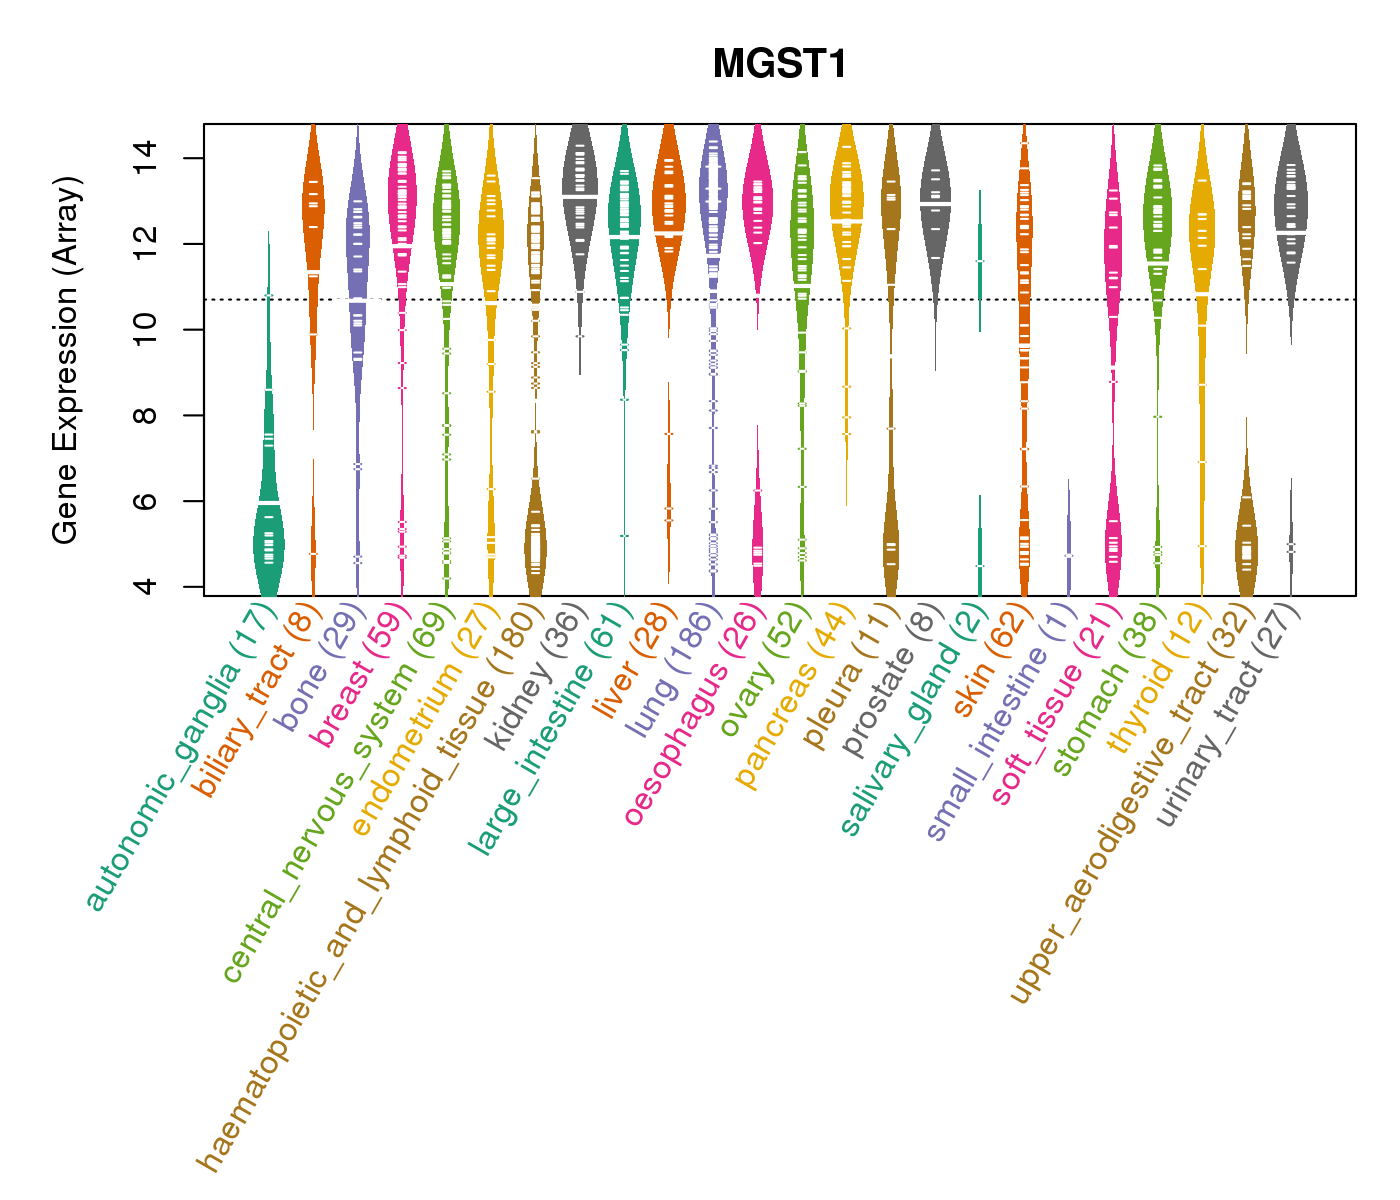
| Gene Expression for MGST1 |
| * CCLE gene expression data were extracted from CCLE_Expression_Entrez_2012-10-18.res: Gene-centric RMA-normalized mRNA expression data. |
 |
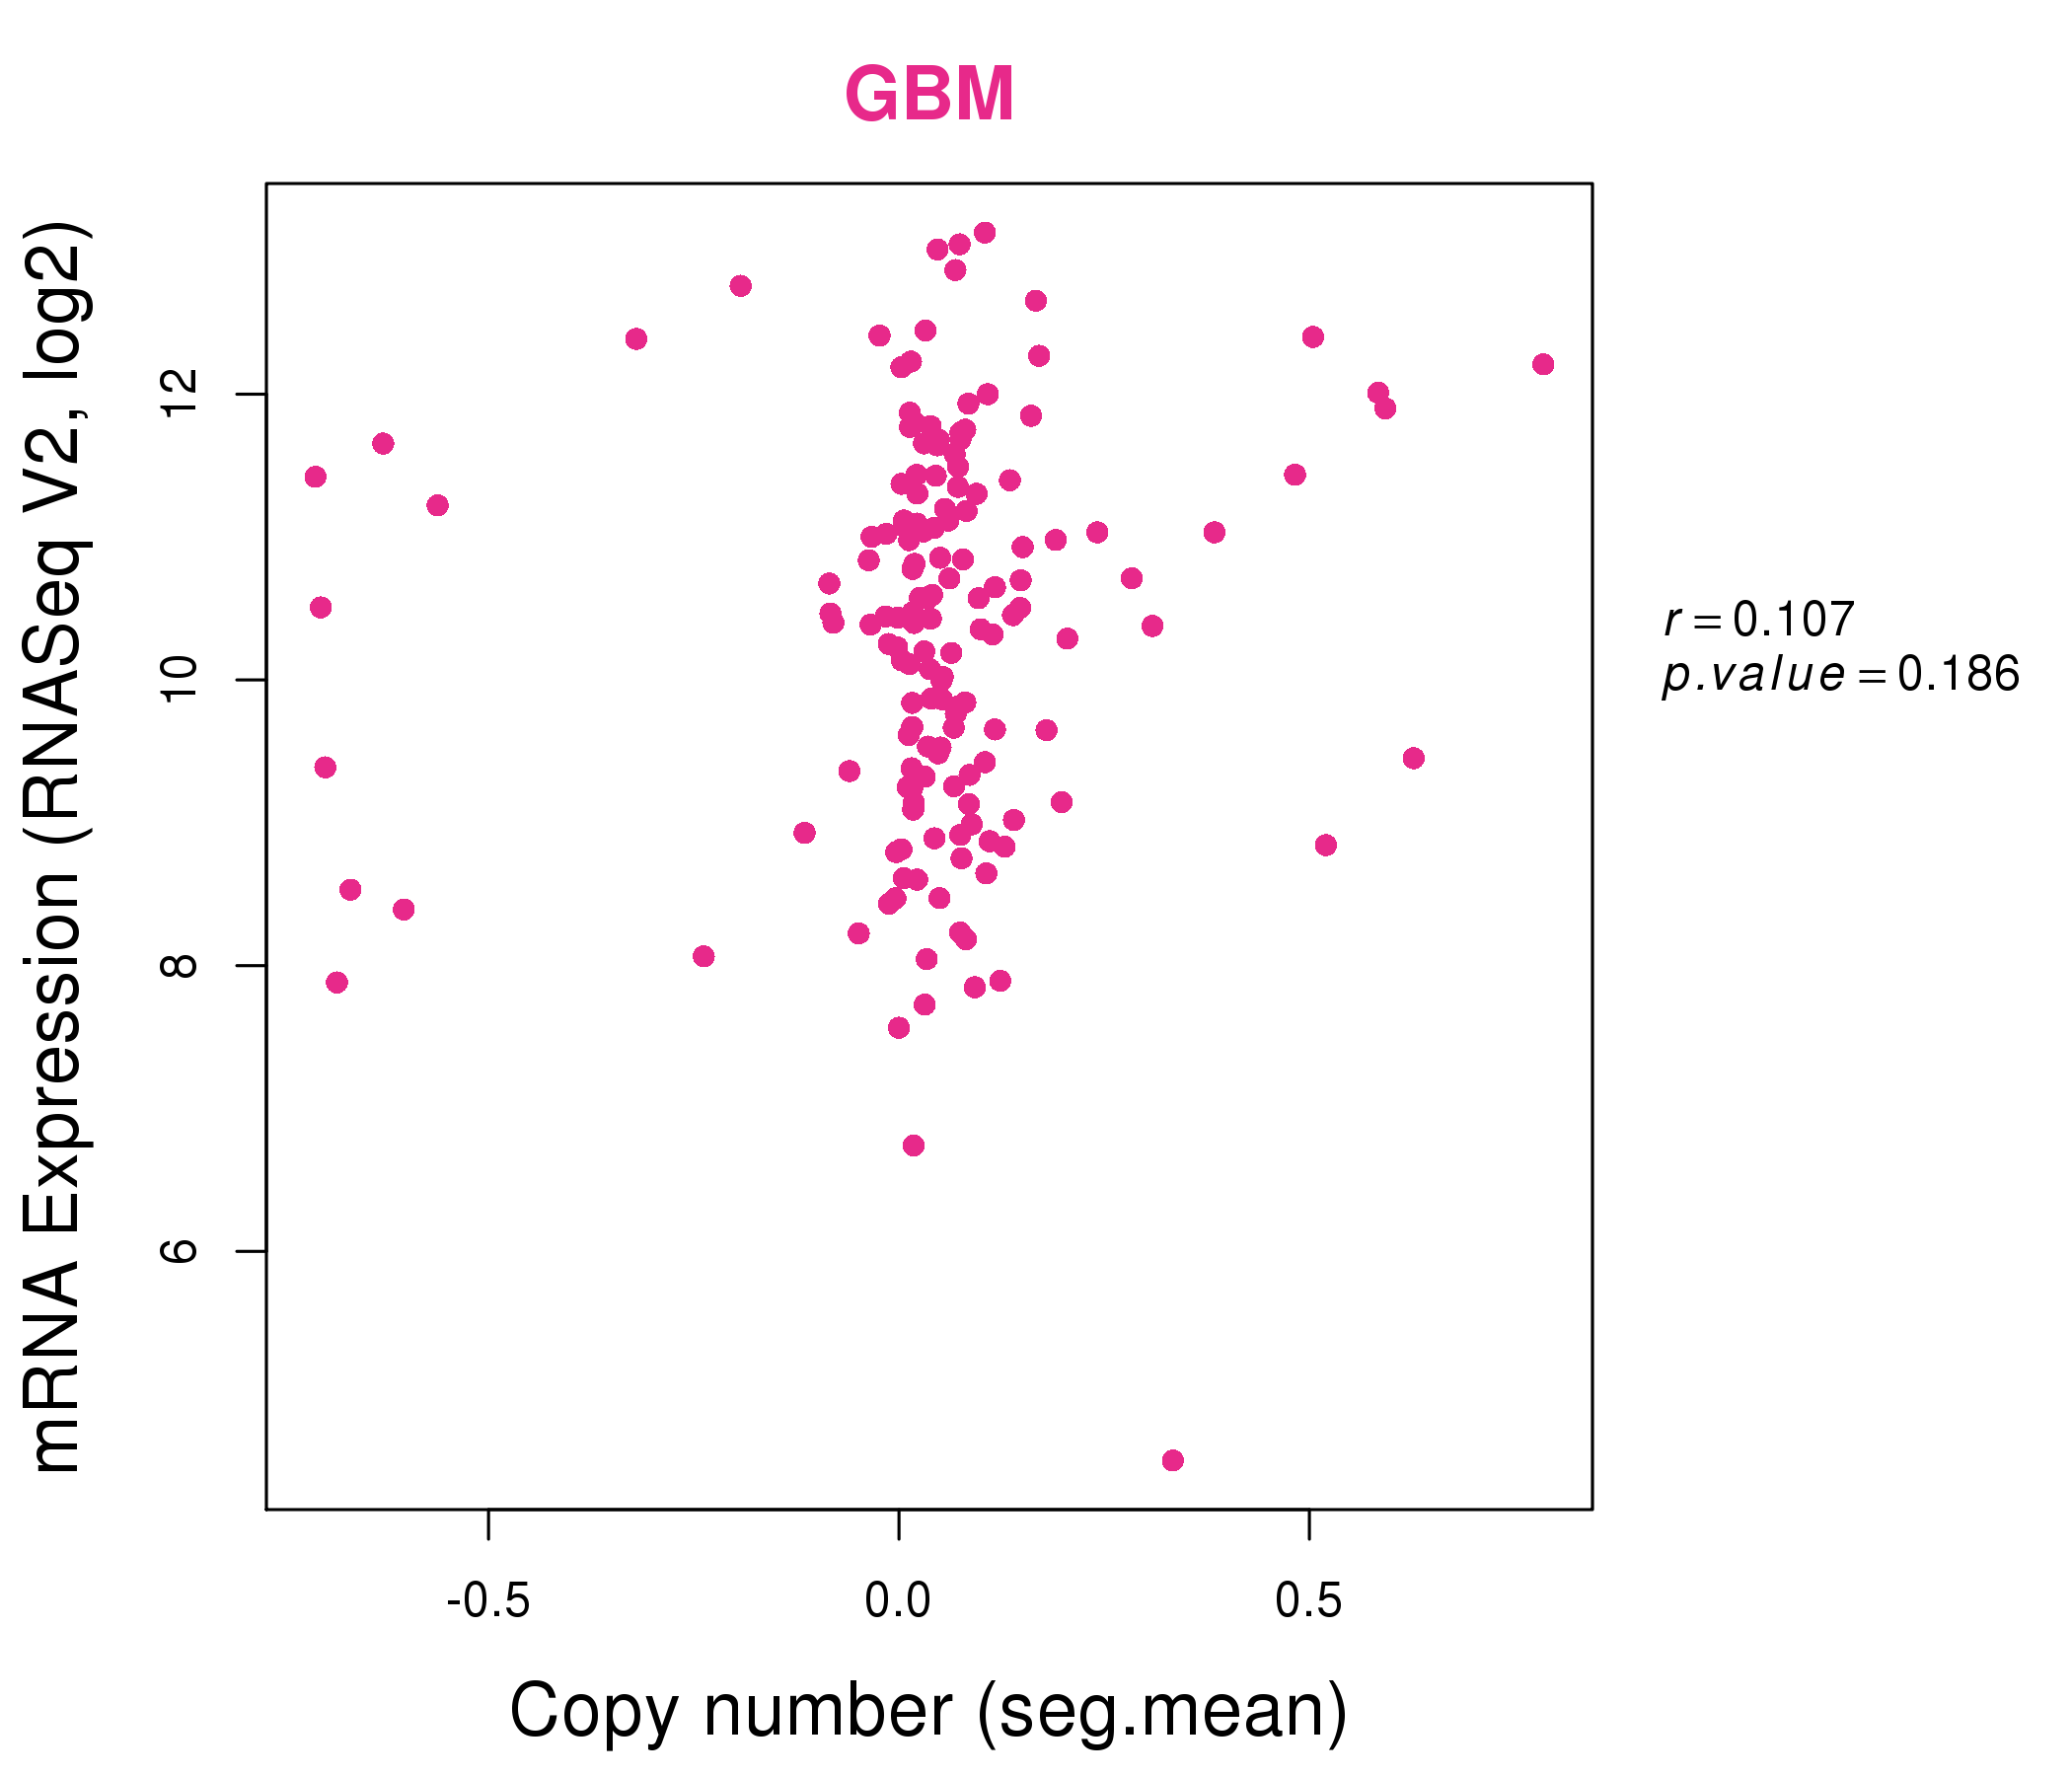
| * Normalized gene expression data of RNASeqV2 was extracted from TCGA using R package TCGA-Assembler. The URLs of all public data files on TCGA DCC data server were gathered at Jan-05-2015. Only eight cancer types have enough normal control samples for differential expression analysis. (t test, adjusted p<0.05 (using Benjamini-Hochberg FDR)) |
 |
| Top |
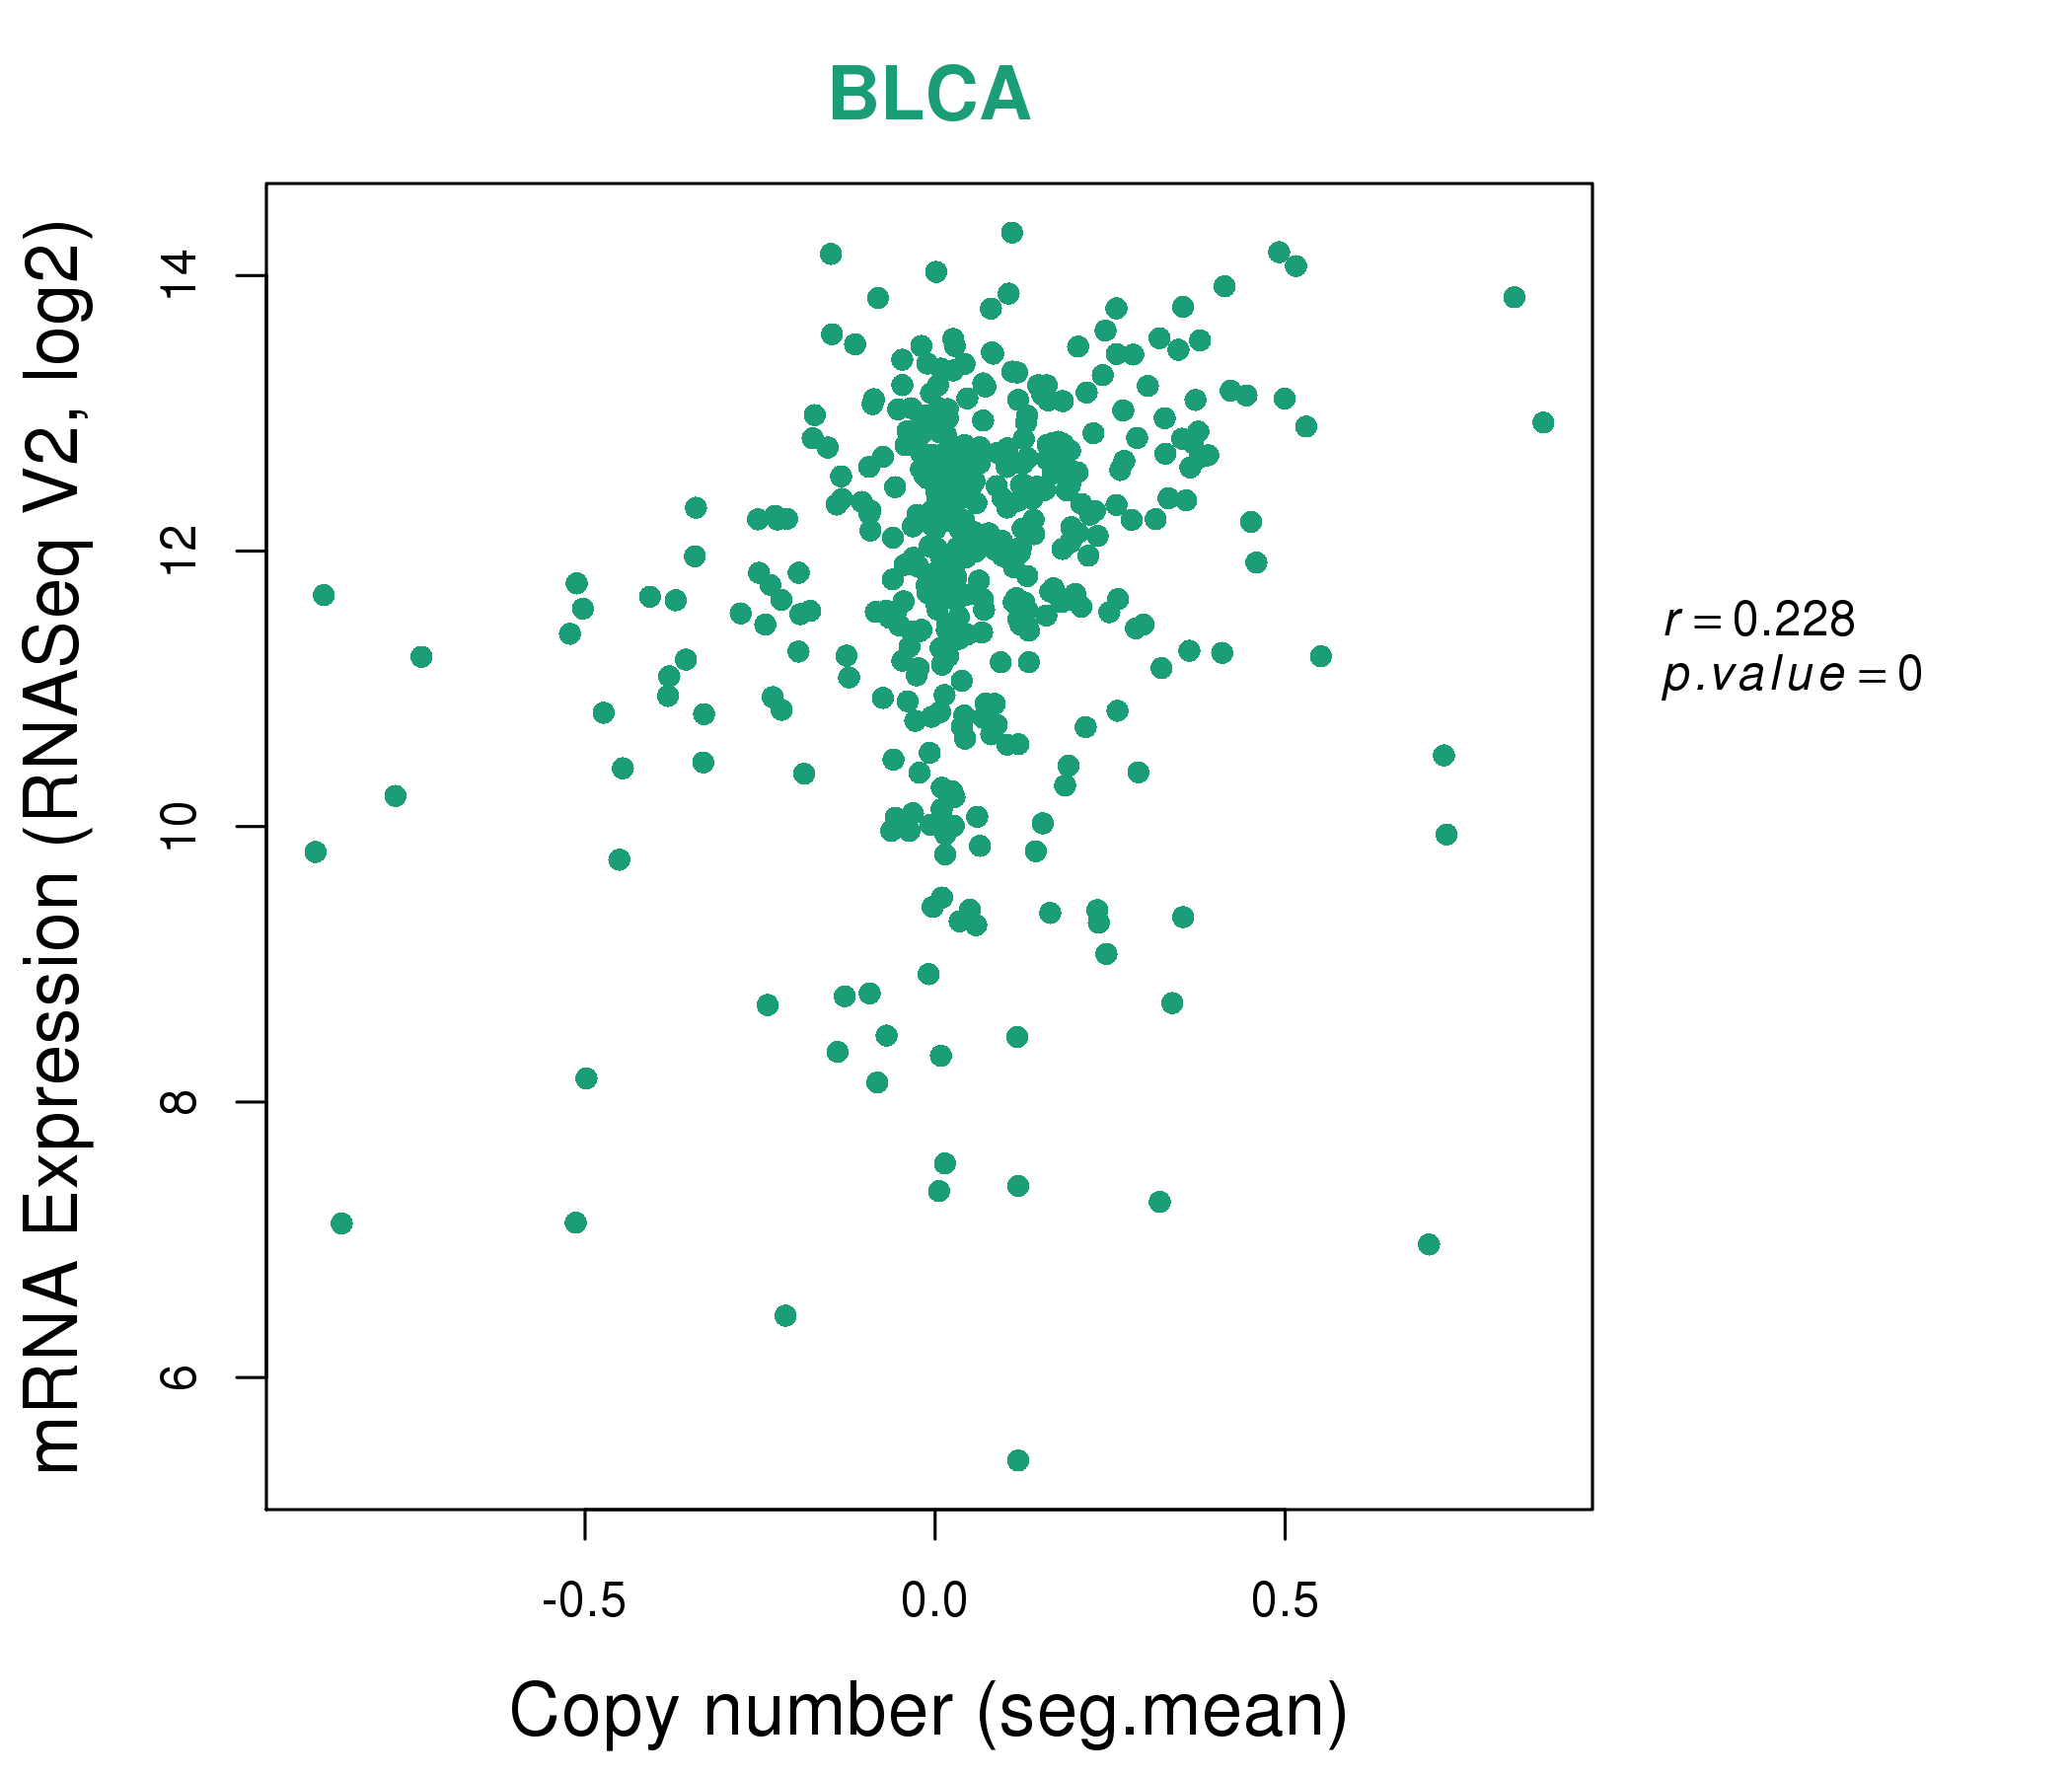
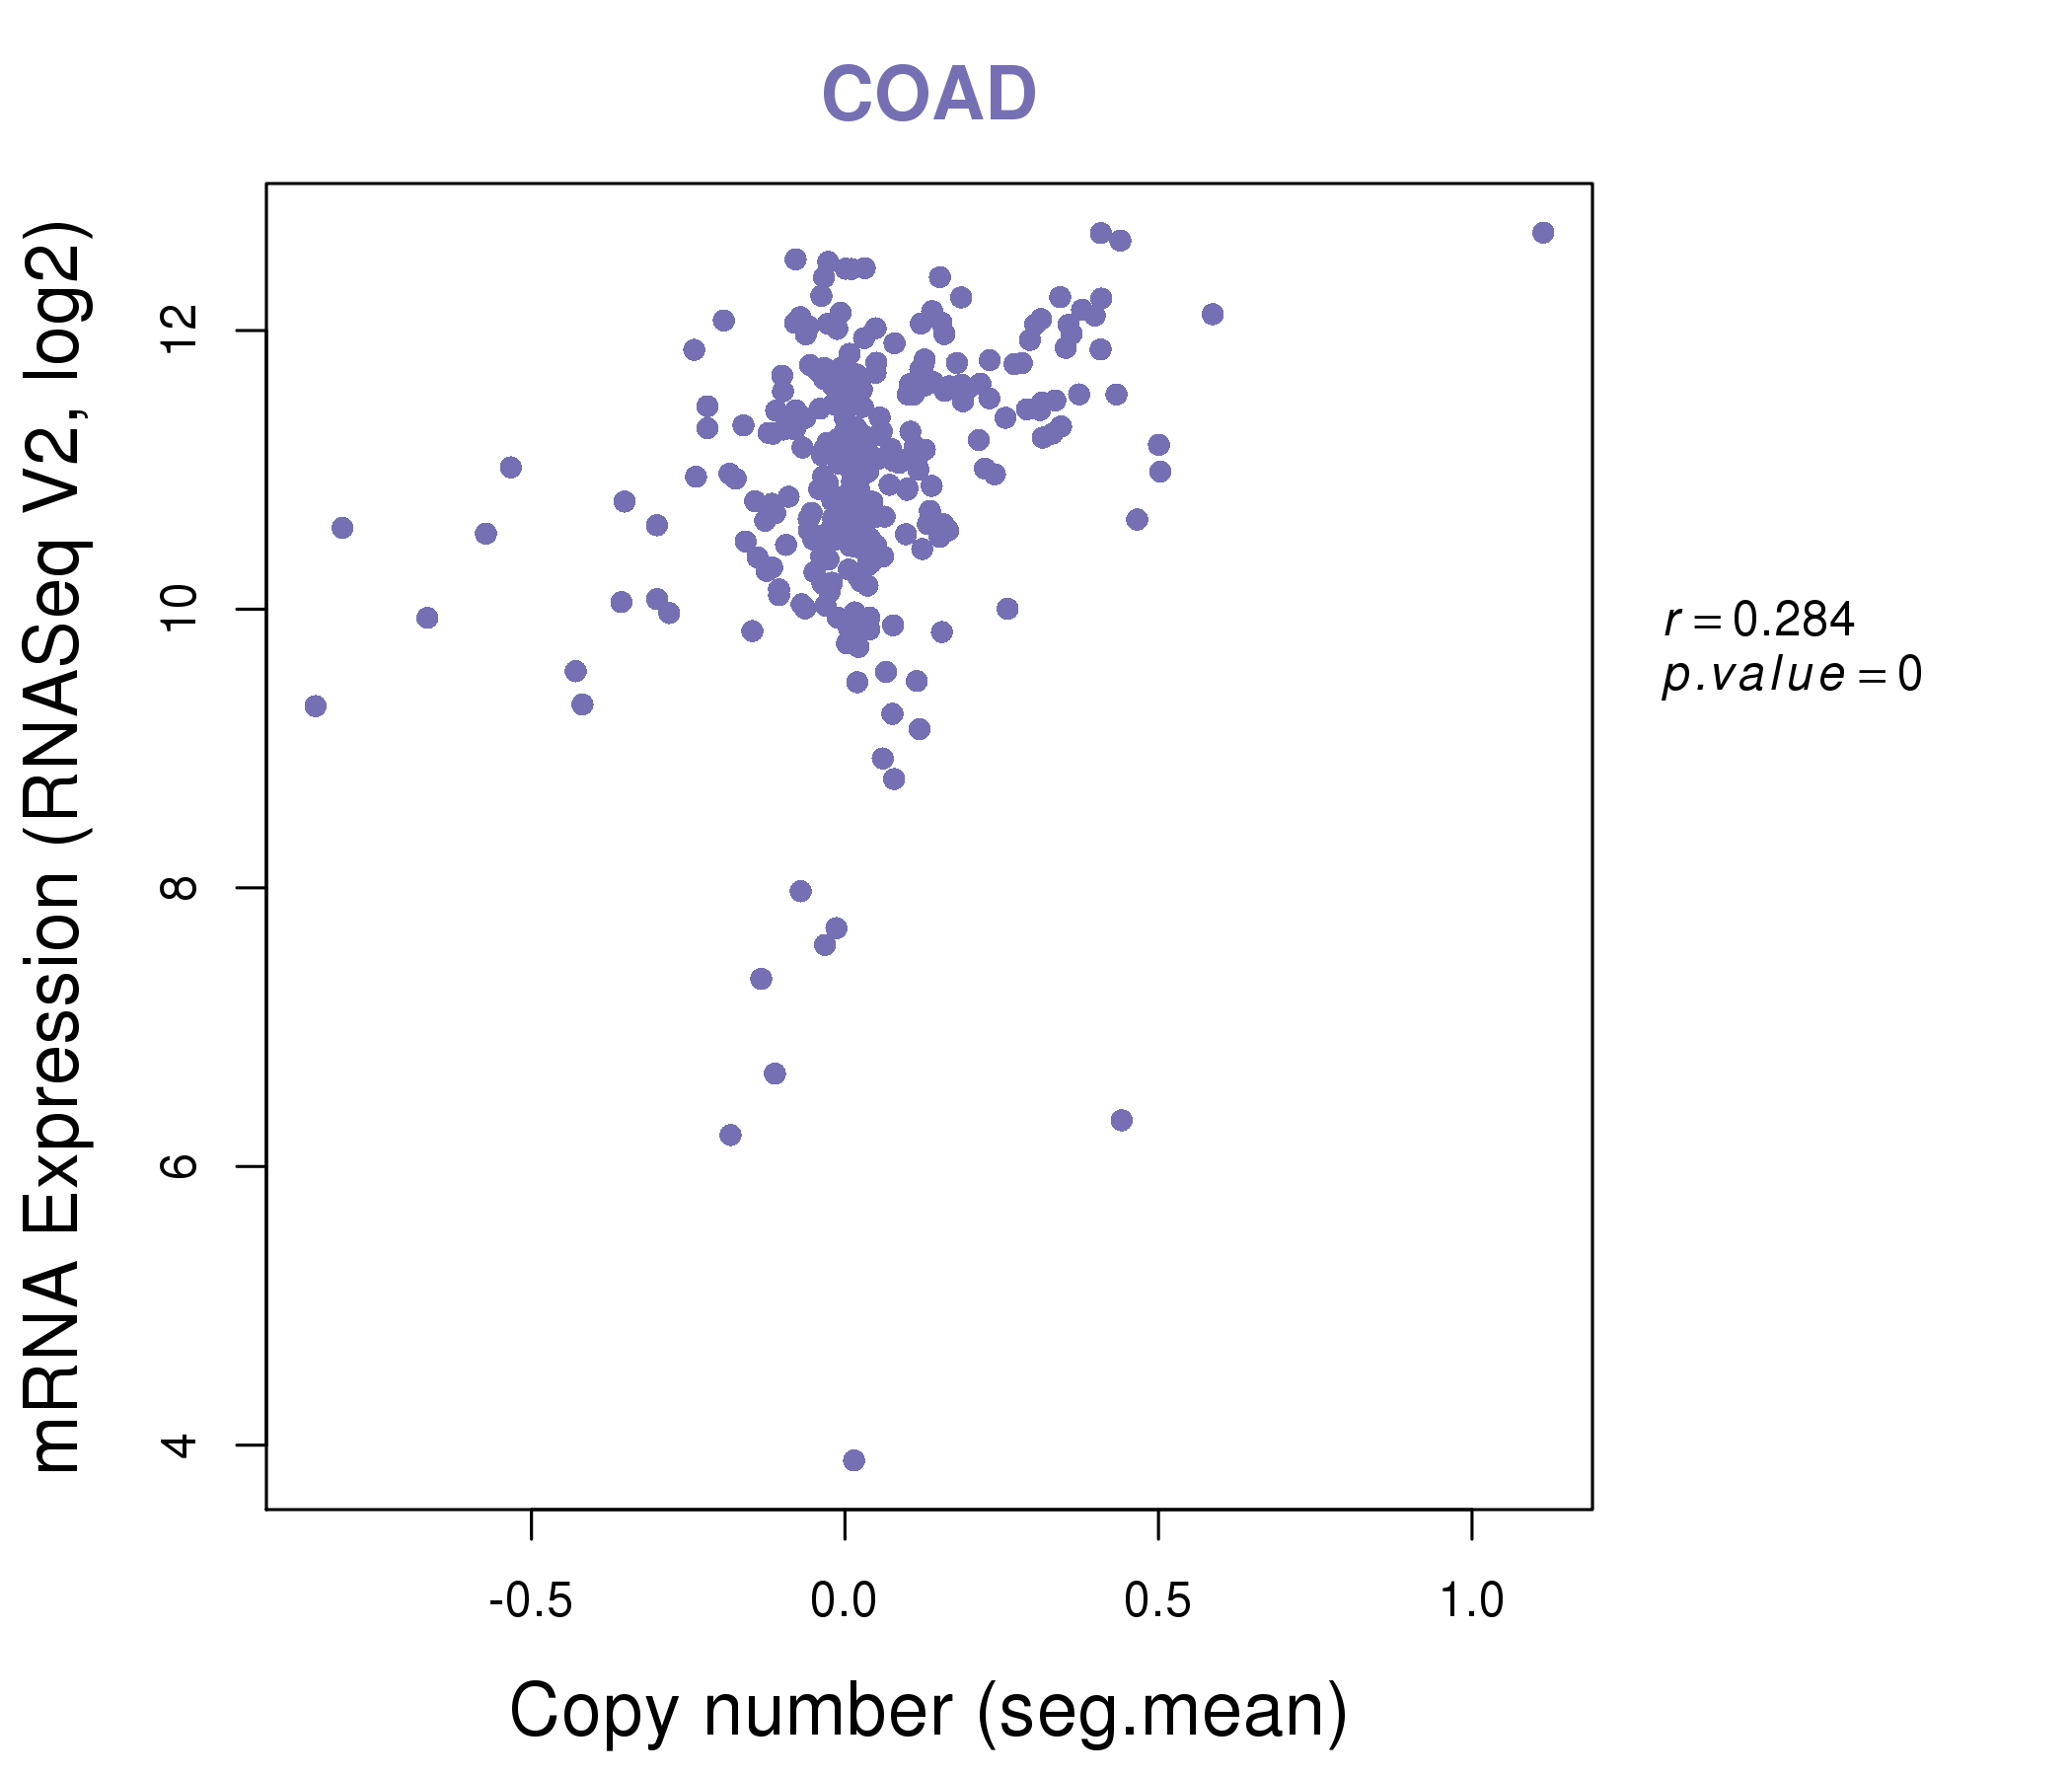
| * This plots show the correlation between CNV and gene expression. |
: Open all plots for all cancer types
 |
|
 |
|

| Top |
| Gene-Gene Network Information |
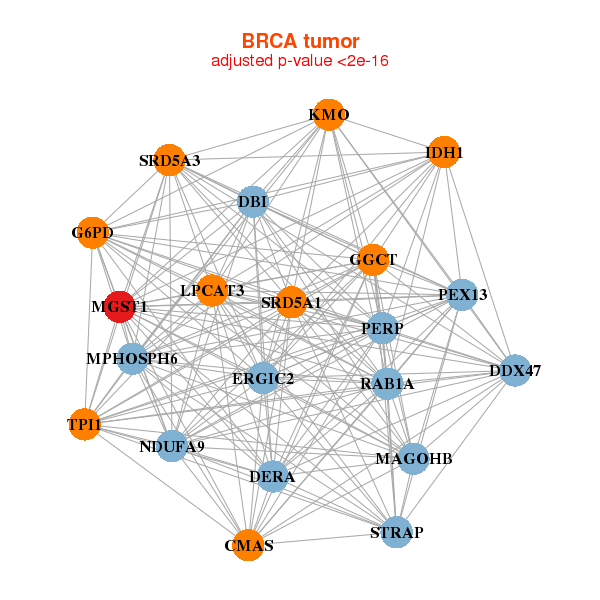
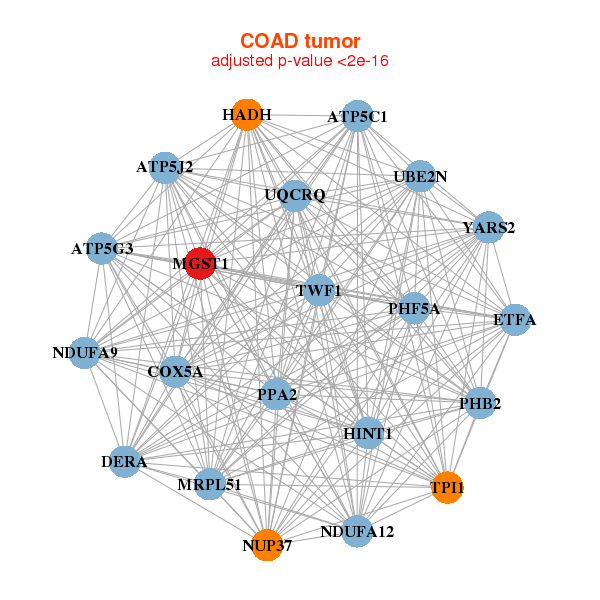
| * Co-Expression network figures were drawn using R package igraph. Only the top 20 genes with the highest correlations were shown. Red circle: input gene, orange circle: cell metabolism gene, sky circle: other gene |
: Open all plots for all cancer types
 |
| ||||
| CMAS,DBI,DDX47,DERA,ERGIC2,G6PD,GGCT, IDH1,KMO,LPCAT3,MAGOHB,MGST1,MPHOSPH6,NDUFA9, PERP,PEX13,RAB1A,SRD5A1,SRD5A3,STRAP,TPI1 | ACO1,ASPH,FAM213A,PQLC2L,CAV1,CAV2,HRASLS5, ITGB1BP1,MGST1,MMD,PALM2-AKAP2,PGRMC2,PLIN1,PLOD2, PRKAR2B,PYGL,RTN3,SORBS1,TK2,TSPAN3,VKORC1L1 | ||||
 |
| ||||
| ATP5C1,ATP5G3,ATP5J2,COX5A,DERA,ETFA,HADH, HINT1,MGST1,MRPL51,NDUFA12,NDUFA9,NUP37,PHB2, PHF5A,PPA2,TPI1,TWF1,UBE2N,UQCRQ,YARS2 | ADH1C,ARFIP1,ARL6IP1,CAAP1,MICU2,LHFPL3,MGST1, MIPEP,MRPS30,MTCH2,MYCBP,NUDT15,PDHX,PIGF, RTN4IP1,SCO1,SLC30A9,STEAP1,TMED5,TMX1,UQCRFS1 |
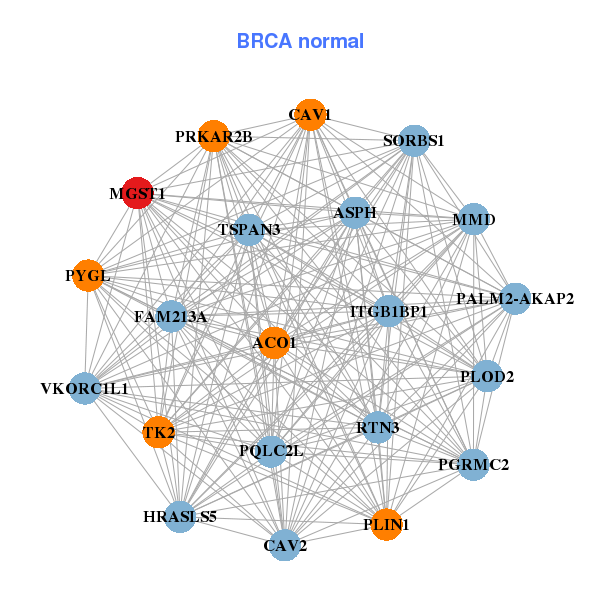
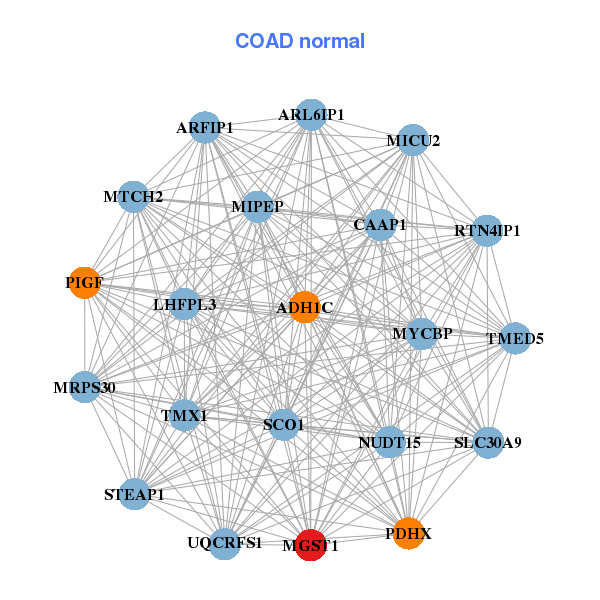
| * Co-Expression network figures were drawn using R package igraph. Only the top 20 genes with the highest correlations were shown. Red circle: input gene, orange circle: cell metabolism gene, sky circle: other gene |
: Open all plots for all cancer types
| Top |
: Open all interacting genes' information including KEGG pathway for all interacting genes from DAVID
| Top |
| Pharmacological Information for MGST1 |
| DB Category | DB Name | DB's ID and Url link |
| * Gene Centered Interaction Network. |
 |
| * Drug Centered Interaction Network. |
| DrugBank ID | Target Name | Drug Groups | Generic Name | Drug Centered Network | Drug Structure |
| DB00143 | microsomal glutathione S-transferase 1 | approved; nutraceutical | Glutathione |  |  |
| Top |
| Cross referenced IDs for MGST1 |
| * We obtained these cross-references from Uniprot database. It covers 150 different DBs, 18 categories. http://www.uniprot.org/help/cross_references_section |
: Open all cross reference information
|
Copyright © 2016-Present - The Univsersity of Texas Health Science Center at Houston @ |