|
||||||||||||||||||||
| |
| Phenotypic Information (metabolism pathway, cancer, disease, phenome) |
| |
| |
| Gene-Gene Network Information: Co-Expression Network, Interacting Genes & KEGG |
| |
|


| Gene Summary for MGST2 |
| Top |
| Phenotypic Information for MGST2(metabolism pathway, cancer, disease, phenome) |
| Cancer | CGAP: MGST2 |
| Familial Cancer Database: MGST2 | |
| * This gene is included in those cancer gene databases. |
|
|
|
|
|
|
| ||||||||||||||
Oncogene 1 | Significant driver gene in | |||||||||||||||||||
| cf) number; DB name 1 Oncogene; http://nar.oxfordjournals.org/content/35/suppl_1/D721.long, 2 Tumor Suppressor gene; https://bioinfo.uth.edu/TSGene/, 3 Cancer Gene Census; http://www.nature.com/nrc/journal/v4/n3/abs/nrc1299.html, 4 CancerGenes; http://nar.oxfordjournals.org/content/35/suppl_1/D721.long, 5 Network of Cancer Gene; http://ncg.kcl.ac.uk/index.php, 1Therapeutic Vulnerabilities in Cancer; http://cbio.mskcc.org/cancergenomics/statius/ |
| KEGG_GLUTATHIONE_METABOLISM KEGG_METABOLISM_OF_XENOBIOTICS_BY_CYTOCHROME_P450 KEGG_DRUG_METABOLISM_CYTOCHROME_P450 | |
| OMIM | |
| Orphanet | |
| Disease | KEGG Disease: MGST2 |
| MedGen: MGST2 (Human Medical Genetics with Condition) | |
| ClinVar: MGST2 | |
| Phenotype | MGI: MGST2 (International Mouse Phenotyping Consortium) |
| PhenomicDB: MGST2 | |
| Mutations for MGST2 |
| * Under tables are showing count per each tissue to give us broad intuition about tissue specific mutation patterns.You can go to the detailed page for each mutation database's web site. |
| - Statistics for Tissue and Mutation type | Top |
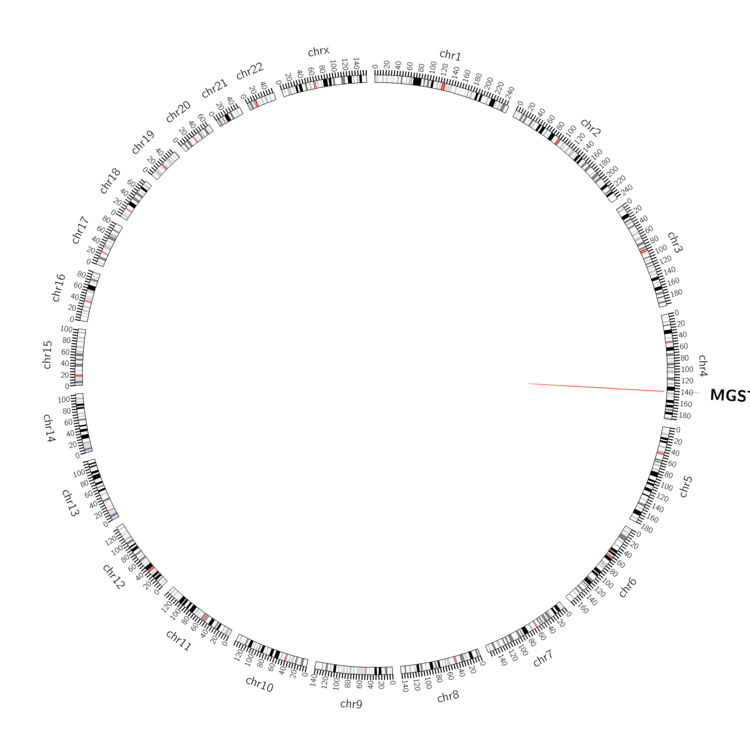 |
| - For Inter-chromosomal Variations |
| There's no inter-chromosomal structural variation. |
| - For Intra-chromosomal Variations |
| * Intra-chromosomal variantions includes 'intrachromosomal amplicon to amplicon', 'intrachromosomal amplicon to non-amplified dna', 'intrachromosomal deletion', 'intrachromosomal fold-back inversion', 'intrachromosomal inversion', 'intrachromosomal tandem duplication', 'Intrachromosomal unknown type', 'intrachromosomal with inverted orientation', 'intrachromosomal with non-inverted orientation'. |
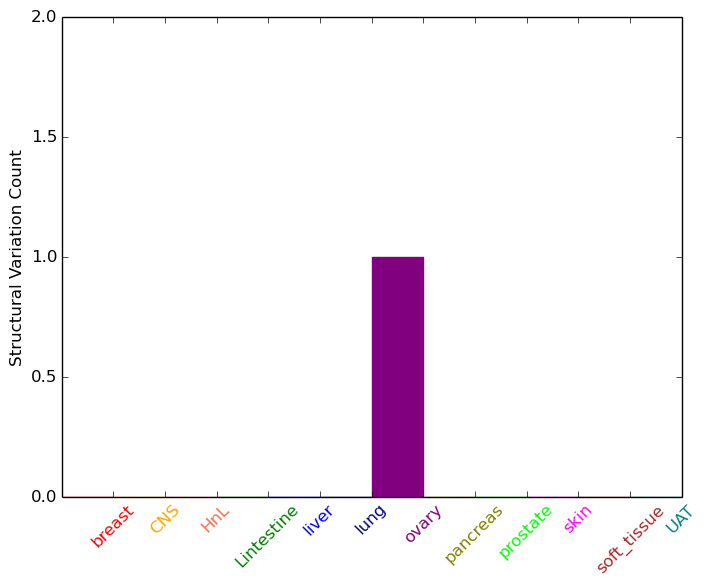 |
| Sample | Symbol_a | Chr_a | Start_a | End_a | Symbol_b | Chr_b | Start_b | End_b |
| ovary | MGST2 | chr4 | 140594739 | 140594759 | chr4 | 141693269 | 141693289 |
| cf) Tissue number; Tissue name (1;Breast, 2;Central_nervous_system, 3;Haematopoietic_and_lymphoid_tissue, 4;Large_intestine, 5;Liver, 6;Lung, 7;Ovary, 8;Pancreas, 9;Prostate, 10;Skin, 11;Soft_tissue, 12;Upper_aerodigestive_tract) |
| * From mRNA Sanger sequences, Chitars2.0 arranged chimeric transcripts. This table shows MGST2 related fusion information. |
| ID | Head Gene | Tail Gene | Accession | Gene_a | qStart_a | qEnd_a | Chromosome_a | tStart_a | tEnd_a | Gene_a | qStart_a | qEnd_a | Chromosome_a | tStart_a | tEnd_a |
| BG208010 | MGST2 | 1 | 56 | 4 | 140661367 | 140661422 | PRDX6 | 53 | 255 | 1 | 173450488 | 173454567 | |
| AB058719 | CYFIP2 | 1 | 175 | 5 | 156811175 | 156811349 | MGST2 | 176 | 5164 | 4 | 140639642 | 141075233 | |
| Top |
| There's no copy number variation information in COSMIC data for this gene. |
| Top |
|
 |
| Top |
| Stat. for Non-Synonymous SNVs (# total SNVs=5) | (# total SNVs=1) |
 |  |
(# total SNVs=1) | (# total SNVs=0) |
 |
| Top |
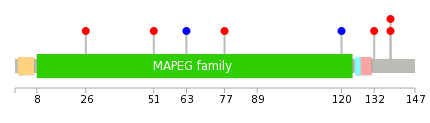
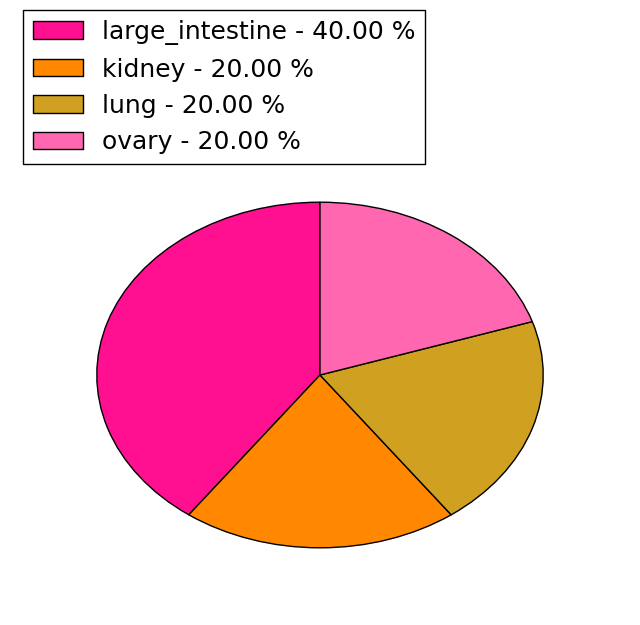
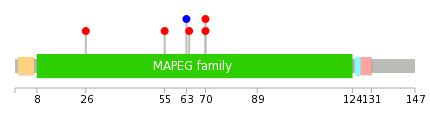
| * When you move the cursor on each content, you can see more deailed mutation information on the Tooltip. Those are primary_site,primary_histology,mutation(aa),pubmedID. |
| GRCh37 position | Mutation(aa) | Unique sampleID count |
| chr4:140624683-140624683 | p.K103fs*8 | 2 |
| chr4:140625270-140625270 | p.N138D | 2 |
| chr4:140599715-140599715 | p.V26A | 1 |
| chr4:140599789-140599789 | p.R51W | 1 |
| chr4:140616352-140616352 | p.Q54* | 1 |
| chr4:140616381-140616381 | p.F63F | 1 |
| chr4:140616421-140616421 | p.V77I | 1 |
| chr4:140624670-140624670 | p.Y97* | 1 |
| chr4:140625218-140625218 | p.L120L | 1 |
| chr4:140625252-140625252 | p.D132N | 1 |
| Top |
|
 |
| Point Mutation/ Tissue ID | 1 | 2 | 3 | 4 | 5 | 6 | 7 | 8 | 9 | 10 | 11 | 12 | 13 | 14 | 15 | 16 | 17 | 18 | 19 | 20 |
| # sample | 1 | 1 | 3 | 1 | ||||||||||||||||
| # mutation | 1 | 1 | 3 | 1 | ||||||||||||||||
| nonsynonymous SNV | 1 | 1 | 2 | 1 | ||||||||||||||||
| synonymous SNV | 1 |
| cf) Tissue ID; Tissue type (1; BLCA[Bladder Urothelial Carcinoma], 2; BRCA[Breast invasive carcinoma], 3; CESC[Cervical squamous cell carcinoma and endocervical adenocarcinoma], 4; COAD[Colon adenocarcinoma], 5; GBM[Glioblastoma multiforme], 6; Glioma Low Grade, 7; HNSC[Head and Neck squamous cell carcinoma], 8; KICH[Kidney Chromophobe], 9; KIRC[Kidney renal clear cell carcinoma], 10; KIRP[Kidney renal papillary cell carcinoma], 11; LAML[Acute Myeloid Leukemia], 12; LUAD[Lung adenocarcinoma], 13; LUSC[Lung squamous cell carcinoma], 14; OV[Ovarian serous cystadenocarcinoma ], 15; PAAD[Pancreatic adenocarcinoma], 16; PRAD[Prostate adenocarcinoma], 17; SKCM[Skin Cutaneous Melanoma], 18:STAD[Stomach adenocarcinoma], 19:THCA[Thyroid carcinoma], 20:UCEC[Uterine Corpus Endometrial Carcinoma]) |
| Top |
| * We represented just top 10 SNVs. When you move the cursor on each content, you can see more deailed mutation information on the Tooltip. Those are primary_site, primary_histology, mutation(aa), pubmedID. |
| Genomic Position | Mutation(aa) | Unique sampleID count |
| chr4:140625270 | p.N70D,MGST2 | 2 |
| chr4:140599715 | p.F63F,MGST2 | 1 |
| chr4:140616381 | p.A55T,MGST2 | 1 |
| chr4:140625225 | p.D64N,MGST2 | 1 |
| chr4:140625252 | p.V26A,MGST2 | 1 |
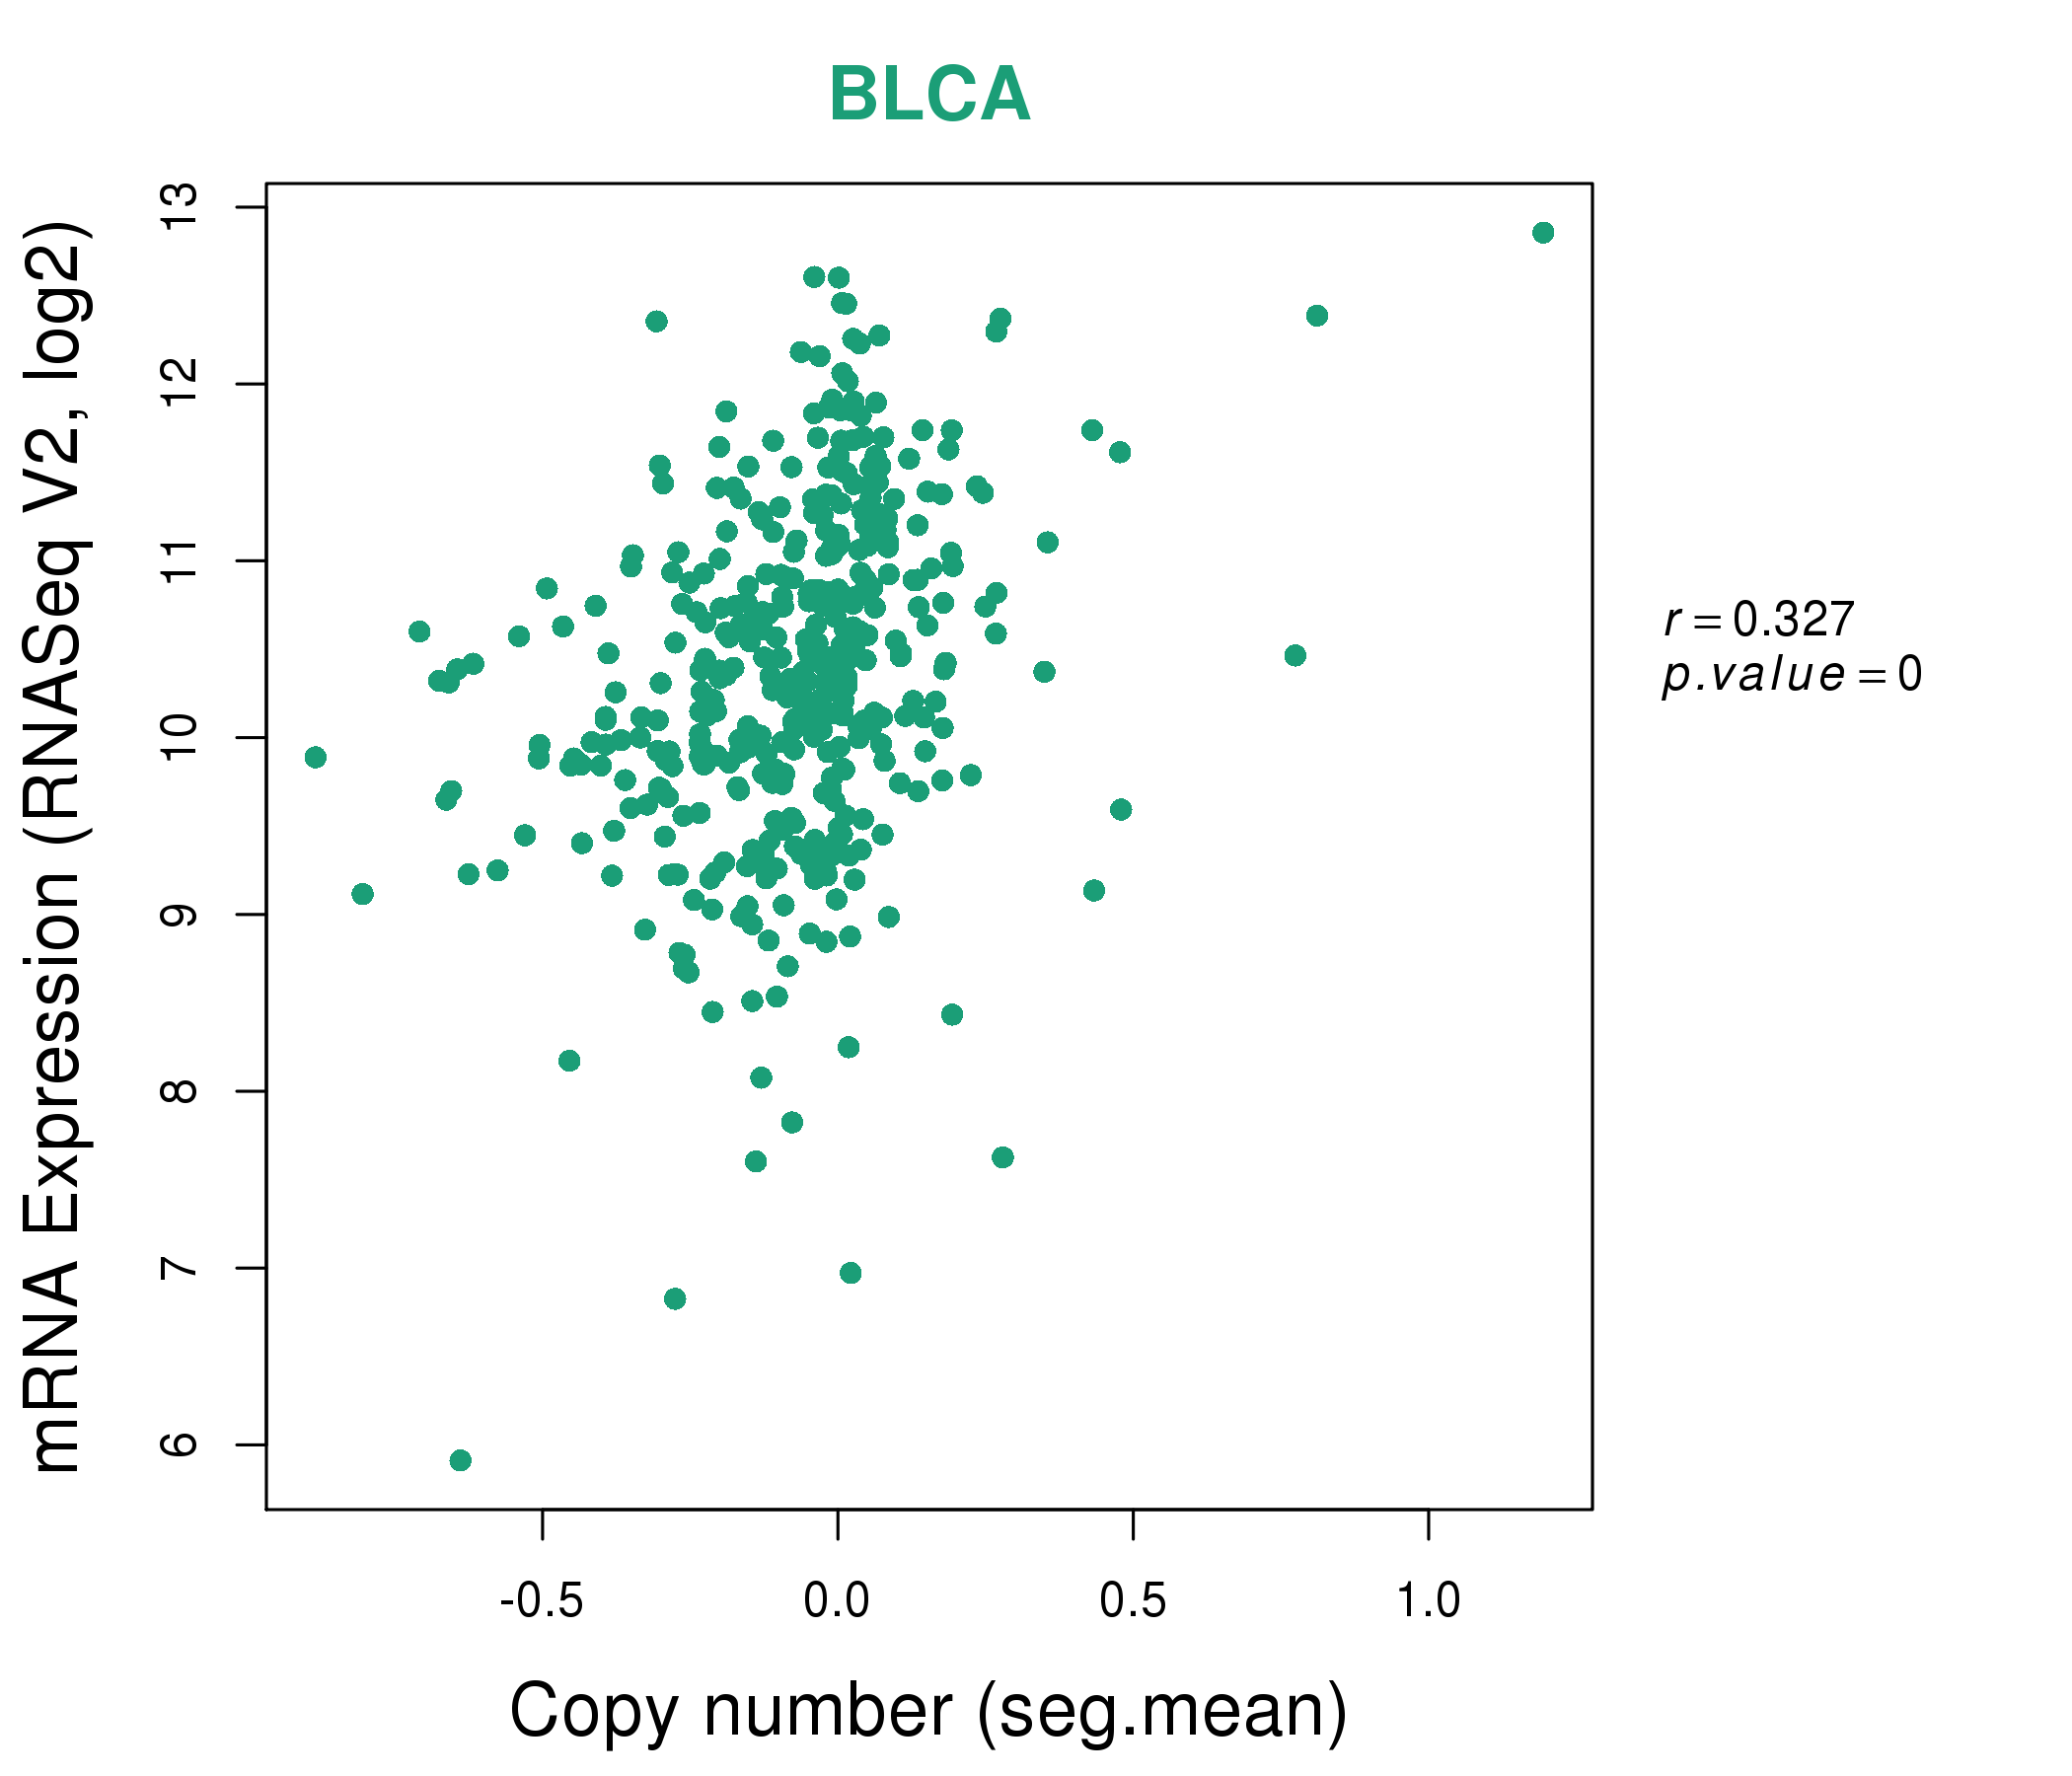
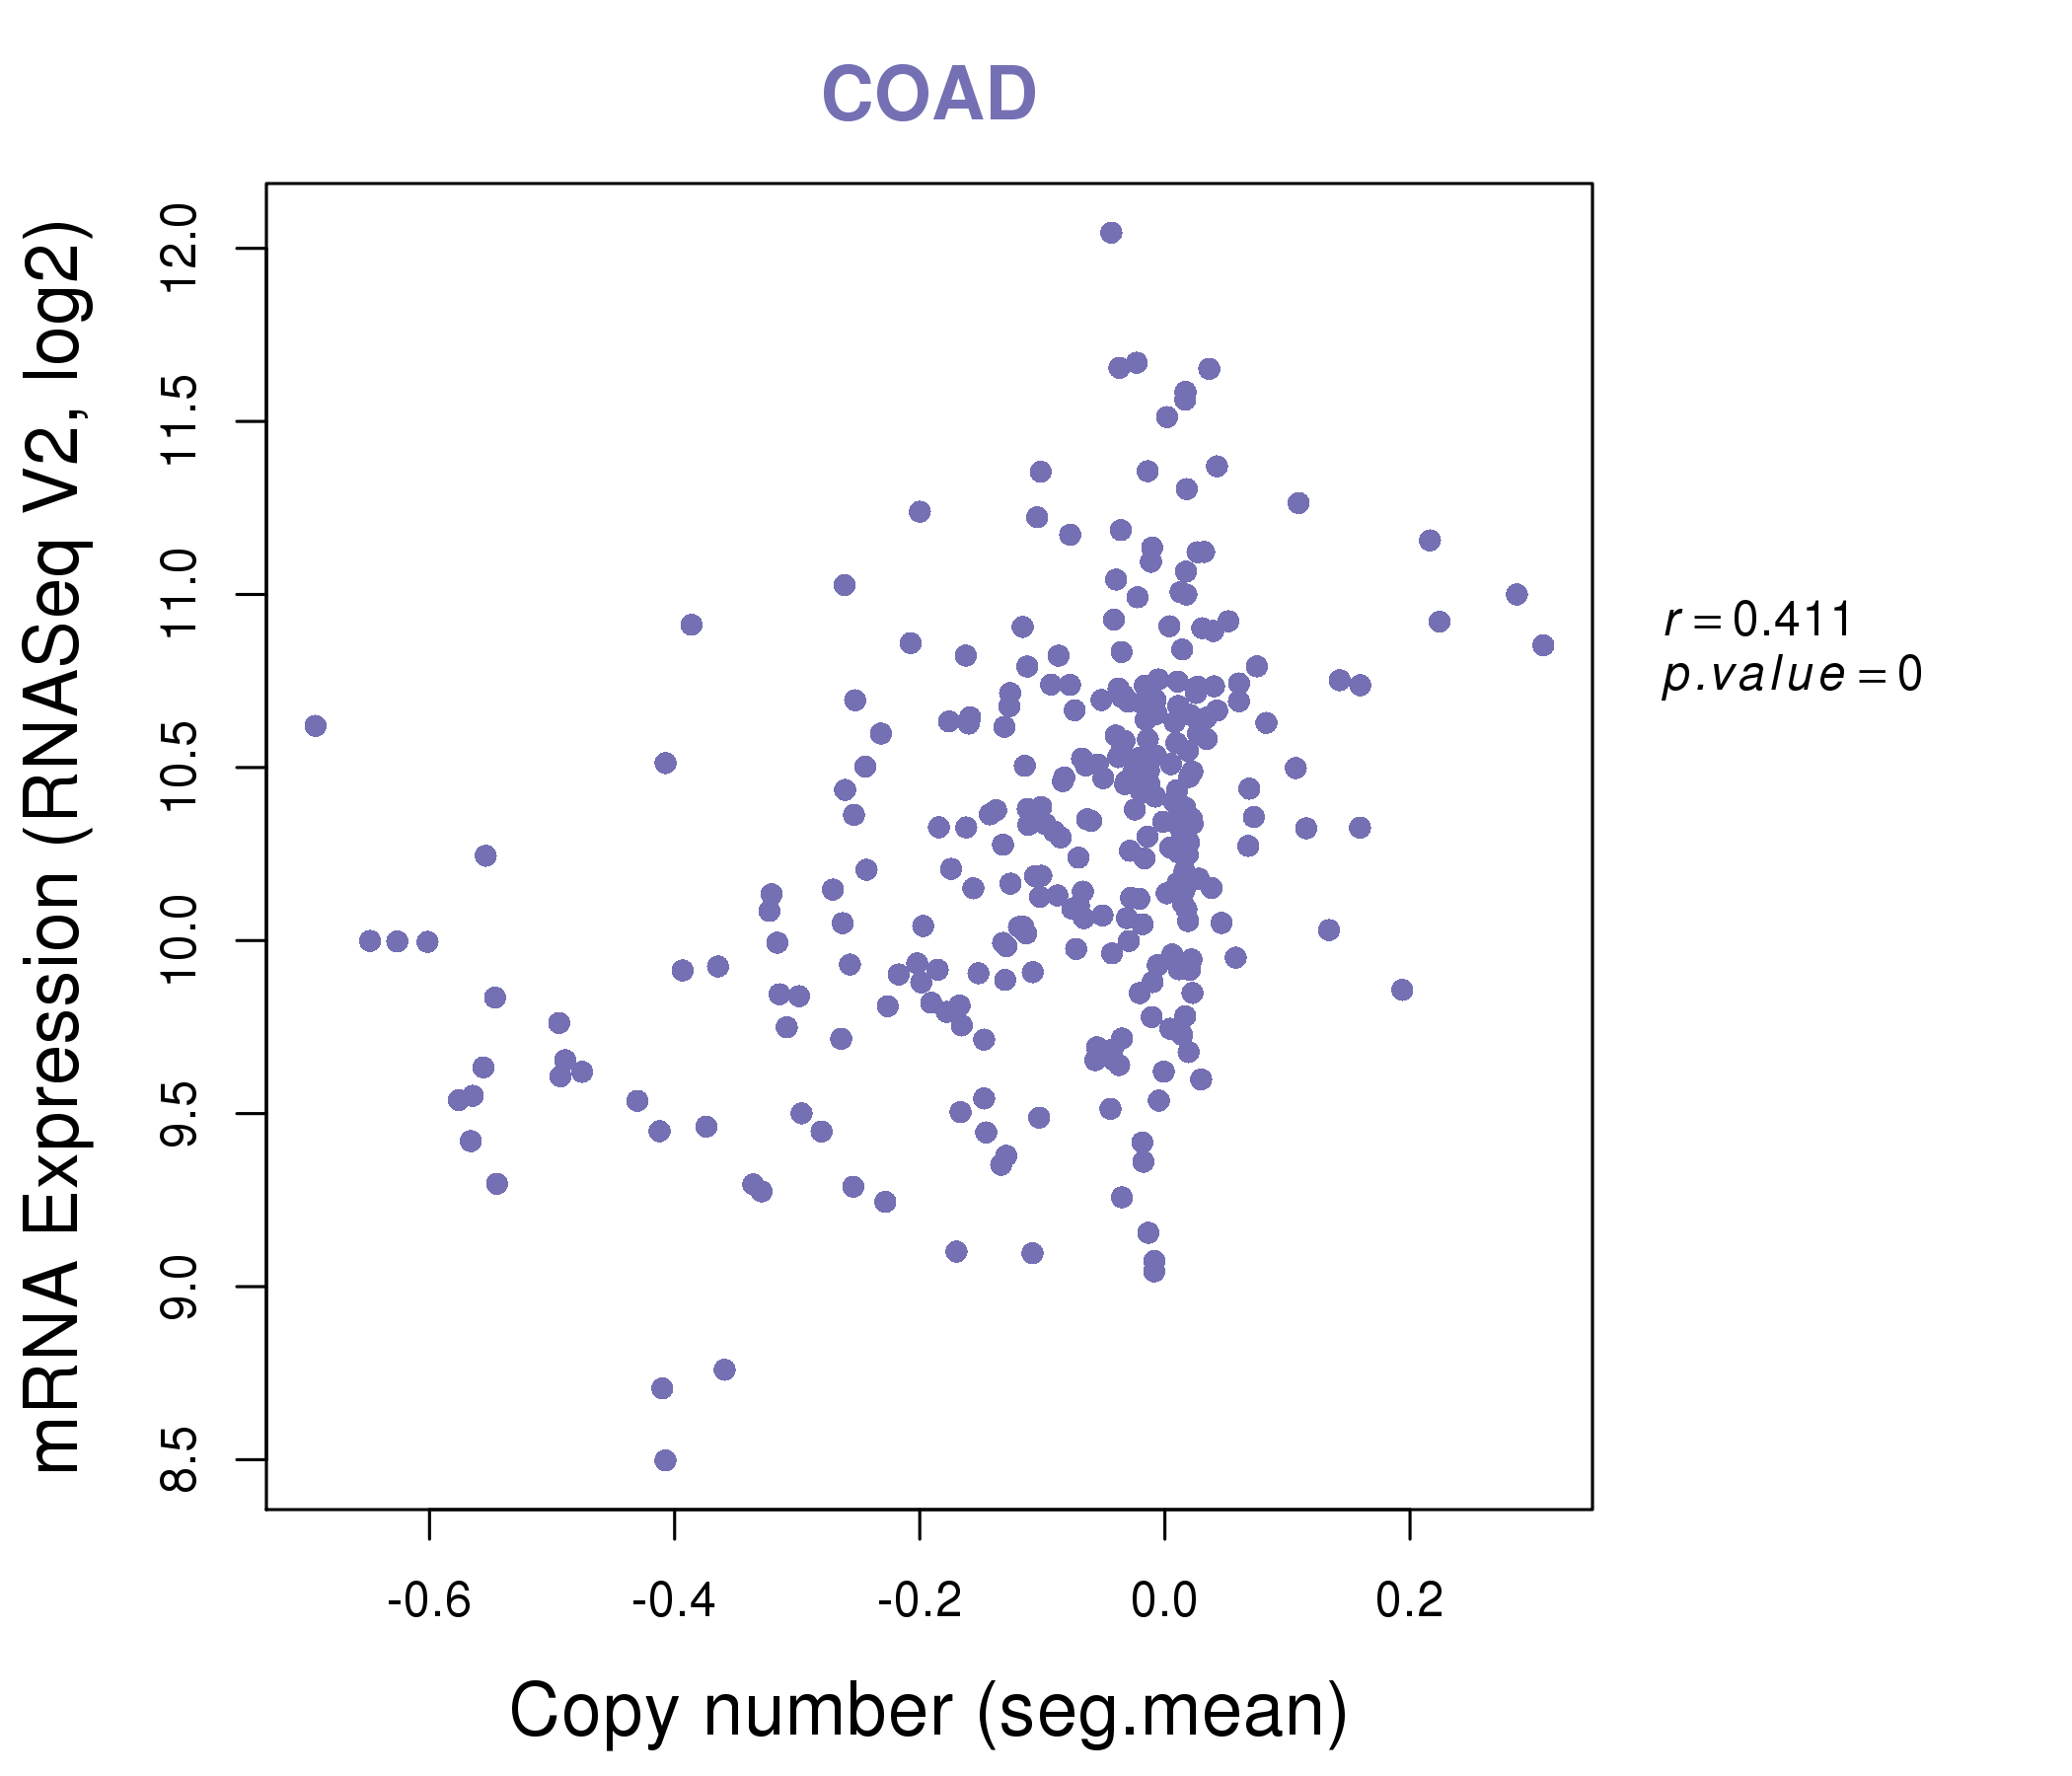
| * Copy number data were extracted from TCGA using R package TCGA-Assembler. The URLs of all public data files on TCGA DCC data server were gathered on Jan-05-2015. Function ProcessCNAData in TCGA-Assembler package was used to obtain gene-level copy number value which is calculated as the average copy number of the genomic region of a gene. |
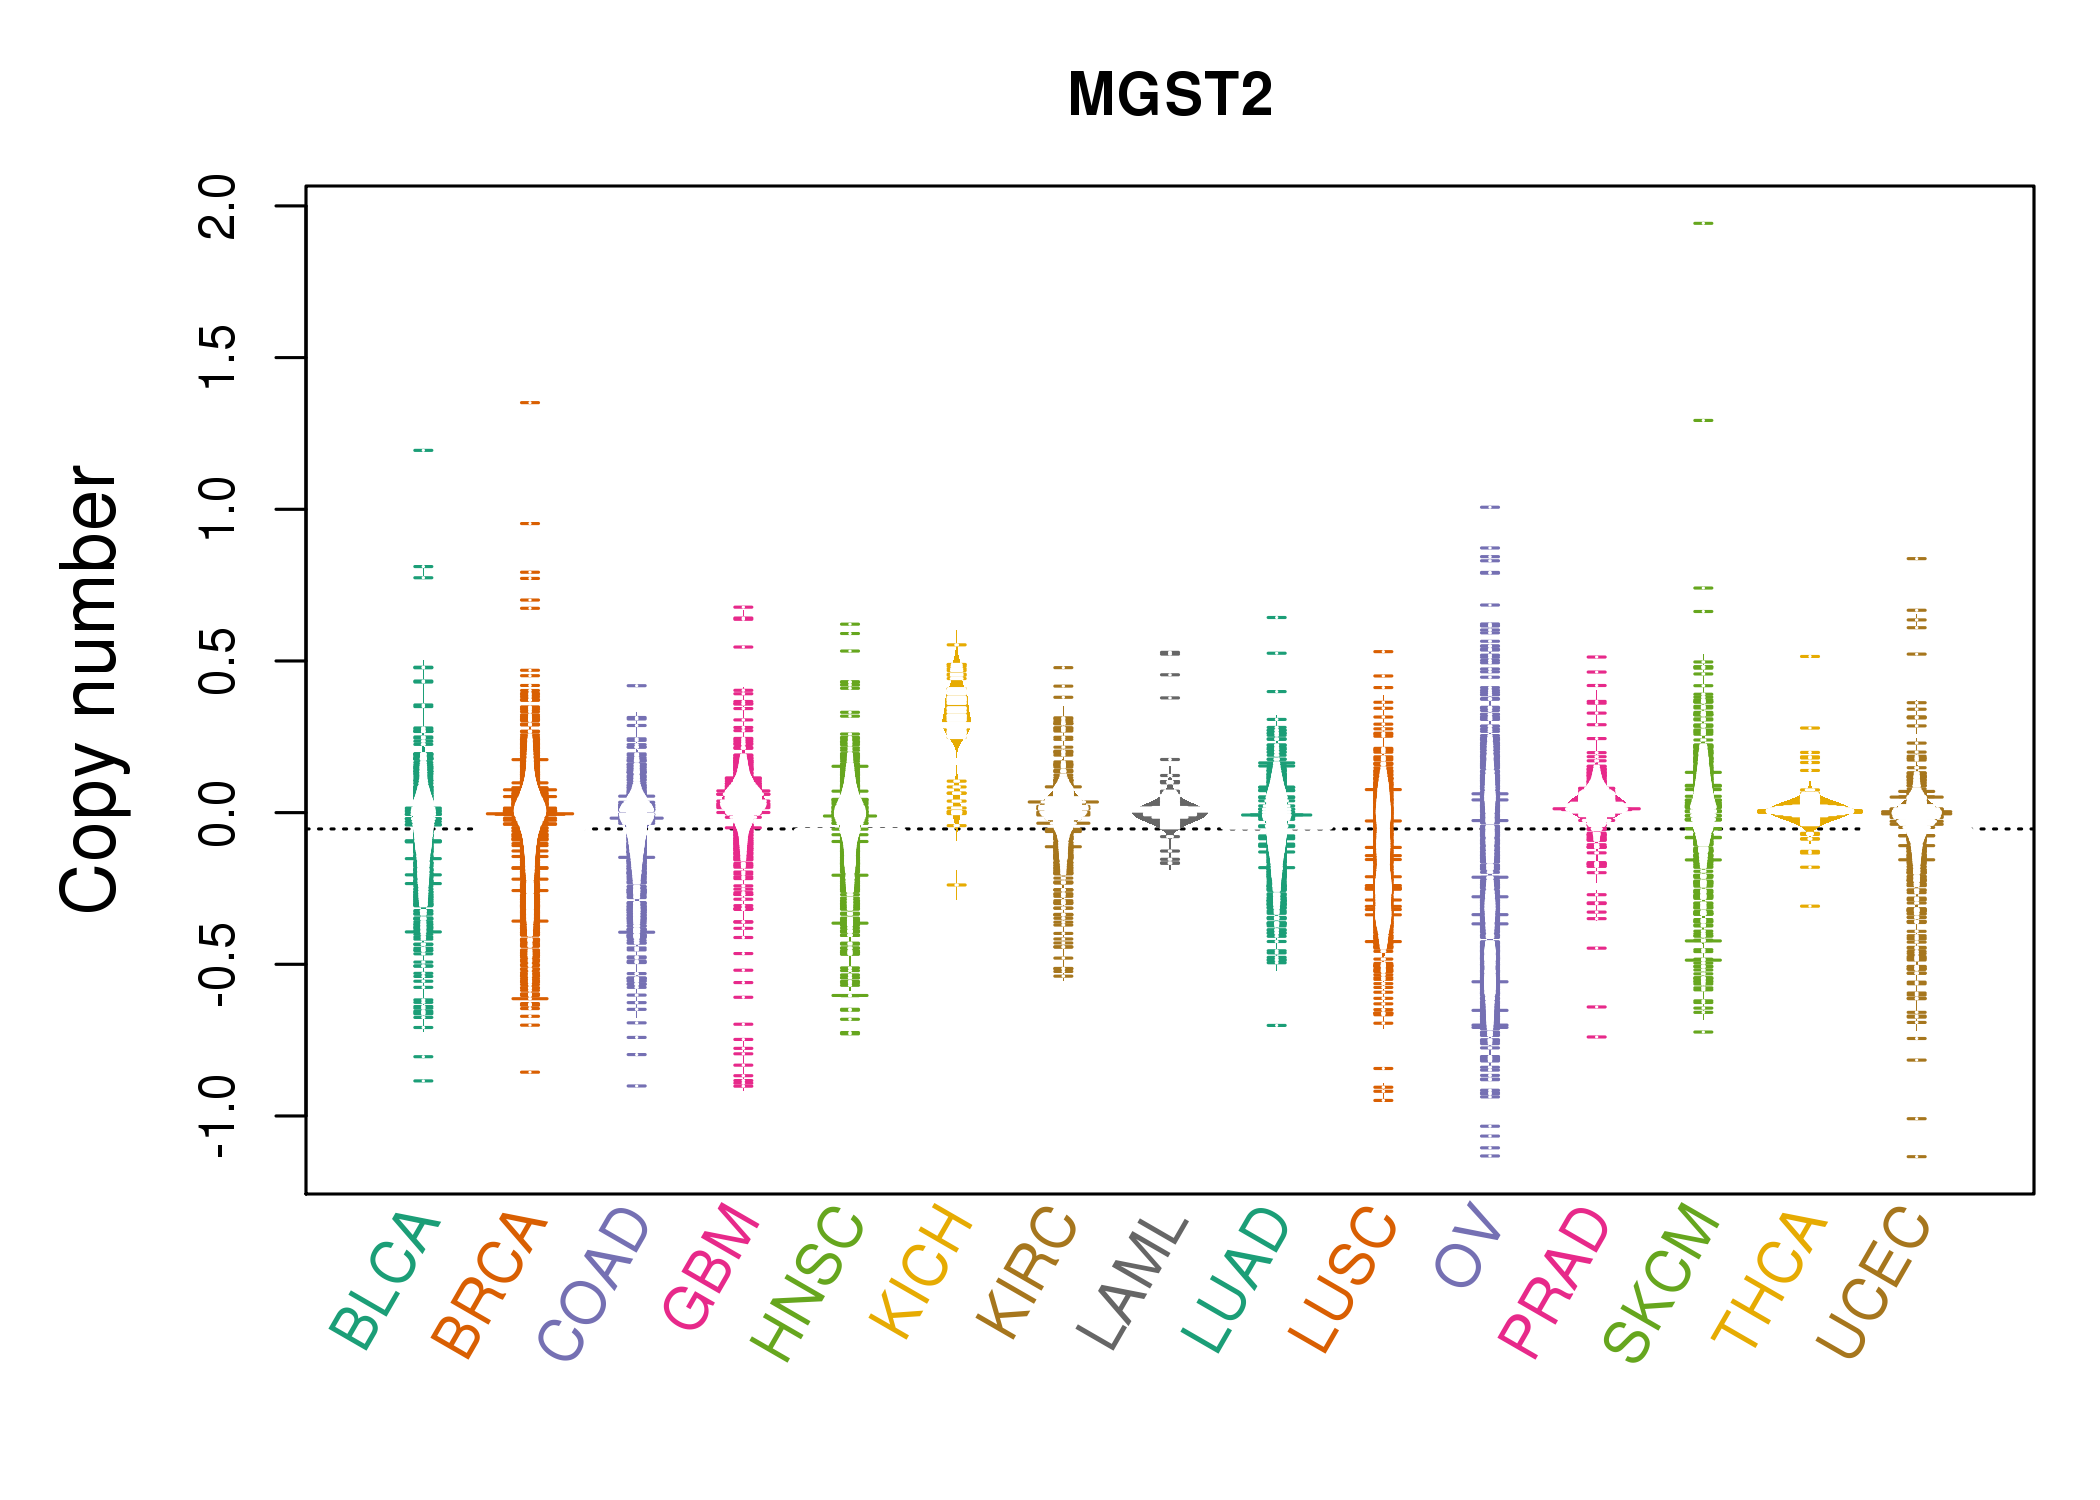 |
| cf) Tissue ID[Tissue type]: BLCA[Bladder Urothelial Carcinoma], BRCA[Breast invasive carcinoma], CESC[Cervical squamous cell carcinoma and endocervical adenocarcinoma], COAD[Colon adenocarcinoma], GBM[Glioblastoma multiforme], Glioma Low Grade, HNSC[Head and Neck squamous cell carcinoma], KICH[Kidney Chromophobe], KIRC[Kidney renal clear cell carcinoma], KIRP[Kidney renal papillary cell carcinoma], LAML[Acute Myeloid Leukemia], LUAD[Lung adenocarcinoma], LUSC[Lung squamous cell carcinoma], OV[Ovarian serous cystadenocarcinoma ], PAAD[Pancreatic adenocarcinoma], PRAD[Prostate adenocarcinoma], SKCM[Skin Cutaneous Melanoma], STAD[Stomach adenocarcinoma], THCA[Thyroid carcinoma], UCEC[Uterine Corpus Endometrial Carcinoma] |
| Top |
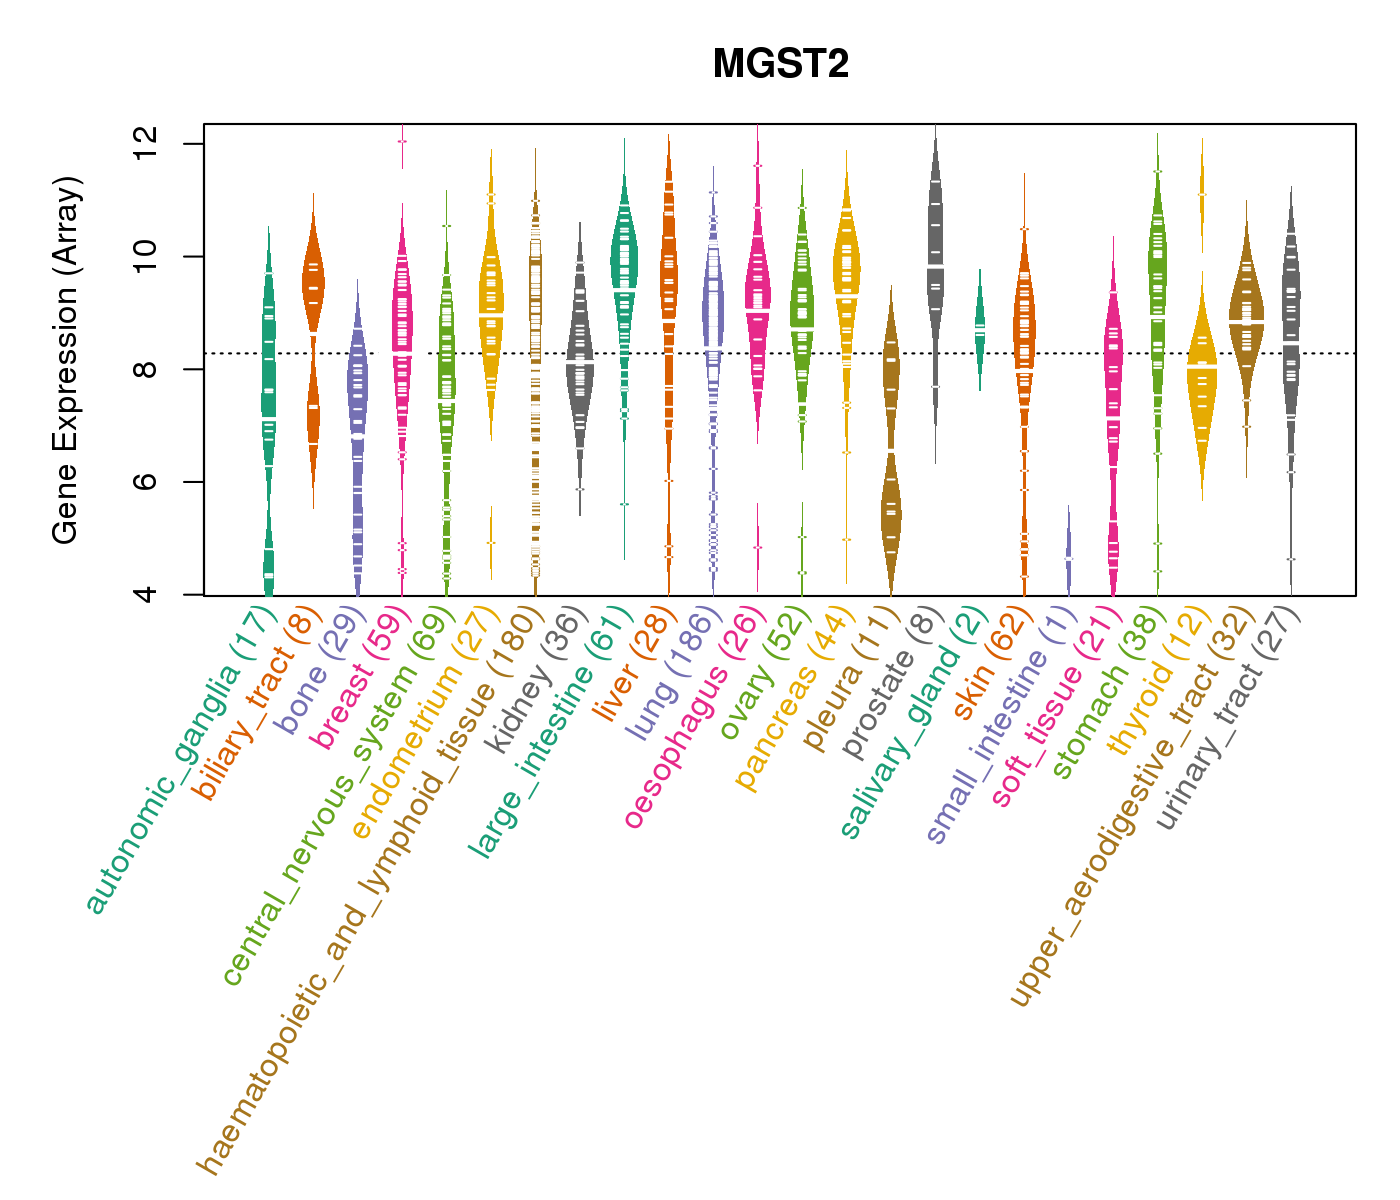
| Gene Expression for MGST2 |
| * CCLE gene expression data were extracted from CCLE_Expression_Entrez_2012-10-18.res: Gene-centric RMA-normalized mRNA expression data. |
 |
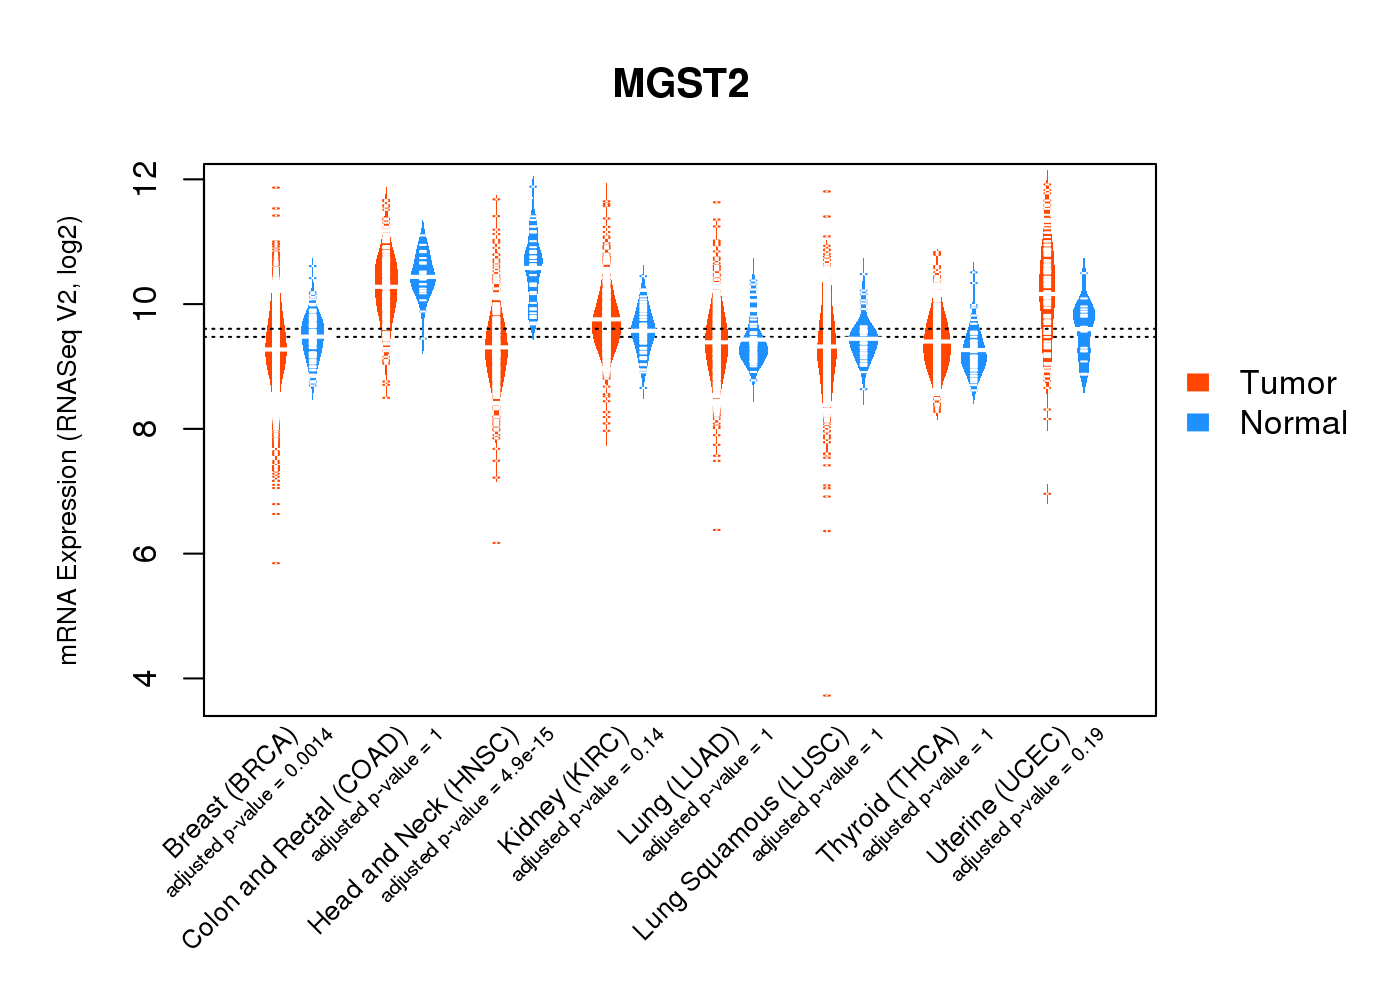
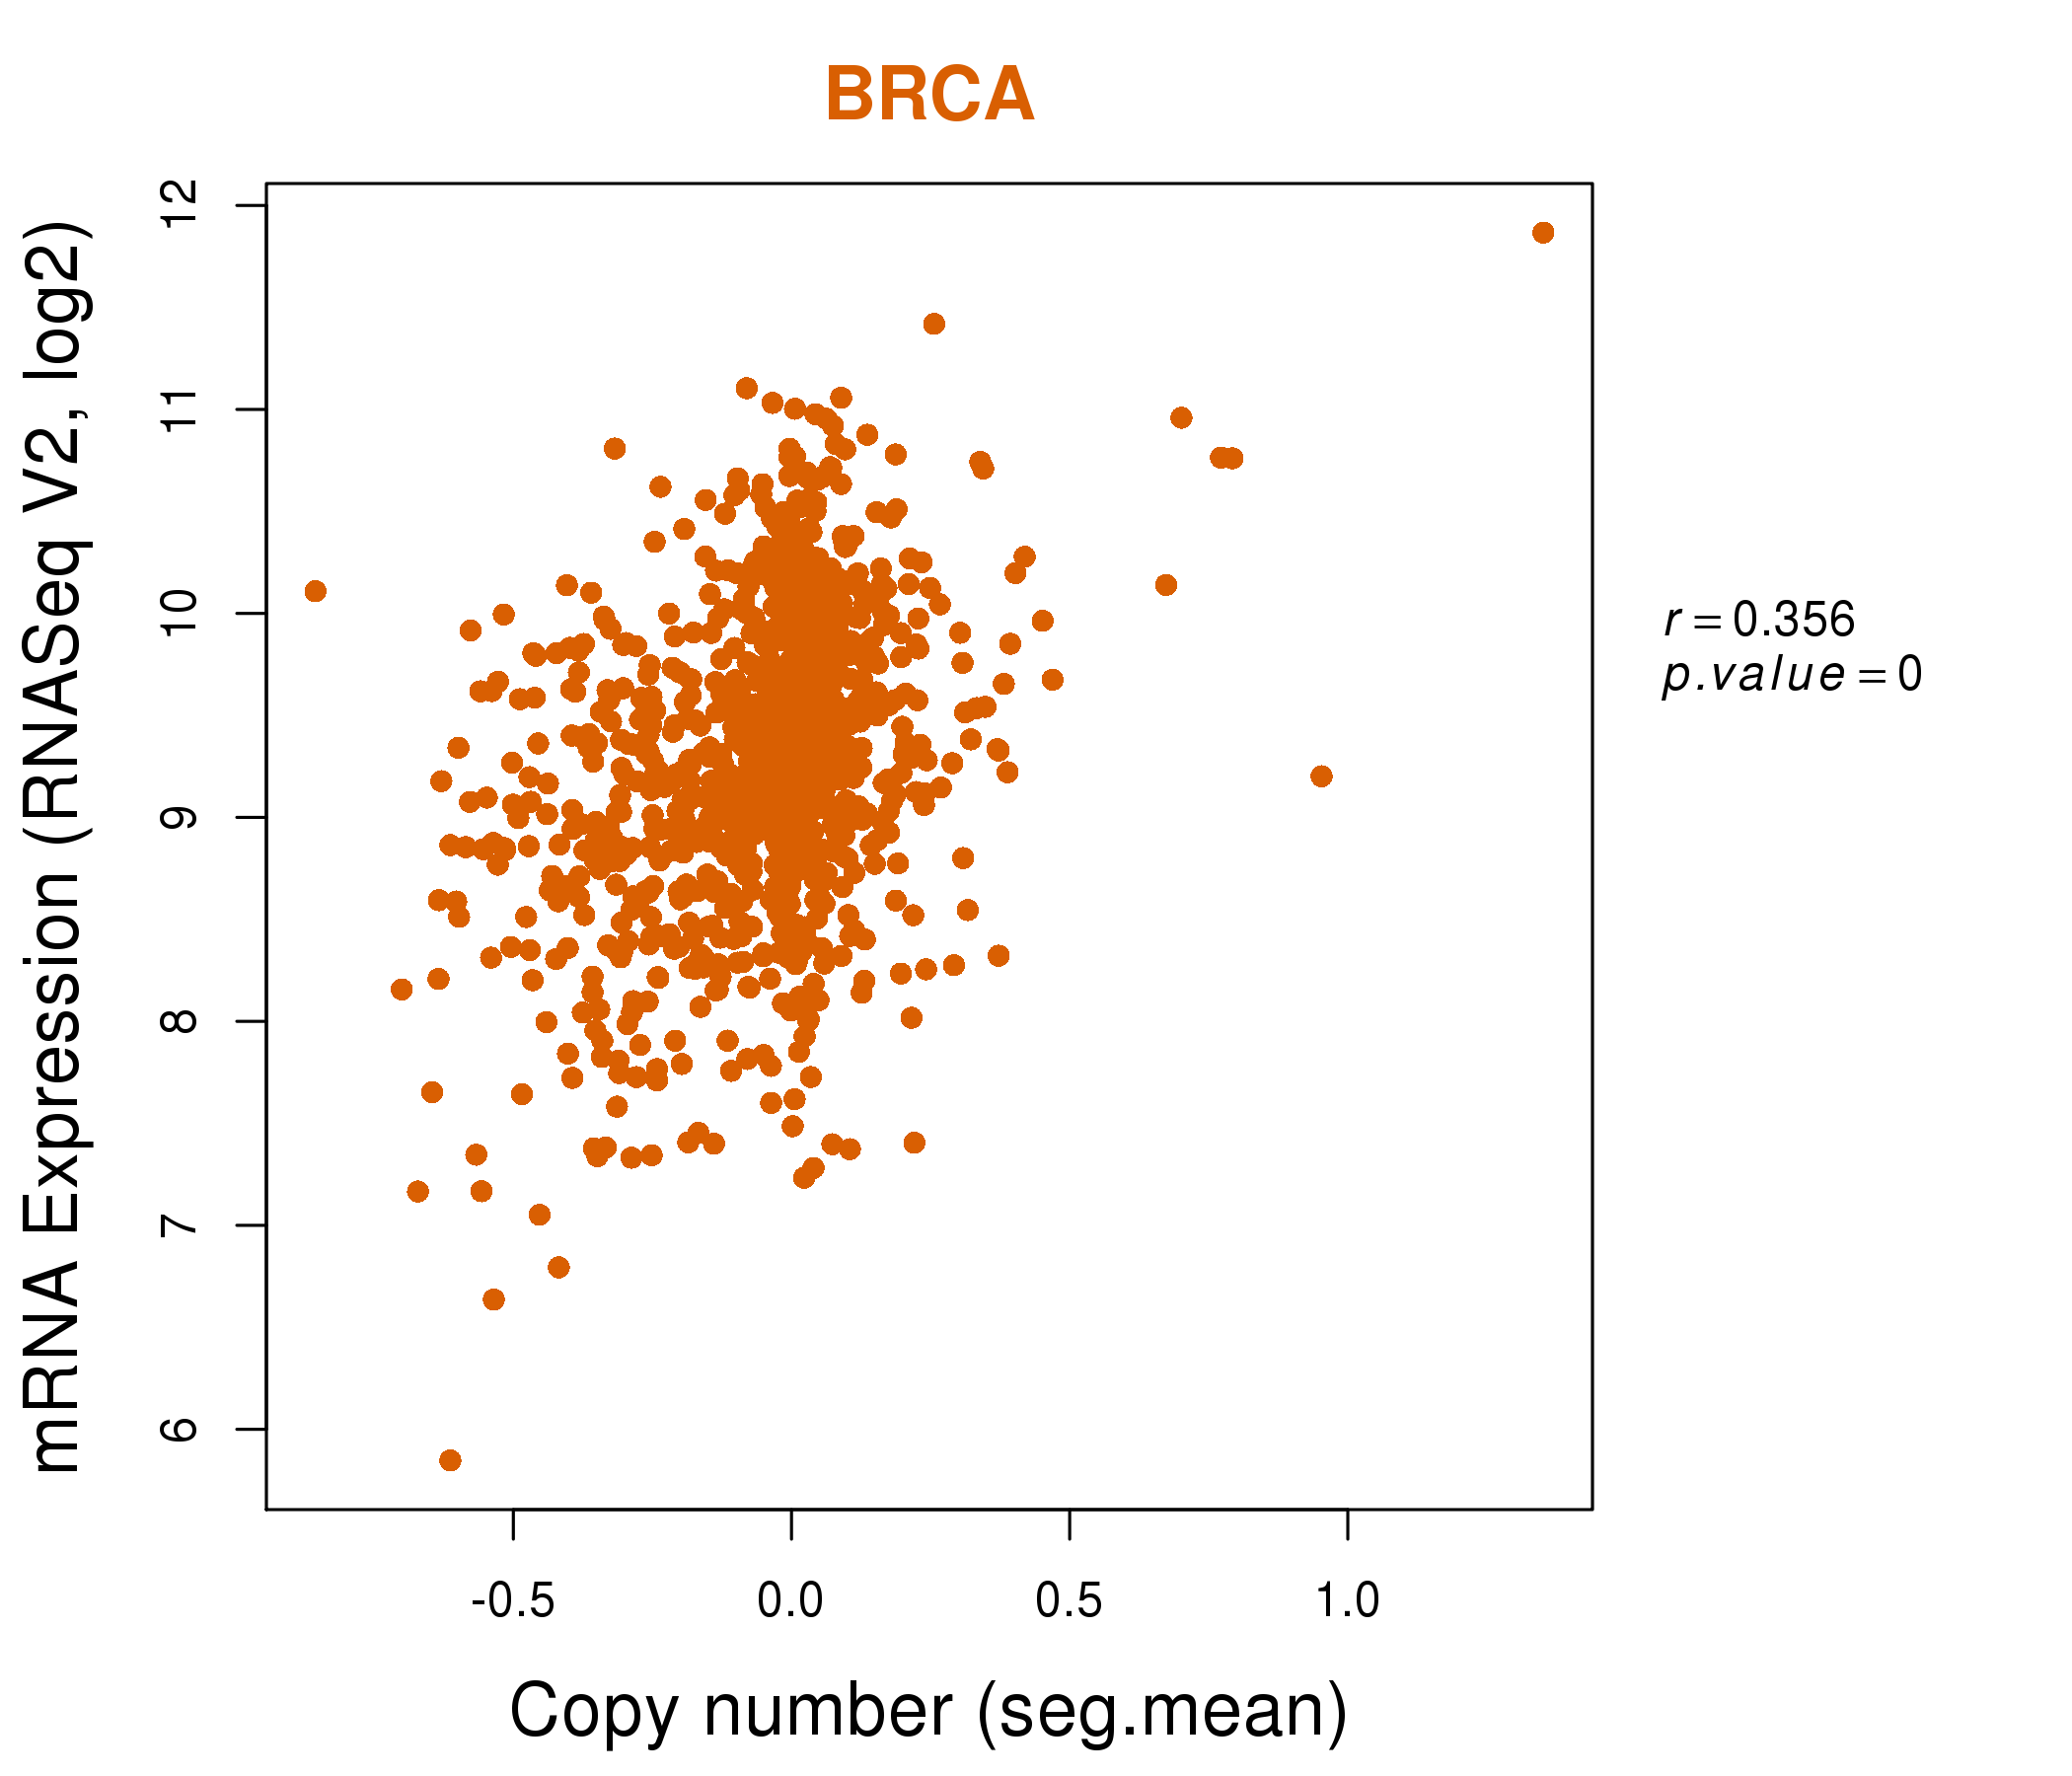
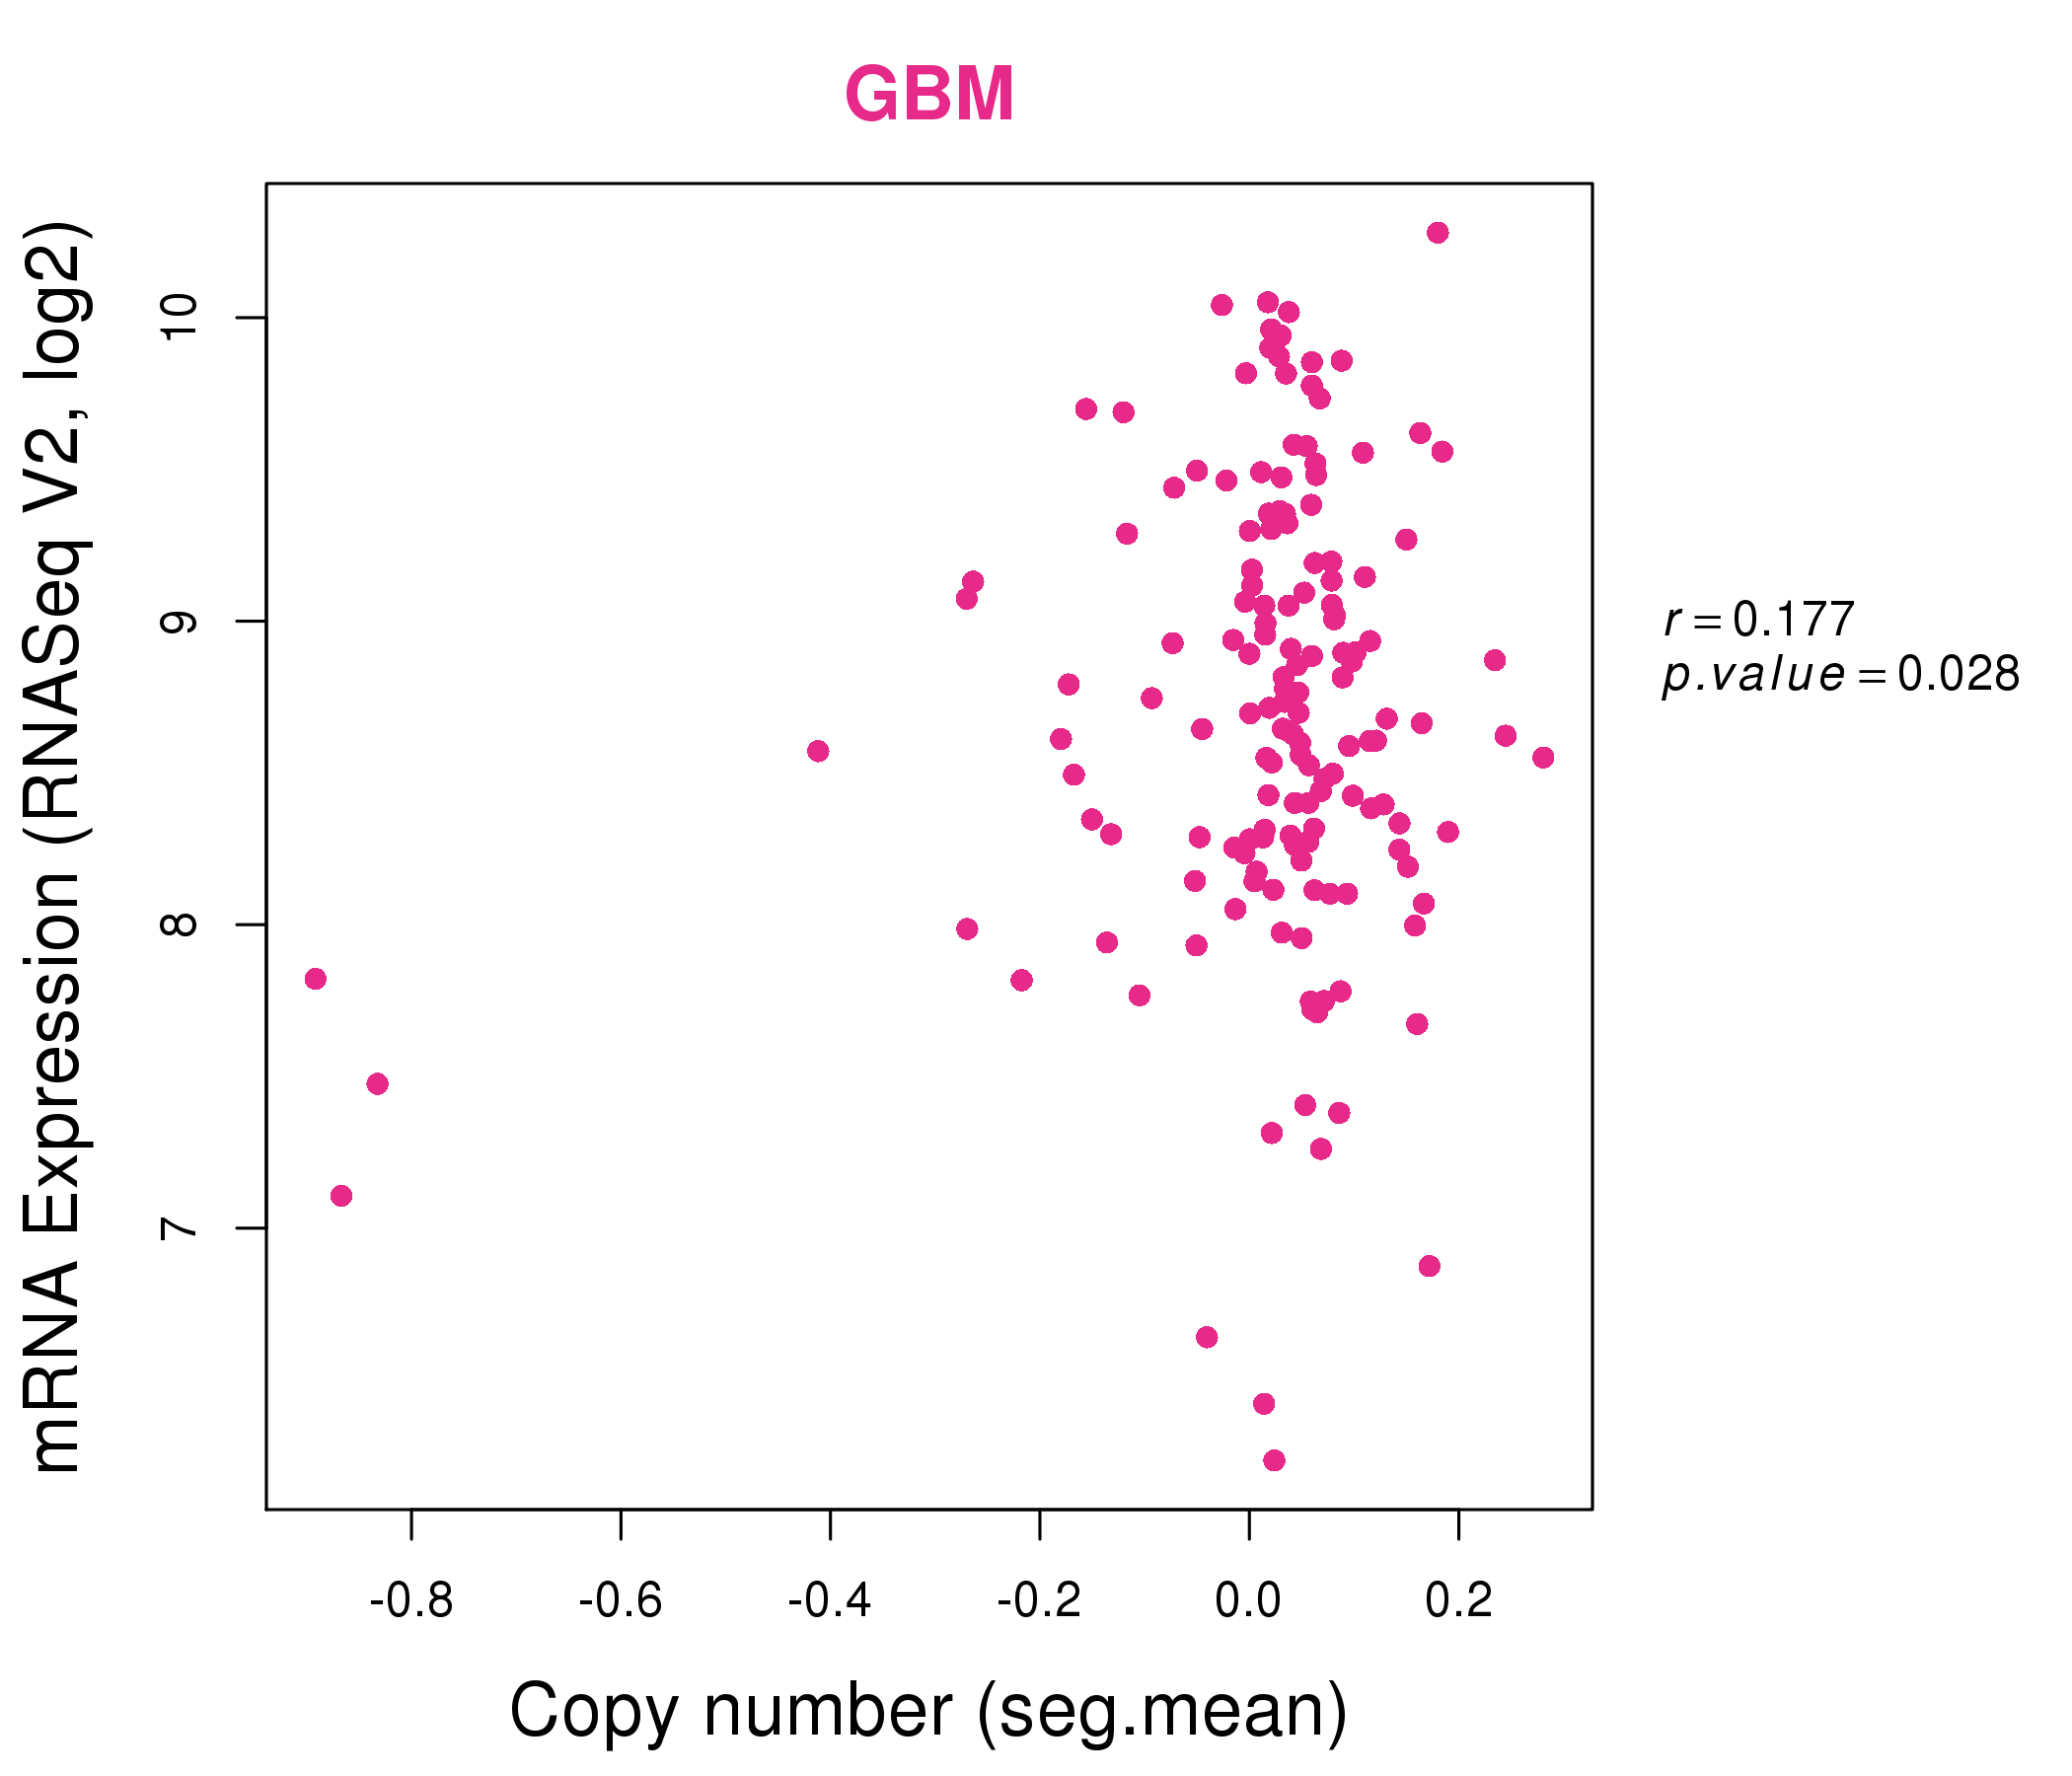
| * Normalized gene expression data of RNASeqV2 was extracted from TCGA using R package TCGA-Assembler. The URLs of all public data files on TCGA DCC data server were gathered at Jan-05-2015. Only eight cancer types have enough normal control samples for differential expression analysis. (t test, adjusted p<0.05 (using Benjamini-Hochberg FDR)) |
 |
| Top |
| * This plots show the correlation between CNV and gene expression. |
: Open all plots for all cancer types
 |
|
 |
|
| Top |
| Gene-Gene Network Information |
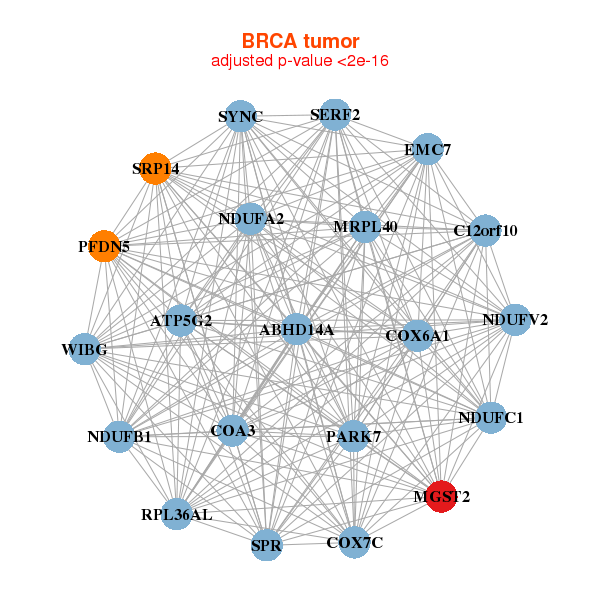
| * Co-Expression network figures were drawn using R package igraph. Only the top 20 genes with the highest correlations were shown. Red circle: input gene, orange circle: cell metabolism gene, sky circle: other gene |
: Open all plots for all cancer types
 |
| ||||
| ABHD14A,ATP5G2,C12orf10,EMC7,COA3,COX6A1,COX7C, MGST2,MRPL40,NDUFA2,NDUFB1,NDUFC1,NDUFV2,PARK7, PFDN5,RPL36AL,SERF2,SPR,SRP14,SYNC,WIBG | ATP6V0E1,CCDC53,DAD1,DYNLRB1,GABARAPL2,GNG5,GTF2A2, MGST2,NOP10,OST4,POLE4,POMP,PSMA3,RBX1, RHEB,RRAGA,SRP14,THOC7,TMEM14C,TOMM5,ZBTB8OS | ||||
 |
| ||||
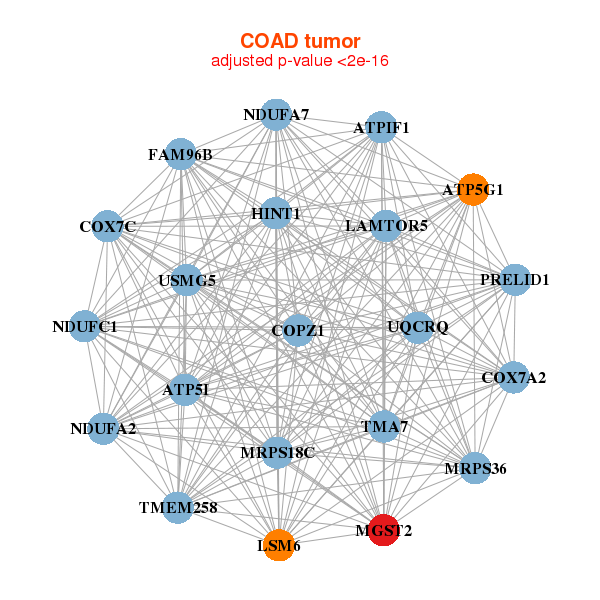
| ATP5G1,ATP5I,ATPIF1,TMEM258,TMA7,COPZ1,COX7A2, COX7C,FAM96B,LAMTOR5,HINT1,LSM6,MGST2,MRPS18C, MRPS36,NDUFA2,NDUFA7,NDUFC1,PRELID1,UQCRQ,USMG5 | ATPIF1,MPC2,CASP6,CCL15,CENPV,GLOD4,HOXB7, JAGN1,MGST2,MRPS36,NDUFC1,NDUFC2,S100A14,SPCS1, SS18L2,SUCLG1,TMEM106C,UBAC2,UQCRQ,VPS25,ZBTB8OS |

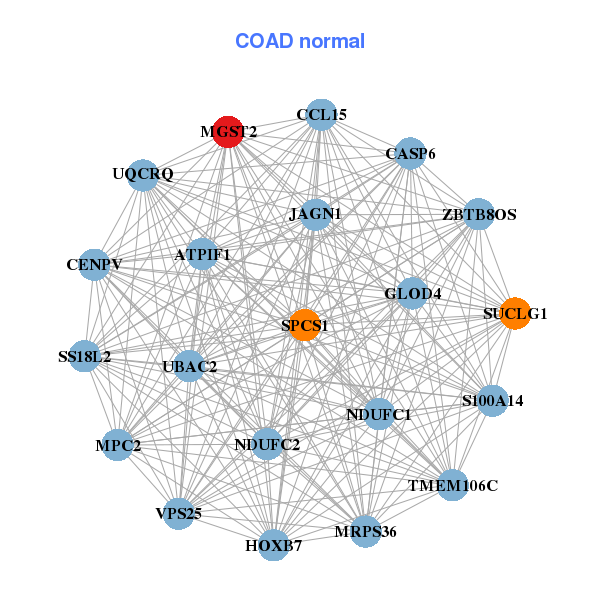
| * Co-Expression network figures were drawn using R package igraph. Only the top 20 genes with the highest correlations were shown. Red circle: input gene, orange circle: cell metabolism gene, sky circle: other gene |
: Open all plots for all cancer types
| Top |
: Open all interacting genes' information including KEGG pathway for all interacting genes from DAVID
| Top |
| Pharmacological Information for MGST2 |
| DB Category | DB Name | DB's ID and Url link |
| * Gene Centered Interaction Network. |
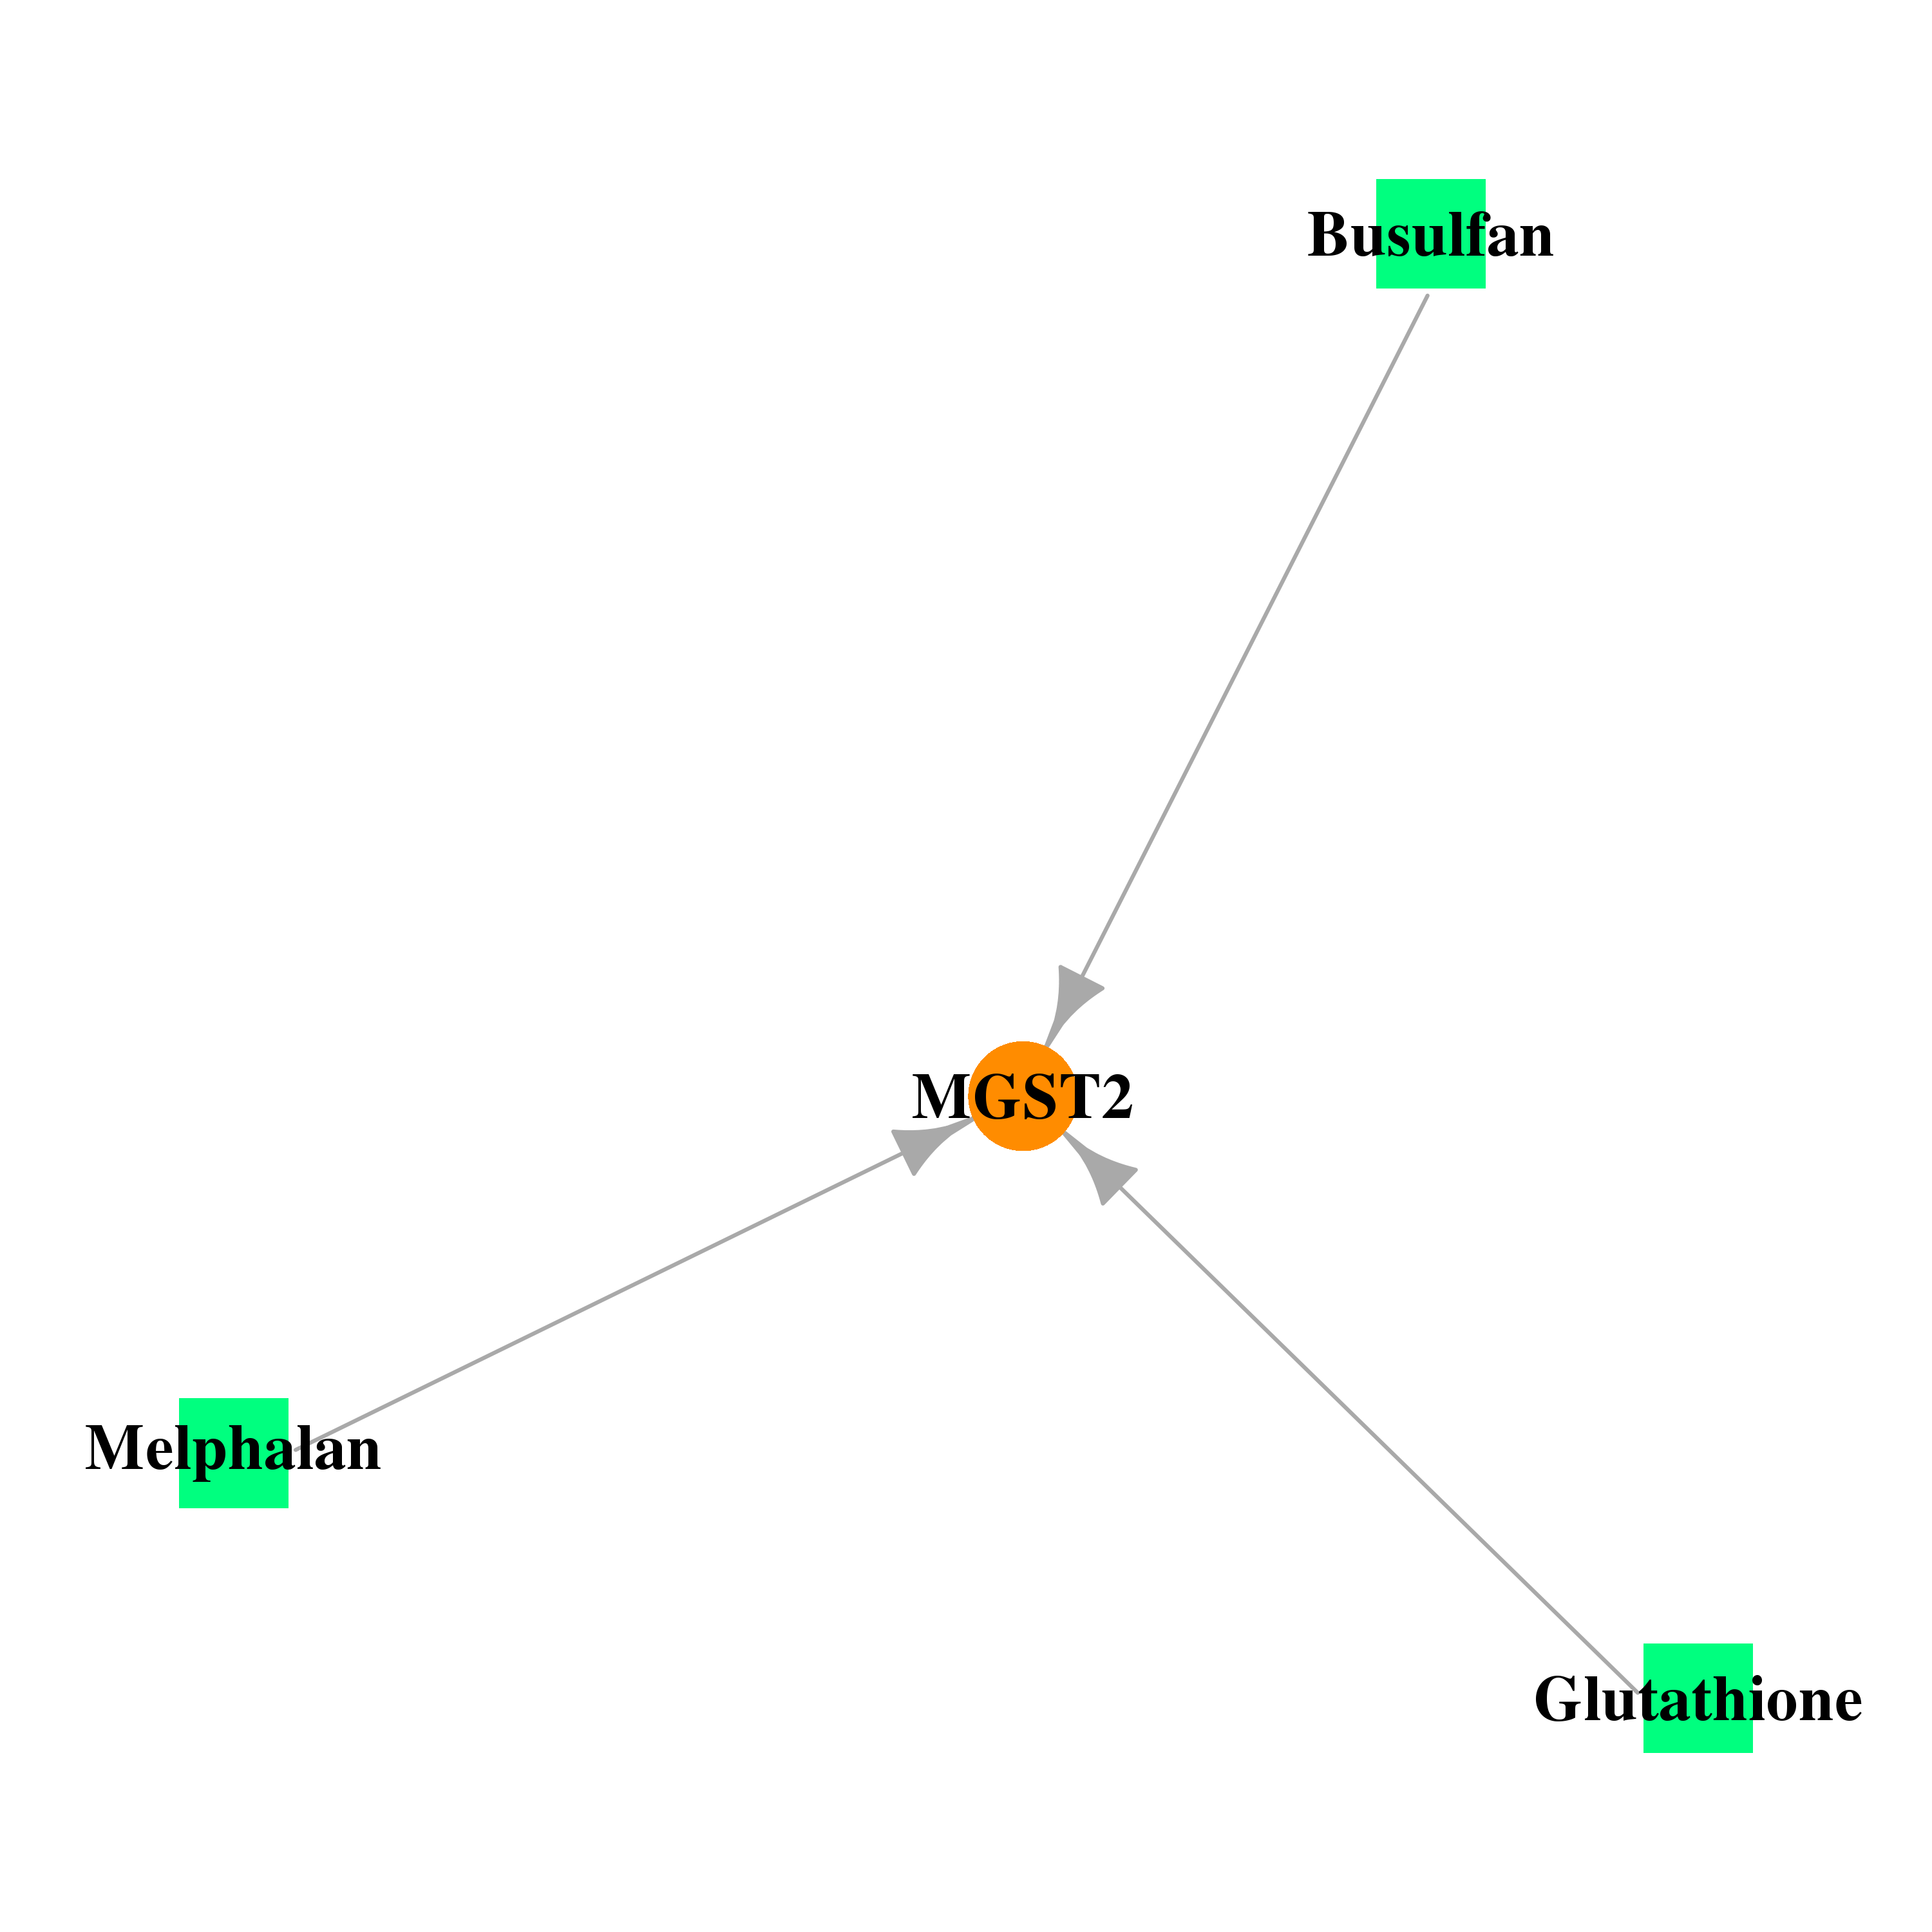 |
| * Drug Centered Interaction Network. |
| DrugBank ID | Target Name | Drug Groups | Generic Name | Drug Centered Network | Drug Structure |
| DB00143 | microsomal glutathione S-transferase 2 | approved; nutraceutical | Glutathione |  |  |
| DB01008 | microsomal glutathione S-transferase 2 | approved; investigational | Busulfan |  |  |
| DB01042 | microsomal glutathione S-transferase 2 | approved | Melphalan | 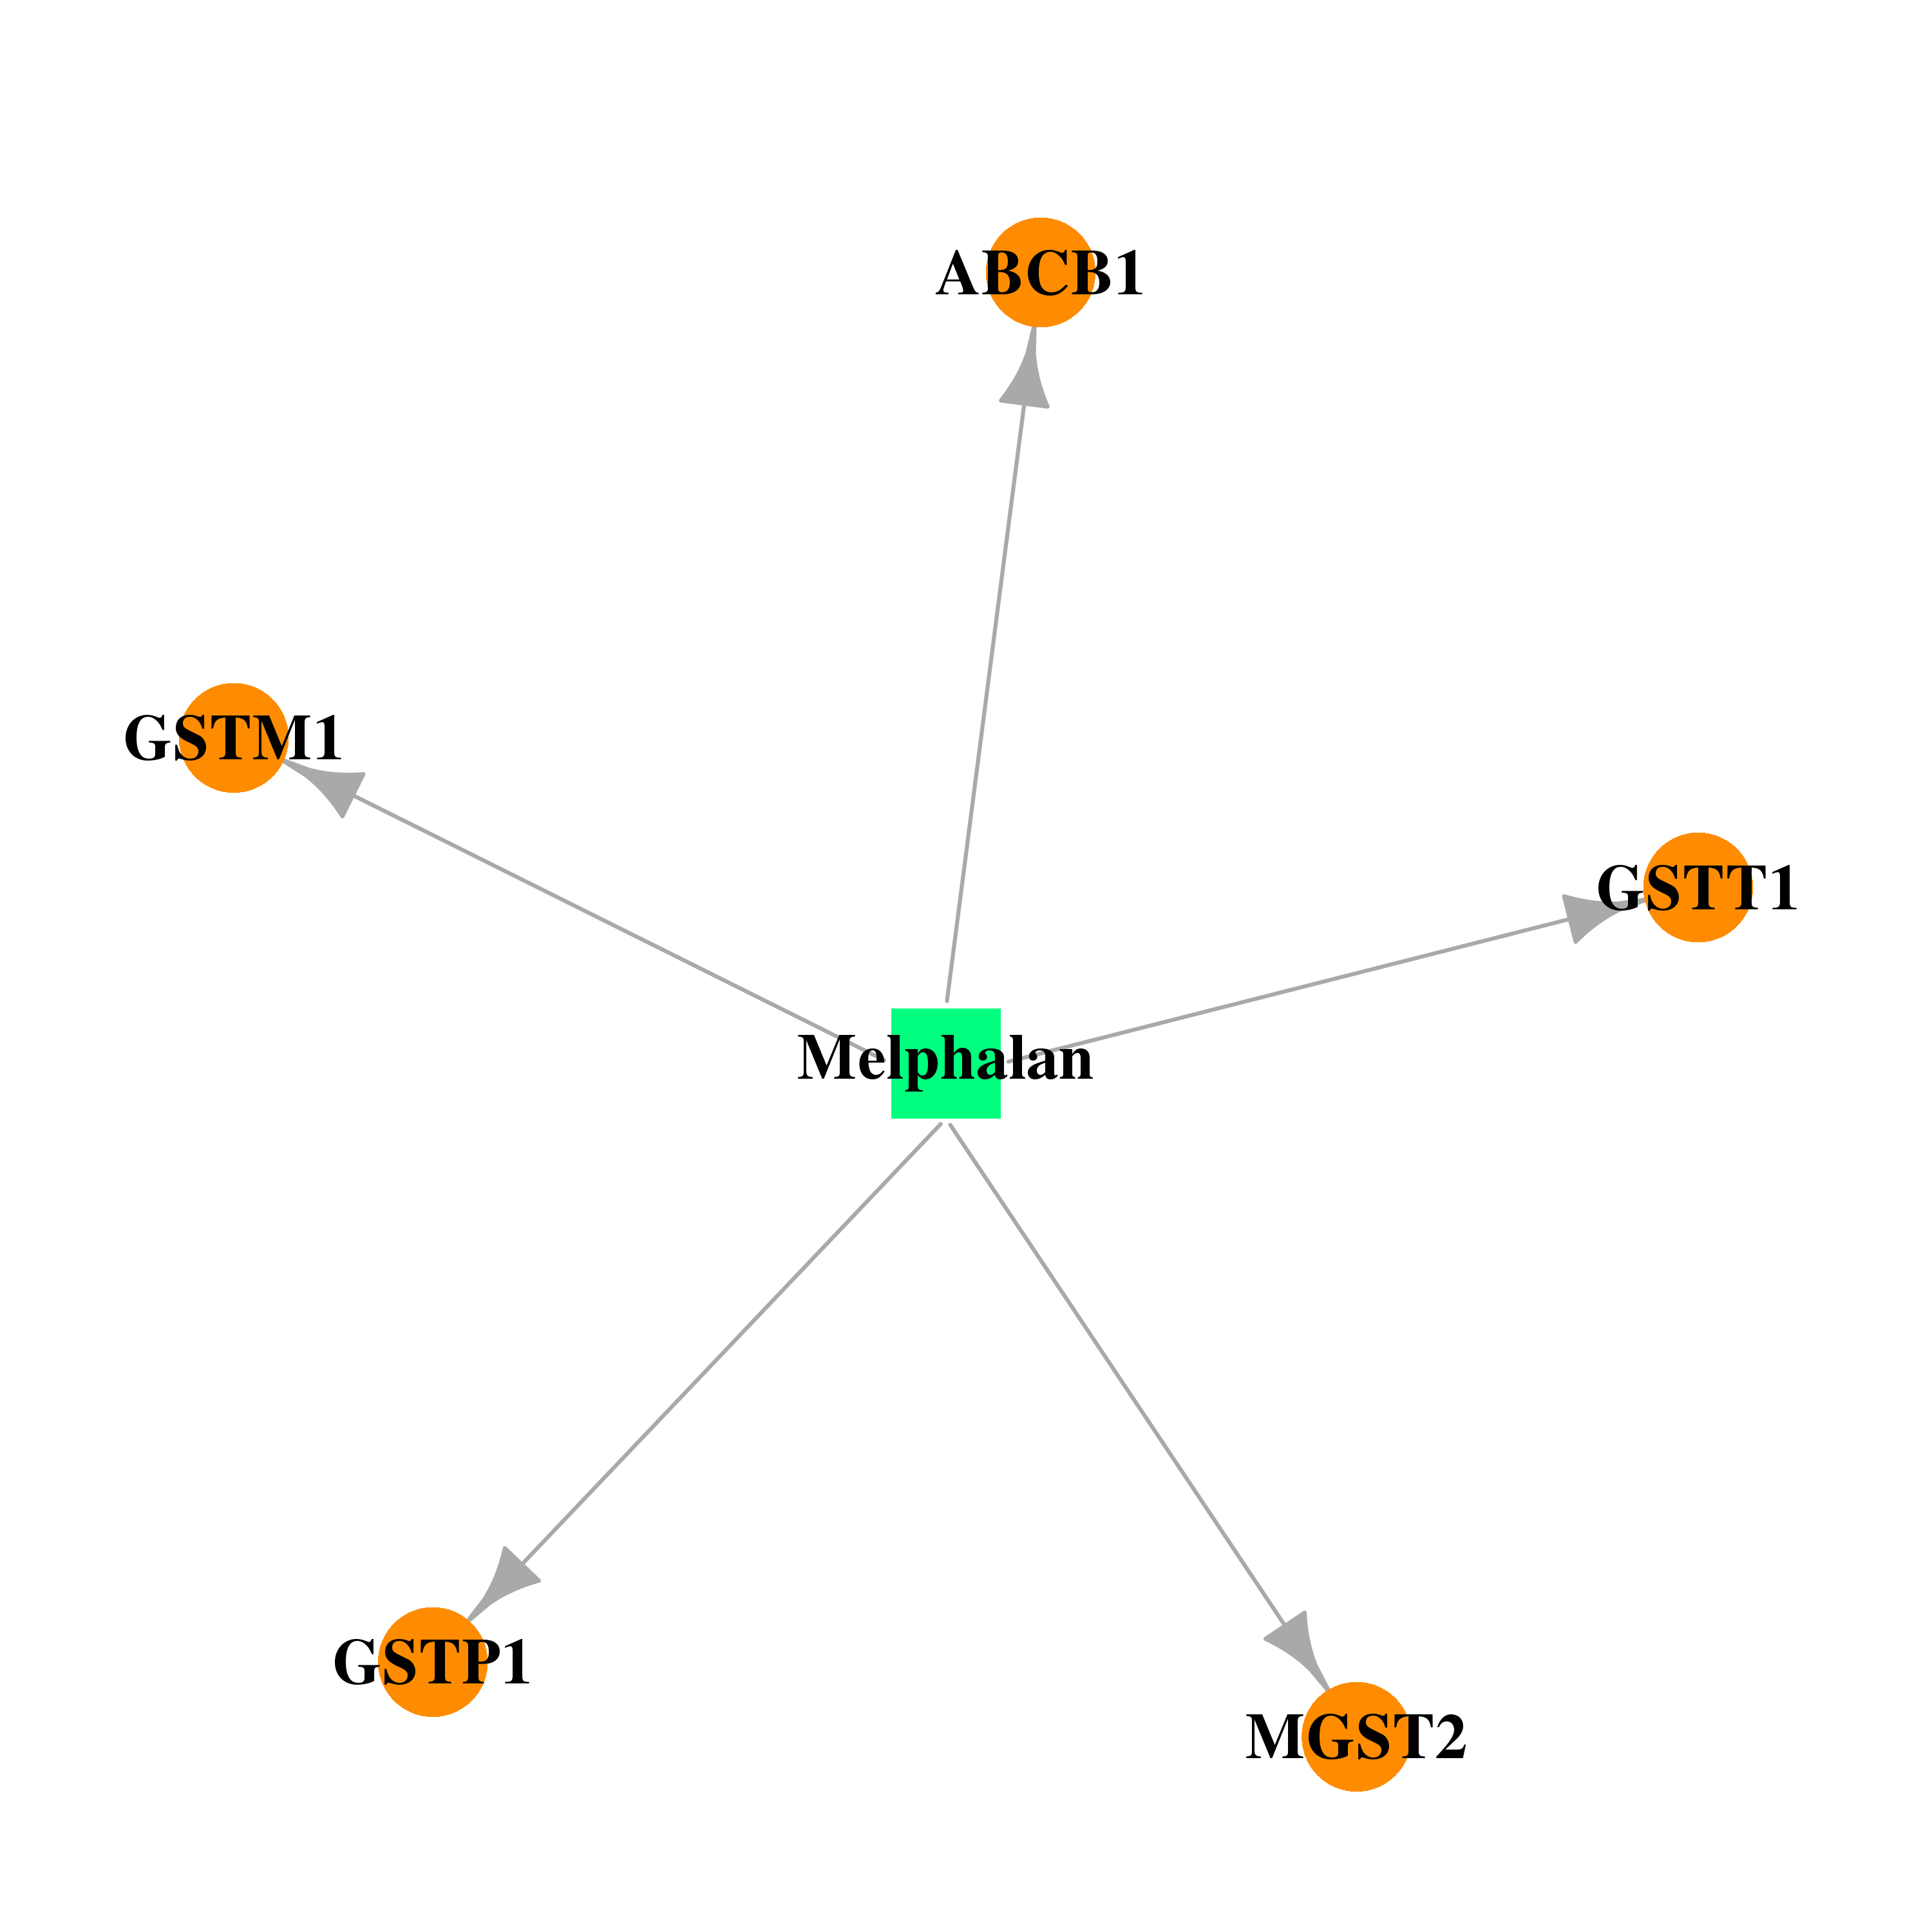 | 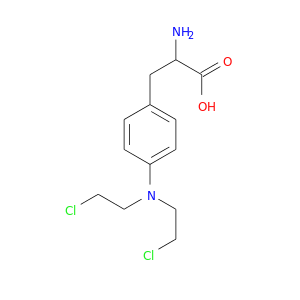 |
| Top |
| Cross referenced IDs for MGST2 |
| * We obtained these cross-references from Uniprot database. It covers 150 different DBs, 18 categories. http://www.uniprot.org/help/cross_references_section |
: Open all cross reference information
|
Copyright © 2016-Present - The Univsersity of Texas Health Science Center at Houston @ |