|
||||||||||||||||||||||||||||||||||||||||||||||||||||||||||||||||||||||||||||||||||||||||||||||||||||||||||||||||||||||||||||||||||||||||||||||||||||||||||||||||||||||||||||||||||||||||||||||||||||||||||||||||||||||||||||||||||||||||||||||||||||||||||||||||||||||||||||||||||||||||||||||||||||||||||||||||||||||||||||||||||||||||||
| |
| Phenotypic Information (metabolism pathway, cancer, disease, phenome) |
| |
| |
| Gene-Gene Network Information: Co-Expression Network, Interacting Genes & KEGG |
| |
|


| Gene Summary for MGST3 |
| Top |
| Phenotypic Information for MGST3(metabolism pathway, cancer, disease, phenome) |
| Cancer | CGAP: MGST3 |
| Familial Cancer Database: MGST3 | |
| * This gene is included in those cancer gene databases. |
|
|
|
|
|
|
| ||||||||||||||||||||||||||||||||||||||||||||||||||||||||||||||||||||||||||||||||||||||||||||||||||||||||||||||||||||||||||||||||||||||||||||||||||||||||||||||||||||||||||||||||||||||||||||||||||||||||||||||||||||||||||||||||||||||||||||||||||||||||||||||||||||||||||||||||||||||||||||||||||||||||||||||||||||||||||||||||||||
Oncogene 1 | Significant driver gene in | |||||||||||||||||||||||||||||||||||||||||||||||||||||||||||||||||||||||||||||||||||||||||||||||||||||||||||||||||||||||||||||||||||||||||||||||||||||||||||||||||||||||||||||||||||||||||||||||||||||||||||||||||||||||||||||||||||||||||||||||||||||||||||||||||||||||||||||||||||||||||||||||||||||||||||||||||||||||||||||||||||||||||
| cf) number; DB name 1 Oncogene; http://nar.oxfordjournals.org/content/35/suppl_1/D721.long, 2 Tumor Suppressor gene; https://bioinfo.uth.edu/TSGene/, 3 Cancer Gene Census; http://www.nature.com/nrc/journal/v4/n3/abs/nrc1299.html, 4 CancerGenes; http://nar.oxfordjournals.org/content/35/suppl_1/D721.long, 5 Network of Cancer Gene; http://ncg.kcl.ac.uk/index.php, 1Therapeutic Vulnerabilities in Cancer; http://cbio.mskcc.org/cancergenomics/statius/ |
| KEGG_GLUTATHIONE_METABOLISM KEGG_METABOLISM_OF_XENOBIOTICS_BY_CYTOCHROME_P450 KEGG_DRUG_METABOLISM_CYTOCHROME_P450 | |
| OMIM | |
| Orphanet | |
| Disease | KEGG Disease: MGST3 |
| MedGen: MGST3 (Human Medical Genetics with Condition) | |
| ClinVar: MGST3 | |
| Phenotype | MGI: MGST3 (International Mouse Phenotyping Consortium) |
| PhenomicDB: MGST3 | |
| Mutations for MGST3 |
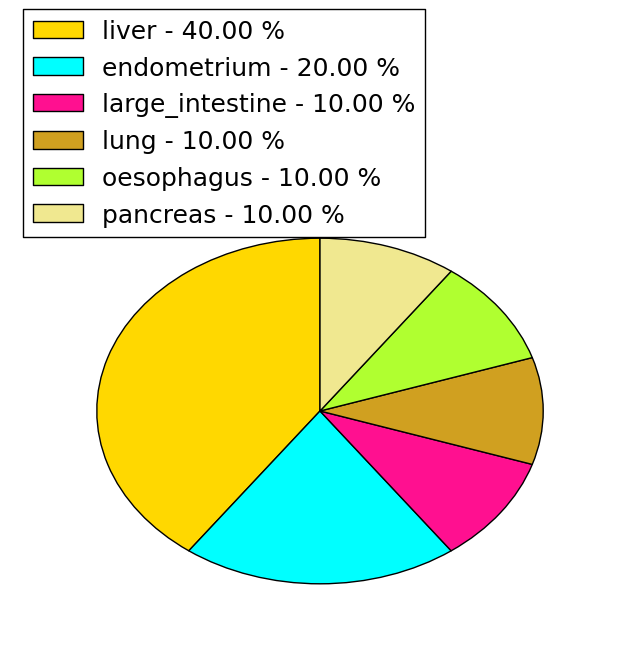
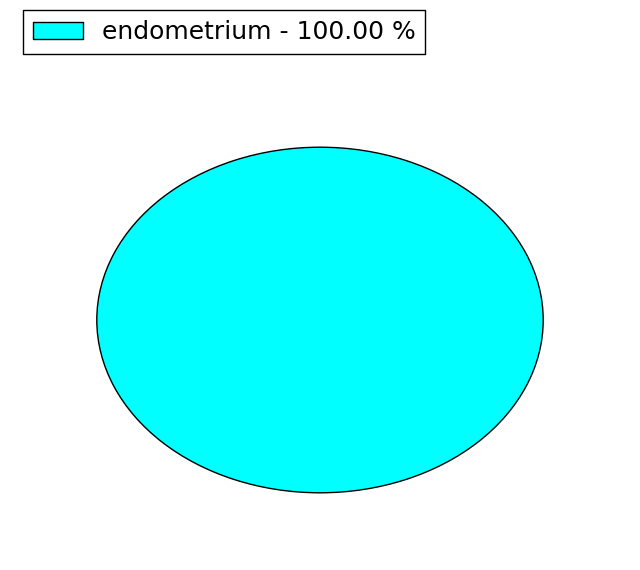
| * Under tables are showing count per each tissue to give us broad intuition about tissue specific mutation patterns.You can go to the detailed page for each mutation database's web site. |
| There's no structural variation information in COSMIC data for this gene. |
| * From mRNA Sanger sequences, Chitars2.0 arranged chimeric transcripts. This table shows MGST3 related fusion information. |
| ID | Head Gene | Tail Gene | Accession | Gene_a | qStart_a | qEnd_a | Chromosome_a | tStart_a | tEnd_a | Gene_a | qStart_a | qEnd_a | Chromosome_a | tStart_a | tEnd_a |
| BG956101 | MGST3 | 8 | 239 | 1 | 165623821 | 165624056 | TRAPPC6A | 227 | 420 | 19 | 45666435 | 45667474 | |
| DW407758 | MGST3 | 18 | 304 | 1 | 165600465 | 165621237 | SPOP | 305 | 473 | 17 | 47677802 | 47679312 | |
| Top |
| Mutation type/ Tissue ID | brca | cns | cerv | endome | haematopo | kidn | Lintest | liver | lung | ns | ovary | pancre | prost | skin | stoma | thyro | urina | |||
| Total # sample | 2 | |||||||||||||||||||
| GAIN (# sample) | 2 | |||||||||||||||||||
| LOSS (# sample) |
| cf) Tissue ID; Tissue type (1; Breast, 2; Central_nervous_system, 3; Cervix, 4; Endometrium, 5; Haematopoietic_and_lymphoid_tissue, 6; Kidney, 7; Large_intestine, 8; Liver, 9; Lung, 10; NS, 11; Ovary, 12; Pancreas, 13; Prostate, 14; Skin, 15; Stomach, 16; Thyroid, 17; Urinary_tract) |
| Top |
|
 |
| Top |
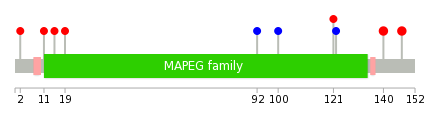
| Stat. for Non-Synonymous SNVs (# total SNVs=10) | (# total SNVs=1) |
 |  |
(# total SNVs=0) | (# total SNVs=0) |
| Top |
| * When you move the cursor on each content, you can see more deailed mutation information on the Tooltip. Those are primary_site,primary_histology,mutation(aa),pubmedID. |
| GRCh37 position | Mutation(aa) | Unique sampleID count |
| chr1:165624622-165624622 | p.R114* | 2 |
| chr1:165624701-165624701 | p.V140A | 2 |
| chr1:165624721-165624721 | p.G147R | 2 |
| chr1:165619127-165619127 | p.G15S | 1 |
| chr1:165619140-165619140 | p.F19S | 1 |
| chr1:165620301-165620301 | p.C56* | 1 |
| chr1:165623542-165623542 | p.A92A | 1 |
| chr1:165623555-165623555 | p.R97* | 1 |
| chr1:165623566-165623566 | p.Y100Y | 1 |
| chr1:165624643-165624643 | p.A121T | 1 |
| Top |
|
 |
| Point Mutation/ Tissue ID | 1 | 2 | 3 | 4 | 5 | 6 | 7 | 8 | 9 | 10 | 11 | 12 | 13 | 14 | 15 | 16 | 17 | 18 | 19 | 20 |
| # sample | 2 | 2 | 3 | |||||||||||||||||
| # mutation | 4 | 2 | 3 | |||||||||||||||||
| nonsynonymous SNV | 3 | 1 | 2 | |||||||||||||||||
| synonymous SNV | 1 | 1 | 1 |
| cf) Tissue ID; Tissue type (1; BLCA[Bladder Urothelial Carcinoma], 2; BRCA[Breast invasive carcinoma], 3; CESC[Cervical squamous cell carcinoma and endocervical adenocarcinoma], 4; COAD[Colon adenocarcinoma], 5; GBM[Glioblastoma multiforme], 6; Glioma Low Grade, 7; HNSC[Head and Neck squamous cell carcinoma], 8; KICH[Kidney Chromophobe], 9; KIRC[Kidney renal clear cell carcinoma], 10; KIRP[Kidney renal papillary cell carcinoma], 11; LAML[Acute Myeloid Leukemia], 12; LUAD[Lung adenocarcinoma], 13; LUSC[Lung squamous cell carcinoma], 14; OV[Ovarian serous cystadenocarcinoma ], 15; PAAD[Pancreatic adenocarcinoma], 16; PRAD[Prostate adenocarcinoma], 17; SKCM[Skin Cutaneous Melanoma], 18:STAD[Stomach adenocarcinoma], 19:THCA[Thyroid carcinoma], 20:UCEC[Uterine Corpus Endometrial Carcinoma]) |
| Top |
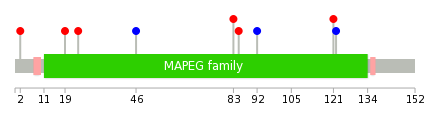
| * We represented just top 10 SNVs. When you move the cursor on each content, you can see more deailed mutation information on the Tooltip. Those are primary_site, primary_histology, mutation(aa), pubmedID. |
| Genomic Position | Mutation(aa) | Unique sampleID count |
| chr1:165619154 | p.P83Q | 1 |
| chr1:165620271 | p.I85L | 1 |
| chr1:165621271 | p.A92A | 1 |
| chr1:165623519 | p.A121T | 1 |
| chr1:165623542 | p.L122L | 1 |
| chr1:165624643 | p.A2T | 1 |
| chr1:165624648 | p.F19S | 1 |
| chr1:165619088 | p.H24N | 1 |
| chr1:165619140 | p.T46T | 1 |
| * Copy number data were extracted from TCGA using R package TCGA-Assembler. The URLs of all public data files on TCGA DCC data server were gathered on Jan-05-2015. Function ProcessCNAData in TCGA-Assembler package was used to obtain gene-level copy number value which is calculated as the average copy number of the genomic region of a gene. |
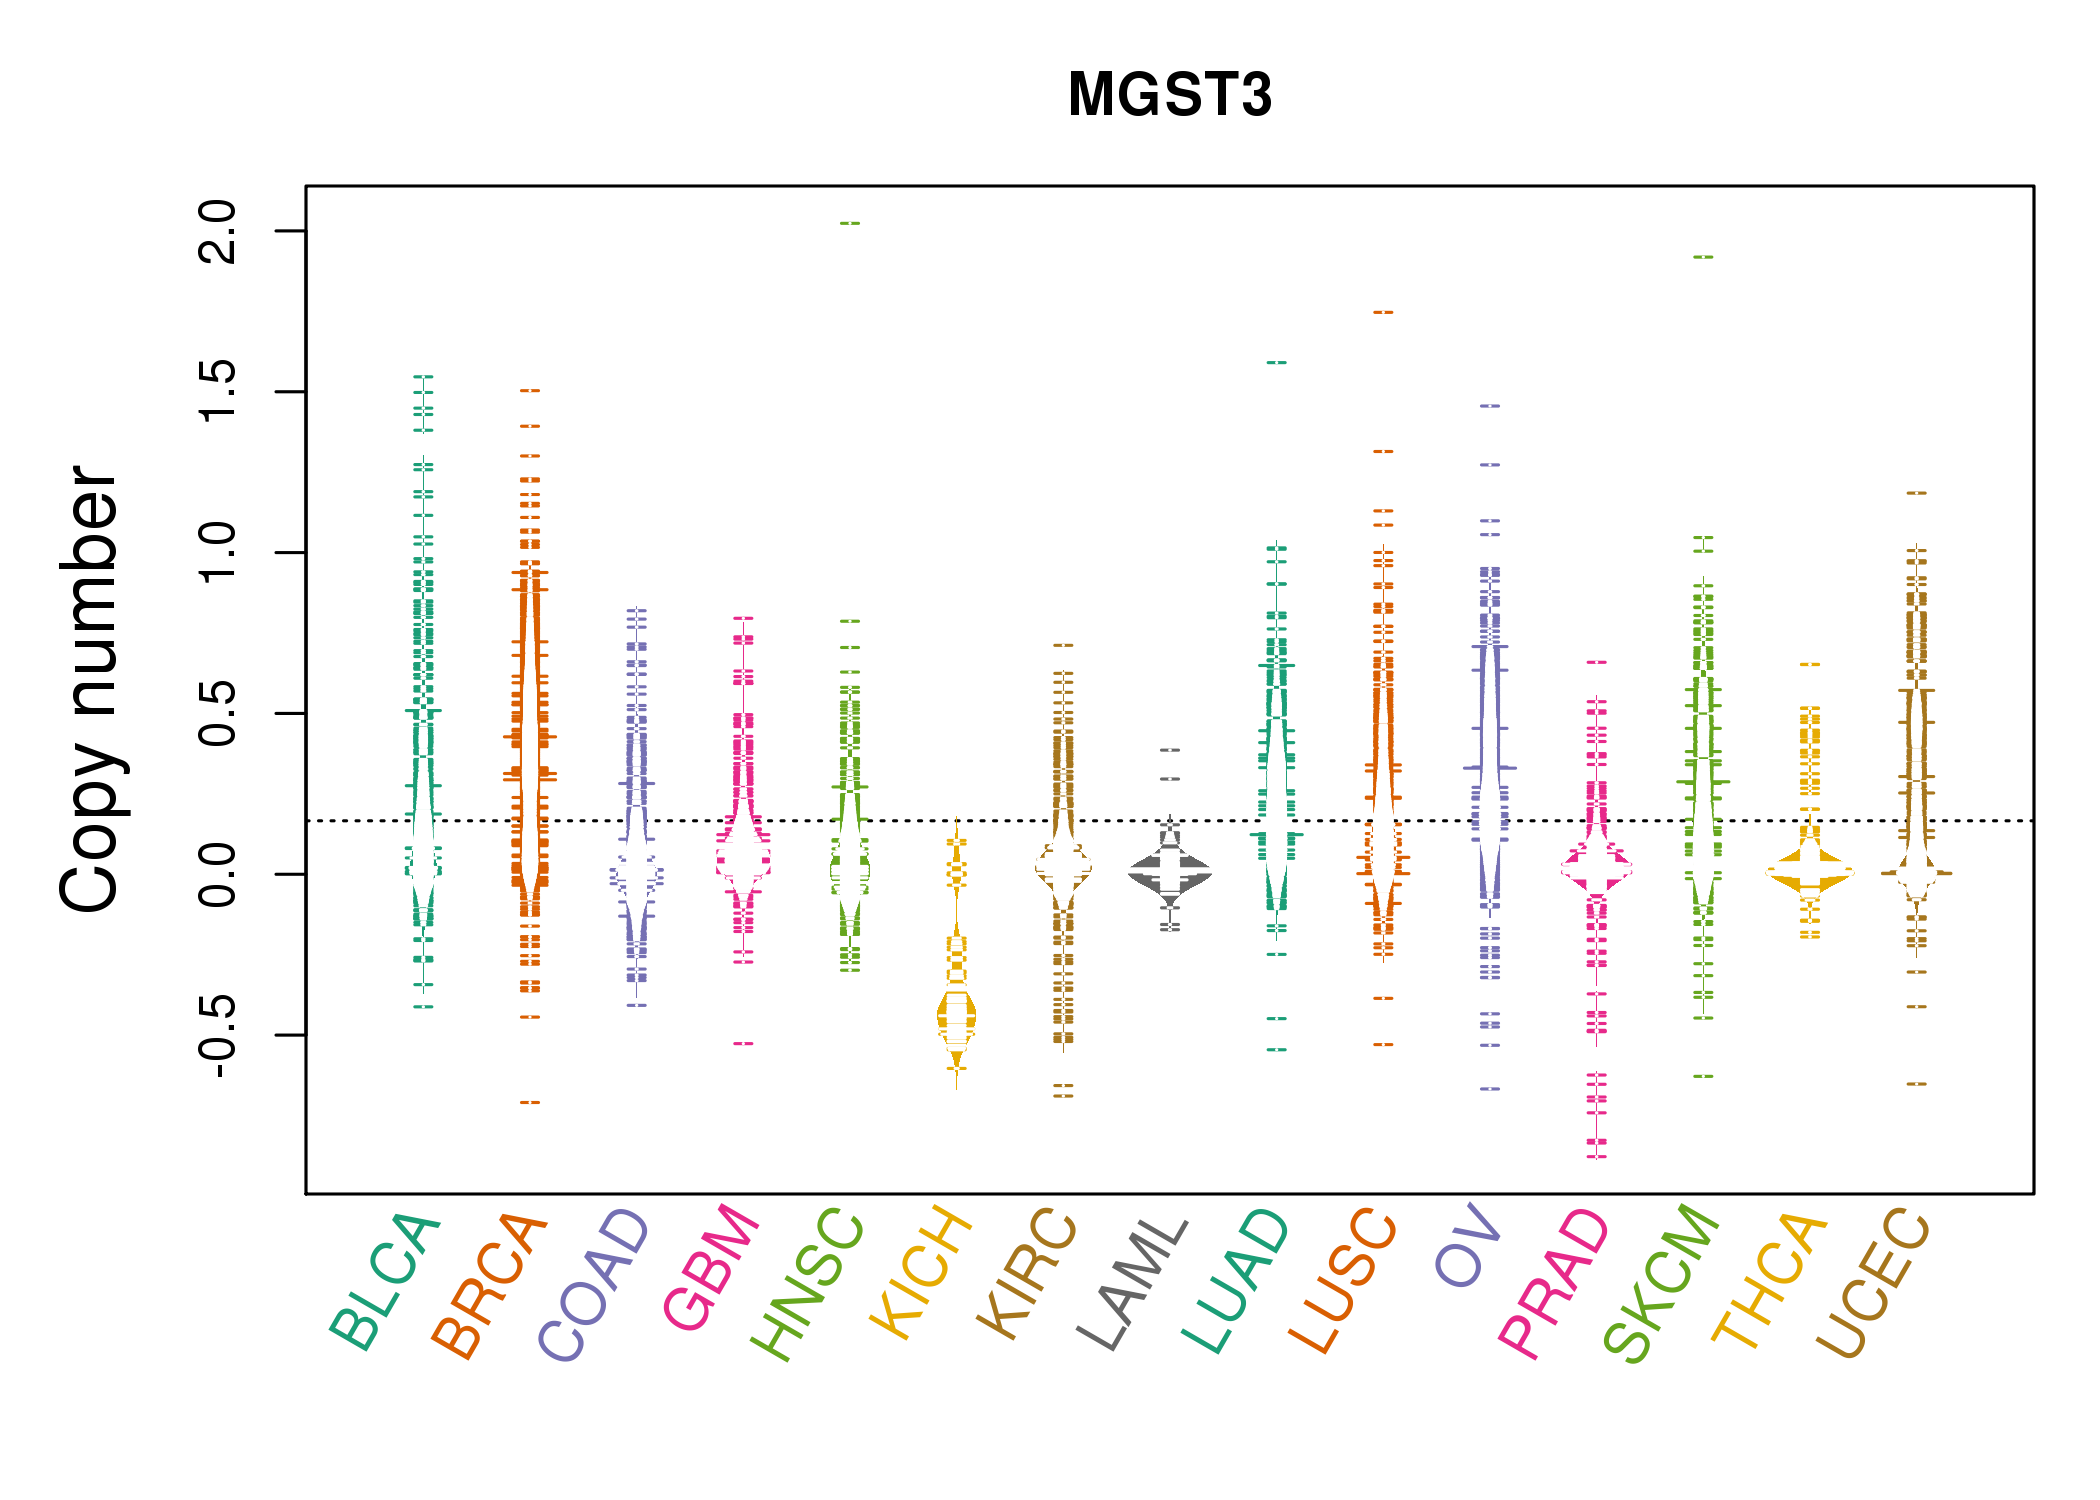 |
| cf) Tissue ID[Tissue type]: BLCA[Bladder Urothelial Carcinoma], BRCA[Breast invasive carcinoma], CESC[Cervical squamous cell carcinoma and endocervical adenocarcinoma], COAD[Colon adenocarcinoma], GBM[Glioblastoma multiforme], Glioma Low Grade, HNSC[Head and Neck squamous cell carcinoma], KICH[Kidney Chromophobe], KIRC[Kidney renal clear cell carcinoma], KIRP[Kidney renal papillary cell carcinoma], LAML[Acute Myeloid Leukemia], LUAD[Lung adenocarcinoma], LUSC[Lung squamous cell carcinoma], OV[Ovarian serous cystadenocarcinoma ], PAAD[Pancreatic adenocarcinoma], PRAD[Prostate adenocarcinoma], SKCM[Skin Cutaneous Melanoma], STAD[Stomach adenocarcinoma], THCA[Thyroid carcinoma], UCEC[Uterine Corpus Endometrial Carcinoma] |
| Top |
| Gene Expression for MGST3 |
| * CCLE gene expression data were extracted from CCLE_Expression_Entrez_2012-10-18.res: Gene-centric RMA-normalized mRNA expression data. |
 |
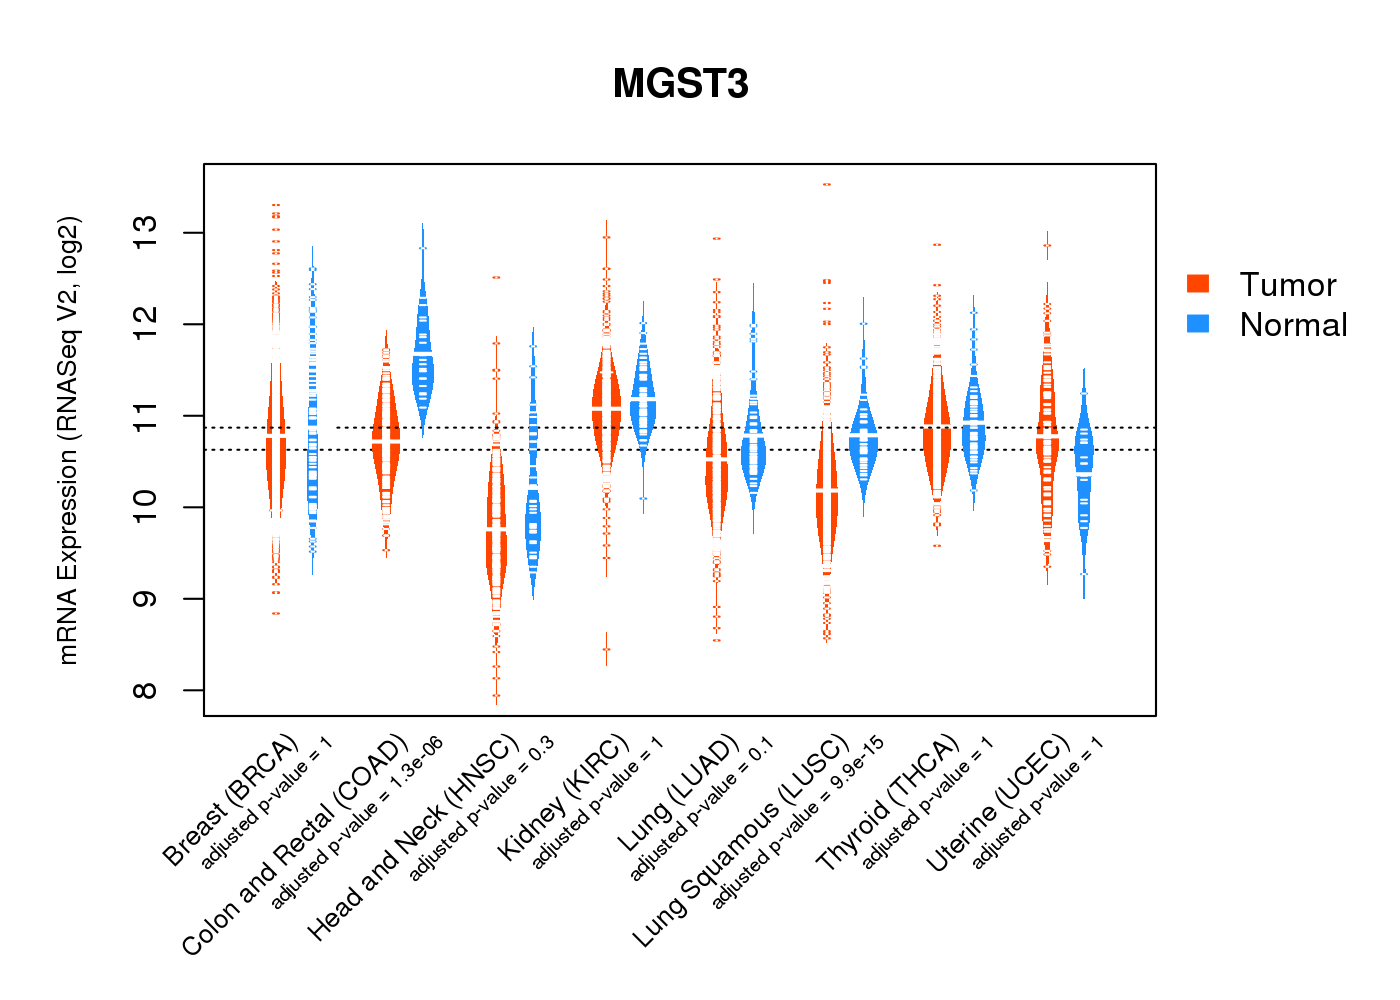
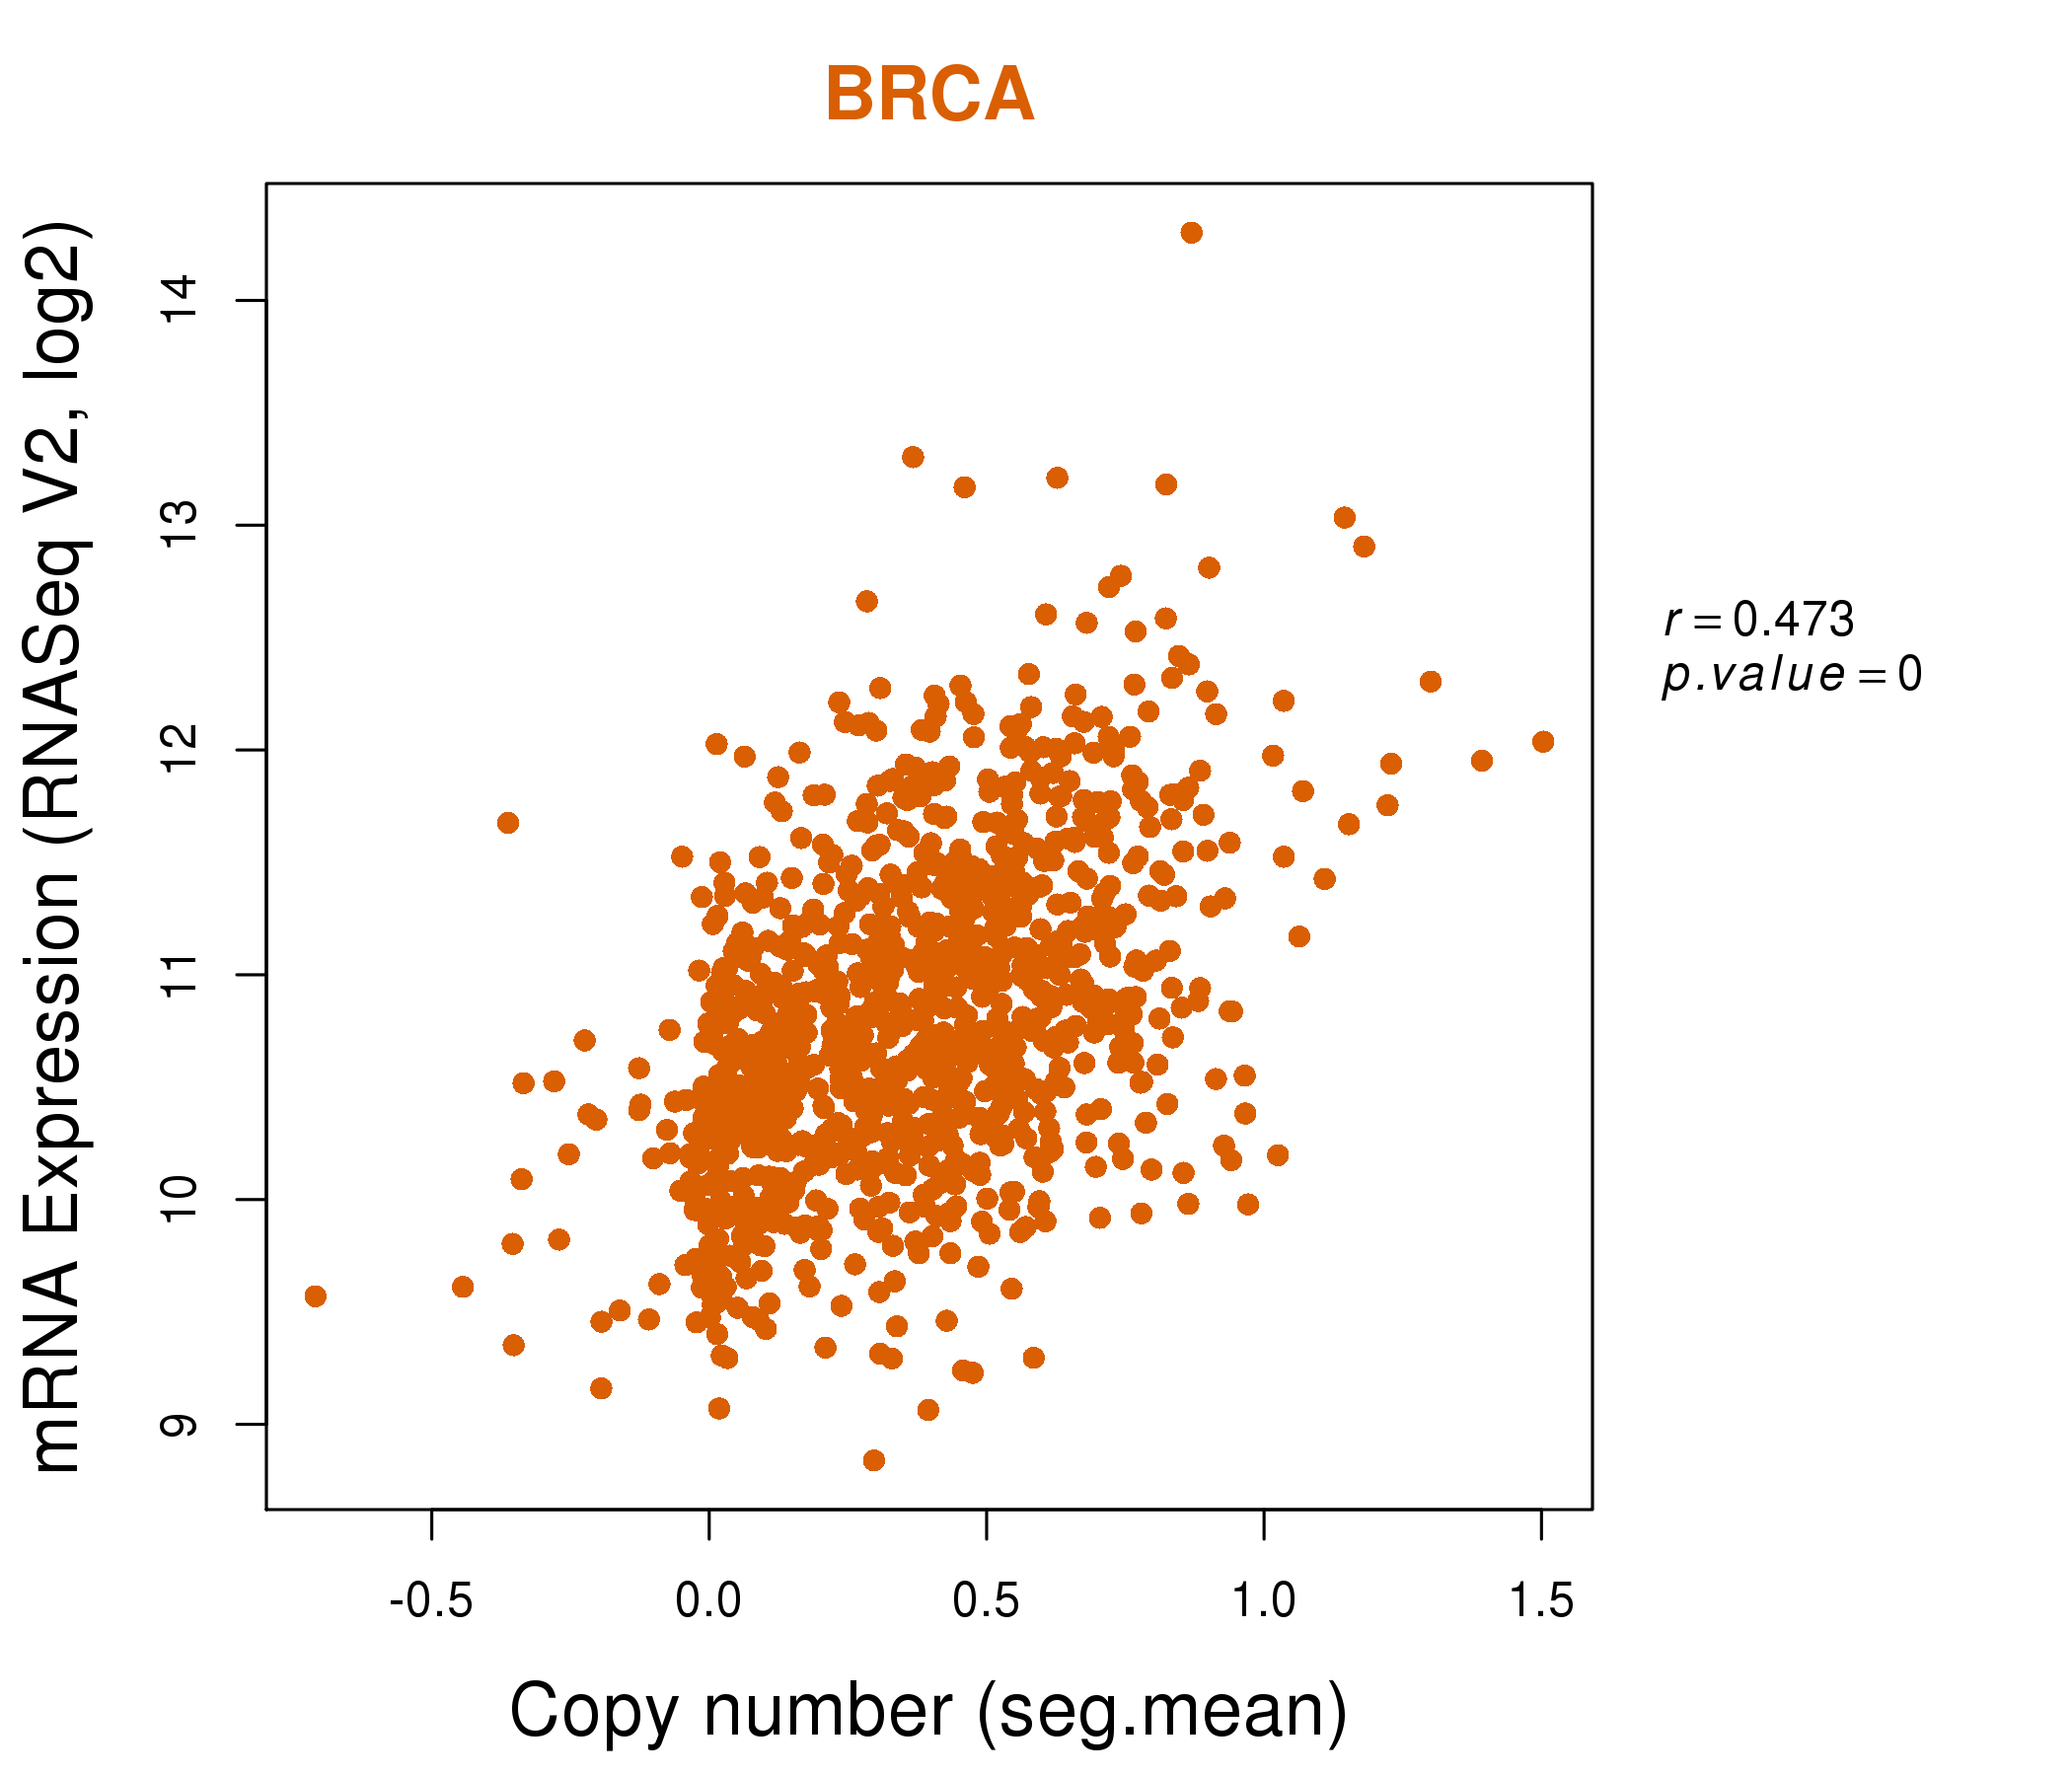
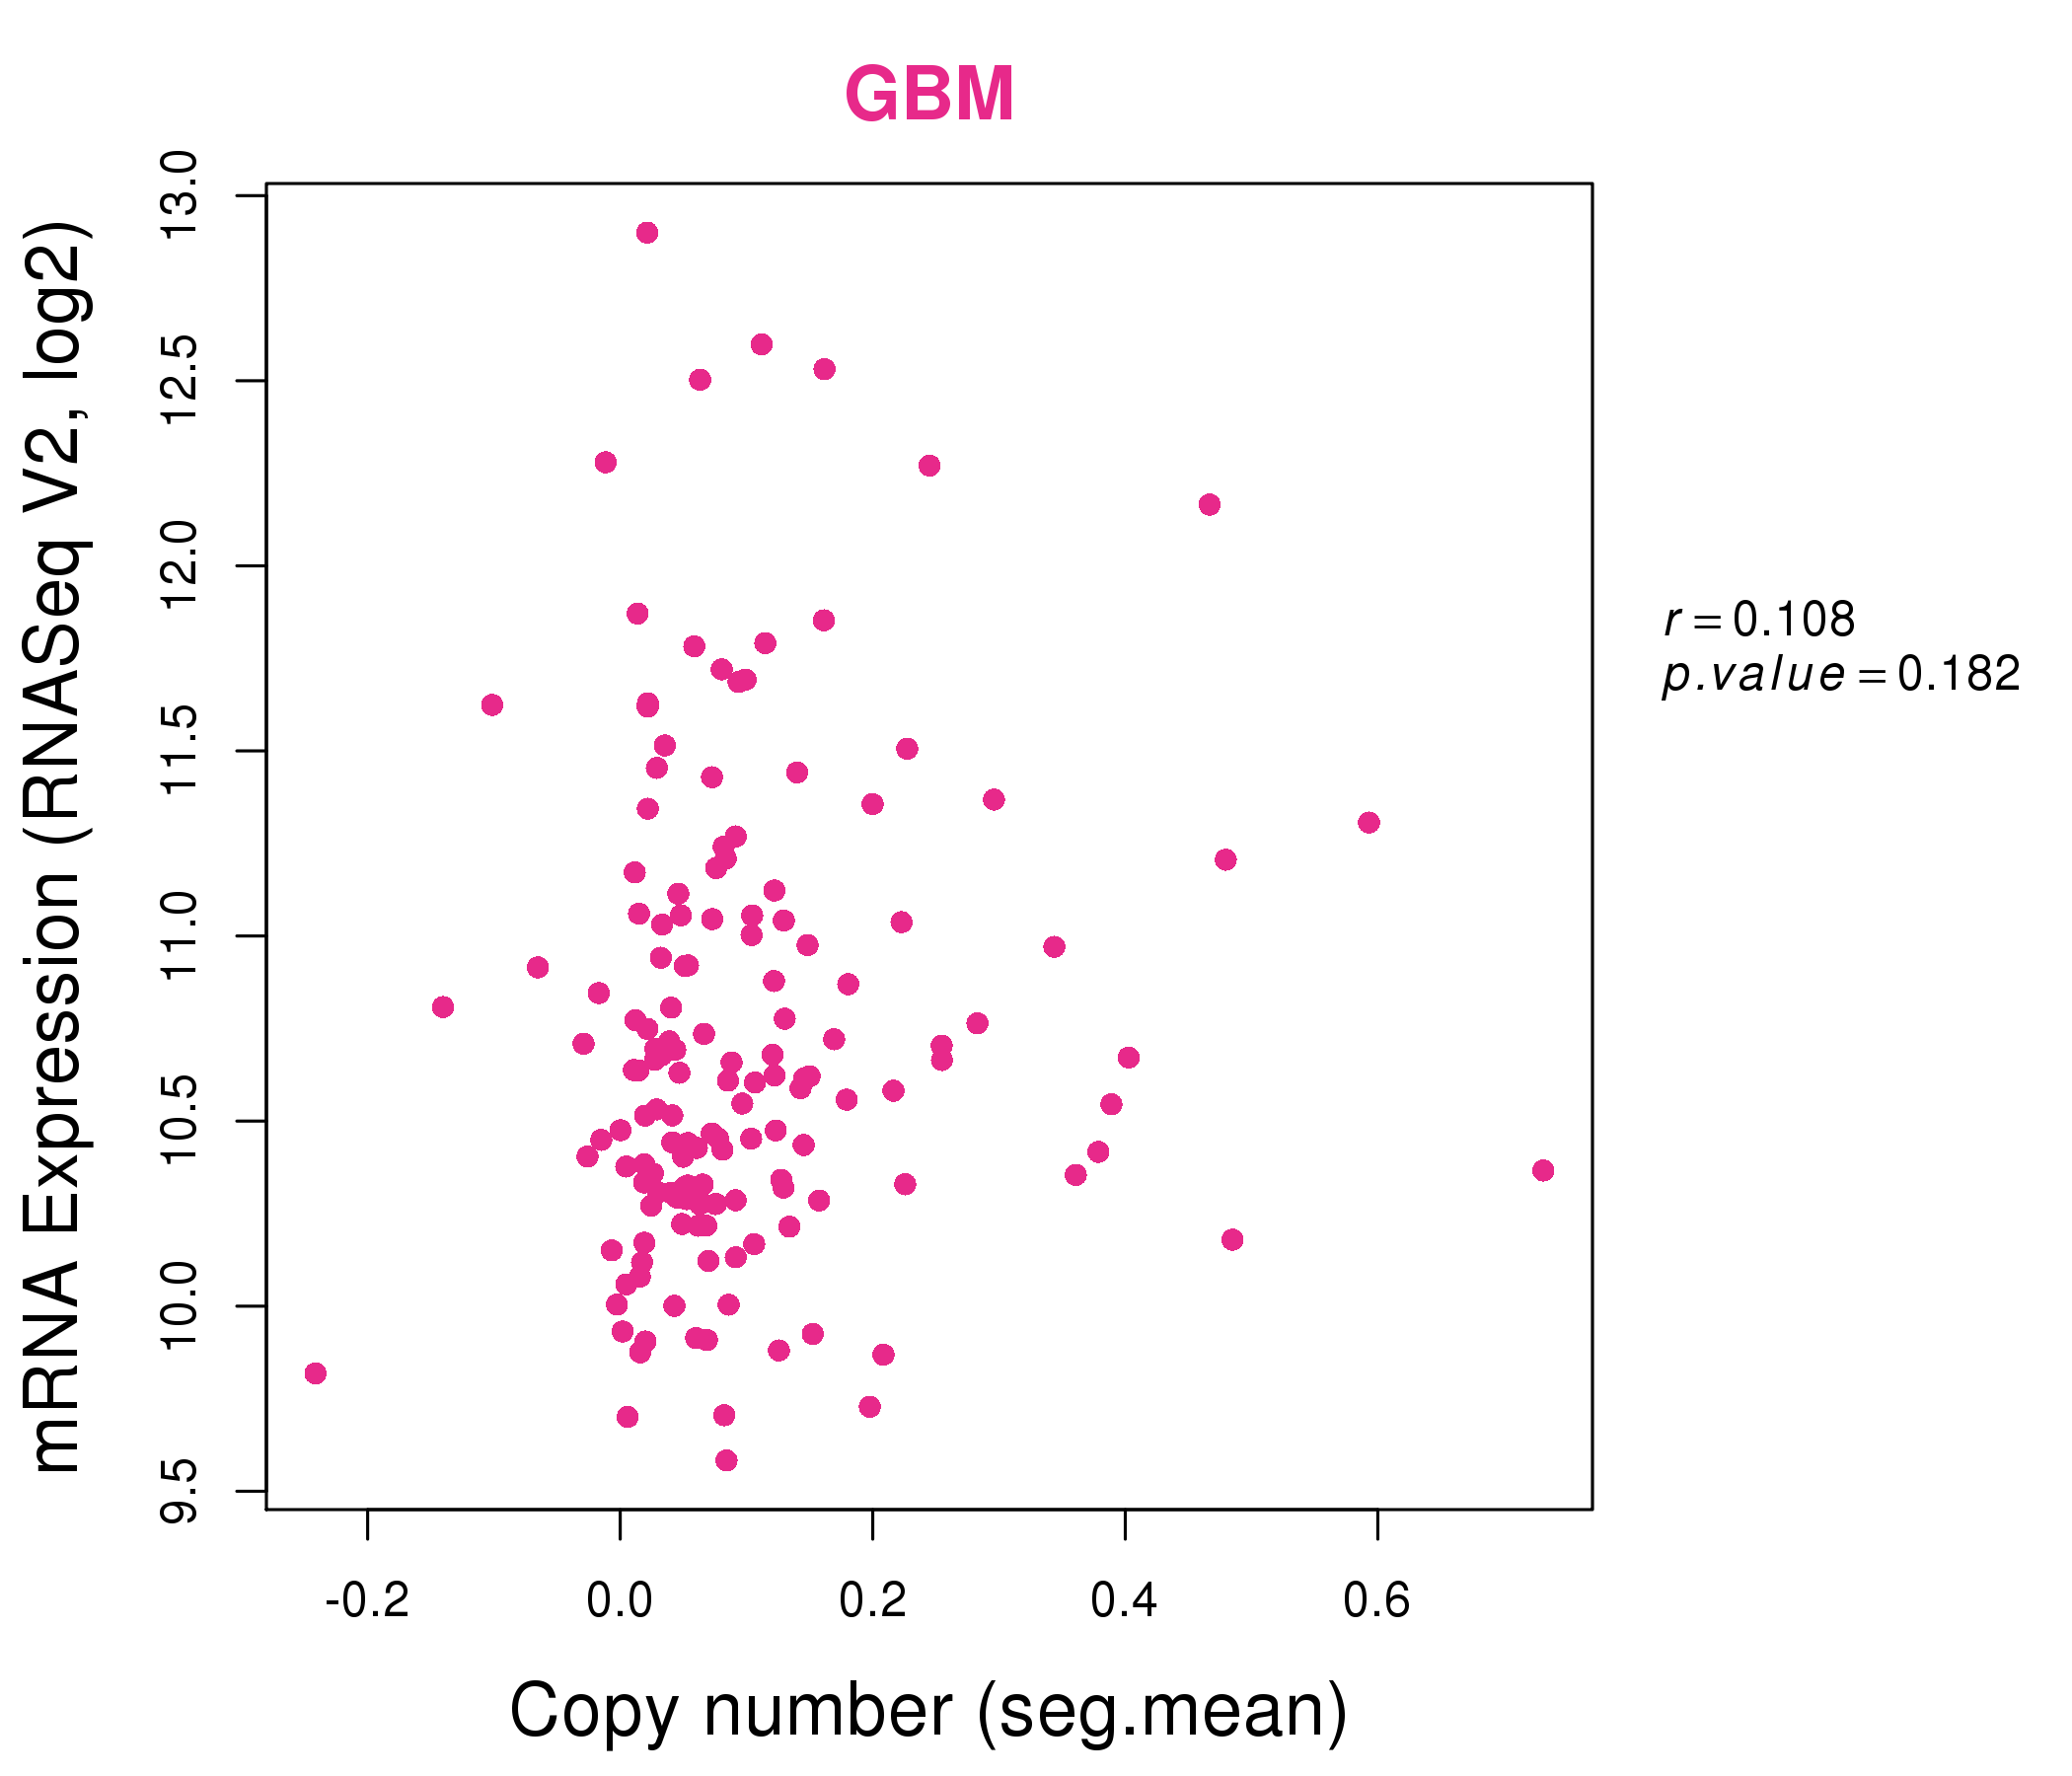
| * Normalized gene expression data of RNASeqV2 was extracted from TCGA using R package TCGA-Assembler. The URLs of all public data files on TCGA DCC data server were gathered at Jan-05-2015. Only eight cancer types have enough normal control samples for differential expression analysis. (t test, adjusted p<0.05 (using Benjamini-Hochberg FDR)) |
 |
| Top |
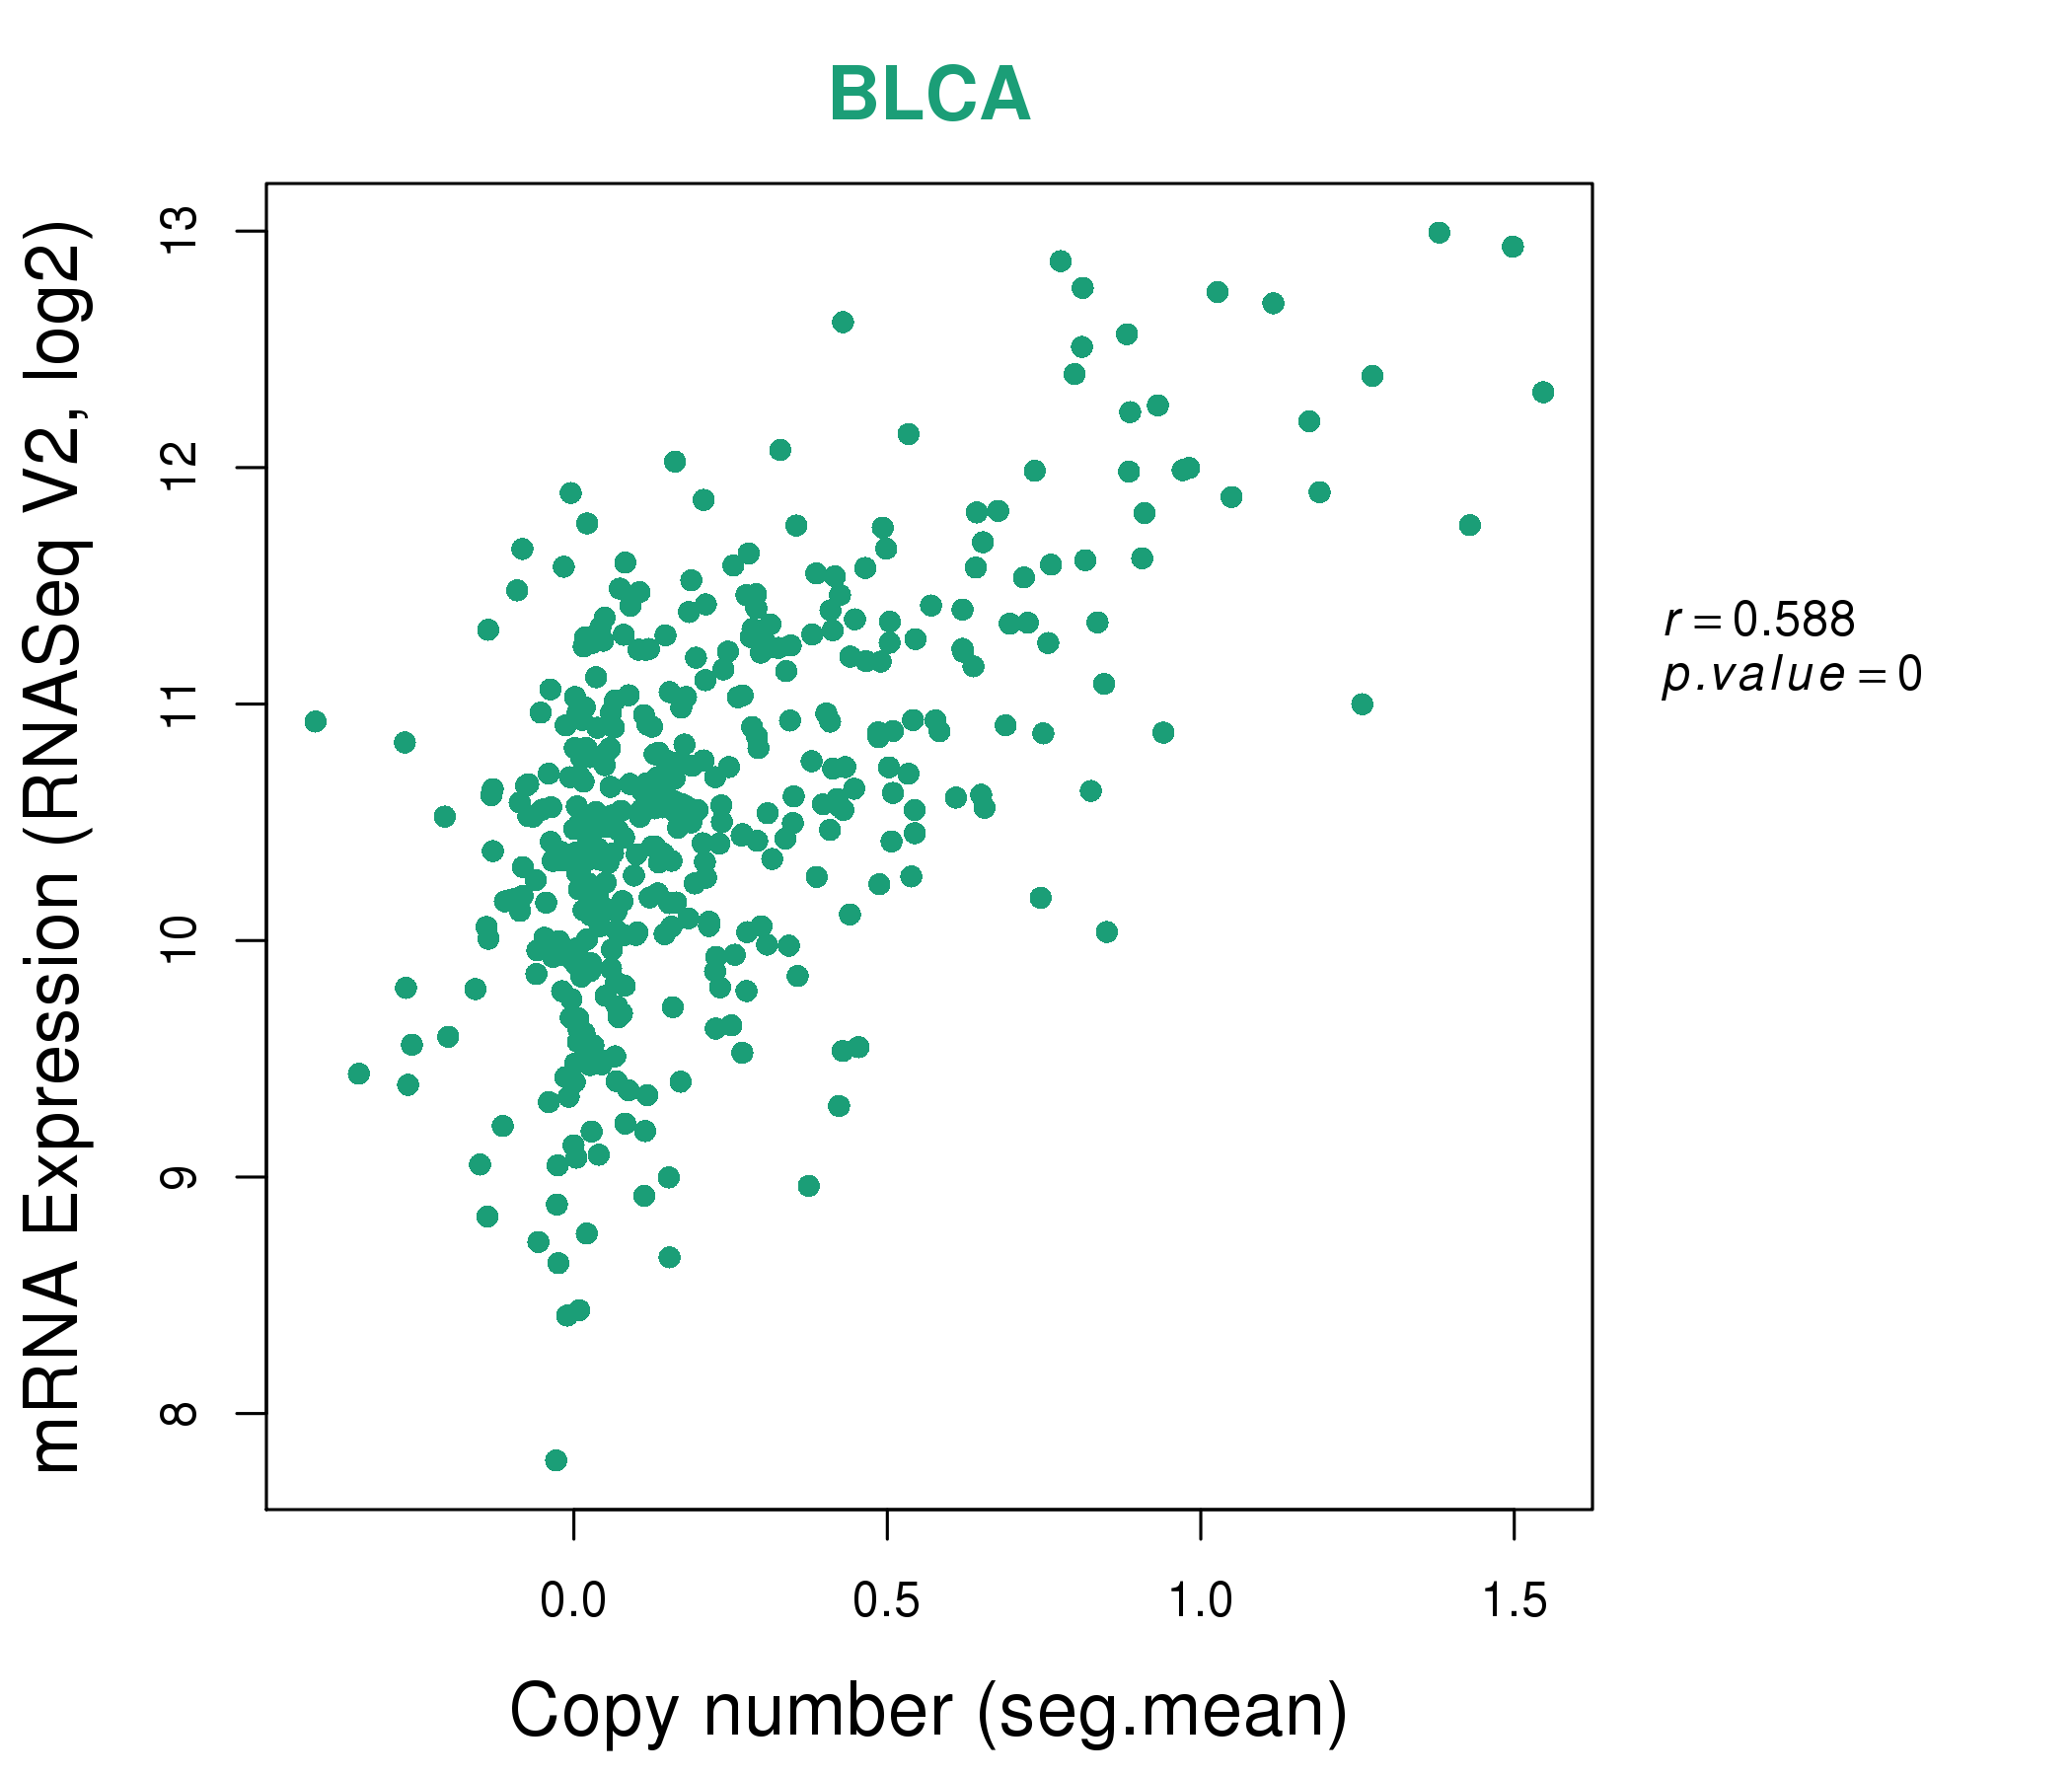
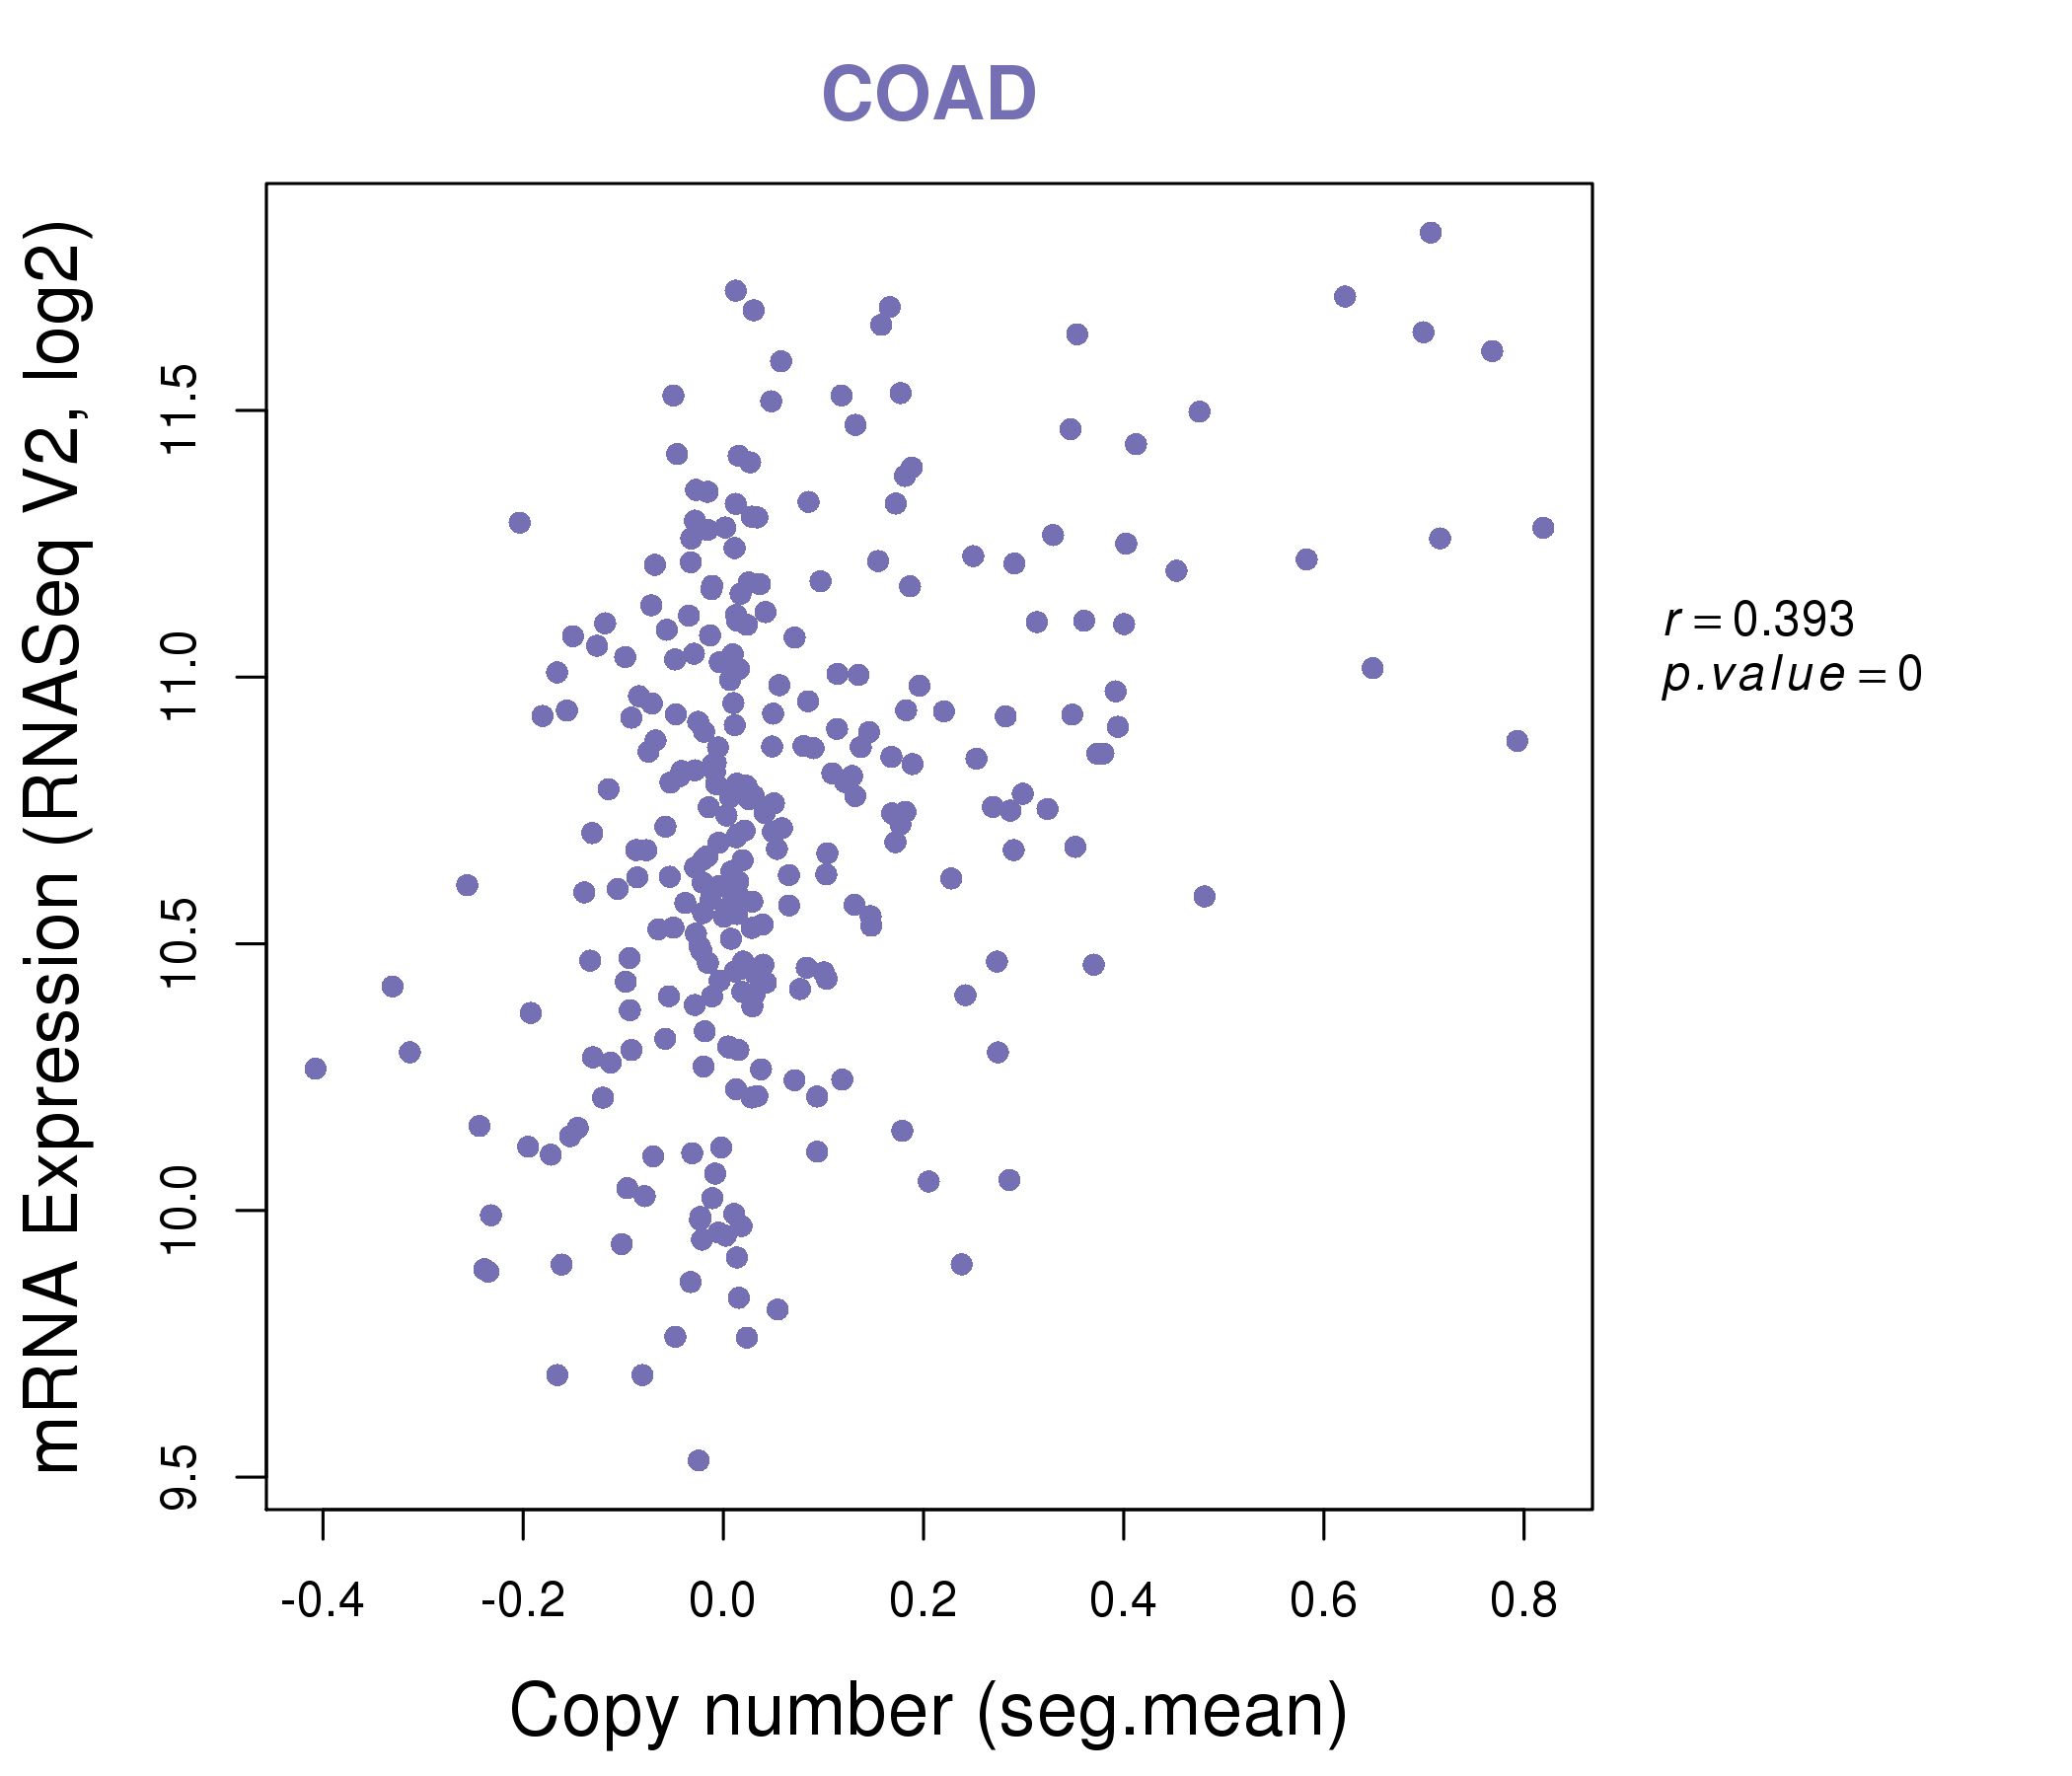
| * This plots show the correlation between CNV and gene expression. |
: Open all plots for all cancer types
 |
|
 |
|
| Top |
| Gene-Gene Network Information |
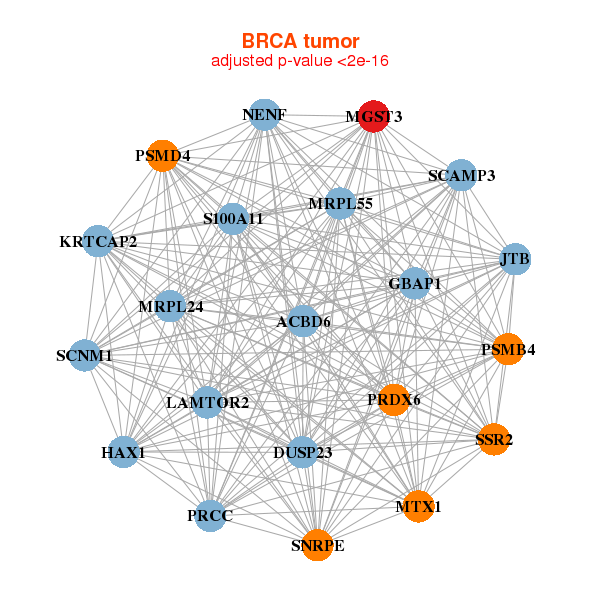
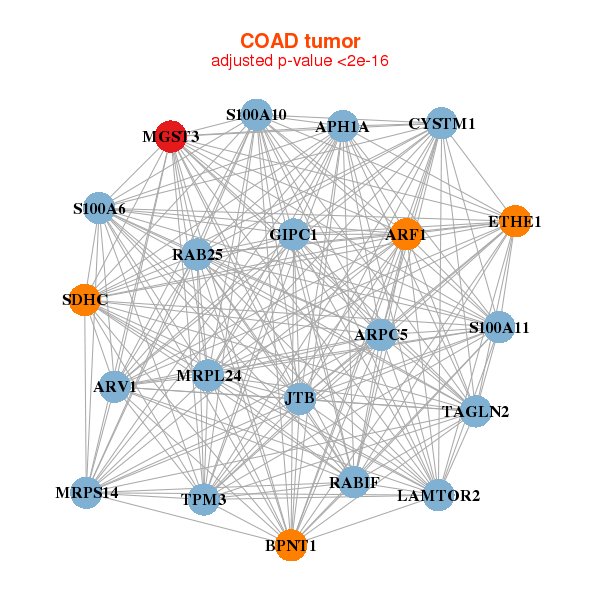
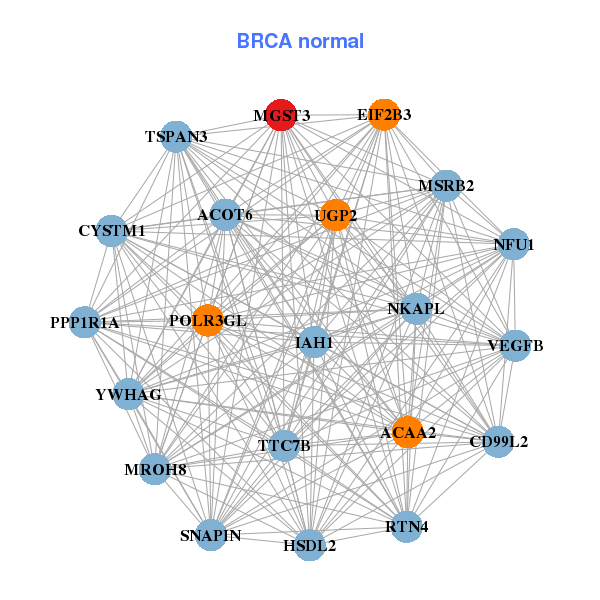
| * Co-Expression network figures were drawn using R package igraph. Only the top 20 genes with the highest correlations were shown. Red circle: input gene, orange circle: cell metabolism gene, sky circle: other gene |
: Open all plots for all cancer types
 |
| ||||
| ACBD6,DUSP23,GBAP1,HAX1,JTB,KRTCAP2,MGST3, MRPL24,MRPL55,MTX1,NENF,PRCC,PRDX6,PSMB4, PSMD4,LAMTOR2,S100A11,SCAMP3,SCNM1,SNRPE,SSR2 | ACAA2,ACOT6,MROH8,CYSTM1,CD99L2,EIF2B3,HSDL2, IAH1,MGST3,MSRB2,NFU1,NKAPL,POLR3GL,PPP1R1A, RTN4,SNAPIN,TSPAN3,TTC7B,UGP2,VEGFB,YWHAG | ||||
 |
| ||||
| APH1A,ARF1,ARPC5,ARV1,BPNT1,CYSTM1,ETHE1, GIPC1,JTB,MGST3,MRPL24,MRPS14,RAB25,RABIF, LAMTOR2,S100A10,S100A11,S100A6,SDHC,TAGLN2,TPM3 | BPNT1,ABRACL,COX6A1,CRYL1,ETFA,LGALS3,MAD2L1BP, MGST3,MLX,MYL12B,NAT2,NCOA4,SLC51B,SDHB, SLC25A20,SLC25A5,SLMO2,TACO1,TP53TG1,UQCRQ,WIBG |
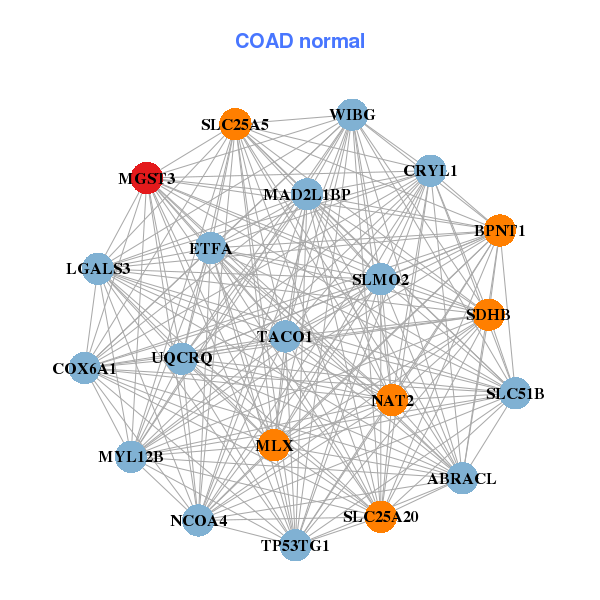
| * Co-Expression network figures were drawn using R package igraph. Only the top 20 genes with the highest correlations were shown. Red circle: input gene, orange circle: cell metabolism gene, sky circle: other gene |
: Open all plots for all cancer types
| Top |
: Open all interacting genes' information including KEGG pathway for all interacting genes from DAVID
| Top |
| Pharmacological Information for MGST3 |
| DB Category | DB Name | DB's ID and Url link |
| * Gene Centered Interaction Network. |
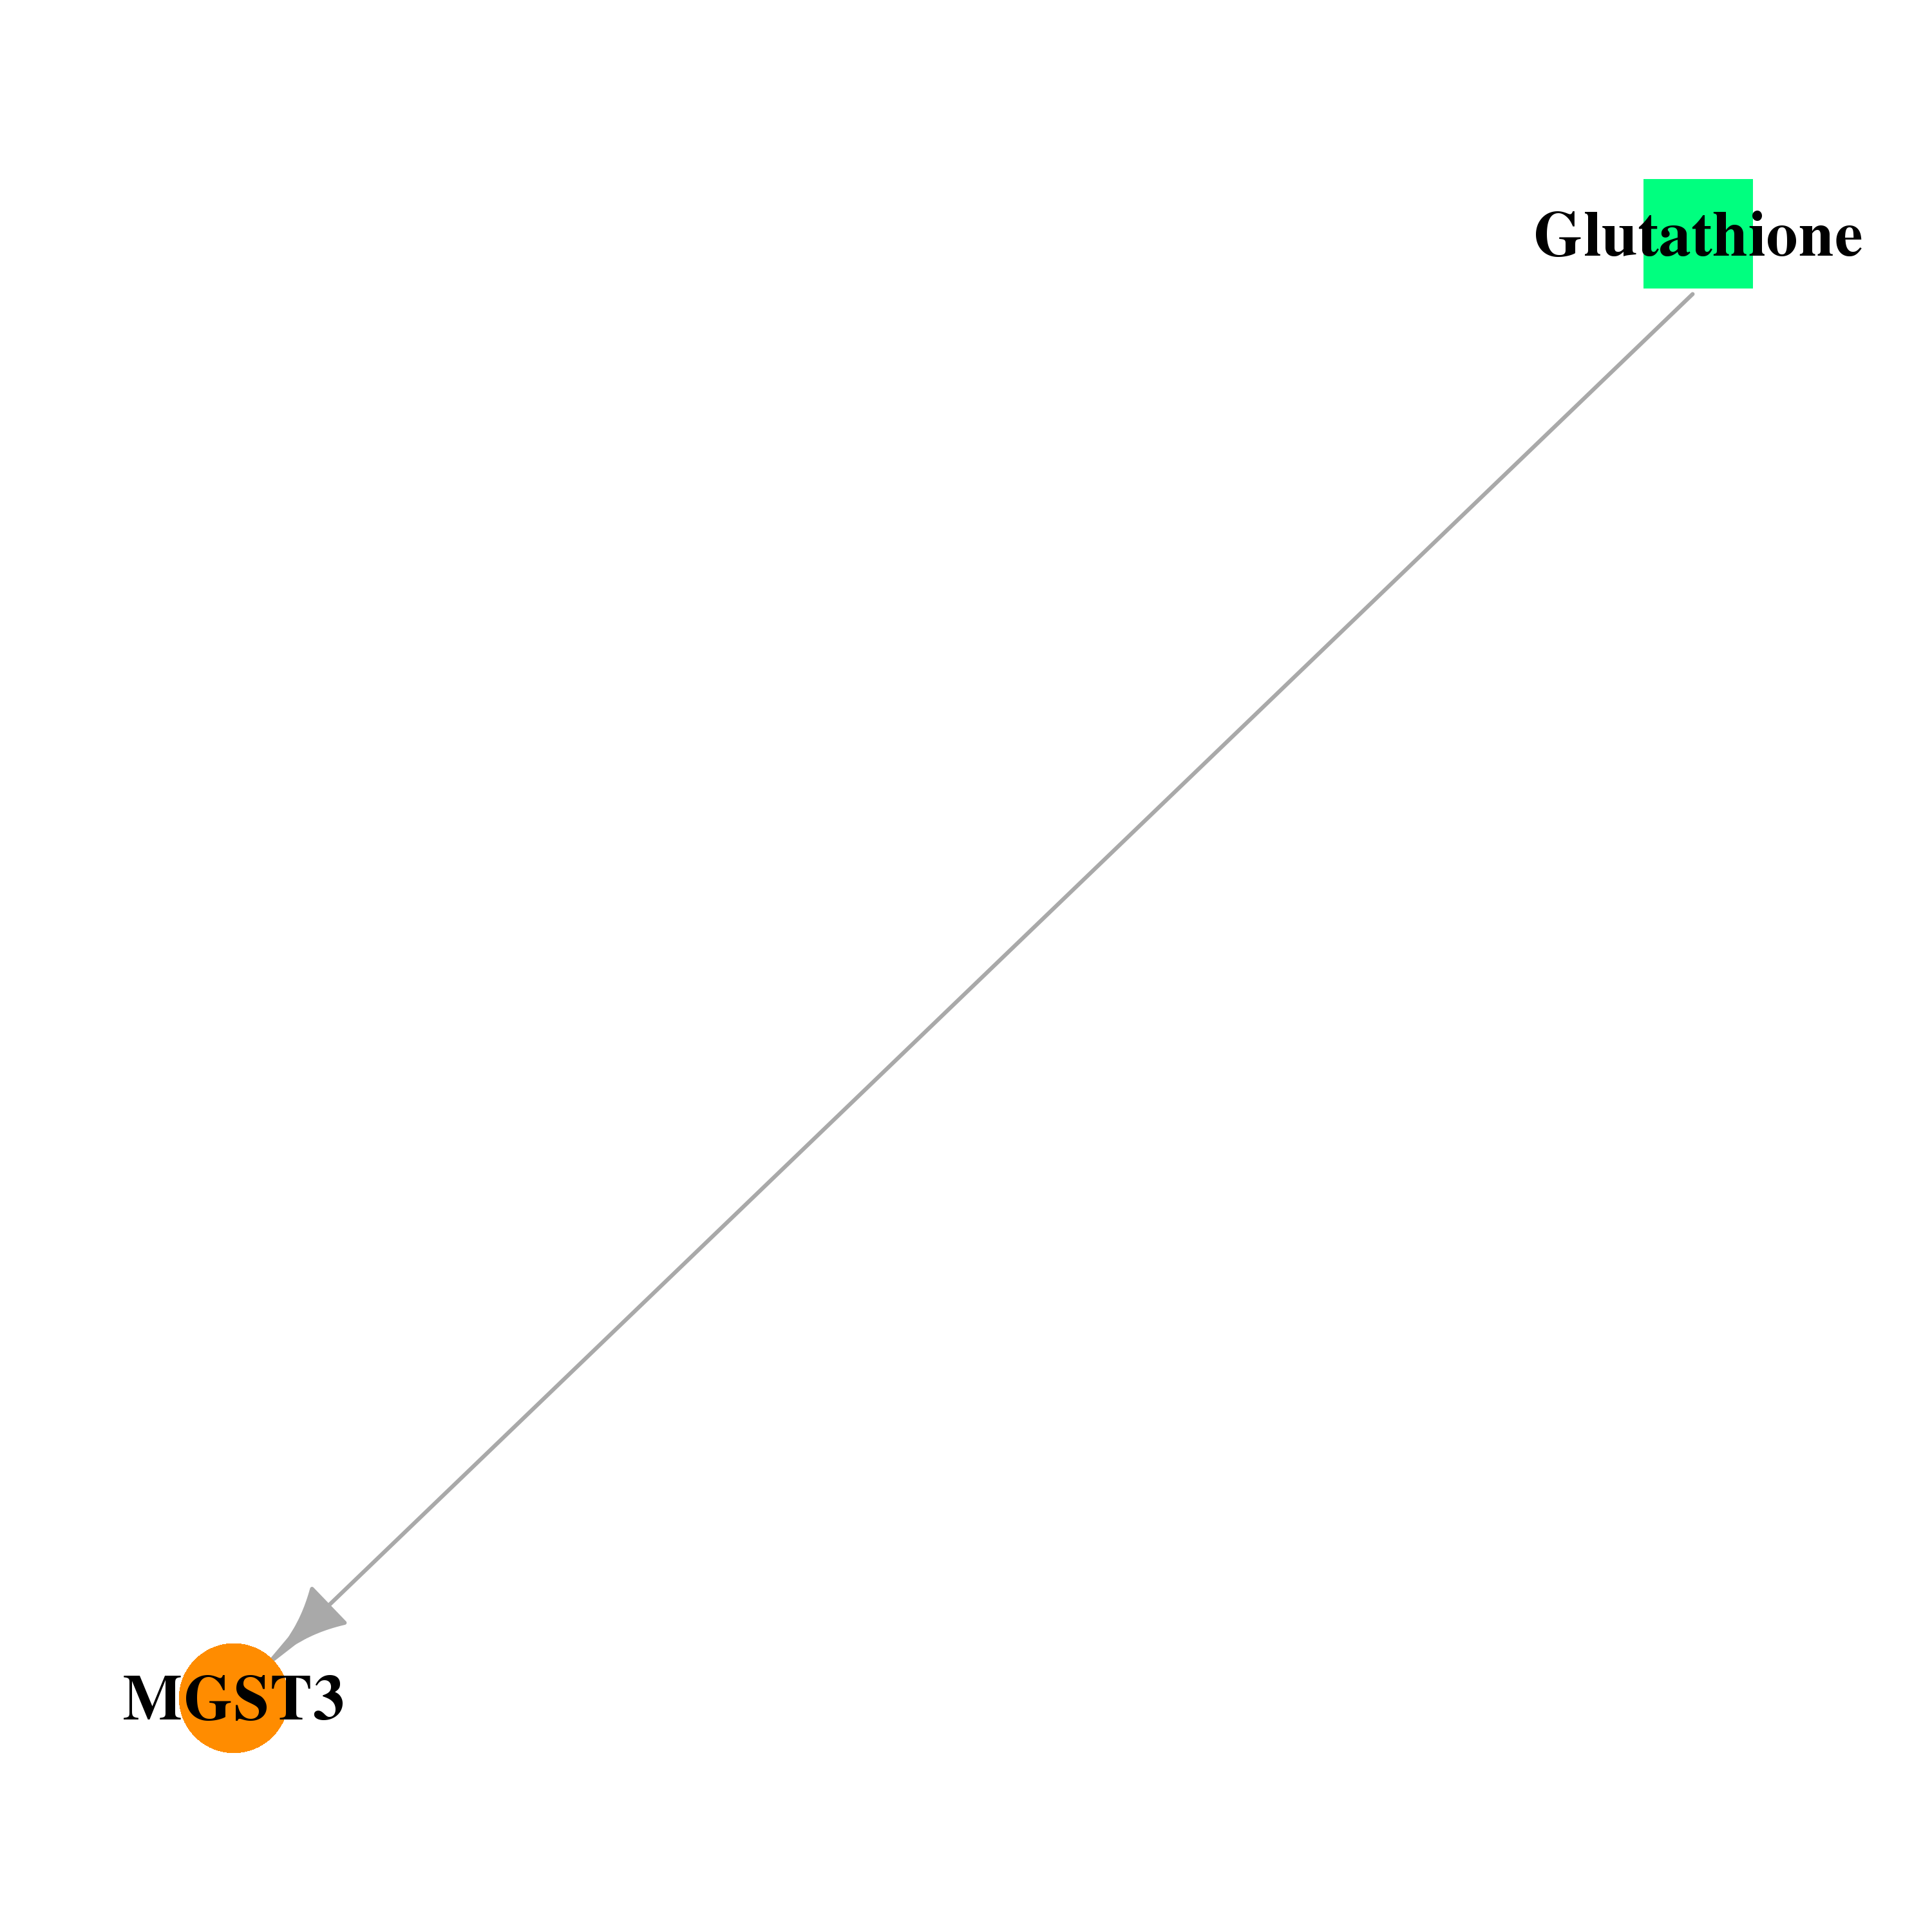 |
| * Drug Centered Interaction Network. |
| DrugBank ID | Target Name | Drug Groups | Generic Name | Drug Centered Network | Drug Structure |
| DB00143 | microsomal glutathione S-transferase 3 | approved; nutraceutical | Glutathione |  |  |
| Top |
| Cross referenced IDs for MGST3 |
| * We obtained these cross-references from Uniprot database. It covers 150 different DBs, 18 categories. http://www.uniprot.org/help/cross_references_section |
: Open all cross reference information
|
Copyright © 2016-Present - The Univsersity of Texas Health Science Center at Houston @ |