|
|||||||||||||||||||||||||||||||||||||||||||||||||||||||||||||||||||||||||||||||||||||||||||||||||||||||||||||||||||||||||||||||||||||||||||||||||||||||||||||||||||||||||||||||||||||||||||||||||||||||||||||||||||||||||||||||||||||||||||||||||||||||||||||||||||||||||||||||||||||||||||||||||||||||||||||||||||||||||||||||||||||||||||||
| |
| Phenotypic Information (metabolism pathway, cancer, disease, phenome) |
| |
| |
| Gene-Gene Network Information: Co-Expression Network, Interacting Genes & KEGG |
| |
|


| Gene Summary for ASAH1 |
| Top |
| Phenotypic Information for ASAH1(metabolism pathway, cancer, disease, phenome) |
| Cancer | CGAP: ASAH1 |
| Familial Cancer Database: ASAH1 | |
| * This gene is included in those cancer gene databases. |
|
|
|
|
|
|
| |||||||||||||||||||||||||||||||||||||||||||||||||||||||||||||||||||||||||||||||||||||||||||||||||||||||||||||||||||||||||||||||||||||||||||||||||||||||||||||||||||||||||||||||||||||||||||||||||||||||||||||||||||||||||||||||||||||||||||||||||||||||||||||||||||||||||||||||||||||||||||||||||||||||||||||||||||||||||||||||||||||||
Oncogene 1 | Significant driver gene in | ||||||||||||||||||||||||||||||||||||||||||||||||||||||||||||||||||||||||||||||||||||||||||||||||||||||||||||||||||||||||||||||||||||||||||||||||||||||||||||||||||||||||||||||||||||||||||||||||||||||||||||||||||||||||||||||||||||||||||||||||||||||||||||||||||||||||||||||||||||||||||||||||||||||||||||||||||||||||||||||||||||||||||||
| cf) number; DB name 1 Oncogene; http://nar.oxfordjournals.org/content/35/suppl_1/D721.long, 2 Tumor Suppressor gene; https://bioinfo.uth.edu/TSGene/, 3 Cancer Gene Census; http://www.nature.com/nrc/journal/v4/n3/abs/nrc1299.html, 4 CancerGenes; http://nar.oxfordjournals.org/content/35/suppl_1/D721.long, 5 Network of Cancer Gene; http://ncg.kcl.ac.uk/index.php, 1Therapeutic Vulnerabilities in Cancer; http://cbio.mskcc.org/cancergenomics/statius/ |
| KEGG_SPHINGOLIPID_METABOLISM REACTOME_GLYCOSPHINGOLIPID_METABOLISM REACTOME_PHOSPHOLIPID_METABOLISM REACTOME_SPHINGOLIPID_METABOLISM REACTOME_METABOLISM_OF_LIPIDS_AND_LIPOPROTEINS | |
| OMIM | |
| Orphanet | |
| Disease | KEGG Disease: ASAH1 |
| MedGen: ASAH1 (Human Medical Genetics with Condition) | |
| ClinVar: ASAH1 | |
| Phenotype | MGI: ASAH1 (International Mouse Phenotyping Consortium) |
| PhenomicDB: ASAH1 | |
| Mutations for ASAH1 |
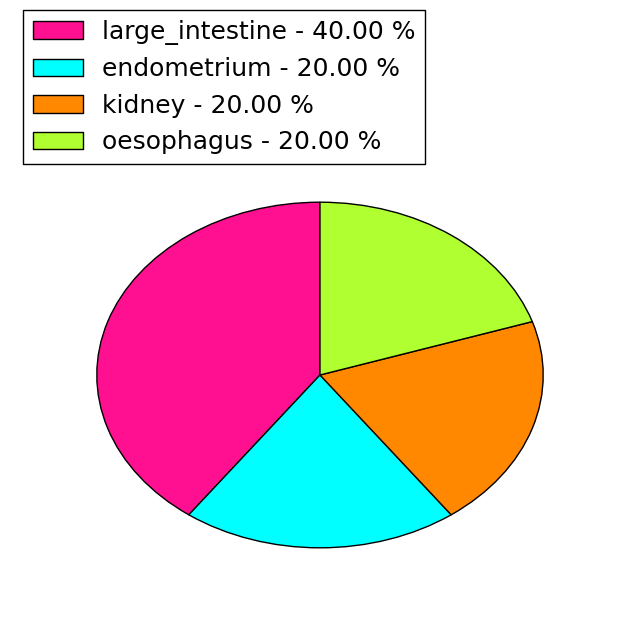
| * Under tables are showing count per each tissue to give us broad intuition about tissue specific mutation patterns.You can go to the detailed page for each mutation database's web site. |
| There's no structural variation information in COSMIC data for this gene. |
| * From mRNA Sanger sequences, Chitars2.0 arranged chimeric transcripts. This table shows ASAH1 related fusion information. |
| ID | Head Gene | Tail Gene | Accession | Gene_a | qStart_a | qEnd_a | Chromosome_a | tStart_a | tEnd_a | Gene_a | qStart_a | qEnd_a | Chromosome_a | tStart_a | tEnd_a |
| DA755770 | ASAH1 | 1 | 163 | 8 | 17933050 | 17941605 | SF3B3 | 164 | 576 | 16 | 70575572 | 70588426 | |
| BF988401 | ASAH1 | 25 | 377 | 8 | 17923066 | 17923419 | CTBP1 | 373 | 533 | 4 | 1236876 | 1237036 | |
| AA501801 | ASAH1 | 8 | 136 | 8 | 17913963 | 17914091 | ASAH1 | 132 | 269 | 8 | 17914076 | 17914213 | |
| BU690017 | ASAH1 | 18 | 403 | 8 | 17913935 | 17914320 | ASAH1 | 395 | 544 | 8 | 17914291 | 17914440 | |
| DB172989 | SHROOM3 | 1 | 463 | 4 | 77547462 | 77547922 | ASAH1 | 464 | 574 | 8 | 17941507 | 17941617 | |
| DB239554 | ASAH1 | 1 | 175 | 8 | 17933049 | 17942311 | PCM1 | 175 | 591 | 8 | 17817523 | 17819676 | |
| Top |
| Mutation type/ Tissue ID | brca | cns | cerv | endome | haematopo | kidn | Lintest | liver | lung | ns | ovary | pancre | prost | skin | stoma | thyro | urina | |||
| Total # sample | 3 | 1 | 1 | |||||||||||||||||
| GAIN (# sample) | 1 | |||||||||||||||||||
| LOSS (# sample) | 2 | 1 | 1 |
| cf) Tissue ID; Tissue type (1; Breast, 2; Central_nervous_system, 3; Cervix, 4; Endometrium, 5; Haematopoietic_and_lymphoid_tissue, 6; Kidney, 7; Large_intestine, 8; Liver, 9; Lung, 10; NS, 11; Ovary, 12; Pancreas, 13; Prostate, 14; Skin, 15; Stomach, 16; Thyroid, 17; Urinary_tract) |
| Top |
|
 |
| Top |
| Stat. for Non-Synonymous SNVs (# total SNVs=27) | (# total SNVs=5) |
 |  |
(# total SNVs=1) | (# total SNVs=0) |
 |
| Top |
| * When you move the cursor on each content, you can see more deailed mutation information on the Tooltip. Those are primary_site,primary_histology,mutation(aa),pubmedID. |
| GRCh37 position | Mutation(aa) | Unique sampleID count |
| chr8:17920740-17920740 | p.? | 3 |
| chr8:17933090-17933090 | p.E29Q | 2 |
| chr8:17927343-17927343 | p.F87F | 2 |
| chr8:17915072-17915072 | p.D387Y | 2 |
| chr8:17927368-17927368 | p.S79Y | 2 |
| chr8:17922029-17922029 | p.S132A | 2 |
| chr8:17916887-17916887 | p.T335M | 2 |
| chr8:17920713-17920713 | p.D162N | 1 |
| chr8:17924795-17924795 | p.G106C | 1 |
| chr8:17916969-17916969 | p.D308N | 1 |
| Top |
|
 |
| Point Mutation/ Tissue ID | 1 | 2 | 3 | 4 | 5 | 6 | 7 | 8 | 9 | 10 | 11 | 12 | 13 | 14 | 15 | 16 | 17 | 18 | 19 | 20 |
| # sample | 2 | 1 | 5 | 1 | 1 | 1 | 3 | 3 | 8 | |||||||||||
| # mutation | 2 | 1 | 5 | 1 | 1 | 1 | 4 | 3 | 9 | |||||||||||
| nonsynonymous SNV | 2 | 1 | 3 | 1 | 1 | 1 | 3 | 2 | 7 | |||||||||||
| synonymous SNV | 2 | 1 | 1 | 2 |
| cf) Tissue ID; Tissue type (1; BLCA[Bladder Urothelial Carcinoma], 2; BRCA[Breast invasive carcinoma], 3; CESC[Cervical squamous cell carcinoma and endocervical adenocarcinoma], 4; COAD[Colon adenocarcinoma], 5; GBM[Glioblastoma multiforme], 6; Glioma Low Grade, 7; HNSC[Head and Neck squamous cell carcinoma], 8; KICH[Kidney Chromophobe], 9; KIRC[Kidney renal clear cell carcinoma], 10; KIRP[Kidney renal papillary cell carcinoma], 11; LAML[Acute Myeloid Leukemia], 12; LUAD[Lung adenocarcinoma], 13; LUSC[Lung squamous cell carcinoma], 14; OV[Ovarian serous cystadenocarcinoma ], 15; PAAD[Pancreatic adenocarcinoma], 16; PRAD[Prostate adenocarcinoma], 17; SKCM[Skin Cutaneous Melanoma], 18:STAD[Stomach adenocarcinoma], 19:THCA[Thyroid carcinoma], 20:UCEC[Uterine Corpus Endometrial Carcinoma]) |
| Top |
| * We represented just top 10 SNVs. When you move the cursor on each content, you can see more deailed mutation information on the Tooltip. Those are primary_site, primary_histology, mutation(aa), pubmedID. |
| Genomic Position | Mutation(aa) | Unique sampleID count |
| chr8:17916887 | p.S95Y,ASAH1 | 2 |
| chr8:17927368 | p.T329M,ASAH1 | 2 |
| chr8:17928835 | p.G152W,ASAH1 | 1 |
| chr8:17919789 | p.H148Y,ASAH1 | 1 |
| chr8:17930774 | p.T138I,ASAH1 | 1 |
| chr8:17919892 | p.E123D,ASAH1 | 1 |
| chr8:17933058 | p.M110I,ASAH1 | 1 |
| chr8:17920725 | p.L117M,ASAH1 | 1 |
| chr8:17933090 | p.D384G,ASAH1 | 1 |
| chr8:17915062 | p.F103F,ASAH1 | 1 |
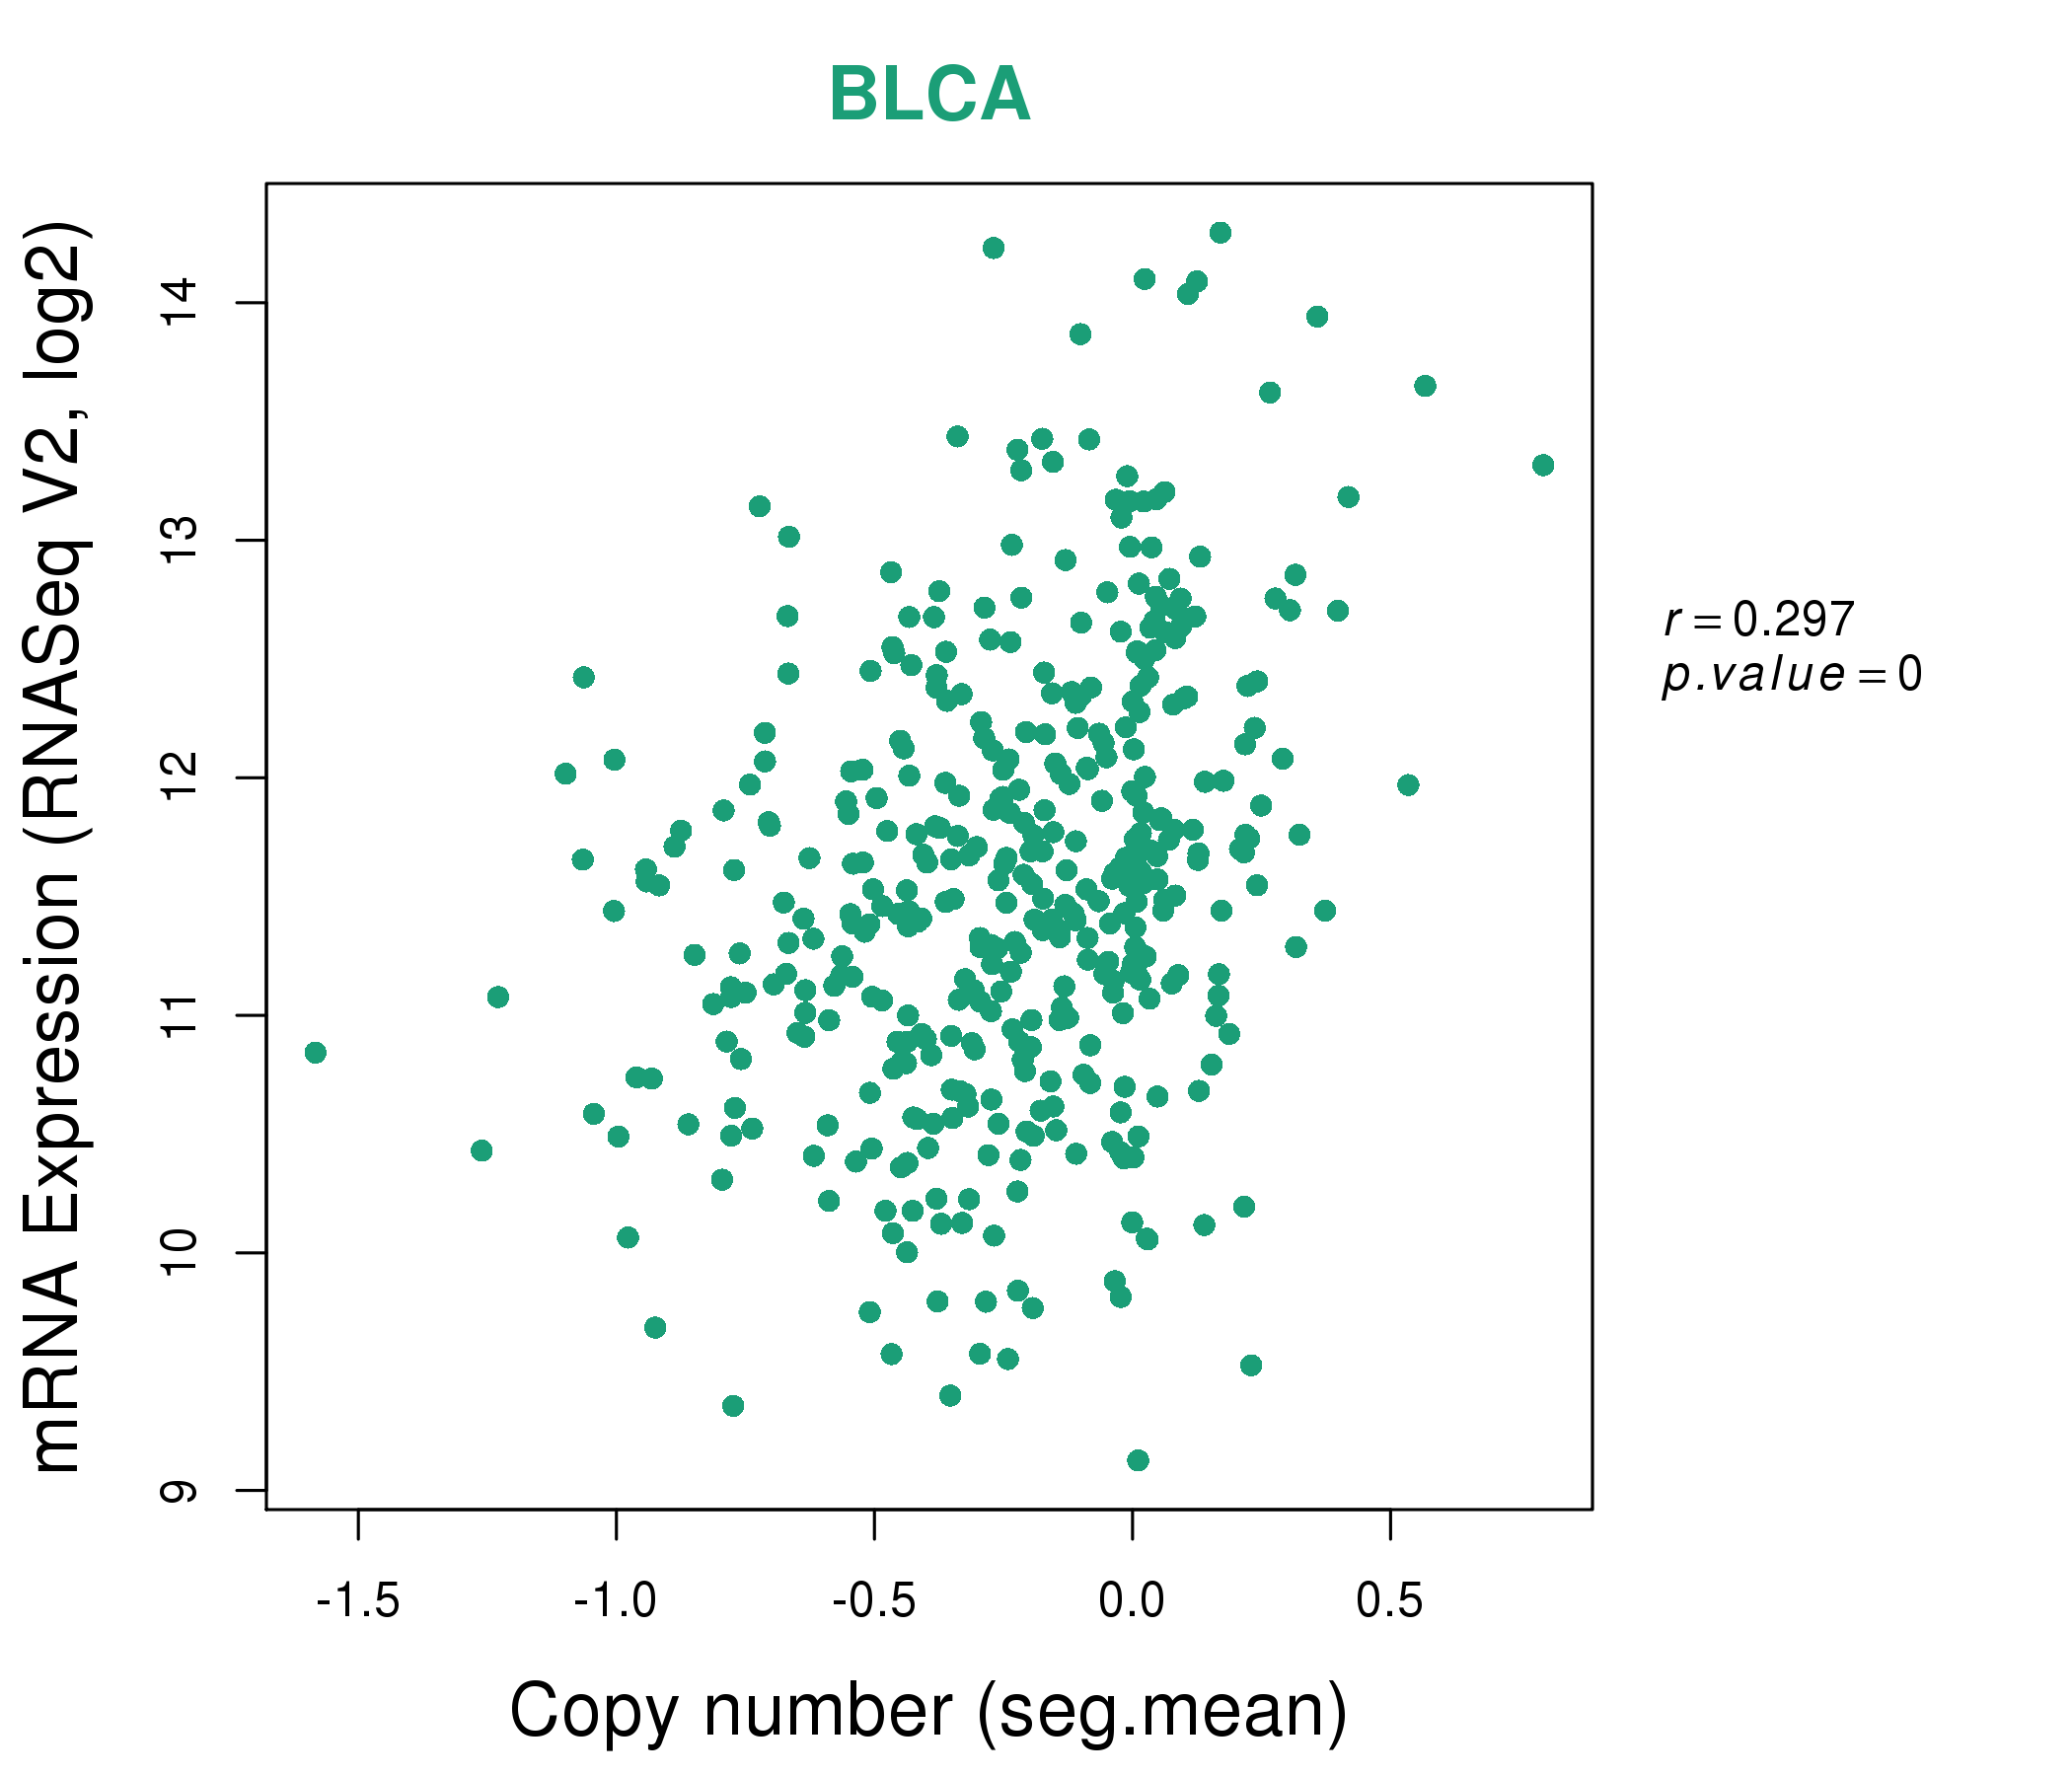
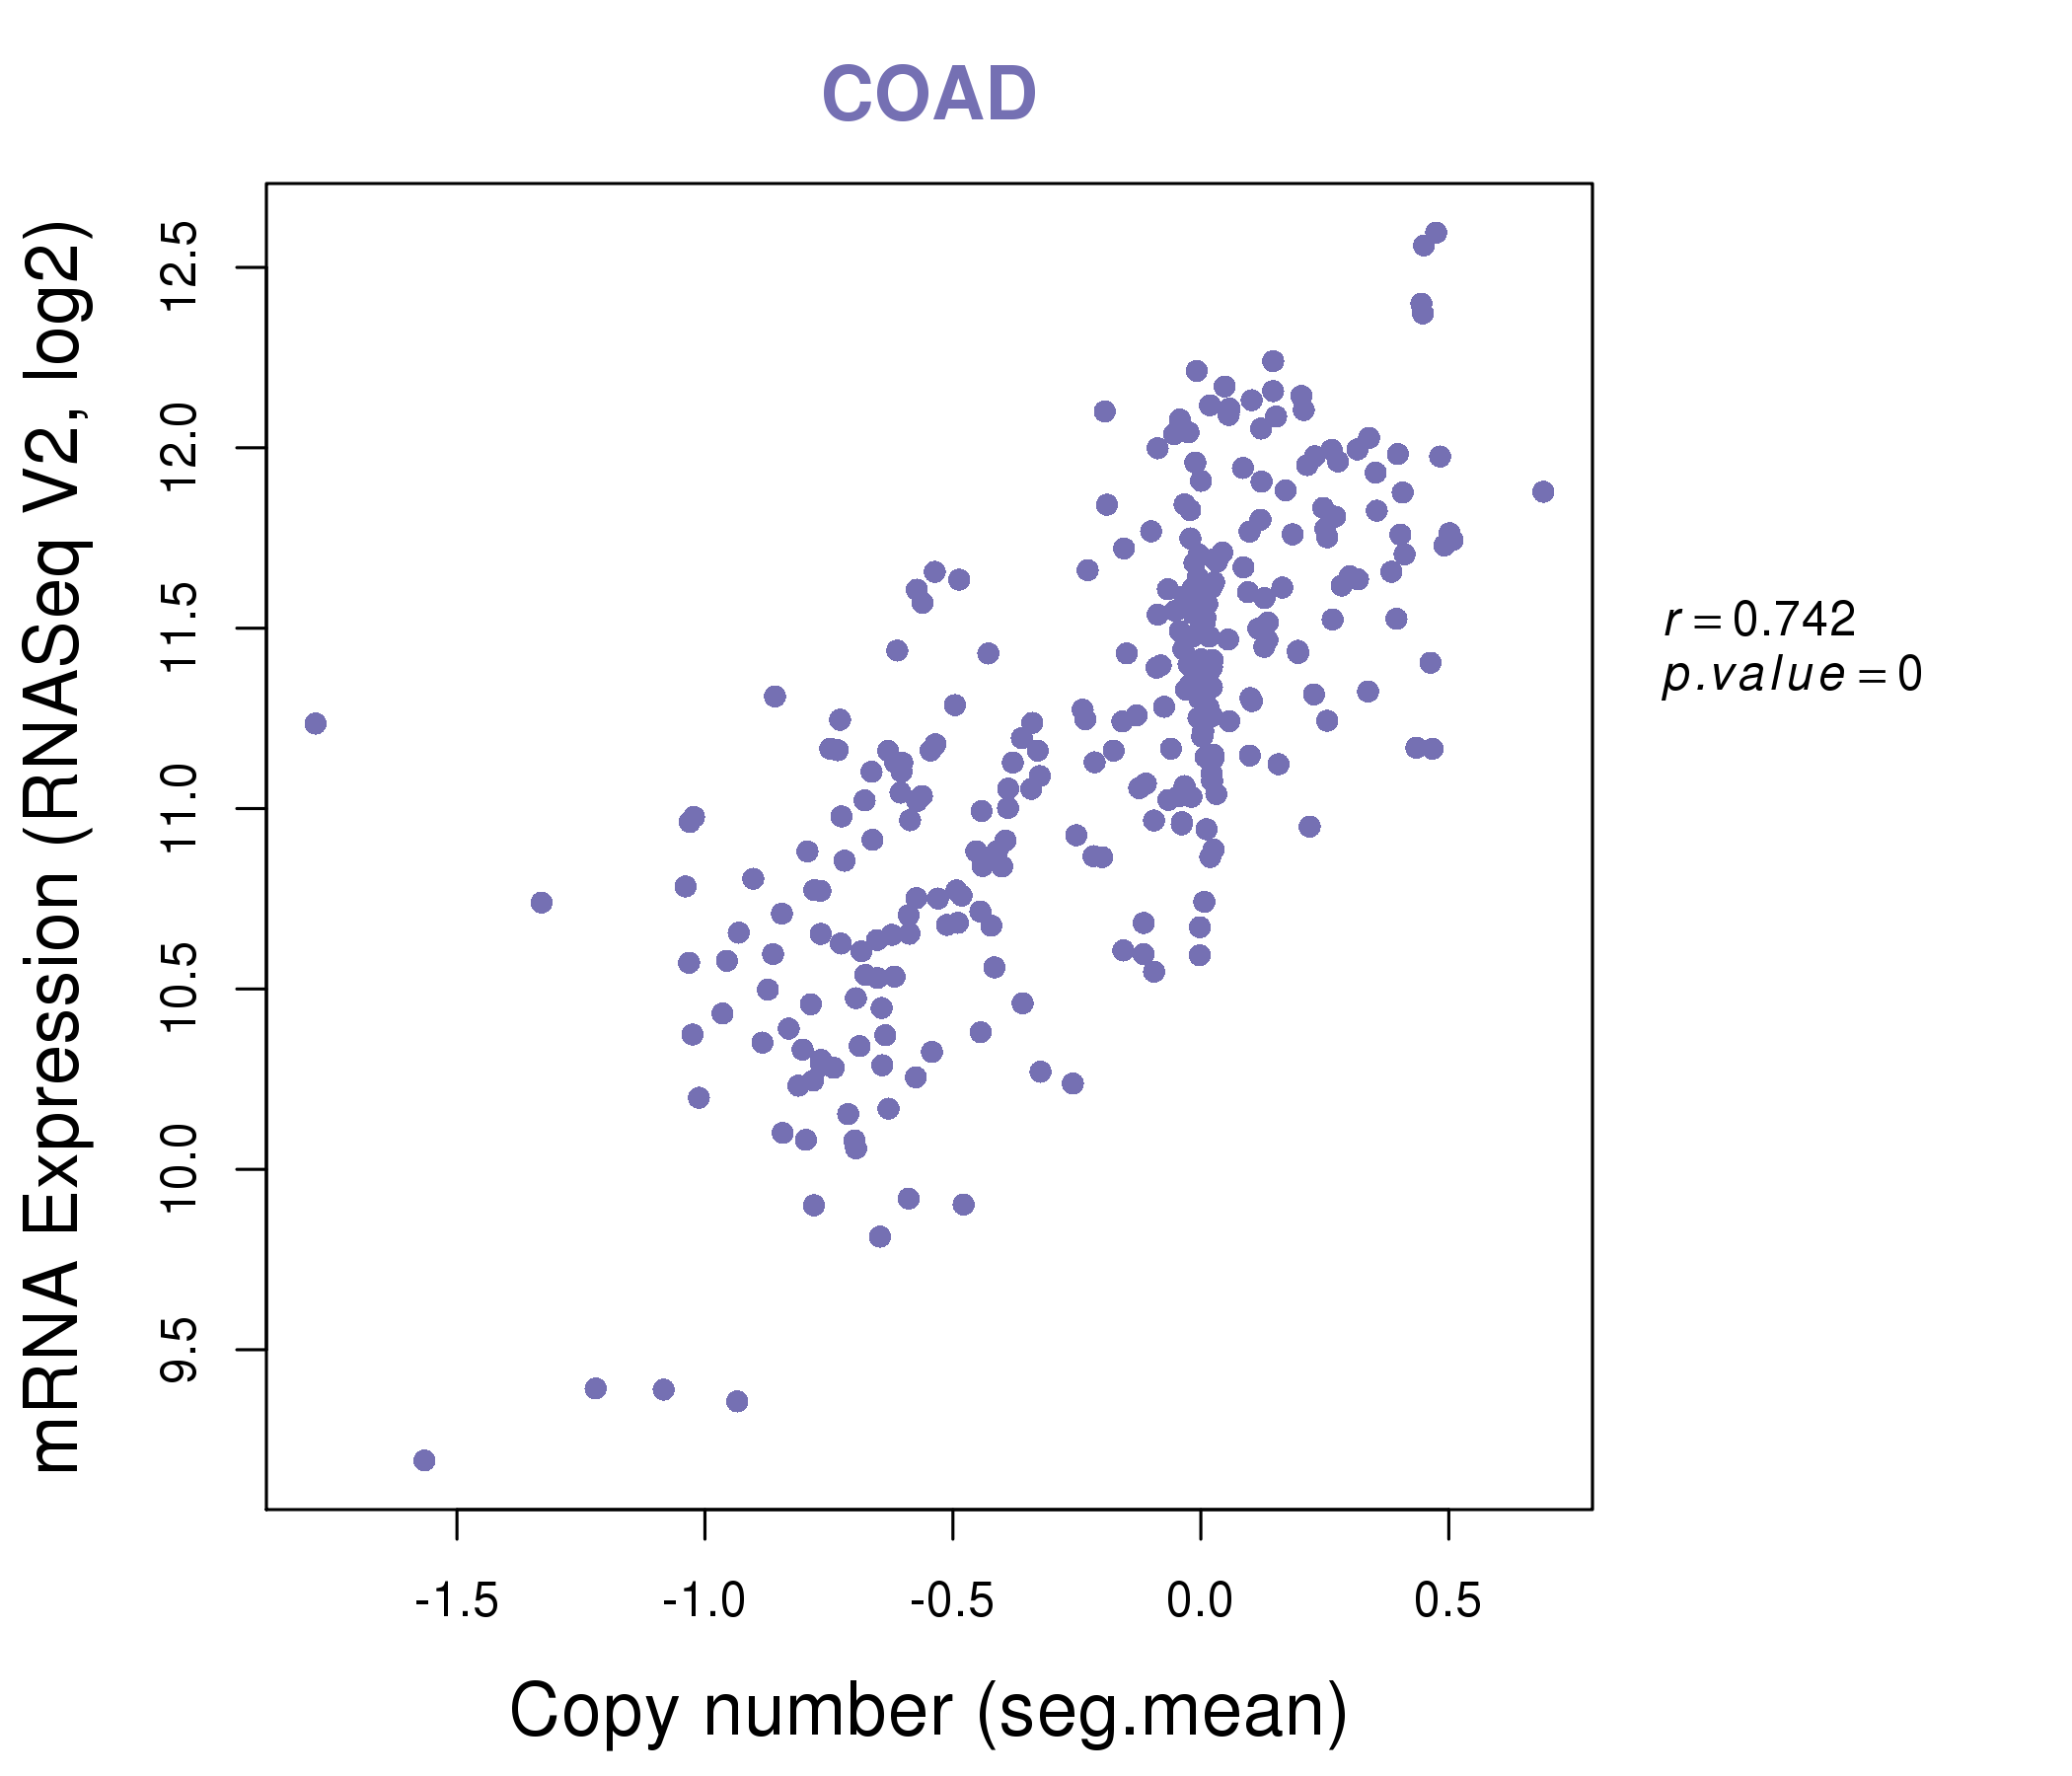
| * Copy number data were extracted from TCGA using R package TCGA-Assembler. The URLs of all public data files on TCGA DCC data server were gathered on Jan-05-2015. Function ProcessCNAData in TCGA-Assembler package was used to obtain gene-level copy number value which is calculated as the average copy number of the genomic region of a gene. |
 |
| cf) Tissue ID[Tissue type]: BLCA[Bladder Urothelial Carcinoma], BRCA[Breast invasive carcinoma], CESC[Cervical squamous cell carcinoma and endocervical adenocarcinoma], COAD[Colon adenocarcinoma], GBM[Glioblastoma multiforme], Glioma Low Grade, HNSC[Head and Neck squamous cell carcinoma], KICH[Kidney Chromophobe], KIRC[Kidney renal clear cell carcinoma], KIRP[Kidney renal papillary cell carcinoma], LAML[Acute Myeloid Leukemia], LUAD[Lung adenocarcinoma], LUSC[Lung squamous cell carcinoma], OV[Ovarian serous cystadenocarcinoma ], PAAD[Pancreatic adenocarcinoma], PRAD[Prostate adenocarcinoma], SKCM[Skin Cutaneous Melanoma], STAD[Stomach adenocarcinoma], THCA[Thyroid carcinoma], UCEC[Uterine Corpus Endometrial Carcinoma] |
| Top |
| Gene Expression for ASAH1 |
| * CCLE gene expression data were extracted from CCLE_Expression_Entrez_2012-10-18.res: Gene-centric RMA-normalized mRNA expression data. |
 |
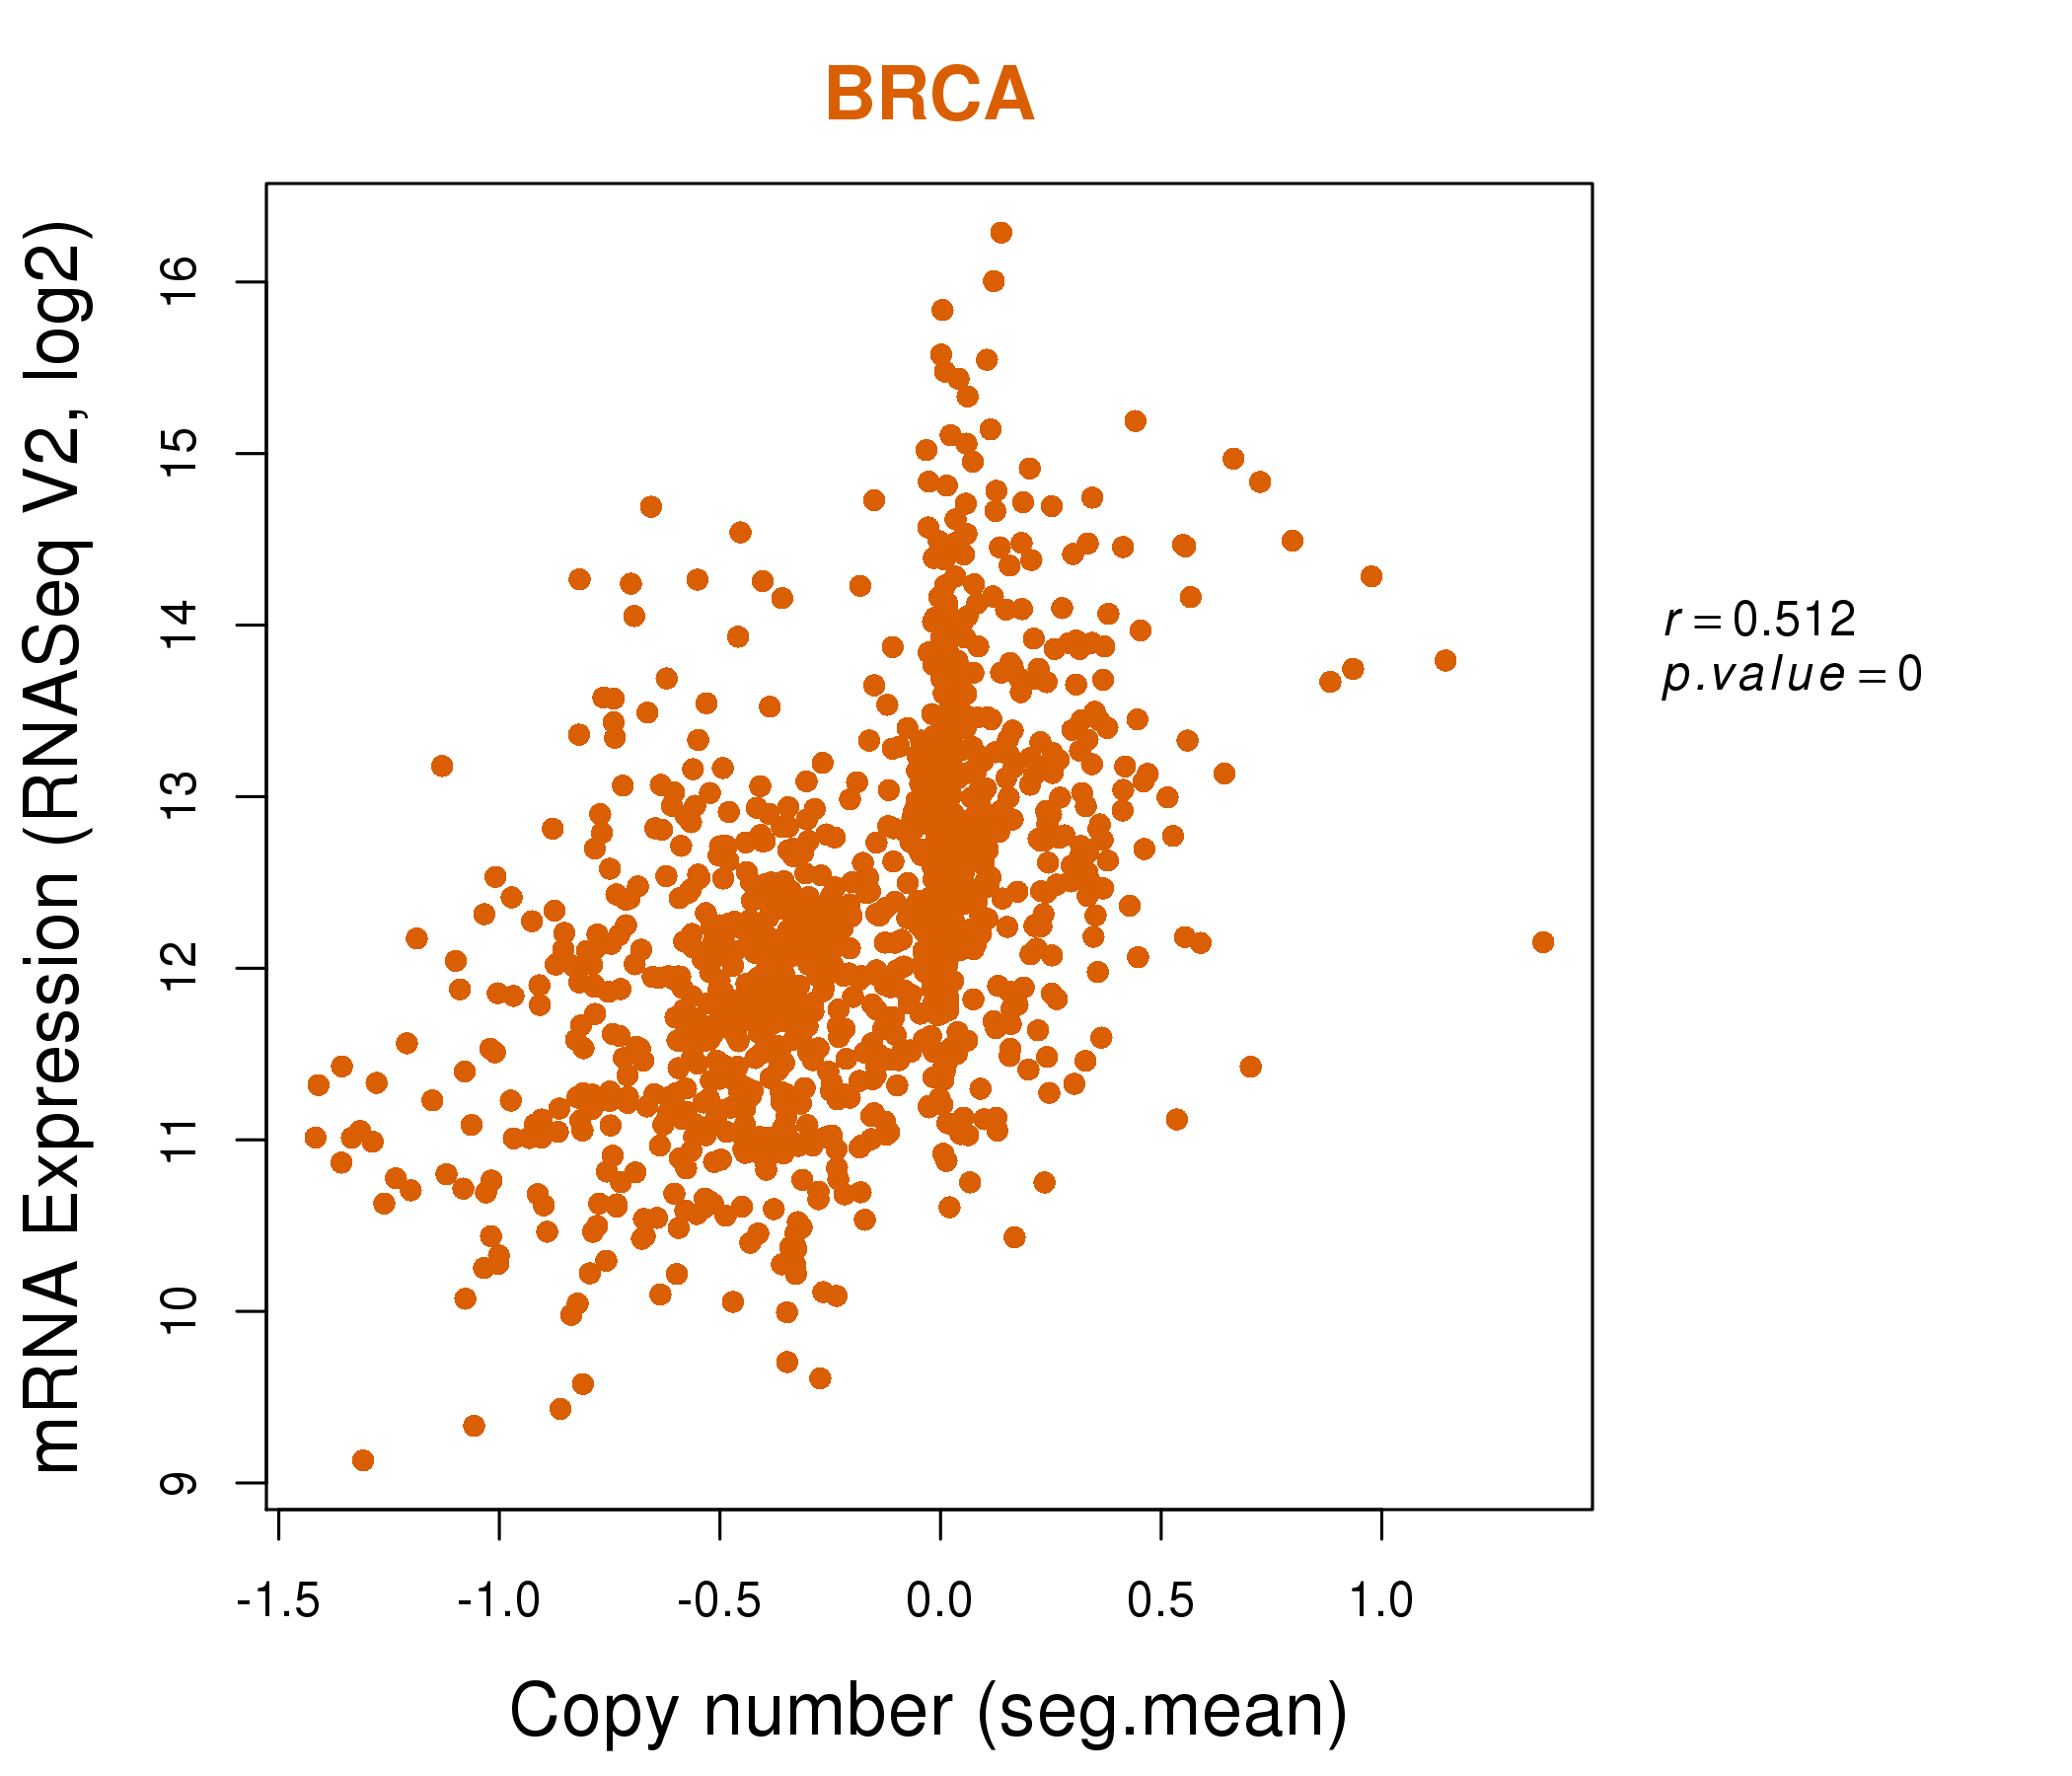
| * Normalized gene expression data of RNASeqV2 was extracted from TCGA using R package TCGA-Assembler. The URLs of all public data files on TCGA DCC data server were gathered at Jan-05-2015. Only eight cancer types have enough normal control samples for differential expression analysis. (t test, adjusted p<0.05 (using Benjamini-Hochberg FDR)) |
 |
| Top |
| * This plots show the correlation between CNV and gene expression. |
: Open all plots for all cancer types
 |
|
 |
|

| Top |
| Gene-Gene Network Information |
| * Co-Expression network figures were drawn using R package igraph. Only the top 20 genes with the highest correlations were shown. Red circle: input gene, orange circle: cell metabolism gene, sky circle: other gene |
: Open all plots for all cancer types
 |
| ||||
| ASAH1,CCDC176,KIAA0825,DNAH7,DTWD2,EIF4E3,ENTPD4, EXOC6,HMBOX1,KIF13B,NAT1,NUDT12,PCM1,PJA2, POLK,PPP2R2A,PSD3,SH2D4A,SPATA6,SARAF,TNKS | ASAH1,ASPH,BTD,CAV1,ECM2,GNG2,GNS, GTDC1,HNMT,MBD2,MGST1,MMD,NMT2,OSTM1, PGRMC2,PYGL,RHOQ,SAR1A,SEPT11,STS,VKORC1L1 | ||||
 |
| ||||
| ASAH1,ATP6V1B2,CCDC25,CHMP7,CNOT7,CTSB,ELP3, ENTPD4,INTS10,LEPROTL1,MCPH1,PCM1,POLR3D,PPP2CB, PPP2R2A,R3HCC1,SLC39A14,SARAF,TRIM35,VPS37A,XPO7 | ASAH1,BDNF-AS,TRIQK,CASC4,CD200R1,CLCA1,COG2, CREB3L4,CTBS,DRAM2,ENPP5,HEPACAM2,HEXA,KLK1, NPC2,NPL,PLBD1,SNX5,ST6GALNAC1,TFF3,ZNF816 |

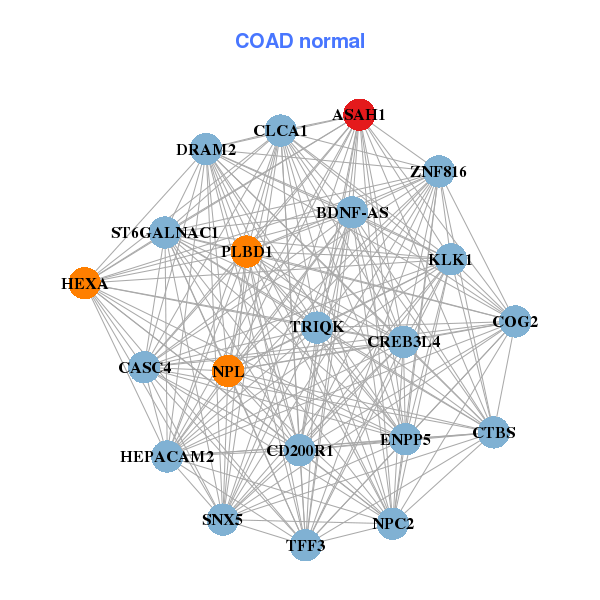
| * Co-Expression network figures were drawn using R package igraph. Only the top 20 genes with the highest correlations were shown. Red circle: input gene, orange circle: cell metabolism gene, sky circle: other gene |
: Open all plots for all cancer types
| Top |
: Open all interacting genes' information including KEGG pathway for all interacting genes from DAVID
| Top |
| Pharmacological Information for ASAH1 |
| DB Category | DB Name | DB's ID and Url link |
| * Gene Centered Interaction Network. |
 |
| * Drug Centered Interaction Network. |
| DrugBank ID | Target Name | Drug Groups | Generic Name | Drug Centered Network | Drug Structure |
| DB00143 | N-acylsphingosine amidohydrolase (acid ceramidase) 1 | approved; nutraceutical | Glutathione |  |  |
| Top |
| Cross referenced IDs for ASAH1 |
| * We obtained these cross-references from Uniprot database. It covers 150 different DBs, 18 categories. http://www.uniprot.org/help/cross_references_section |
: Open all cross reference information
|
Copyright © 2016-Present - The Univsersity of Texas Health Science Center at Houston @ |