|
||||||||||||||||||||||||||||||||||||||||||||||||||||||||||||||||||||||||||||||||||||||||||||||||||||||||||||||||||||||||||||||||||||||||||||||||||||||||||||||||||||||||||||||||||||||||||||||||||||||||||||||||||||||||||||||||||||||||||||||||||||||||||||||||||||||||||||||||||||||||||||||||||||||||||||||||||||||||||
| |
| Phenotypic Information (metabolism pathway, cancer, disease, phenome) |
| |
| |
| Gene-Gene Network Information: Co-Expression Network, Interacting Genes & KEGG |
| |
|


| Gene Summary for MOCS1 |
| Basic gene info. | Gene symbol | MOCS1 |
| Gene name | molybdenum cofactor synthesis 1 | |
| Synonyms | MIG11|MOCOD|MOCODA | |
| Cytomap | UCSC genome browser: 6p21.3 | |
| Genomic location | chr6 :39872033-39902290 | |
| Type of gene | protein-coding | |
| RefGenes | NM_001075098.3, NM_005943.5,NR_033233.1,NM_005942.3,NM_138928.3, | |
| Ensembl id | ENSG00000124615 | |
| Description | MOCS1A enzymecell migration-inducing gene 11 proteinmigration-inducing gene 11 proteinmolybdenum cofactor biosynthesis protein 1molybdenum cofactor biosynthesis protein Amolybdenum cofactor synthesis-step 1 protein A-B | |
| Modification date | 20141207 | |
| dbXrefs | MIM : 603707 | |
| HGNC : HGNC | ||
| Ensembl : ENSG00000124615 | ||
| HPRD : 04749 | ||
| Vega : OTTHUMG00000014656 | ||
| Protein | UniProt: Q9NZB8 go to UniProt's Cross Reference DB Table | |
| Expression | CleanEX: HS_MOCS1 | |
| BioGPS: 4337 | ||
| Gene Expression Atlas: ENSG00000124615 | ||
| The Human Protein Atlas: ENSG00000124615 | ||
| Pathway | NCI Pathway Interaction Database: MOCS1 | |
| KEGG: MOCS1 | ||
| REACTOME: MOCS1 | ||
| ConsensusPathDB | ||
| Pathway Commons: MOCS1 | ||
| Metabolism | MetaCyc: MOCS1 | |
| HUMANCyc: MOCS1 | ||
| Regulation | Ensembl's Regulation: ENSG00000124615 | |
| miRBase: chr6 :39,872,033-39,902,290 | ||
| TargetScan: NM_001075098 | ||
| cisRED: ENSG00000124615 | ||
| Context | iHOP: MOCS1 | |
| cancer metabolism search in PubMed: MOCS1 | ||
| UCL Cancer Institute: MOCS1 | ||
| Assigned class in ccmGDB | B - This gene belongs to cancer gene. | |
| Top |
| Phenotypic Information for MOCS1(metabolism pathway, cancer, disease, phenome) |
| Cancer | CGAP: MOCS1 |
| Familial Cancer Database: MOCS1 | |
| * This gene is included in those cancer gene databases. |
|
|
|
|
|
| . | ||||||||||||||||||||||||||||||||||||||||||||||||||||||||||||||||||||||||||||||||||||||||||||||||||||||||||||||||||||||||||||||||||||||||||||||||||||||||||||||||||||||||||||||||||||||||||||||||||||||||||||||||||||||||||||||||||||||||||||||||||||||||||||||||||||||||||||||||||||||||||||||||||||||||||||||||||||
Oncogene 1 | Significant driver gene in | |||||||||||||||||||||||||||||||||||||||||||||||||||||||||||||||||||||||||||||||||||||||||||||||||||||||||||||||||||||||||||||||||||||||||||||||||||||||||||||||||||||||||||||||||||||||||||||||||||||||||||||||||||||||||||||||||||||||||||||||||||||||||||||||||||||||||||||||||||||||||||||||||||||||||||||||||||||||||
| cf) number; DB name 1 Oncogene; http://nar.oxfordjournals.org/content/35/suppl_1/D721.long, 2 Tumor Suppressor gene; https://bioinfo.uth.edu/TSGene/, 3 Cancer Gene Census; http://www.nature.com/nrc/journal/v4/n3/abs/nrc1299.html, 4 CancerGenes; http://nar.oxfordjournals.org/content/35/suppl_1/D721.long, 5 Network of Cancer Gene; http://ncg.kcl.ac.uk/index.php, 1Therapeutic Vulnerabilities in Cancer; http://cbio.mskcc.org/cancergenomics/statius/ |
| REACTOME_METABOLISM_OF_VITAMINS_AND_COFACTORS | |
| OMIM | 252150; phenotype. 252150; phenotype. 603707; gene. 603707; gene. |
| Orphanet | 308386; Sulfite oxidase deficiency due to molybdenum cofactor deficiency type A. 308386; Sulfite oxidase deficiency due to molybdenum cofactor deficiency type A. |
| Disease | KEGG Disease: MOCS1 |
| MedGen: MOCS1 (Human Medical Genetics with Condition) | |
| ClinVar: MOCS1 | |
| Phenotype | MGI: MOCS1 (International Mouse Phenotyping Consortium) |
| PhenomicDB: MOCS1 | |
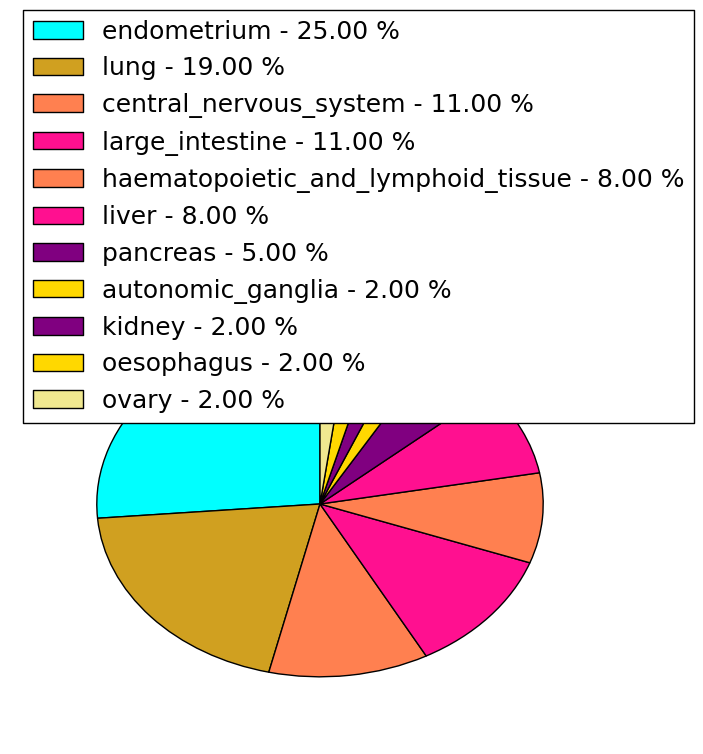
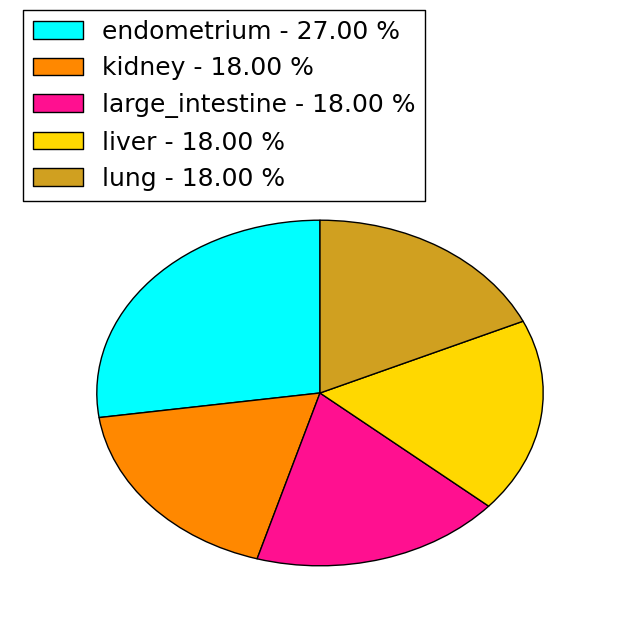
| Mutations for MOCS1 |
| * Under tables are showing count per each tissue to give us broad intuition about tissue specific mutation patterns.You can go to the detailed page for each mutation database's web site. |
| There's no structural variation information in COSMIC data for this gene. |
| * From mRNA Sanger sequences, Chitars2.0 arranged chimeric transcripts. This table shows MOCS1 related fusion information. |
| ID | Head Gene | Tail Gene | Accession | Gene_a | qStart_a | qEnd_a | Chromosome_a | tStart_a | tEnd_a | Gene_a | qStart_a | qEnd_a | Chromosome_a | tStart_a | tEnd_a |
| Top |
| Mutation type/ Tissue ID | brca | cns | cerv | endome | haematopo | kidn | Lintest | liver | lung | ns | ovary | pancre | prost | skin | stoma | thyro | urina | |||
| Total # sample | 1 | |||||||||||||||||||
| GAIN (# sample) | 1 | |||||||||||||||||||
| LOSS (# sample) |
| cf) Tissue ID; Tissue type (1; Breast, 2; Central_nervous_system, 3; Cervix, 4; Endometrium, 5; Haematopoietic_and_lymphoid_tissue, 6; Kidney, 7; Large_intestine, 8; Liver, 9; Lung, 10; NS, 11; Ovary, 12; Pancreas, 13; Prostate, 14; Skin, 15; Stomach, 16; Thyroid, 17; Urinary_tract) |
| Top |
|
 |
| Top |
| Stat. for Non-Synonymous SNVs (# total SNVs=36) | (# total SNVs=11) |
 |  |
(# total SNVs=0) | (# total SNVs=0) |
| Top |
| * When you move the cursor on each content, you can see more deailed mutation information on the Tooltip. Those are primary_site,primary_histology,mutation(aa),pubmedID. |
| GRCh37 position | Mutation(aa) | Unique sampleID count |
| chr6:39895232-39895232 | p.S29I | 2 |
| chr6:39877611-39877611 | p.A357V | 2 |
| chr6:39895264-39895264 | p.G18G | 2 |
| chr6:39893450-39893450 | p.L130L | 2 |
| chr6:39881541-39881541 | p.E208K | 2 |
| chr6:39880039-39880039 | p.R317H | 2 |
| chr6:39881119-39881119 | p.A233A | 2 |
| chr6:39893509-39893509 | p.A111T | 2 |
| chr6:39880067-39880067 | p.S308P | 1 |
| chr6:39893563-39893563 | p.V93I | 1 |
| Top |
|
 |
| Point Mutation/ Tissue ID | 1 | 2 | 3 | 4 | 5 | 6 | 7 | 8 | 9 | 10 | 11 | 12 | 13 | 14 | 15 | 16 | 17 | 18 | 19 | 20 |
| # sample | 1 | 3 | 1 | 3 | 4 | 3 | 1 | 1 | 4 | 7 | 9 | |||||||||
| # mutation | 1 | 3 | 1 | 3 | 4 | 3 | 1 | 1 | 7 | 8 | 11 | |||||||||
| nonsynonymous SNV | 1 | 1 | 1 | 3 | 2 | 1 | 1 | 2 | 3 | 8 | ||||||||||
| synonymous SNV | 1 | 2 | 2 | 1 | 1 | 5 | 5 | 3 |
| cf) Tissue ID; Tissue type (1; BLCA[Bladder Urothelial Carcinoma], 2; BRCA[Breast invasive carcinoma], 3; CESC[Cervical squamous cell carcinoma and endocervical adenocarcinoma], 4; COAD[Colon adenocarcinoma], 5; GBM[Glioblastoma multiforme], 6; Glioma Low Grade, 7; HNSC[Head and Neck squamous cell carcinoma], 8; KICH[Kidney Chromophobe], 9; KIRC[Kidney renal clear cell carcinoma], 10; KIRP[Kidney renal papillary cell carcinoma], 11; LAML[Acute Myeloid Leukemia], 12; LUAD[Lung adenocarcinoma], 13; LUSC[Lung squamous cell carcinoma], 14; OV[Ovarian serous cystadenocarcinoma ], 15; PAAD[Pancreatic adenocarcinoma], 16; PRAD[Prostate adenocarcinoma], 17; SKCM[Skin Cutaneous Melanoma], 18:STAD[Stomach adenocarcinoma], 19:THCA[Thyroid carcinoma], 20:UCEC[Uterine Corpus Endometrial Carcinoma]) |
| Top |
| * We represented just top 10 SNVs. When you move the cursor on each content, you can see more deailed mutation information on the Tooltip. Those are primary_site, primary_histology, mutation(aa), pubmedID. |
| Genomic Position | Mutation(aa) | Unique sampleID count |
| chr6:39881119 | p.R317H,MOCS1 | 2 |
| chr6:39880039 | p.A233A,MOCS1 | 2 |
| chr6:39881098 | p.A357V,MOCS1 | 1 |
| chr6:39893473 | p.K194E,MOCS1 | 1 |
| chr6:39877596 | p.P36H | 1 |
| chr6:39895171 | p.A357T,MOCS1 | 1 |
| chr6:39893477 | p.A185A,MOCS1 | 1 |
| chr6:39877611 | p.G31G | 1 |
| chr6:39895211 | p.D323D,MOCS1 | 1 |
| chr6:39881123 | p.L160L,MOCS1 | 1 |
| * Copy number data were extracted from TCGA using R package TCGA-Assembler. The URLs of all public data files on TCGA DCC data server were gathered on Jan-05-2015. Function ProcessCNAData in TCGA-Assembler package was used to obtain gene-level copy number value which is calculated as the average copy number of the genomic region of a gene. |
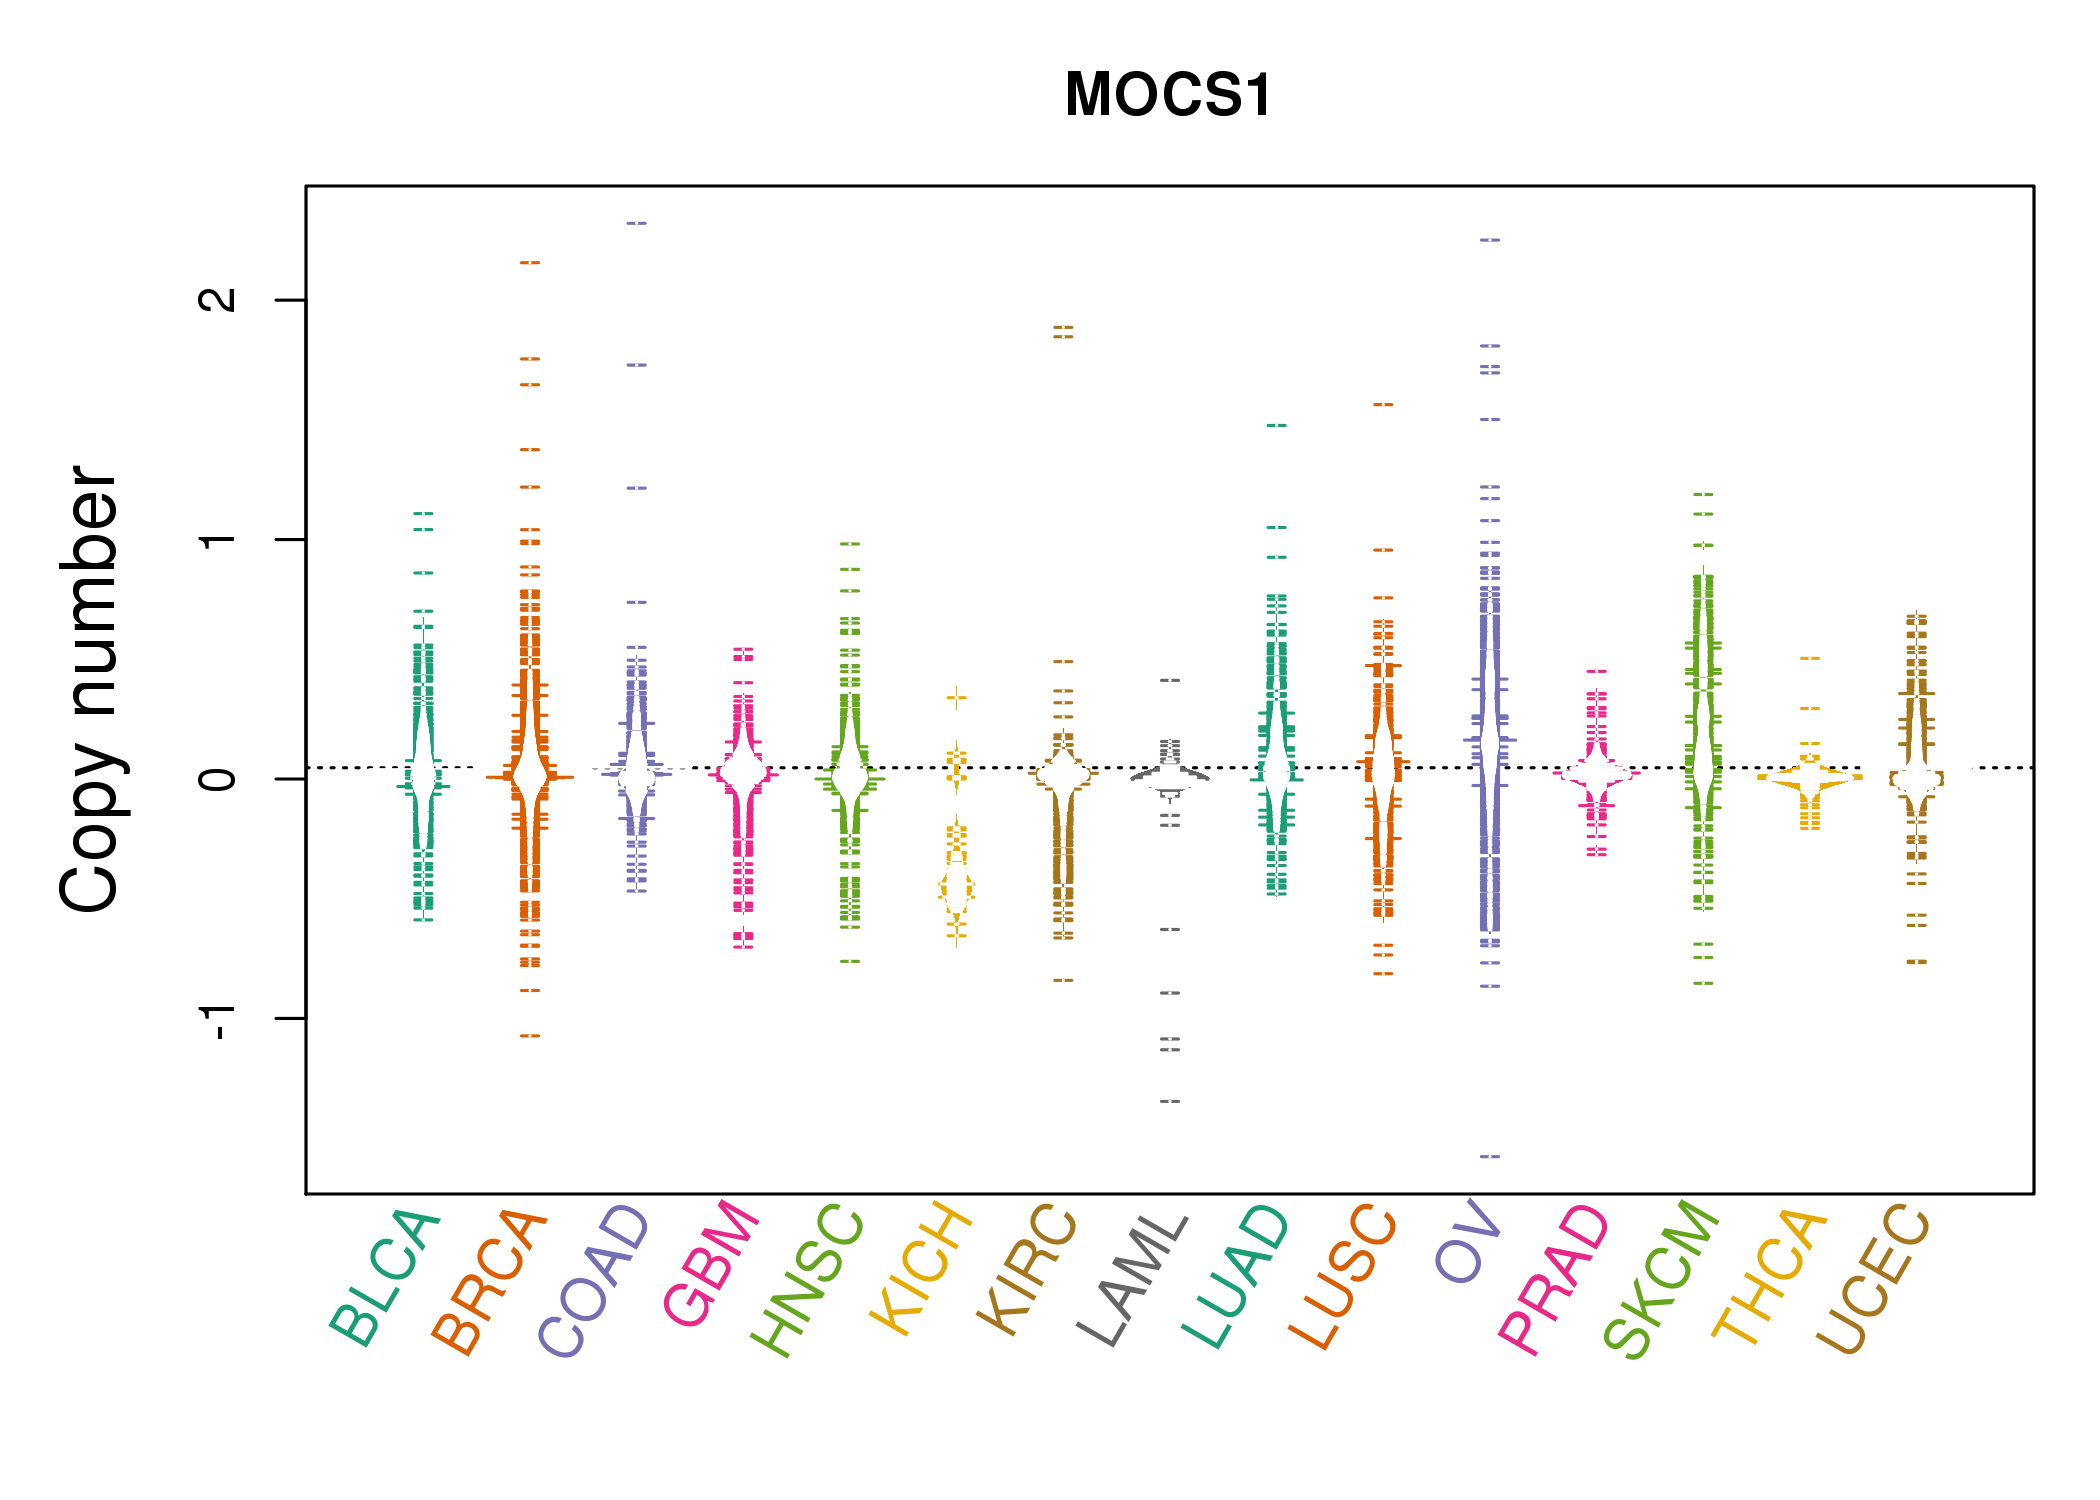 |
| cf) Tissue ID[Tissue type]: BLCA[Bladder Urothelial Carcinoma], BRCA[Breast invasive carcinoma], CESC[Cervical squamous cell carcinoma and endocervical adenocarcinoma], COAD[Colon adenocarcinoma], GBM[Glioblastoma multiforme], Glioma Low Grade, HNSC[Head and Neck squamous cell carcinoma], KICH[Kidney Chromophobe], KIRC[Kidney renal clear cell carcinoma], KIRP[Kidney renal papillary cell carcinoma], LAML[Acute Myeloid Leukemia], LUAD[Lung adenocarcinoma], LUSC[Lung squamous cell carcinoma], OV[Ovarian serous cystadenocarcinoma ], PAAD[Pancreatic adenocarcinoma], PRAD[Prostate adenocarcinoma], SKCM[Skin Cutaneous Melanoma], STAD[Stomach adenocarcinoma], THCA[Thyroid carcinoma], UCEC[Uterine Corpus Endometrial Carcinoma] |
| Top |
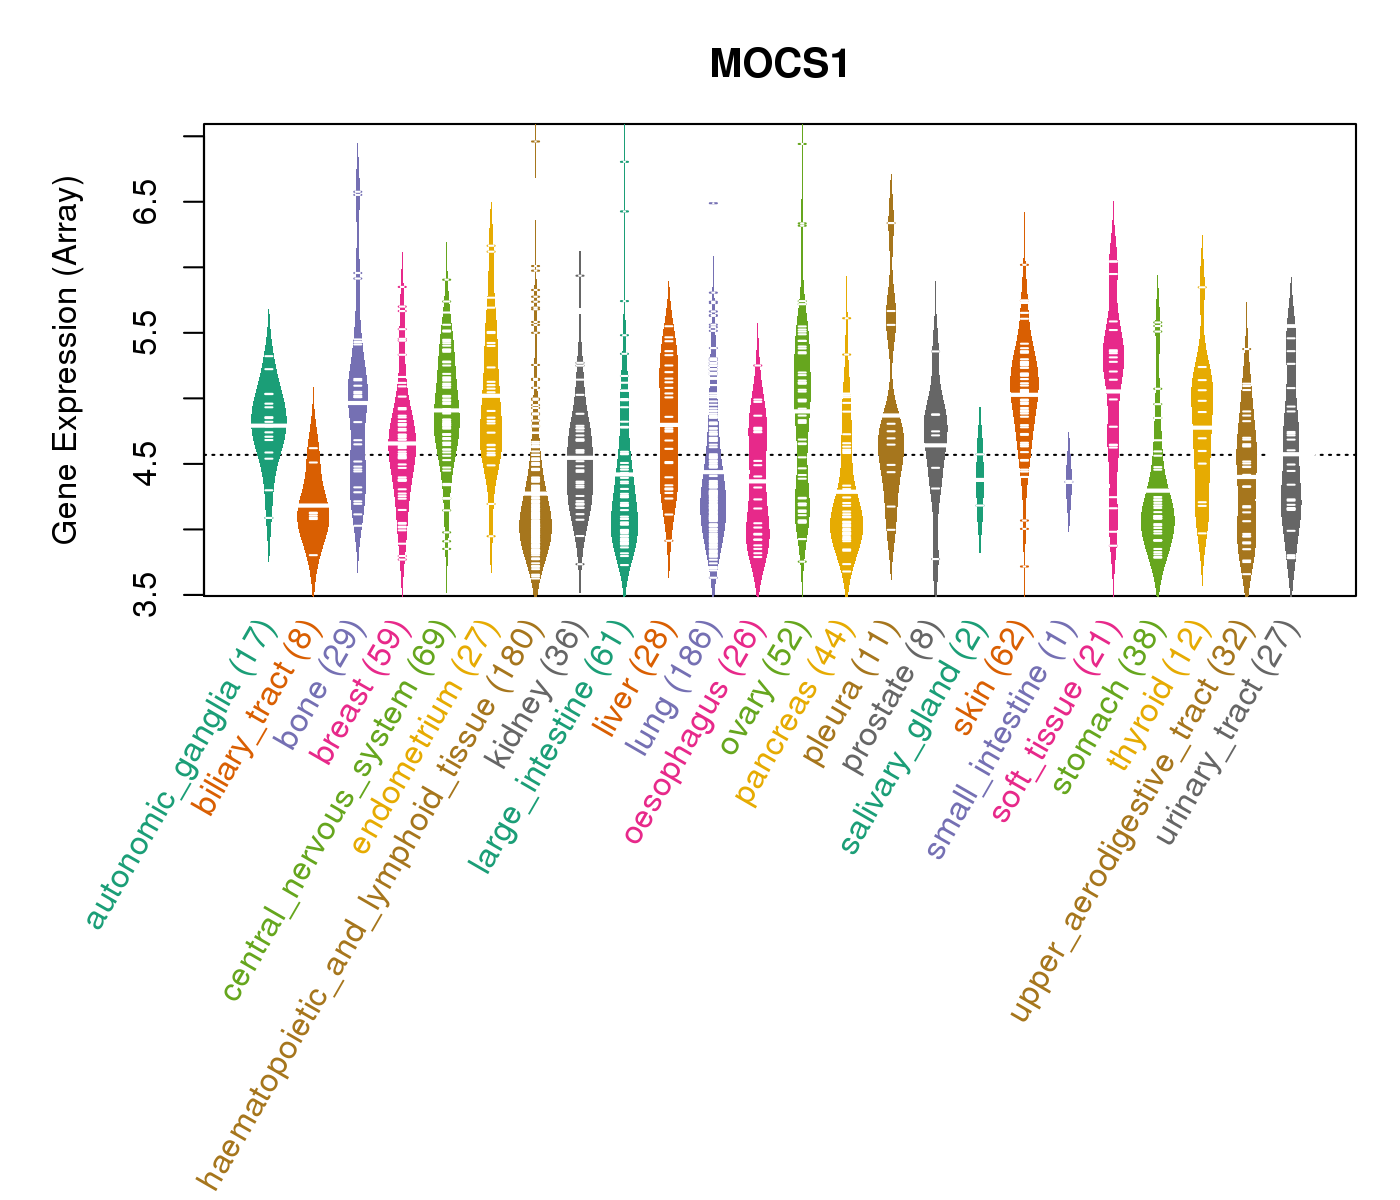
| Gene Expression for MOCS1 |
| * CCLE gene expression data were extracted from CCLE_Expression_Entrez_2012-10-18.res: Gene-centric RMA-normalized mRNA expression data. |
 |
| * Normalized gene expression data of RNASeqV2 was extracted from TCGA using R package TCGA-Assembler. The URLs of all public data files on TCGA DCC data server were gathered at Jan-05-2015. Only eight cancer types have enough normal control samples for differential expression analysis. (t test, adjusted p<0.05 (using Benjamini-Hochberg FDR)) |
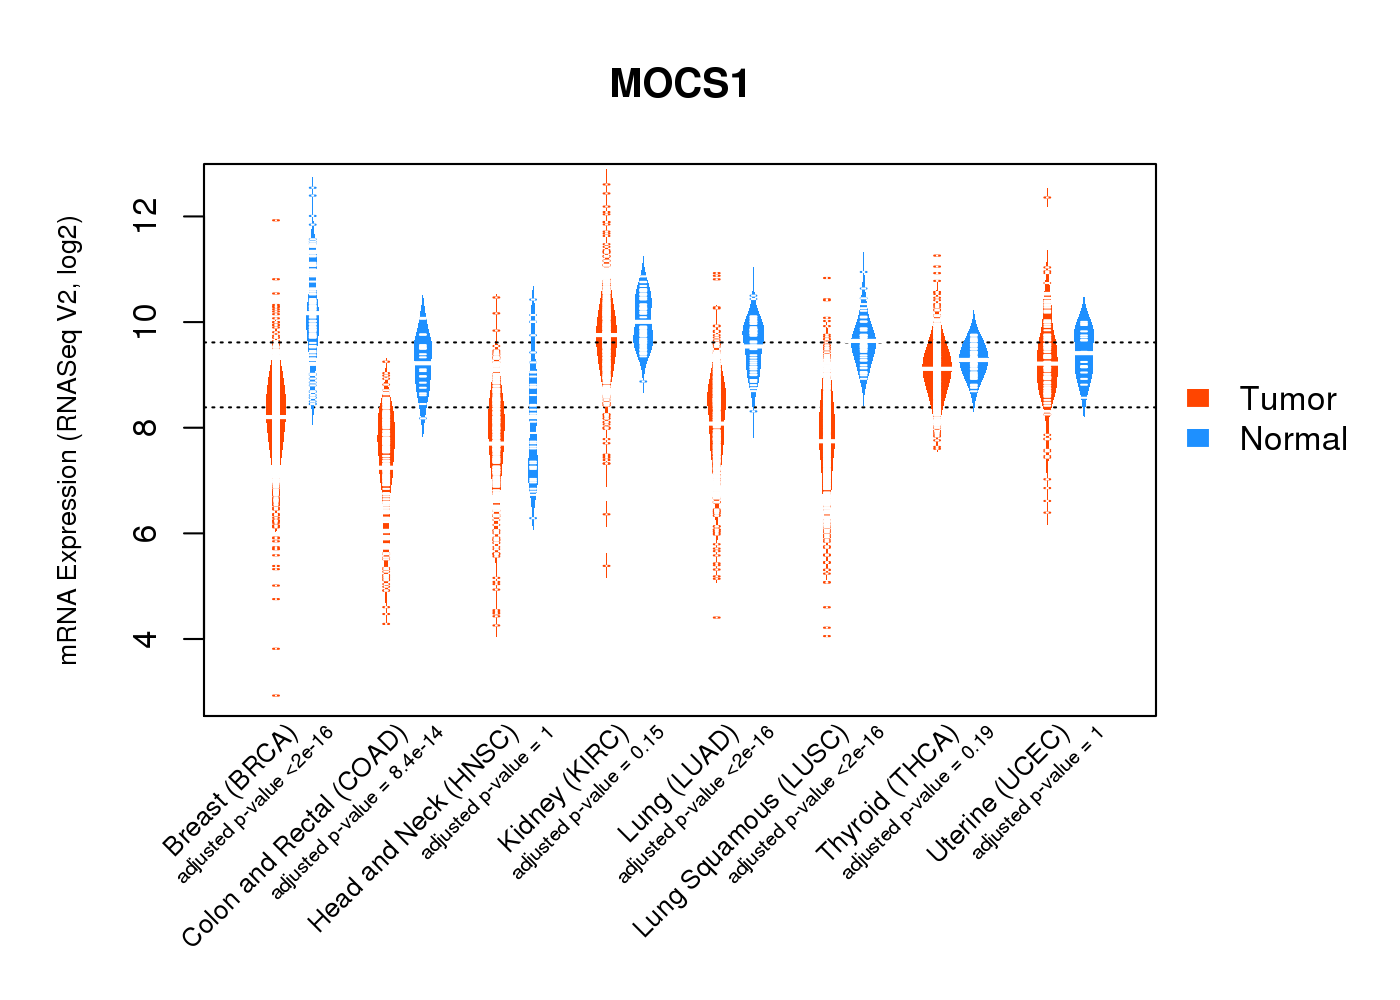 |
| Top |
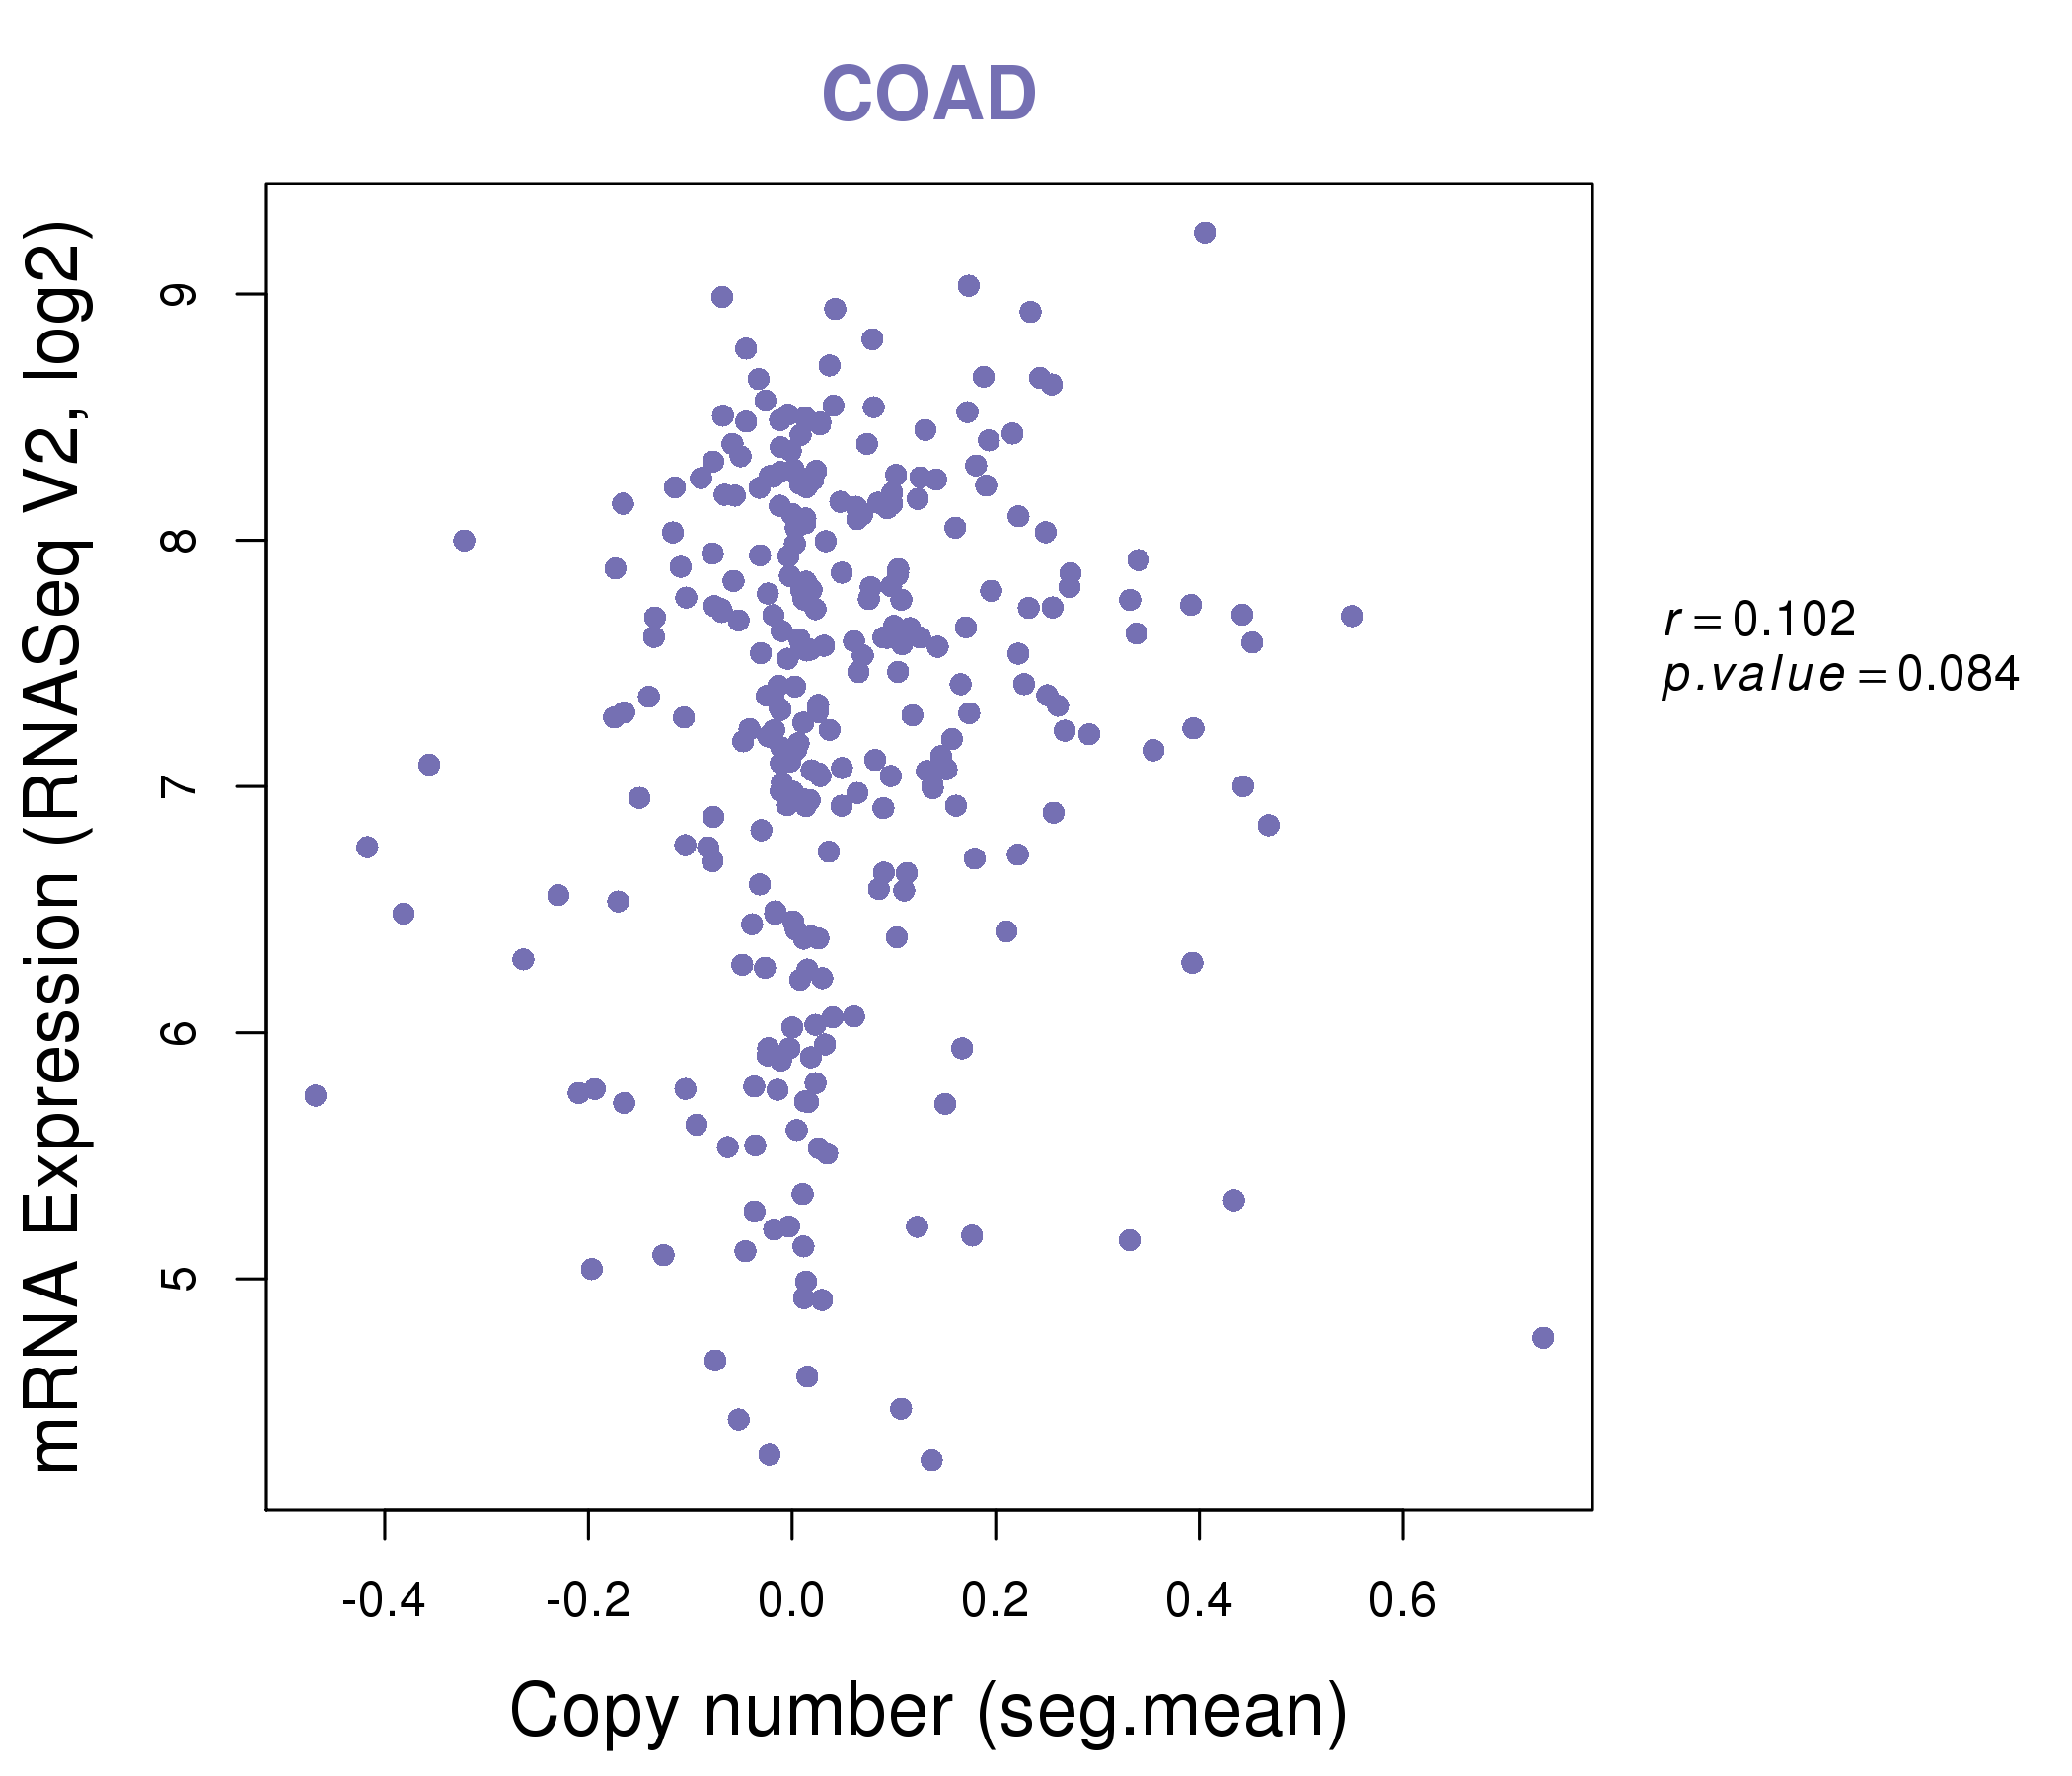
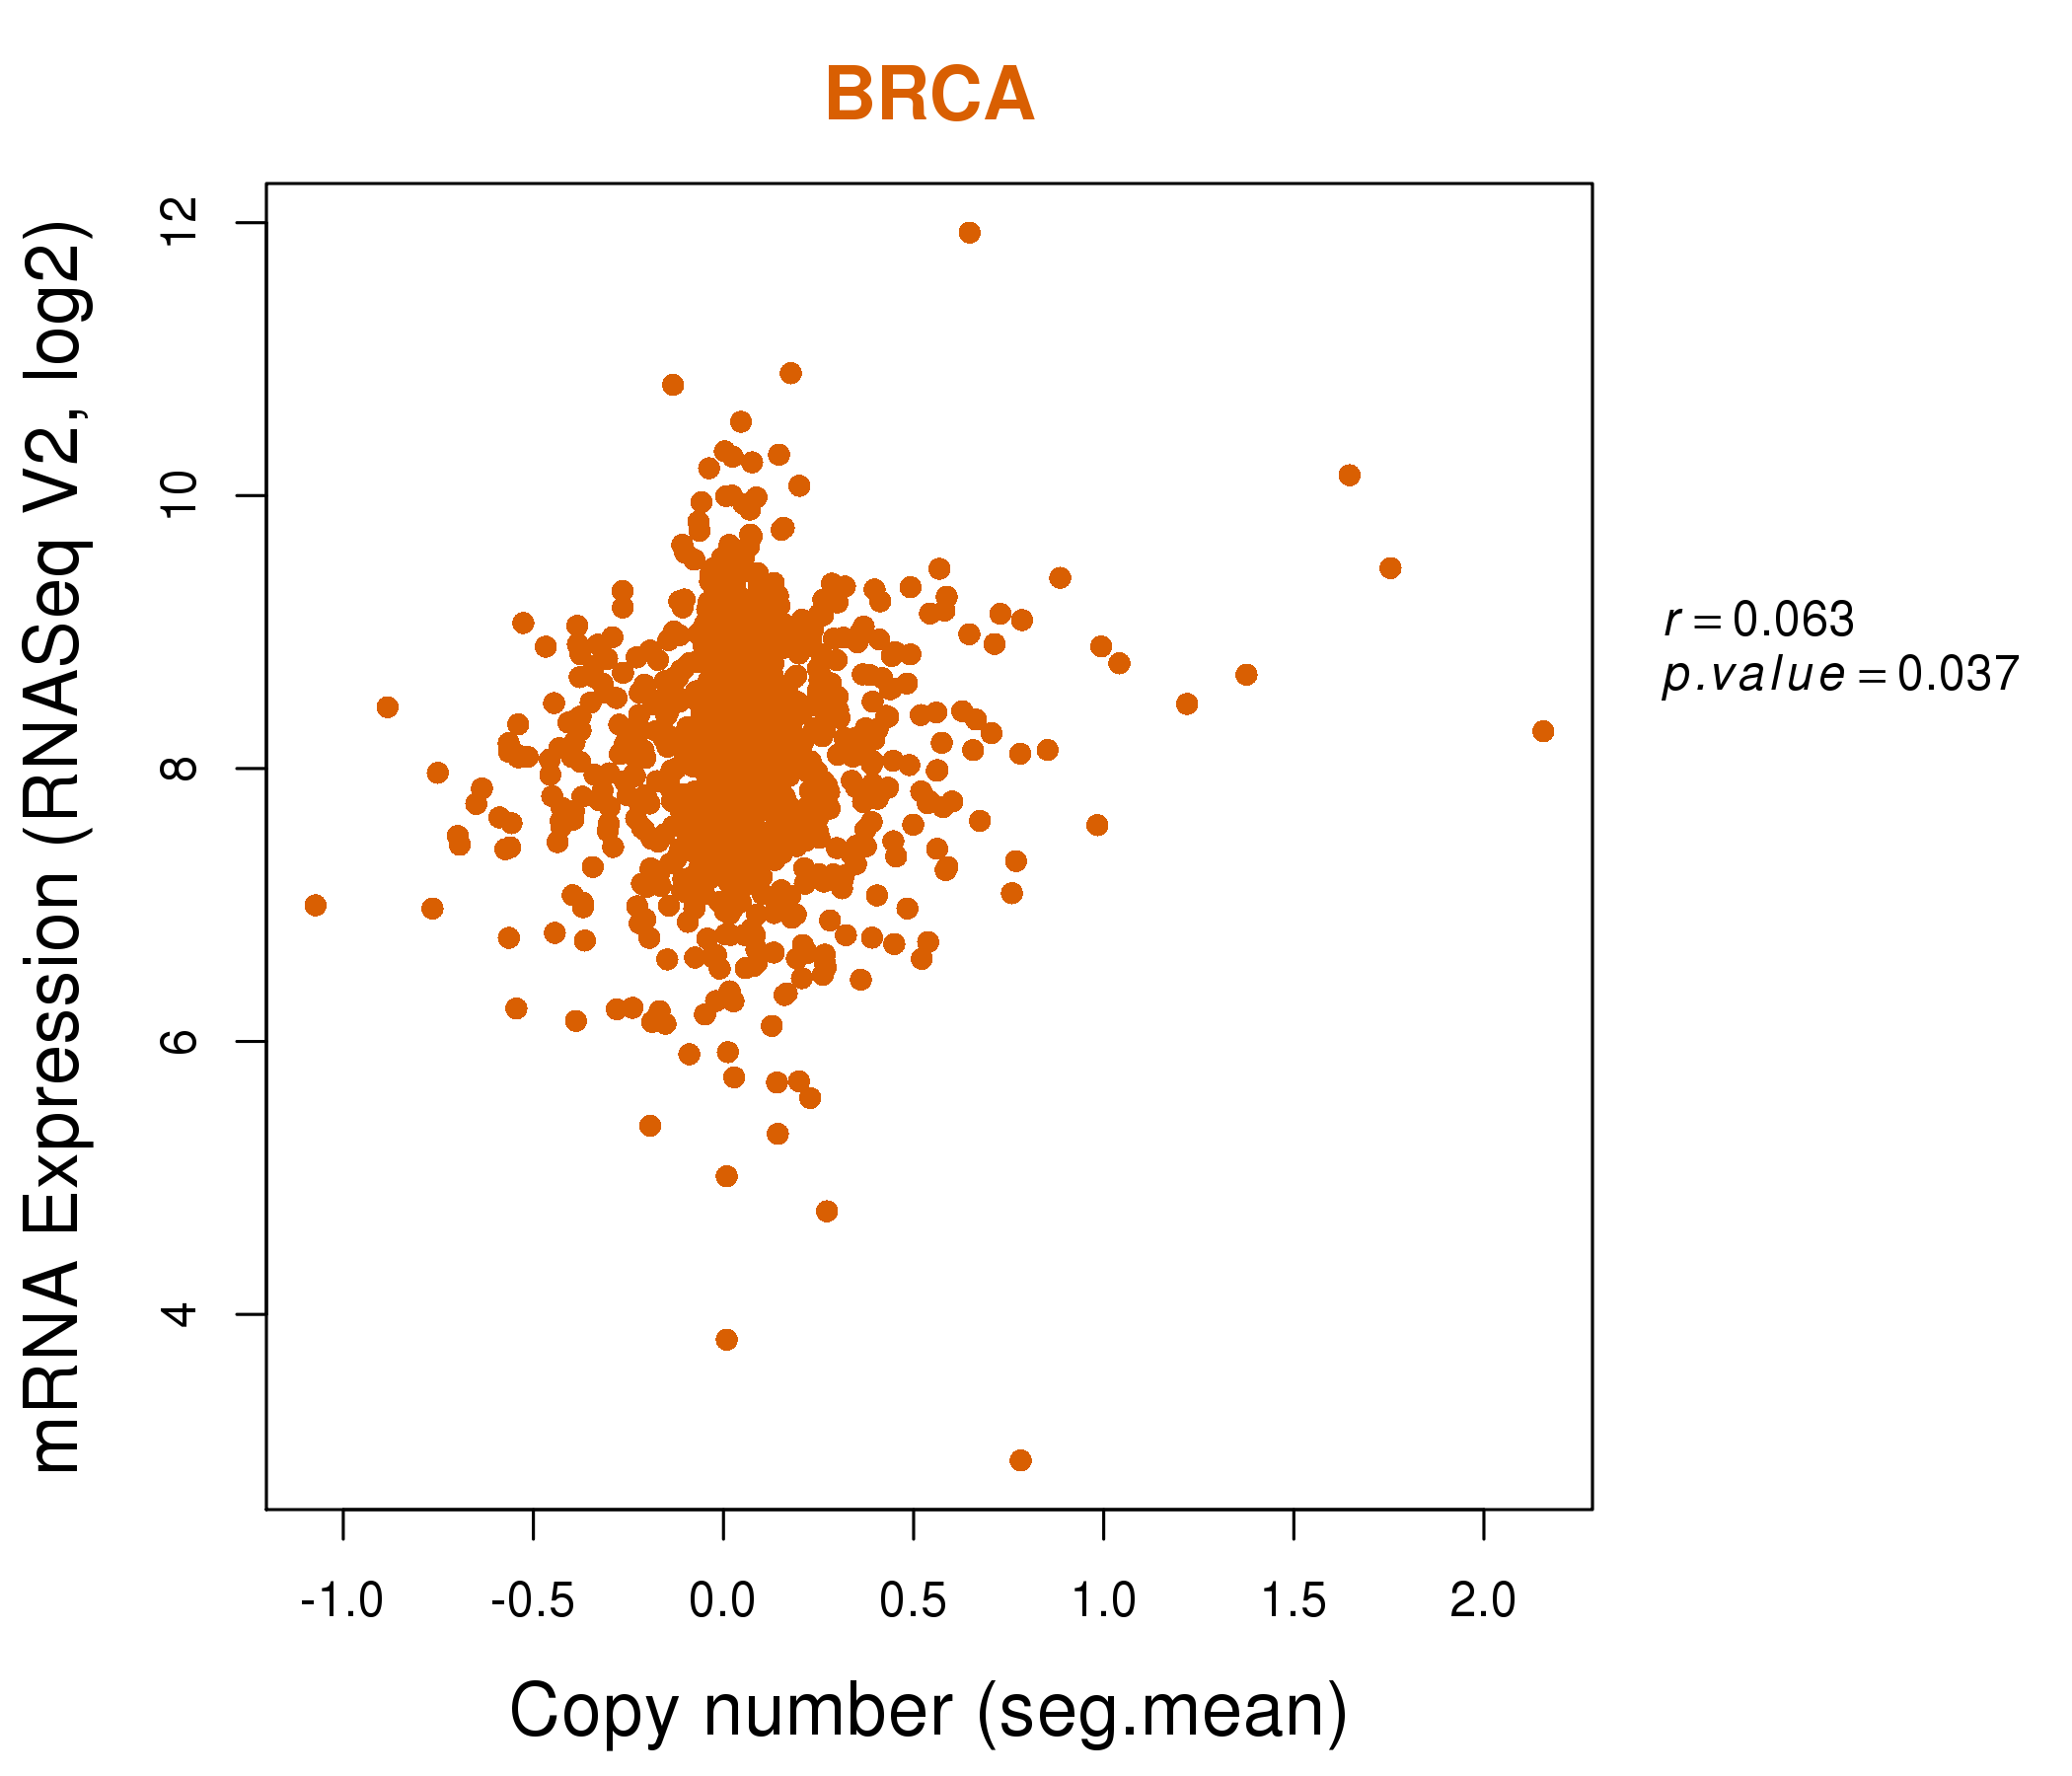
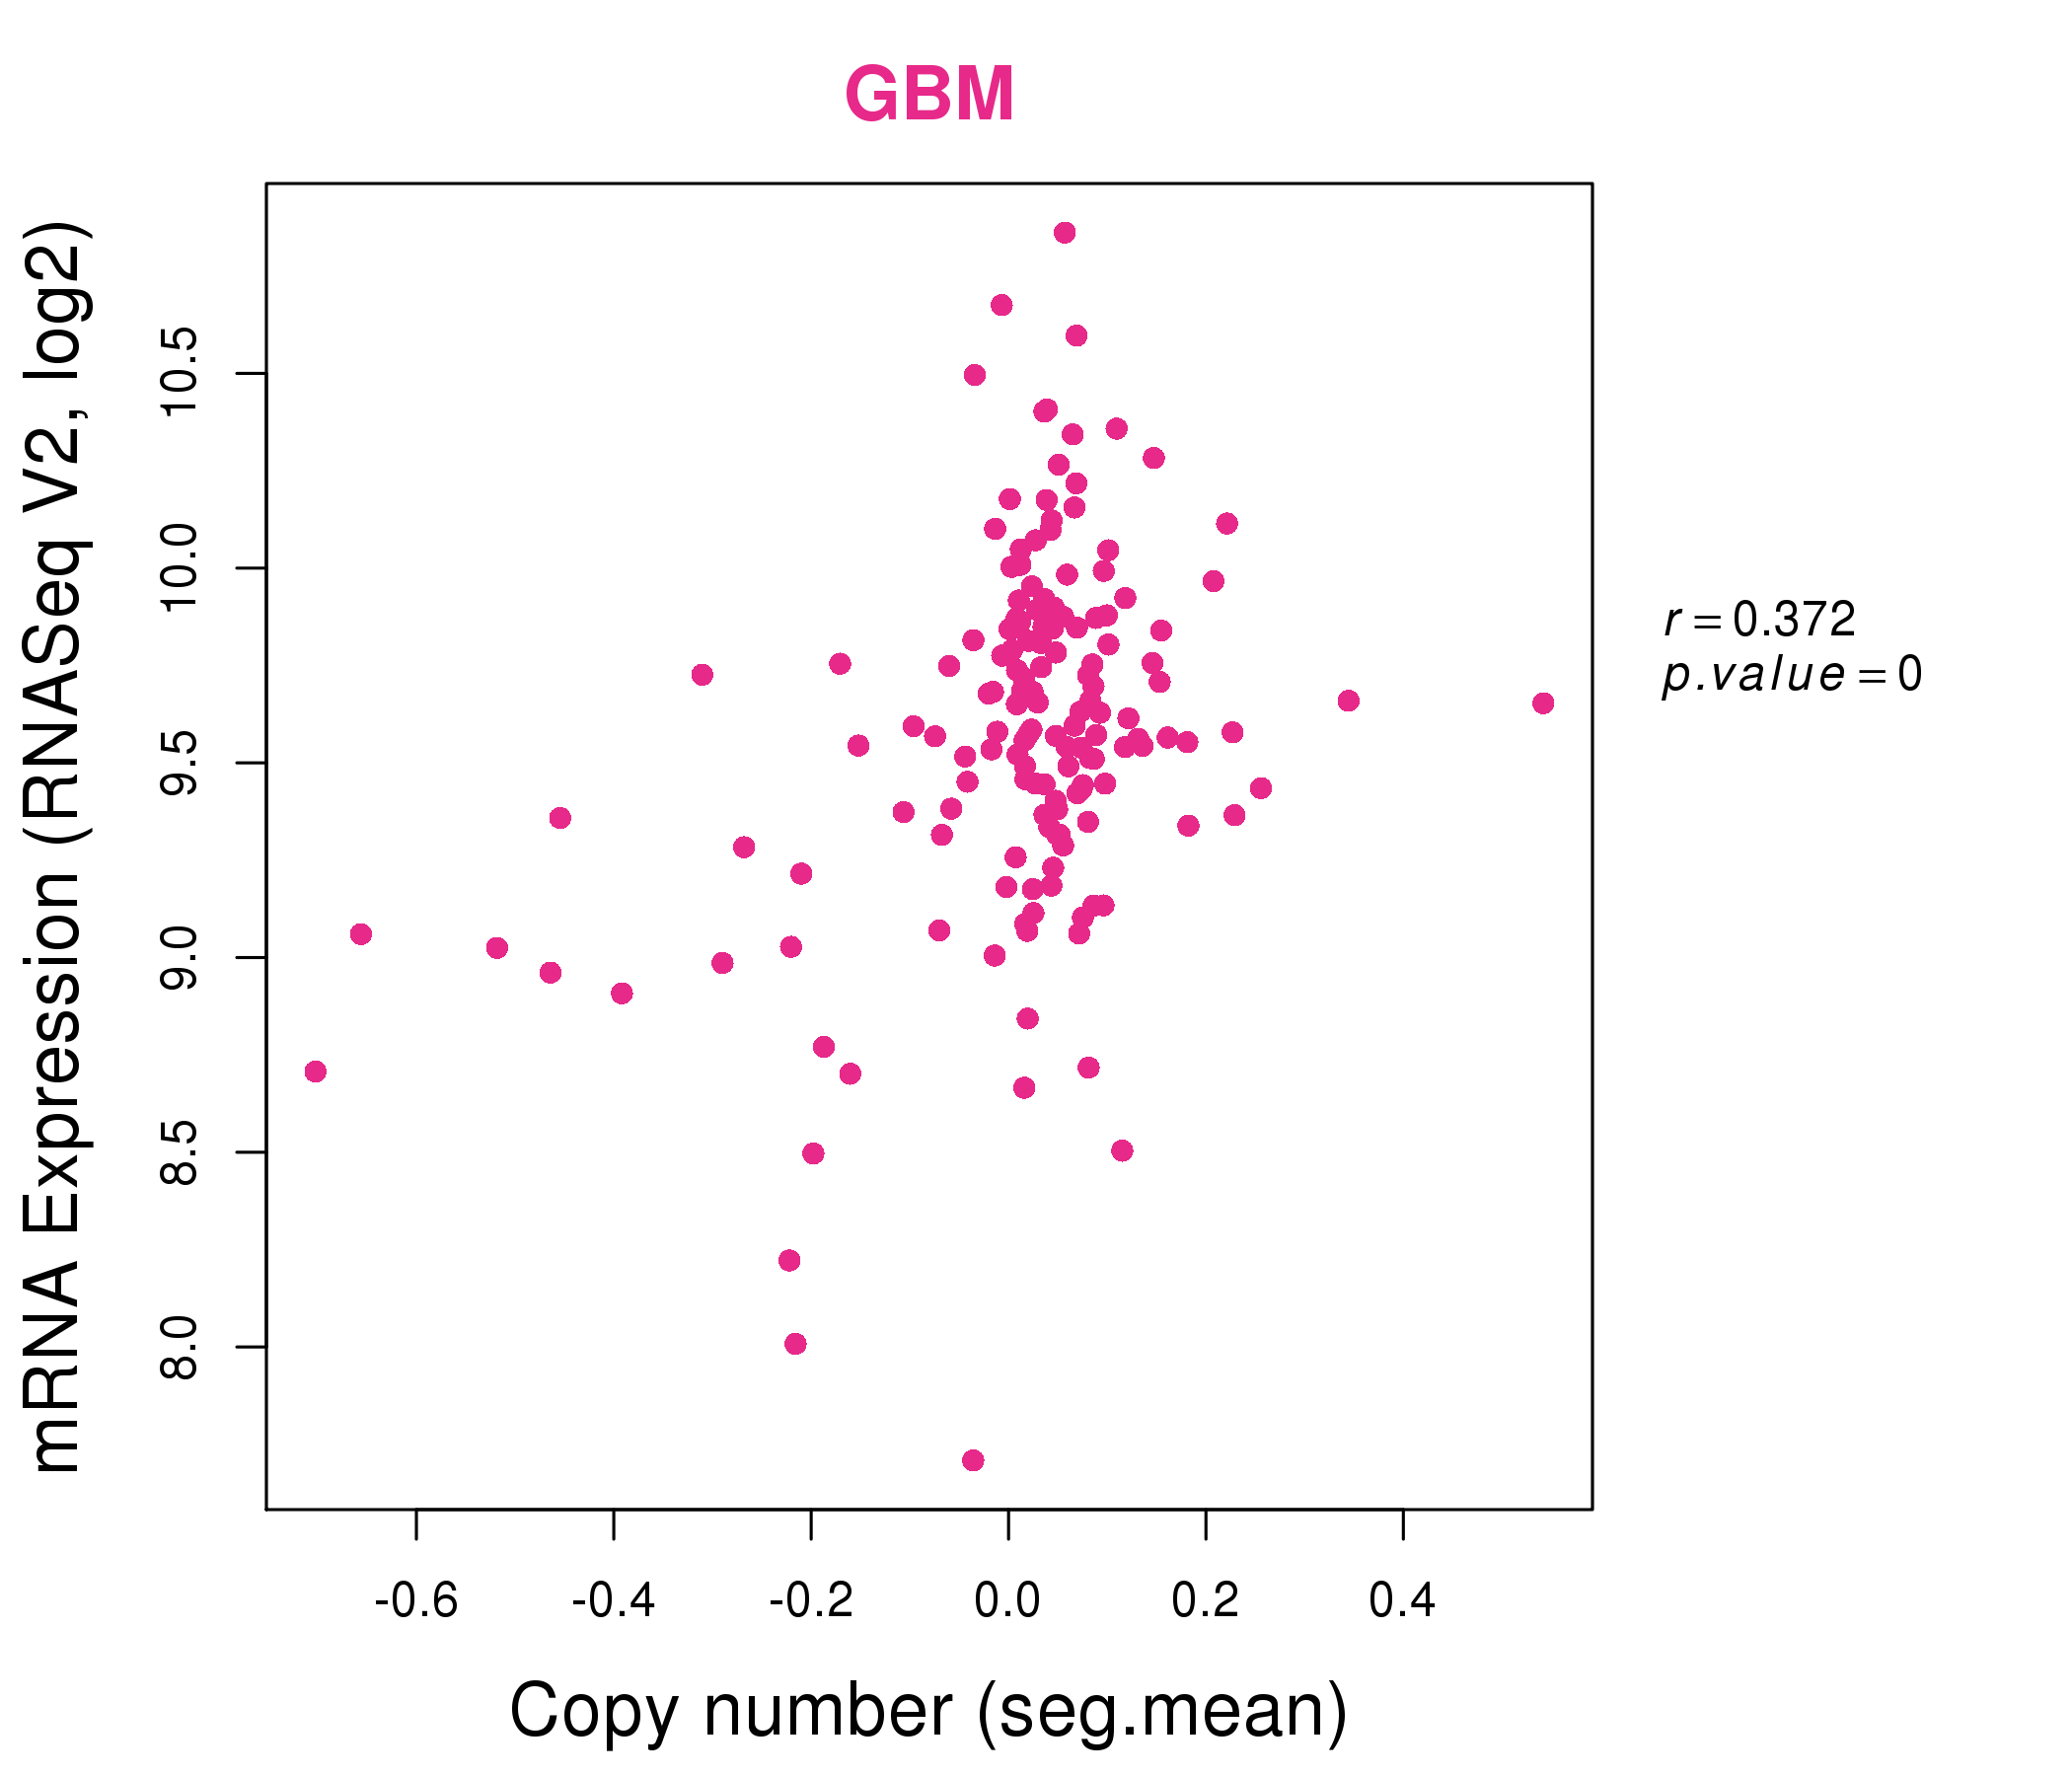
| * This plots show the correlation between CNV and gene expression. |
: Open all plots for all cancer types
 |
|
 |
|
| Top |
| Gene-Gene Network Information |
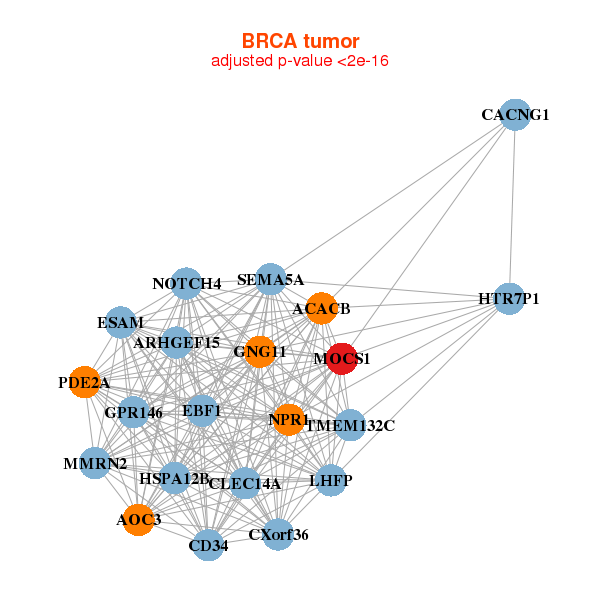
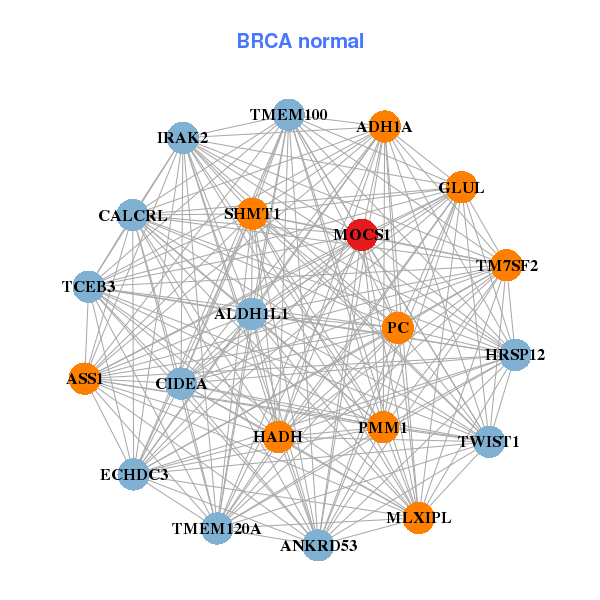
| * Co-Expression network figures were drawn using R package igraph. Only the top 20 genes with the highest correlations were shown. Red circle: input gene, orange circle: cell metabolism gene, sky circle: other gene |
: Open all plots for all cancer types
 |
|
| ACACB,AOC3,ARHGEF15,CACNG1,CD34,CLEC14A,CXorf36, EBF1,ESAM,GNG11,GPR146,HSPA12B,HTR7P1,LHFP, MMRN2,MOCS1,NOTCH4,NPR1,PDE2A,SEMA5A,TMEM132C | ADH1A,ALDH1L1,ANKRD53,ASS1,CALCRL,CIDEA,ECHDC3, GLUL,HADH,HRSP12,IRAK2,MLXIPL,MOCS1,PC, PMM1,SHMT1,TCEB3,TM7SF2,TMEM100,TMEM120A,TWIST1 |
 |
|
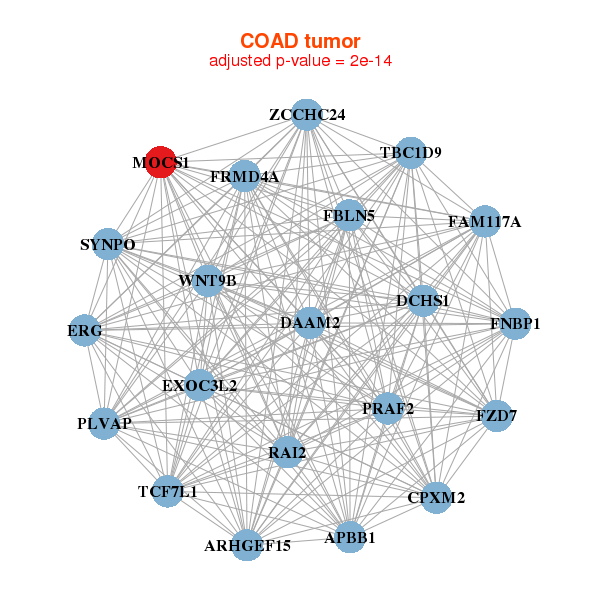
| APBB1,ARHGEF15,CPXM2,DAAM2,DCHS1,ERG,EXOC3L2, FAM117A,FBLN5,FNBP1,FRMD4A,FZD7,MOCS1,PLVAP, PRAF2,RAI2,SYNPO,TBC1D9,TCF7L1,WNT9B,ZCCHC24 | ACAD10,ASAP3,HMGCS2,HOXB5,HOXB6,HOXB8,KCNV1, METTL7A,MOCS1,MSI1,NICN1,OTUD7A,PTEN,PTPRA, SCUBE2,SLC19A1,SLC38A4,SPNS1,STK11,SUOX,SVOPL |
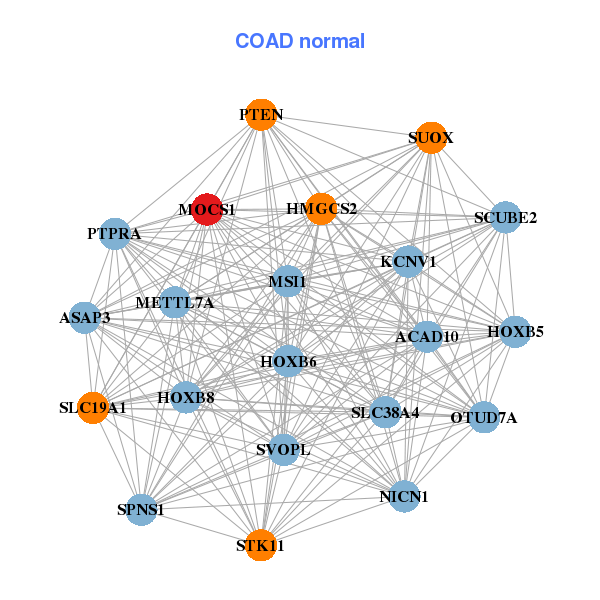
| * Co-Expression network figures were drawn using R package igraph. Only the top 20 genes with the highest correlations were shown. Red circle: input gene, orange circle: cell metabolism gene, sky circle: other gene |
: Open all plots for all cancer types
| Top |
: Open all interacting genes' information including KEGG pathway for all interacting genes from DAVID
| Top |
| Pharmacological Information for MOCS1 |
| There's no related Drug. |
| Top |
| Cross referenced IDs for MOCS1 |
| * We obtained these cross-references from Uniprot database. It covers 150 different DBs, 18 categories. http://www.uniprot.org/help/cross_references_section |
: Open all cross reference information
|
Copyright © 2016-Present - The Univsersity of Texas Health Science Center at Houston @ |