|
||||||||||||||||||||
| |
| Phenotypic Information (metabolism pathway, cancer, disease, phenome) |
| |
| |
| Gene-Gene Network Information: Co-Expression Network, Interacting Genes & KEGG |
| |
|


| Gene Summary for MPI |
| Top |
| Phenotypic Information for MPI(metabolism pathway, cancer, disease, phenome) |
| Cancer | CGAP: MPI |
| Familial Cancer Database: MPI | |
| * This gene is included in those cancer gene databases. |
|
|
|
|
|
| . | ||||||||||||||
Oncogene 1 | Significant driver gene in | |||||||||||||||||||
| cf) number; DB name 1 Oncogene; http://nar.oxfordjournals.org/content/35/suppl_1/D721.long, 2 Tumor Suppressor gene; https://bioinfo.uth.edu/TSGene/, 3 Cancer Gene Census; http://www.nature.com/nrc/journal/v4/n3/abs/nrc1299.html, 4 CancerGenes; http://nar.oxfordjournals.org/content/35/suppl_1/D721.long, 5 Network of Cancer Gene; http://ncg.kcl.ac.uk/index.php, 1Therapeutic Vulnerabilities in Cancer; http://cbio.mskcc.org/cancergenomics/statius/ |
| KEGG_FRUCTOSE_AND_MANNOSE_METABOLISM KEGG_AMINO_SUGAR_AND_NUCLEOTIDE_SUGAR_METABOLISM REACTOME_METABOLISM_OF_PROTEINS | |
| OMIM | |
| Orphanet | |
| Disease | KEGG Disease: MPI |
| MedGen: MPI (Human Medical Genetics with Condition) | |
| ClinVar: MPI | |
| Phenotype | MGI: MPI (International Mouse Phenotyping Consortium) |
| PhenomicDB: MPI | |
| Mutations for MPI |
| * Under tables are showing count per each tissue to give us broad intuition about tissue specific mutation patterns.You can go to the detailed page for each mutation database's web site. |
| There's no structural variation information in COSMIC data for this gene. |
| * From mRNA Sanger sequences, Chitars2.0 arranged chimeric transcripts. This table shows MPI related fusion information. |
| ID | Head Gene | Tail Gene | Accession | Gene_a | qStart_a | qEnd_a | Chromosome_a | tStart_a | tEnd_a | Gene_a | qStart_a | qEnd_a | Chromosome_a | tStart_a | tEnd_a |
| Top |
| There's no copy number variation information in COSMIC data for this gene. |
| Top |
|
 |
| Top |
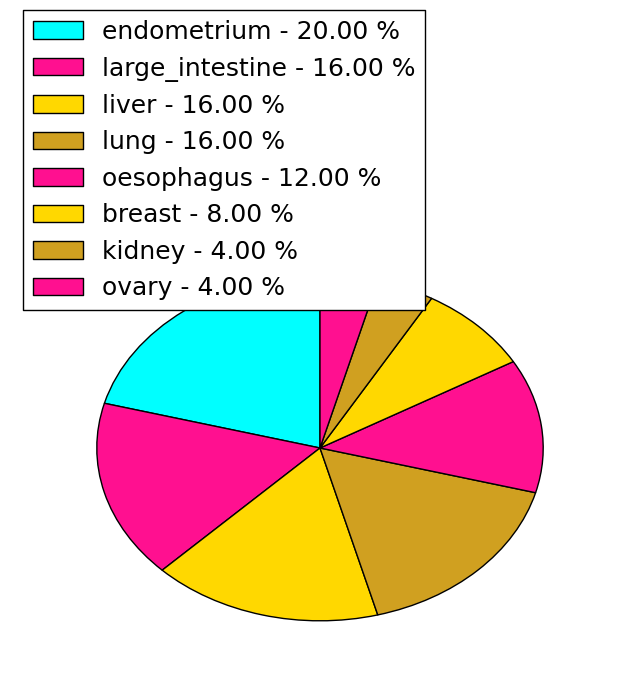
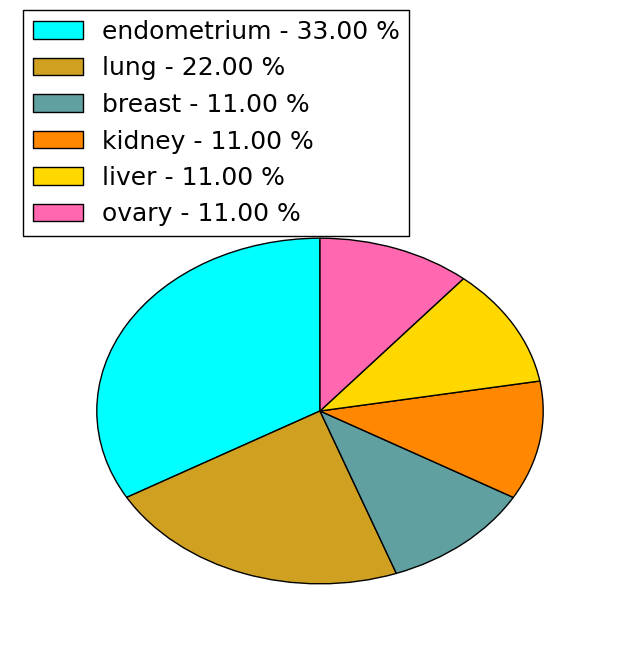
| Stat. for Non-Synonymous SNVs (# total SNVs=24) | (# total SNVs=9) |
 |  |
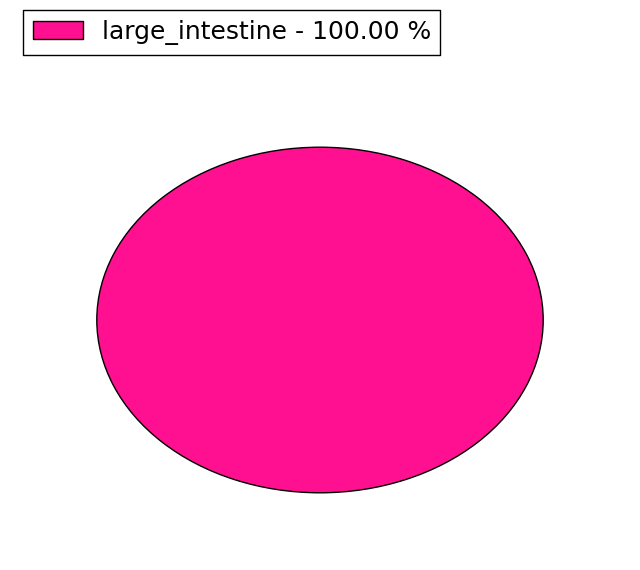
(# total SNVs=1) | (# total SNVs=1) |
 |  |
| Top |
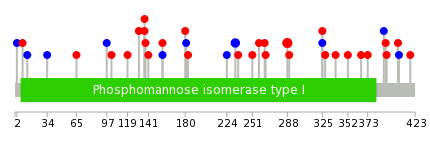
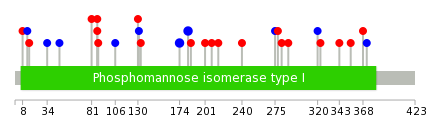
| * When you move the cursor on each content, you can see more deailed mutation information on the Tooltip. Those are primary_site,primary_histology,mutation(aa),pubmedID. |
| GRCh37 position | Mutation(aa) | Unique sampleID count |
| chr15:75189370-75189370 | p.A288V | 3 |
| chr15:75188521-75188521 | p.I233I | 2 |
| chr15:75189523-75189523 | p.D339G | 1 |
| chr15:75182874-75182874 | p.P8Q | 1 |
| chr15:75185067-75185067 | p.E137D | 1 |
| chr15:75188528-75188528 | p.E236K | 1 |
| chr15:75189523-75189524 | p.V342fs*17 | 1 |
| chr15:75182890-75182890 | p.V13V | 1 |
| chr15:75185068-75185068 | p.M138V | 1 |
| chr15:75188574-75188574 | p.C251Y | 1 |
| Top |
|
 |
| Point Mutation/ Tissue ID | 1 | 2 | 3 | 4 | 5 | 6 | 7 | 8 | 9 | 10 | 11 | 12 | 13 | 14 | 15 | 16 | 17 | 18 | 19 | 20 |
| # sample | 2 | 3 | 3 | 1 | 2 | 3 | 2 | 2 | 1 | 2 | 7 | |||||||||
| # mutation | 2 | 3 | 3 | 1 | 2 | 4 | 2 | 2 | 1 | 2 | 8 | |||||||||
| nonsynonymous SNV | 1 | 2 | 3 | 1 | 1 | 2 | 1 | 1 | 1 | 2 | 5 | |||||||||
| synonymous SNV | 1 | 1 | 1 | 2 | 1 | 1 | 3 |
| cf) Tissue ID; Tissue type (1; BLCA[Bladder Urothelial Carcinoma], 2; BRCA[Breast invasive carcinoma], 3; CESC[Cervical squamous cell carcinoma and endocervical adenocarcinoma], 4; COAD[Colon adenocarcinoma], 5; GBM[Glioblastoma multiforme], 6; Glioma Low Grade, 7; HNSC[Head and Neck squamous cell carcinoma], 8; KICH[Kidney Chromophobe], 9; KIRC[Kidney renal clear cell carcinoma], 10; KIRP[Kidney renal papillary cell carcinoma], 11; LAML[Acute Myeloid Leukemia], 12; LUAD[Lung adenocarcinoma], 13; LUSC[Lung squamous cell carcinoma], 14; OV[Ovarian serous cystadenocarcinoma ], 15; PAAD[Pancreatic adenocarcinoma], 16; PRAD[Prostate adenocarcinoma], 17; SKCM[Skin Cutaneous Melanoma], 18:STAD[Stomach adenocarcinoma], 19:THCA[Thyroid carcinoma], 20:UCEC[Uterine Corpus Endometrial Carcinoma]) |
| Top |
| * We represented just top 10 SNVs. When you move the cursor on each content, you can see more deailed mutation information on the Tooltip. Those are primary_site, primary_histology, mutation(aa), pubmedID. |
| Genomic Position | Mutation(aa) | Unique sampleID count |
| chr15:75188494 | p.A174A,MPI | 2 |
| chr15:75188521 | p.I183I,MPI | 2 |
| chr15:75189523 | p.S34S,MPI | 1 |
| chr15:75182890 | p.G215V,MPI | 1 |
| chr15:75185540 | p.R15H,MPI | 1 |
| chr15:75189853 | p.S240L,MPI | 1 |
| chr15:75182953 | p.L47L,MPI | 1 |
| chr15:75189909 | p.L275L,MPI | 1 |
| chr15:75183769 | p.D81N,MPI | 1 |
| chr15:75189916 | p.R278Q,MPI | 1 |
| * Copy number data were extracted from TCGA using R package TCGA-Assembler. The URLs of all public data files on TCGA DCC data server were gathered on Jan-05-2015. Function ProcessCNAData in TCGA-Assembler package was used to obtain gene-level copy number value which is calculated as the average copy number of the genomic region of a gene. |
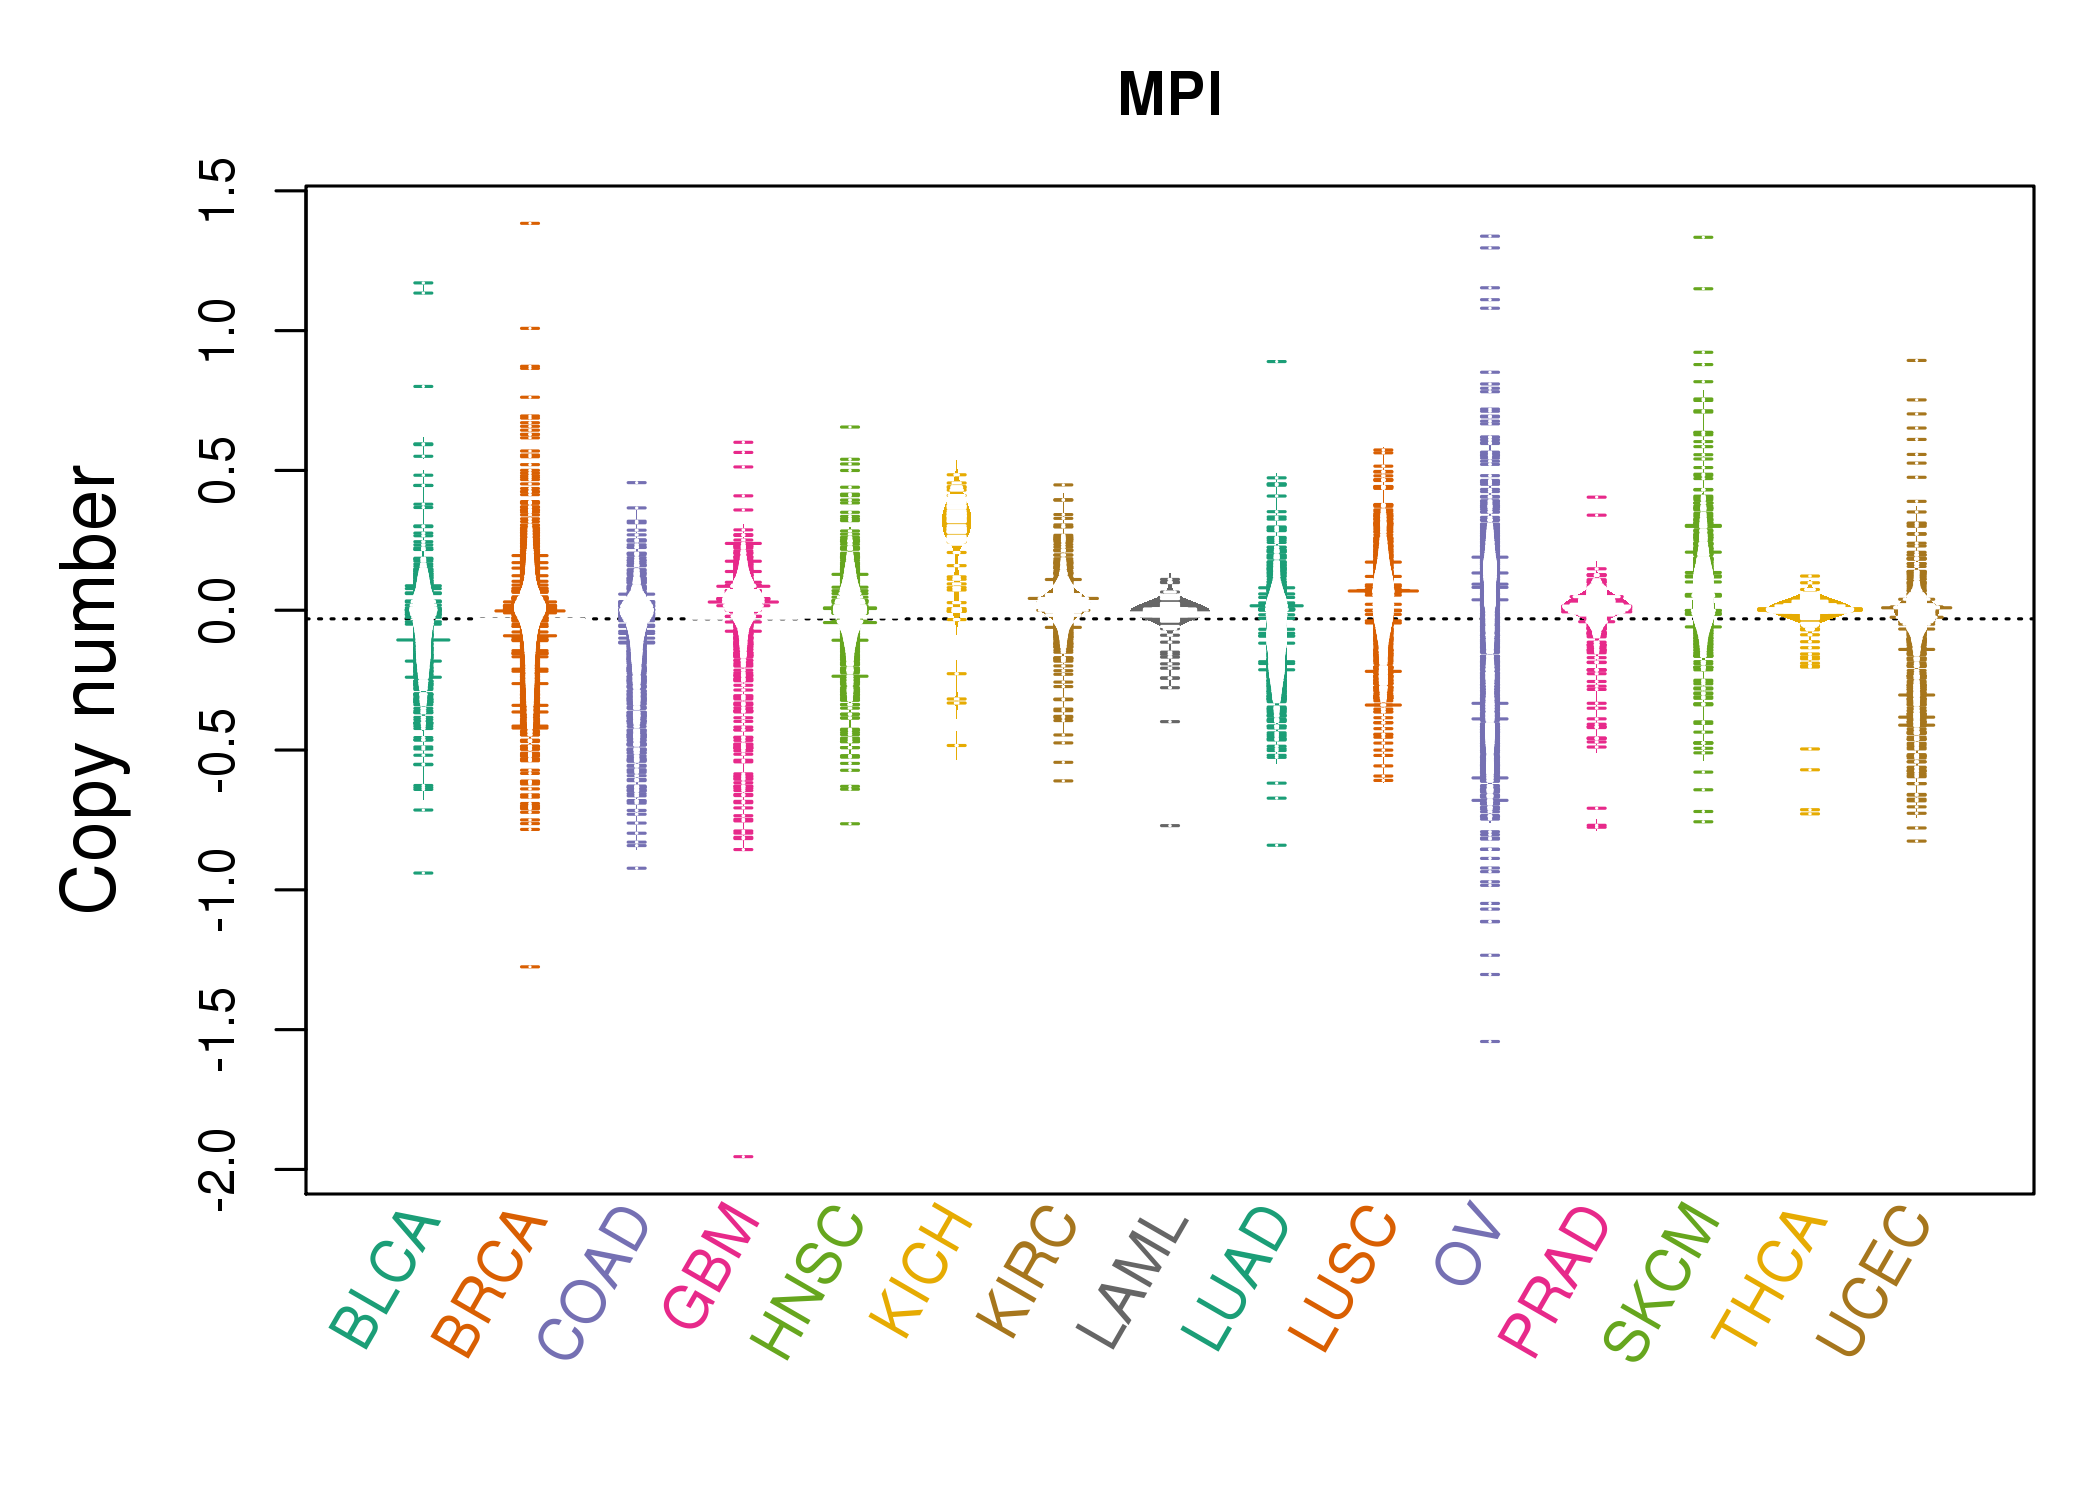 |
| cf) Tissue ID[Tissue type]: BLCA[Bladder Urothelial Carcinoma], BRCA[Breast invasive carcinoma], CESC[Cervical squamous cell carcinoma and endocervical adenocarcinoma], COAD[Colon adenocarcinoma], GBM[Glioblastoma multiforme], Glioma Low Grade, HNSC[Head and Neck squamous cell carcinoma], KICH[Kidney Chromophobe], KIRC[Kidney renal clear cell carcinoma], KIRP[Kidney renal papillary cell carcinoma], LAML[Acute Myeloid Leukemia], LUAD[Lung adenocarcinoma], LUSC[Lung squamous cell carcinoma], OV[Ovarian serous cystadenocarcinoma ], PAAD[Pancreatic adenocarcinoma], PRAD[Prostate adenocarcinoma], SKCM[Skin Cutaneous Melanoma], STAD[Stomach adenocarcinoma], THCA[Thyroid carcinoma], UCEC[Uterine Corpus Endometrial Carcinoma] |
| Top |
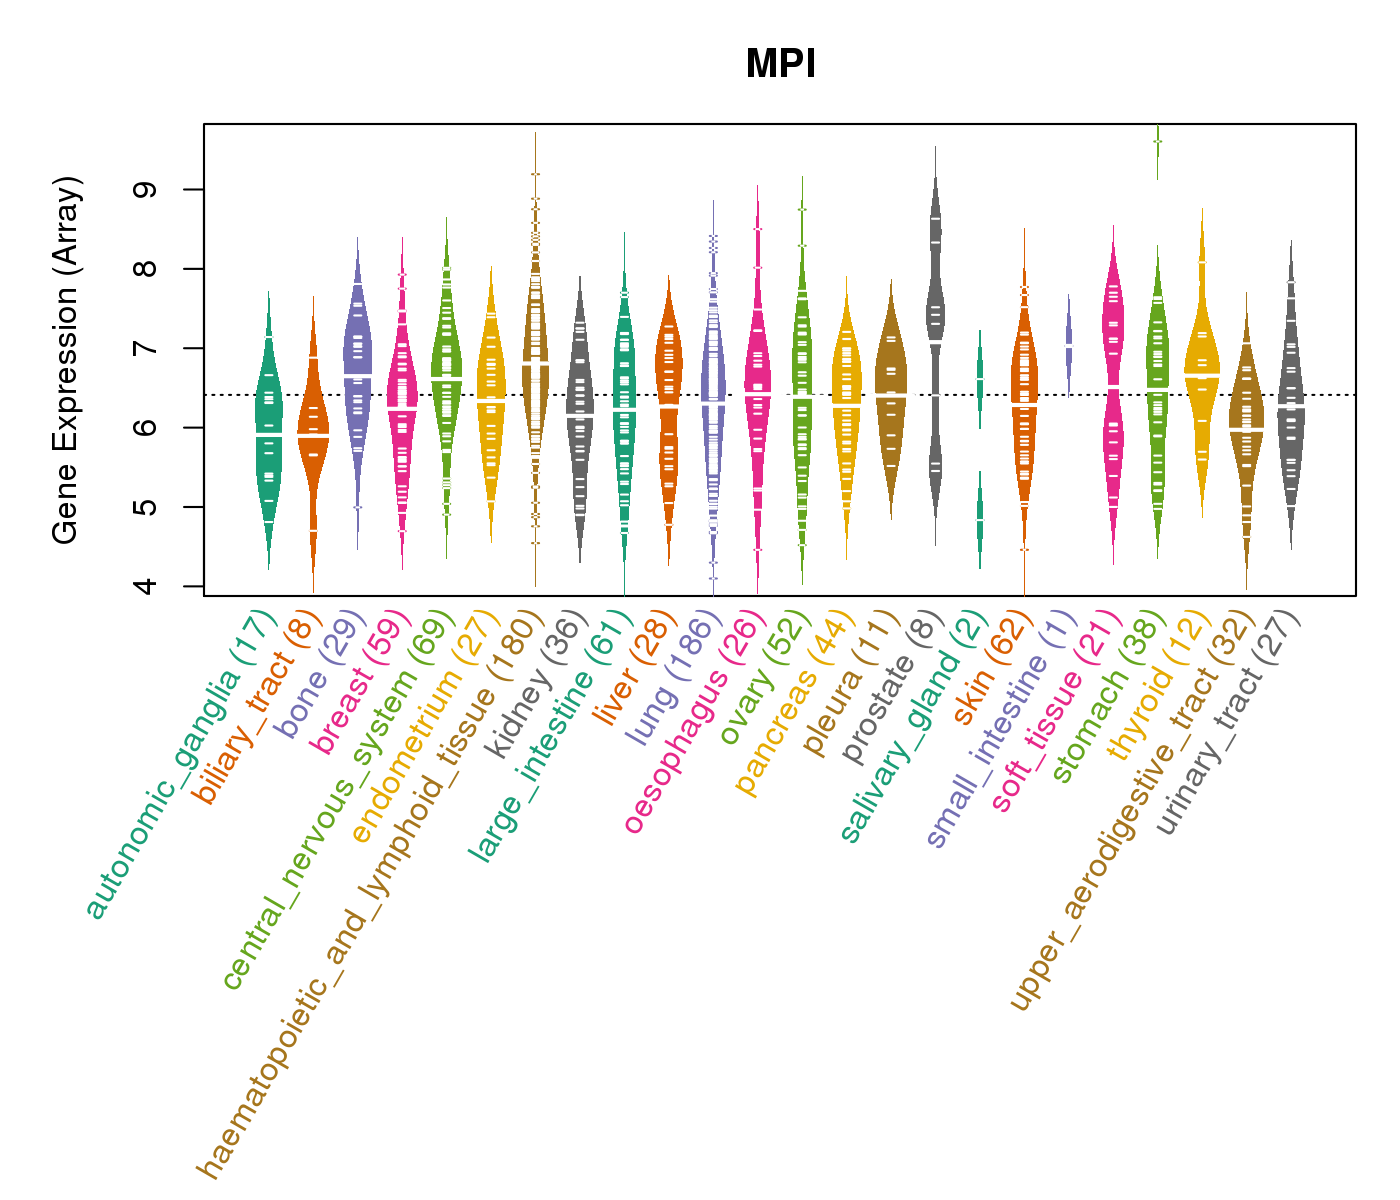
| Gene Expression for MPI |
| * CCLE gene expression data were extracted from CCLE_Expression_Entrez_2012-10-18.res: Gene-centric RMA-normalized mRNA expression data. |
 |
| * Normalized gene expression data of RNASeqV2 was extracted from TCGA using R package TCGA-Assembler. The URLs of all public data files on TCGA DCC data server were gathered at Jan-05-2015. Only eight cancer types have enough normal control samples for differential expression analysis. (t test, adjusted p<0.05 (using Benjamini-Hochberg FDR)) |
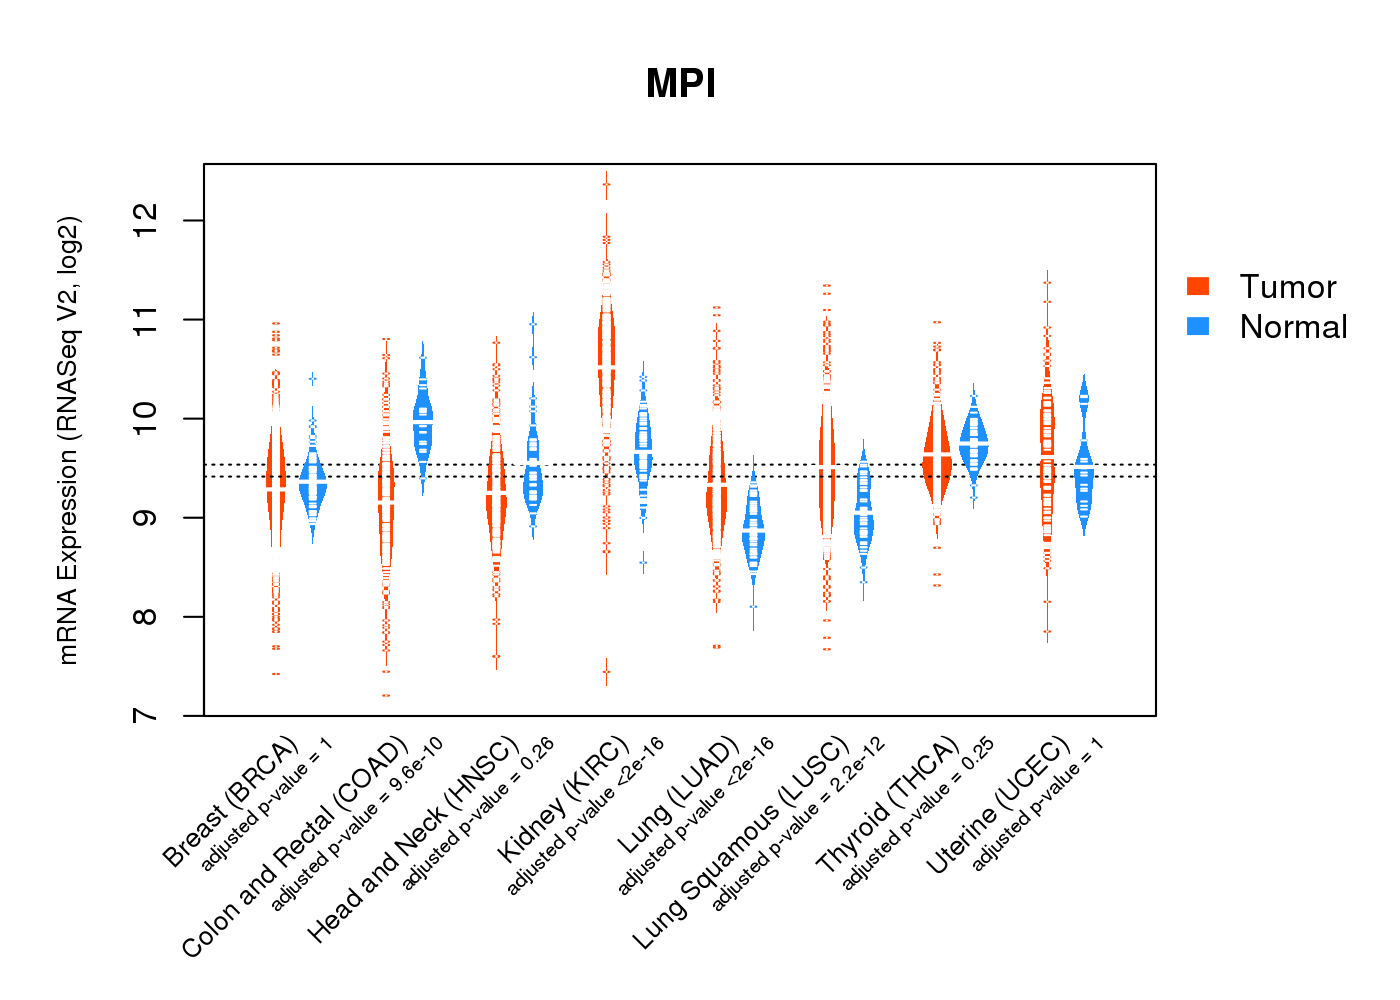 |
| Top |
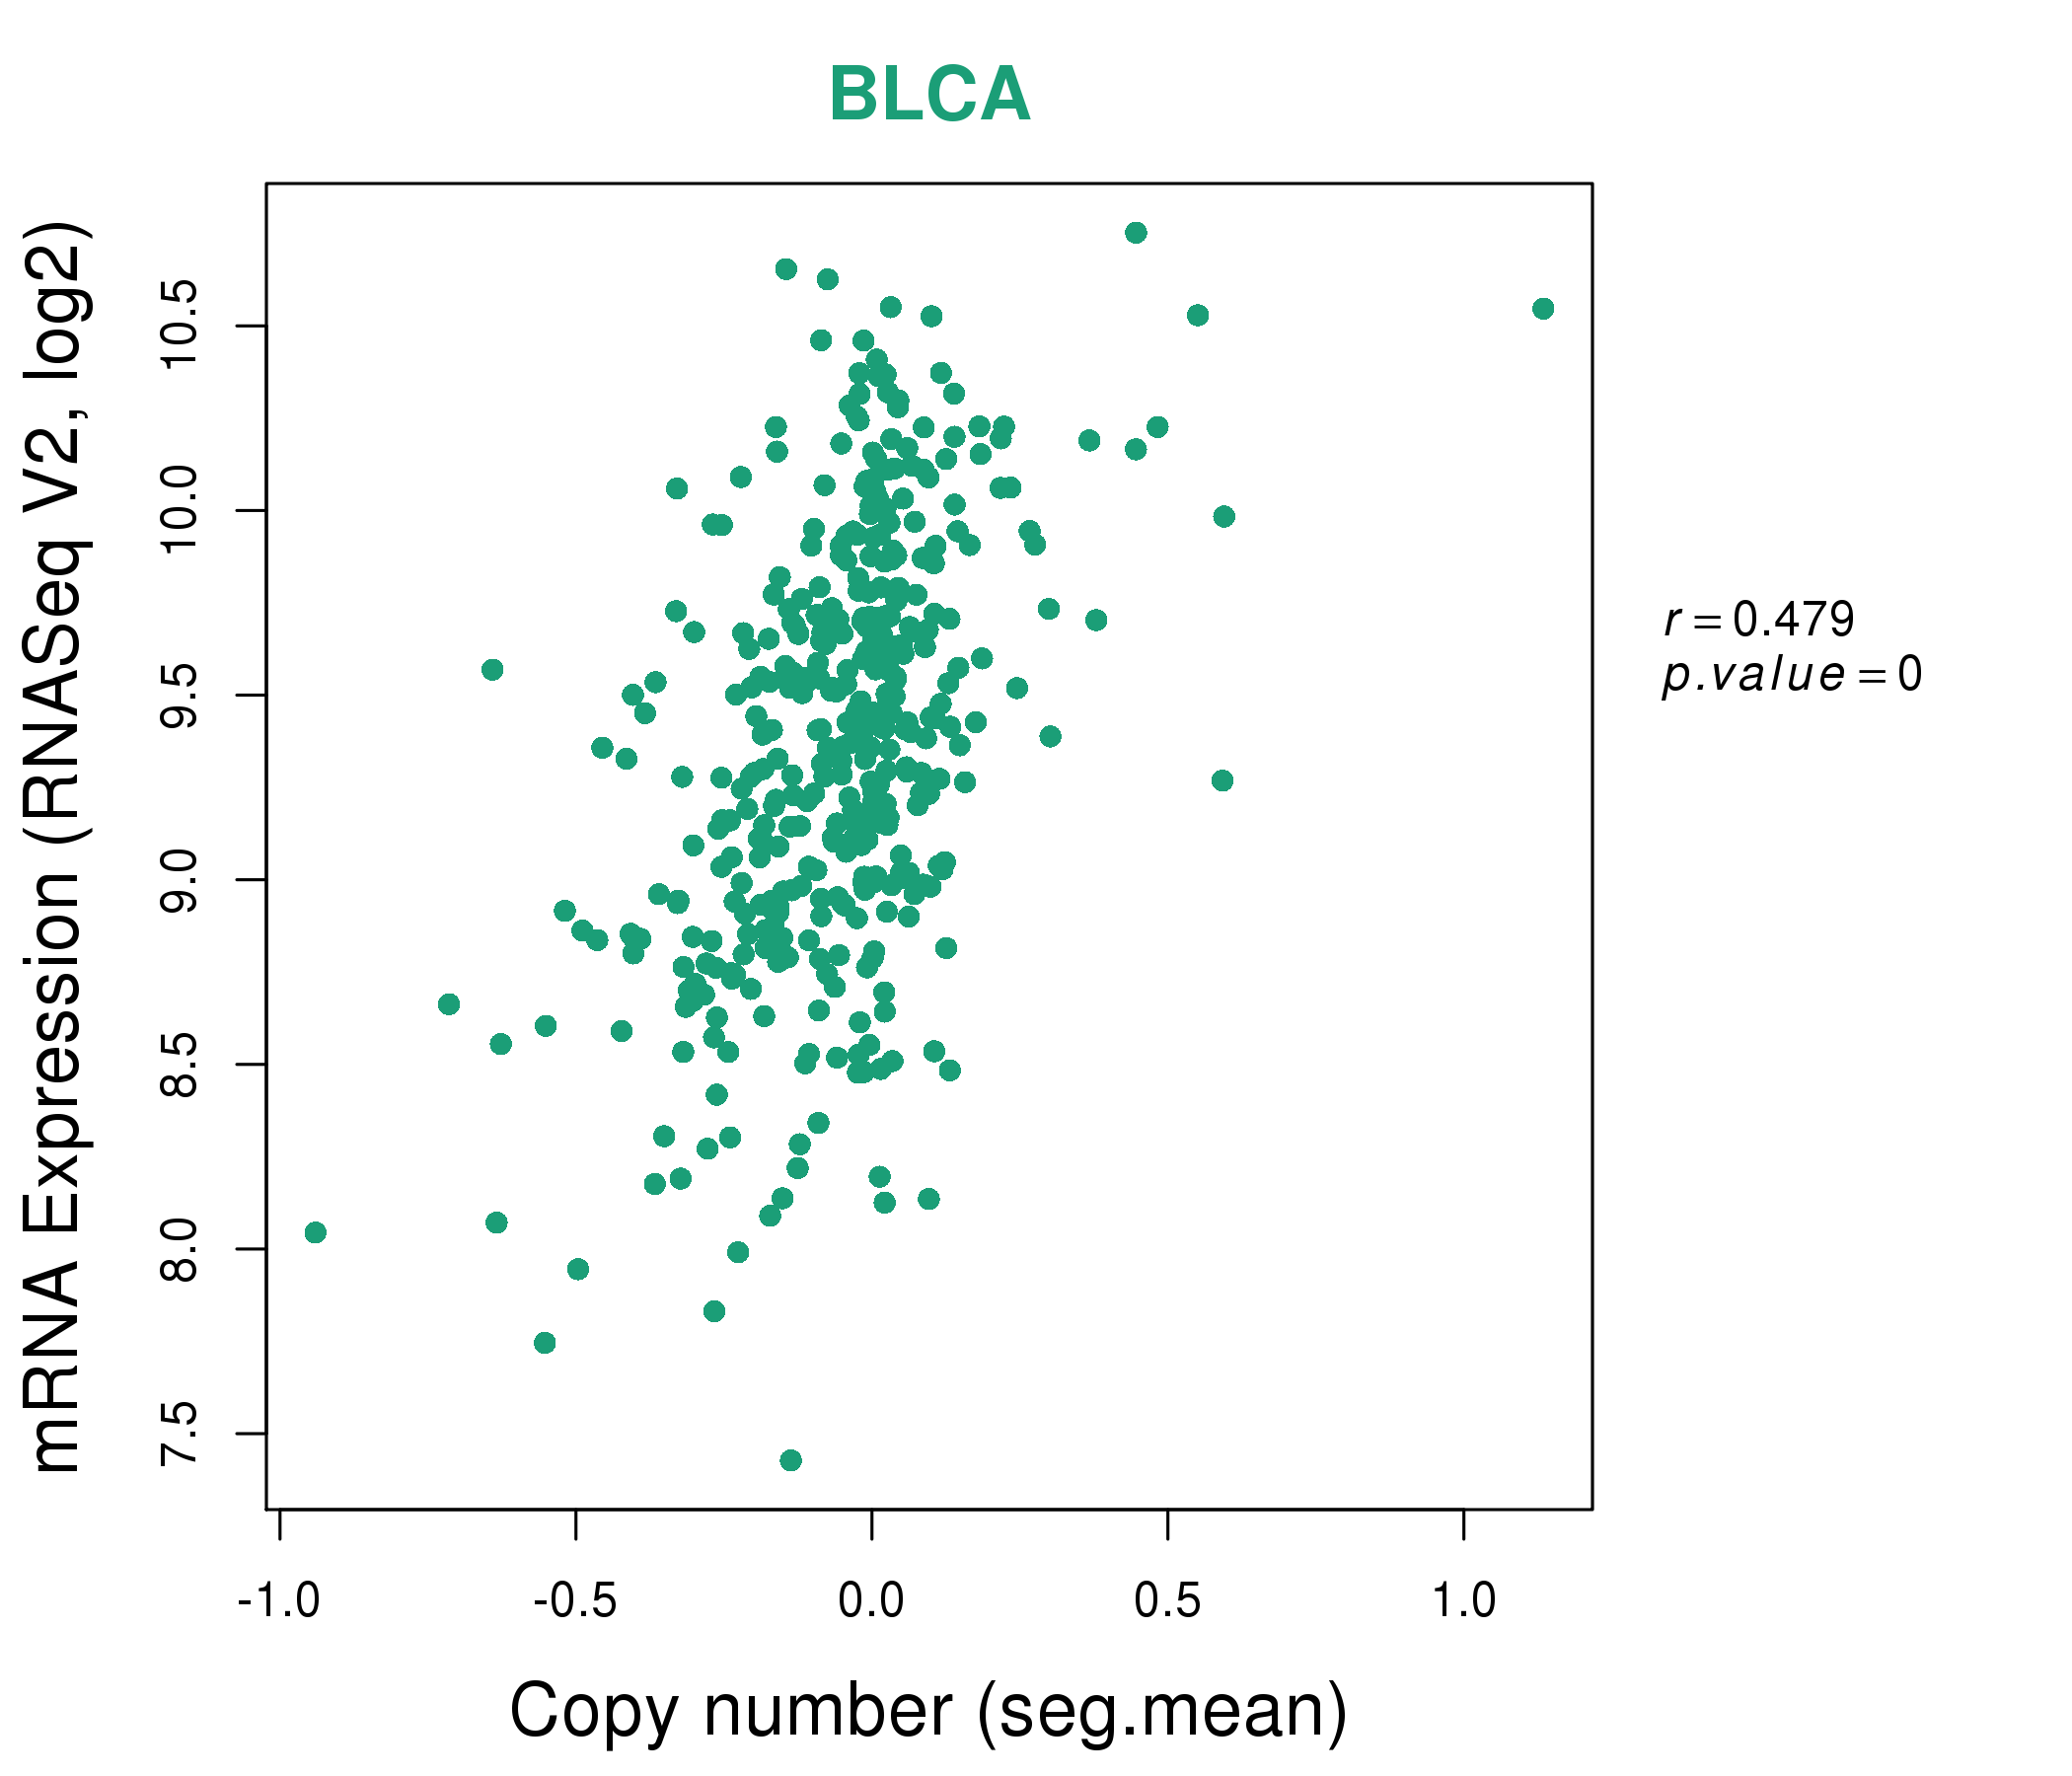
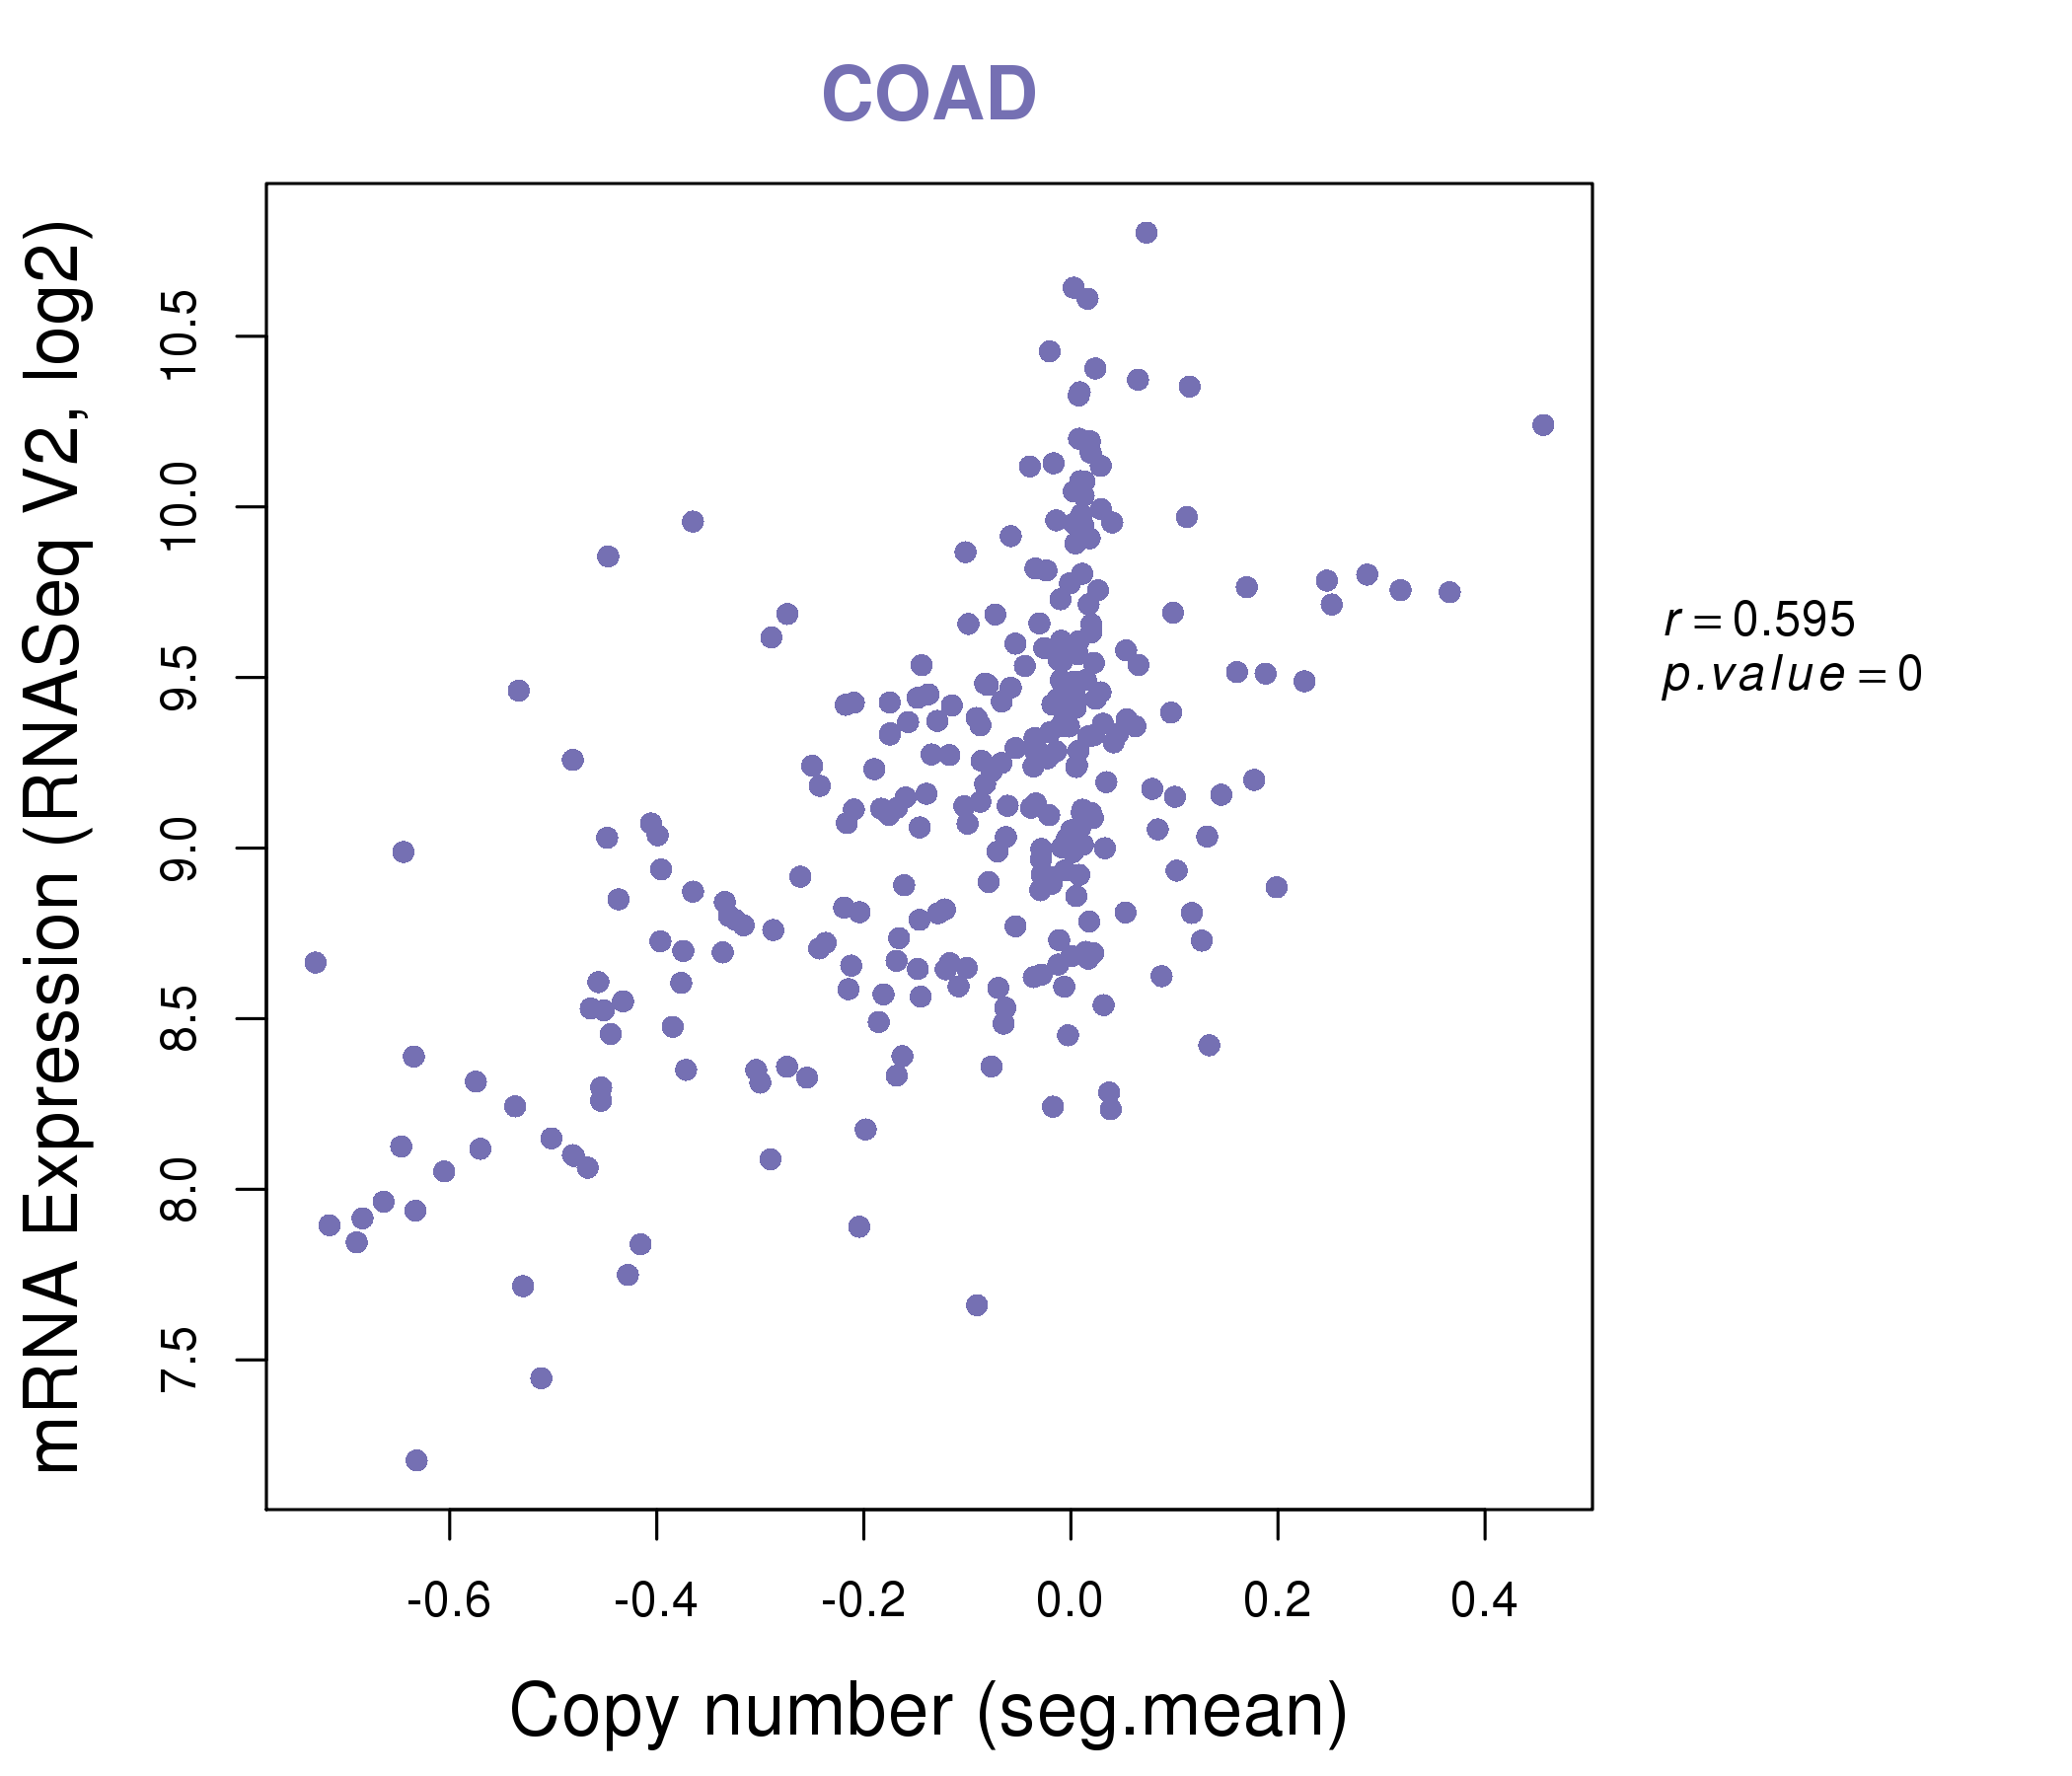
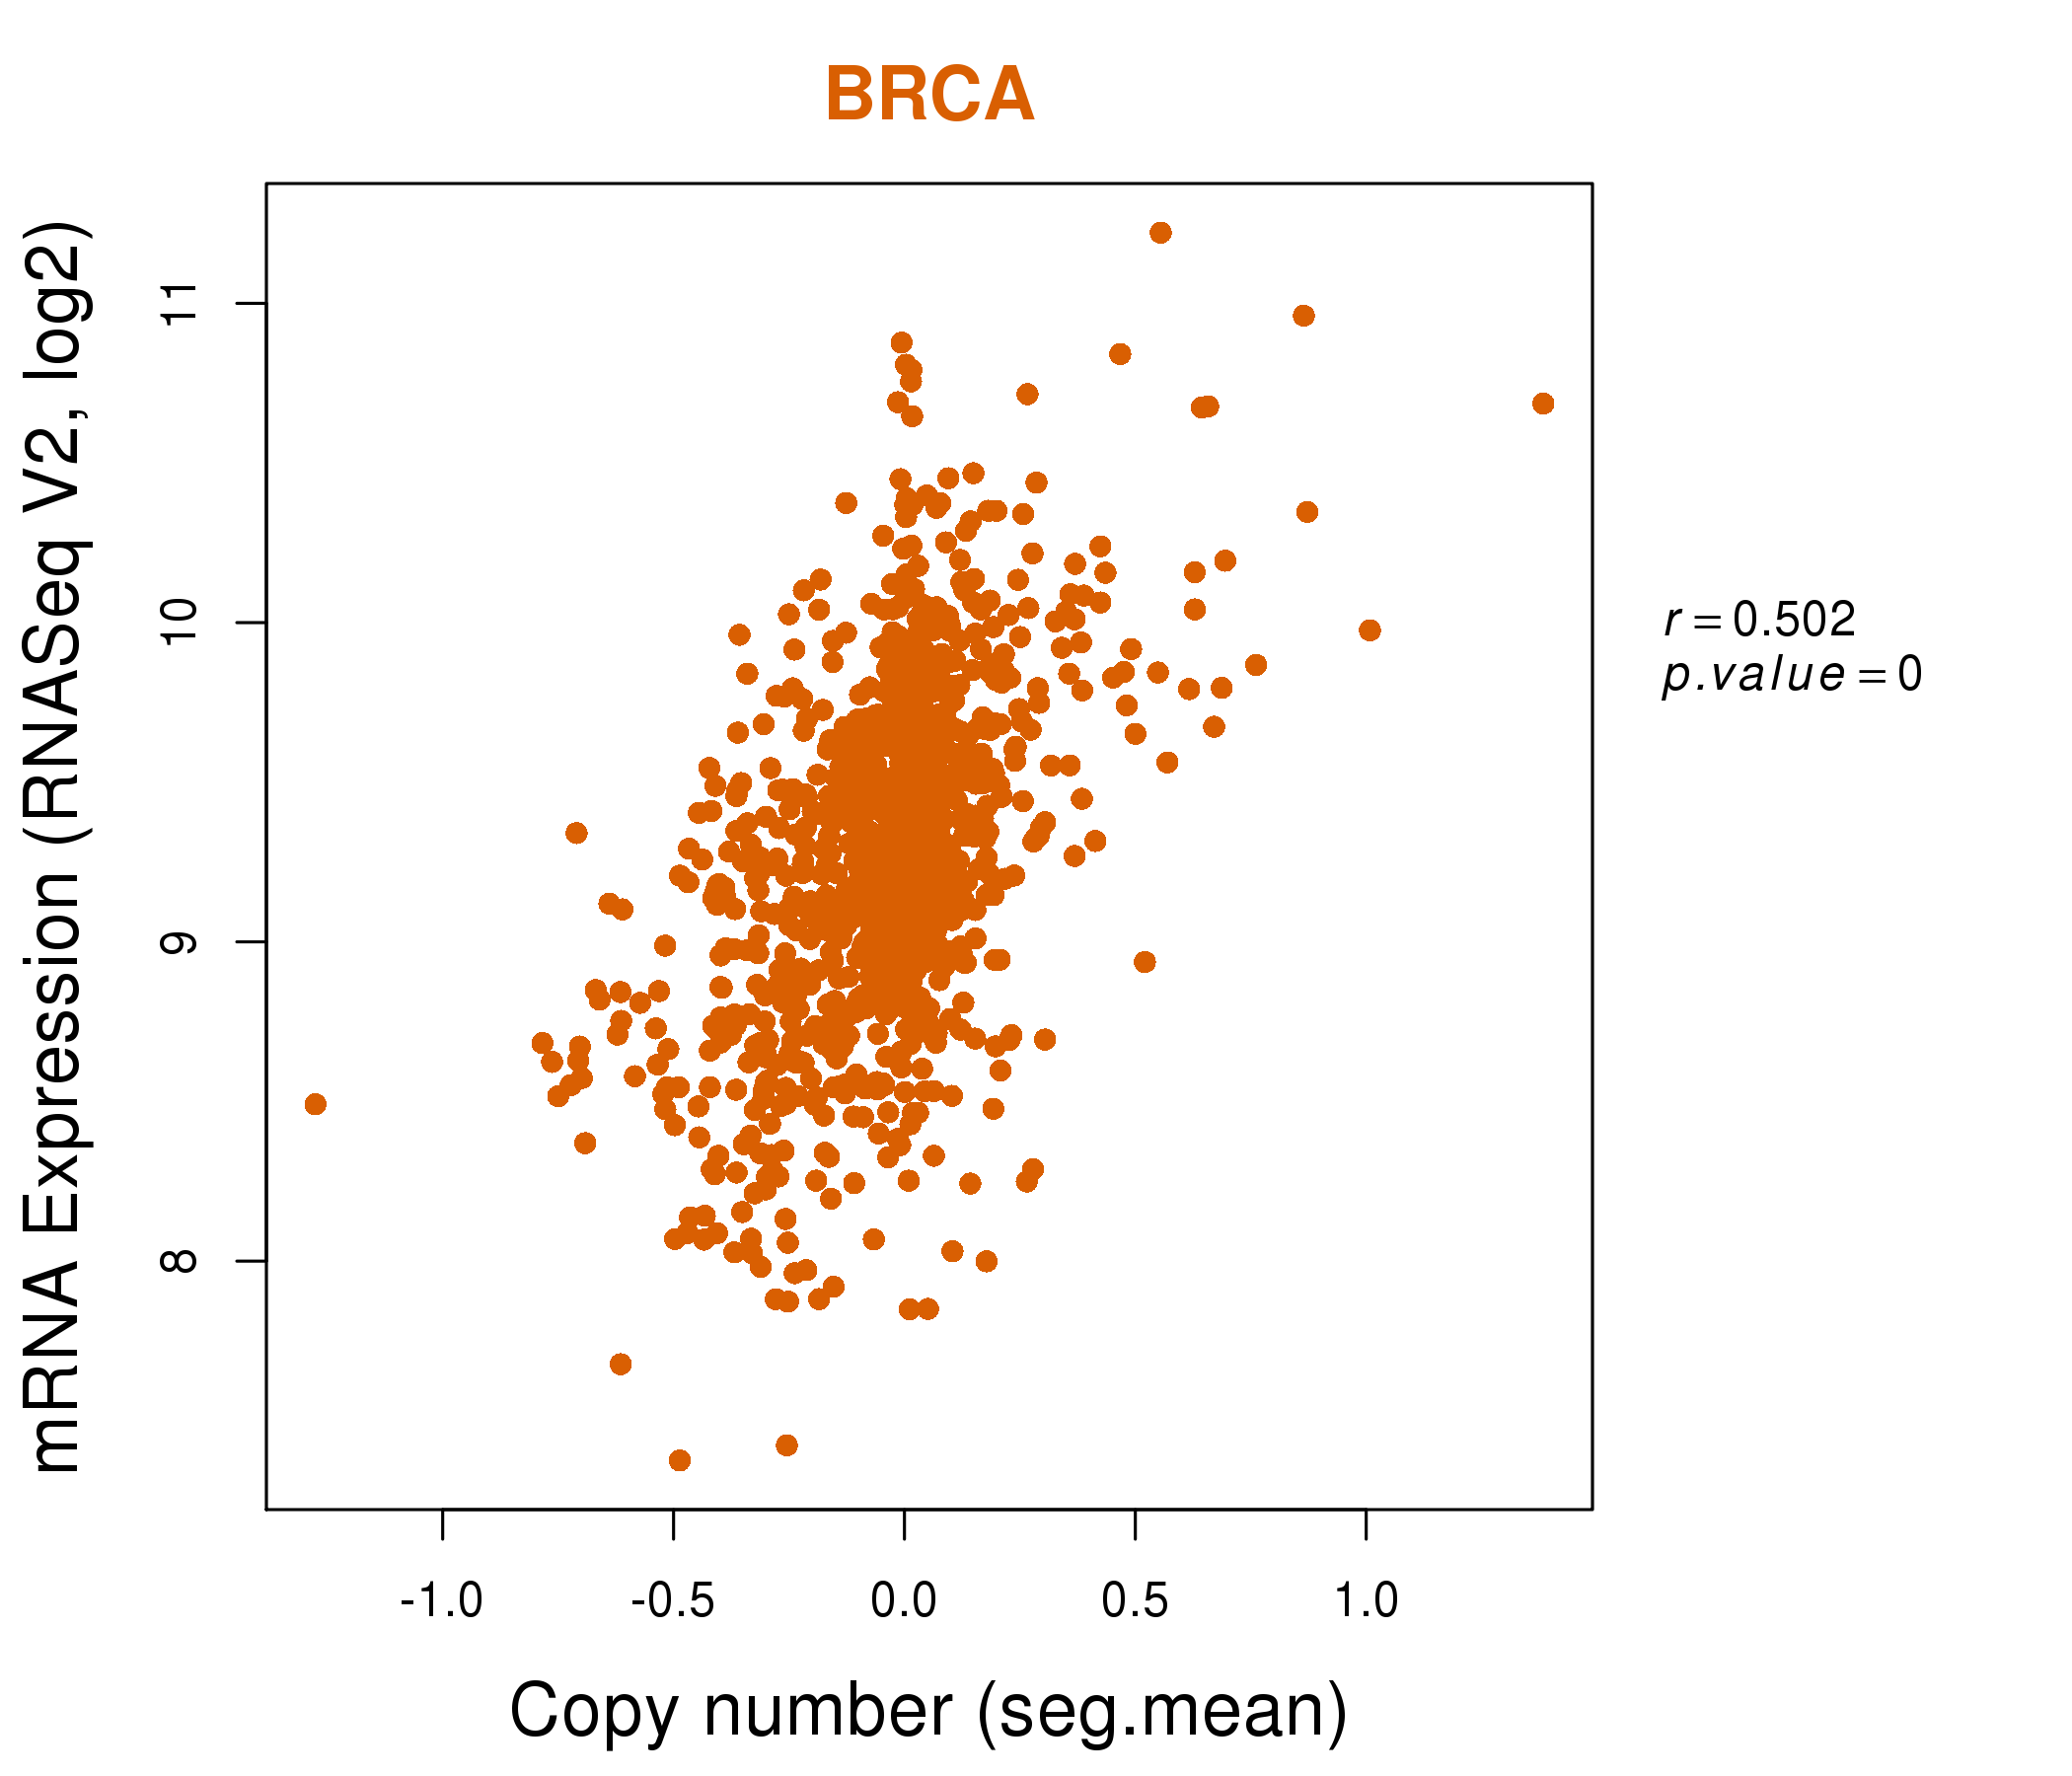
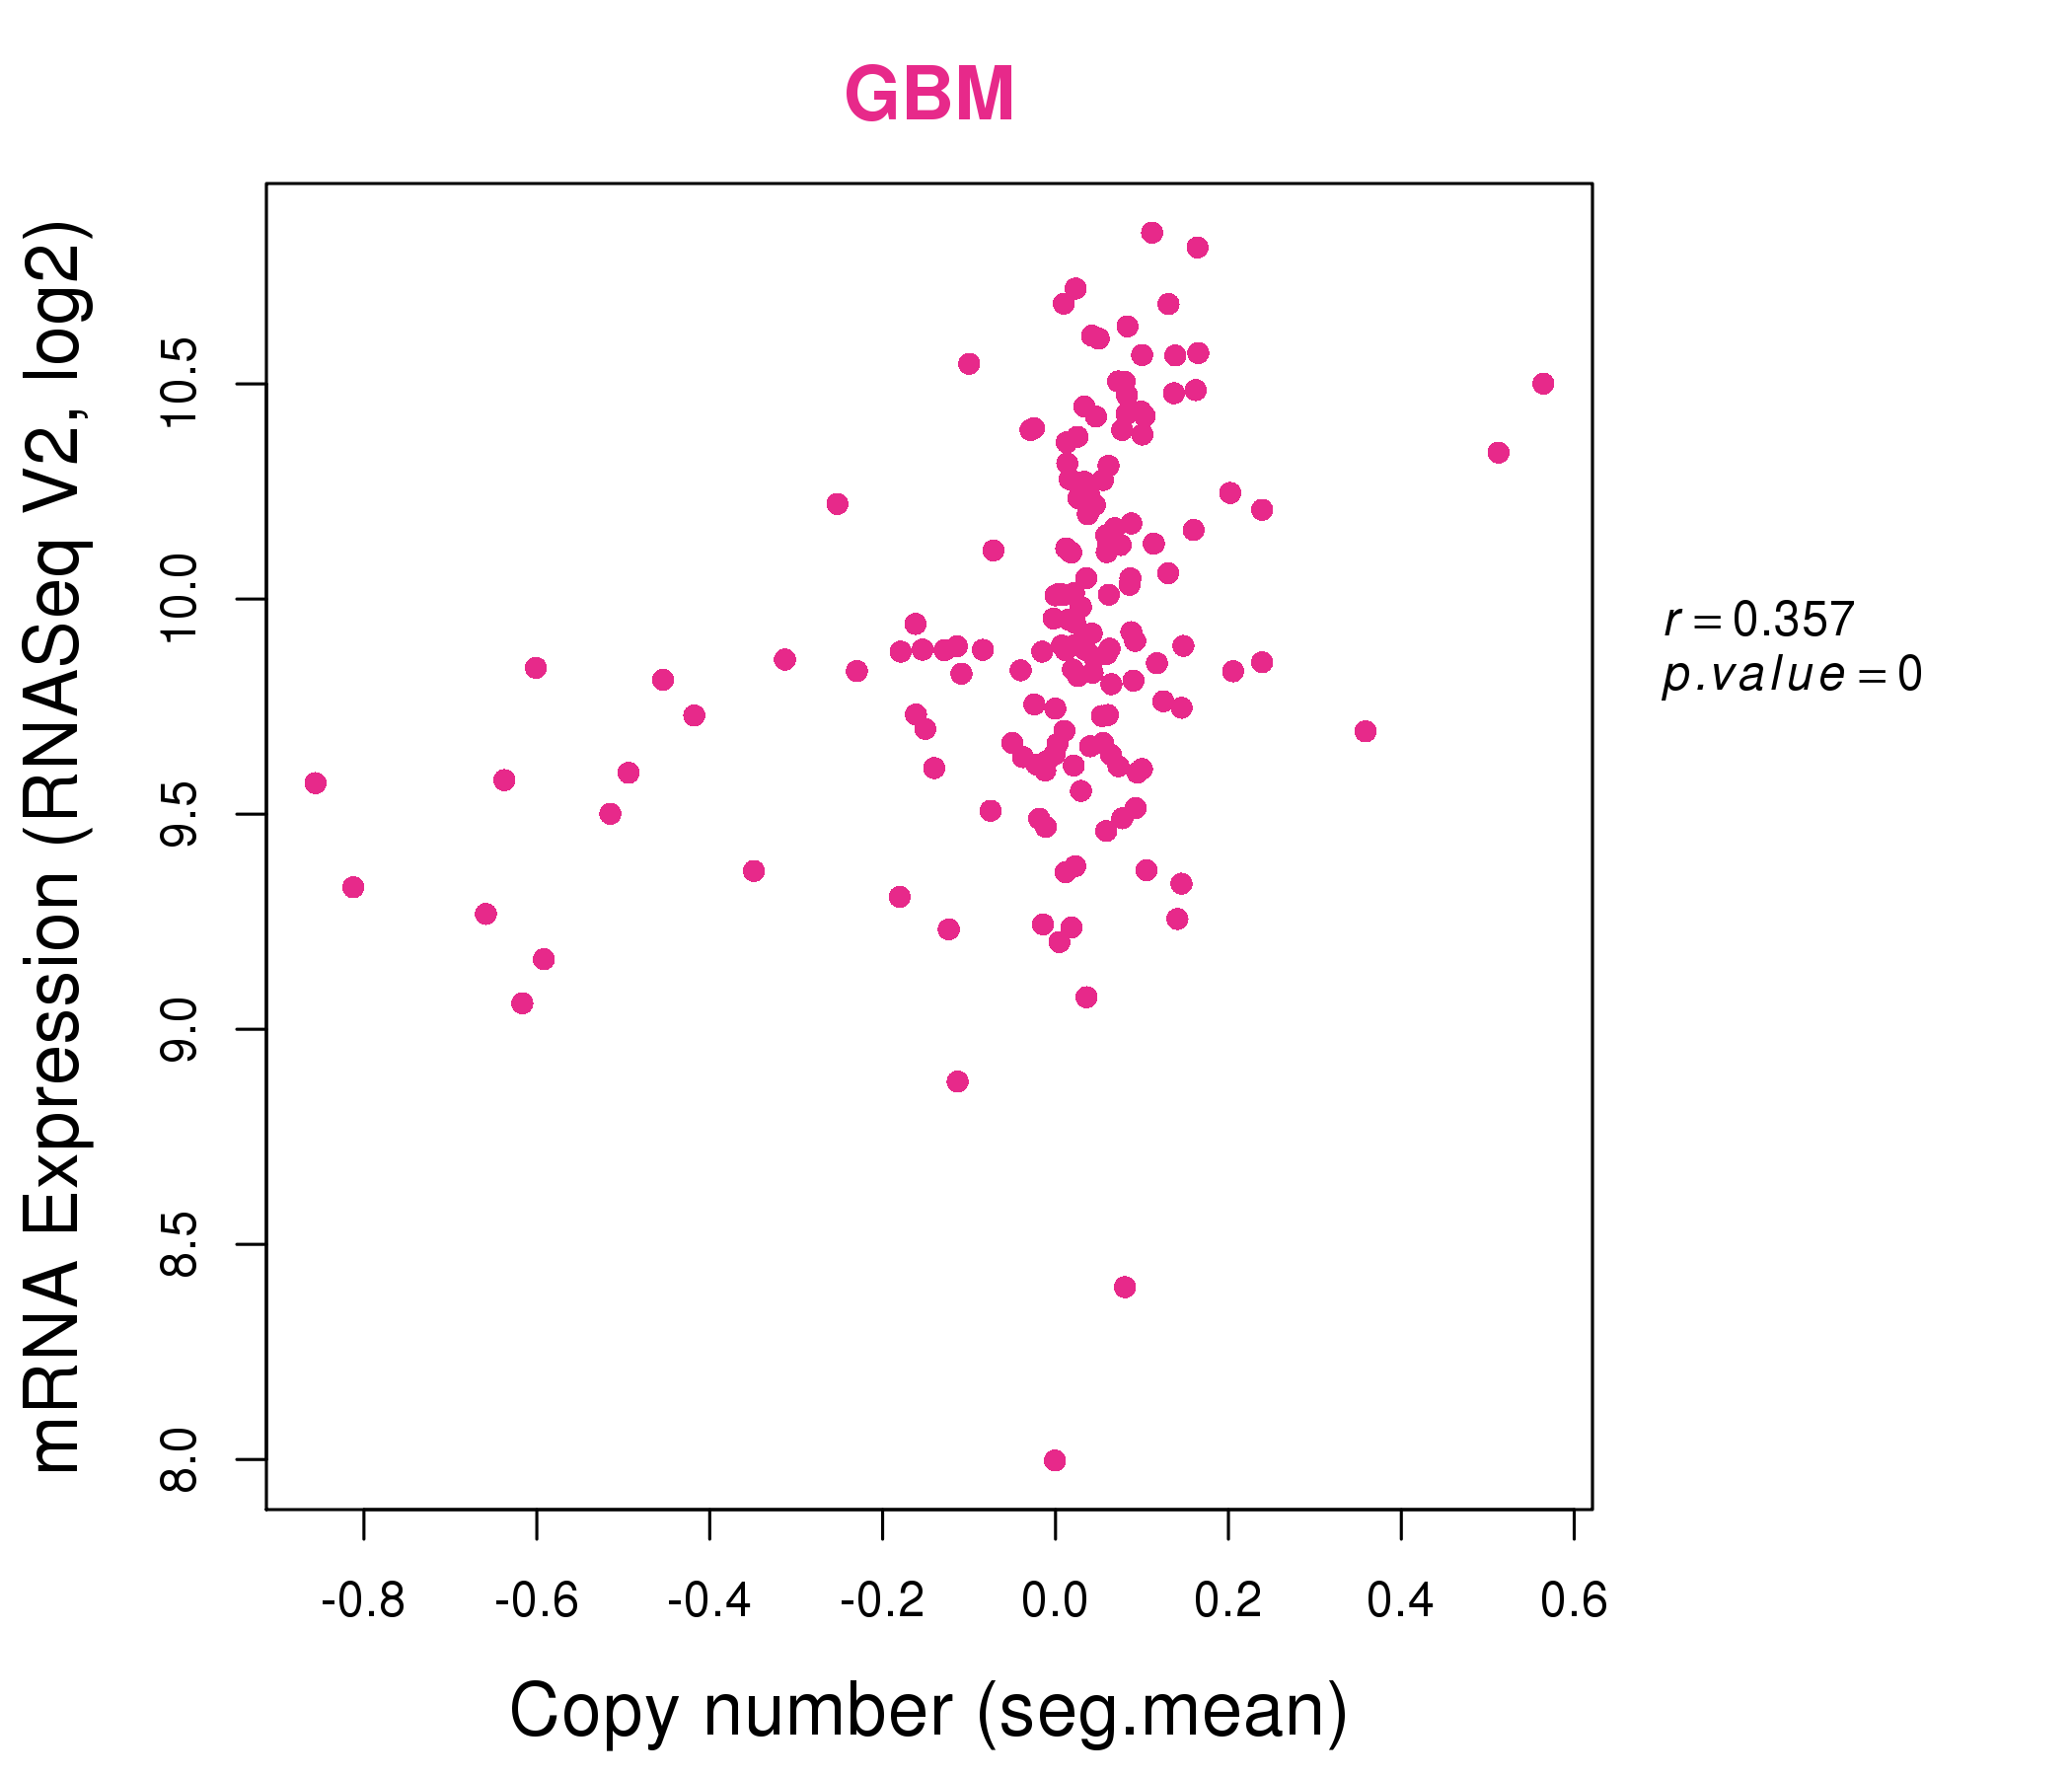
| * This plots show the correlation between CNV and gene expression. |
: Open all plots for all cancer types
 |
|
 |
|
| Top |
| Gene-Gene Network Information |
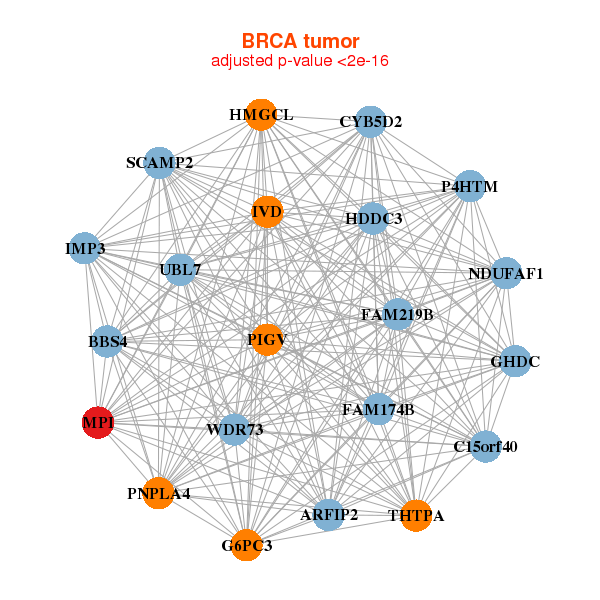
| * Co-Expression network figures were drawn using R package igraph. Only the top 20 genes with the highest correlations were shown. Red circle: input gene, orange circle: cell metabolism gene, sky circle: other gene |
: Open all plots for all cancer types
 |
|
| ARFIP2,BBS4,FAM219B,C15orf40,CYB5D2,FAM174B,G6PC3, GHDC,HDDC3,HMGCL,IMP3,IVD,MPI,NDUFAF1, P4HTM,PIGV,PNPLA4,SCAMP2,THTPA,UBL7,WDR73 | ATP5SL,ATPAF2,BCKDK,RPP25L,COG4,ECSIT,ERAL1, FAHD2B,KLHDC3,LRRC47,MPI,MRPL14,MRPS18B,MRPS9, NDUFB11,NDUFV1,NT5M,RPUSD3,STOML2,TXN2,UBL7 |
 |
|
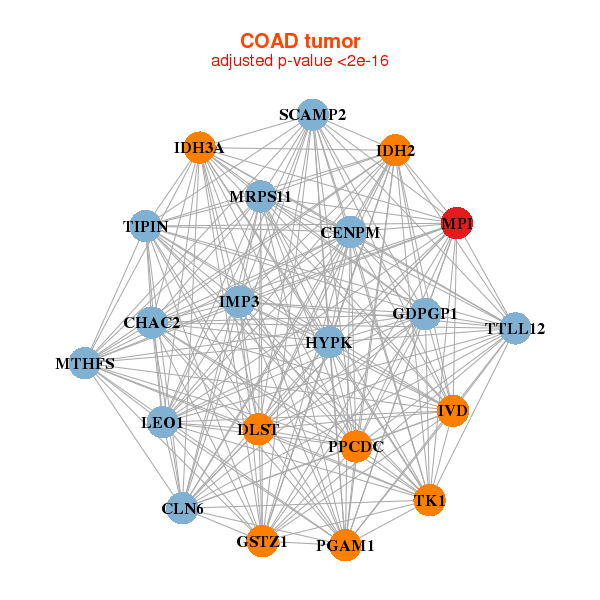
| GDPGP1,HYPK,CENPM,CHAC2,CLN6,DLST,GSTZ1, IDH2,IDH3A,IMP3,IVD,LEO1,MPI,MRPS11, MTHFS,PGAM1,PPCDC,SCAMP2,TIPIN,TK1,TTLL12 | ACP2,ACSL5,LINC00483,GUCD1,C9orf40,DAPK2,DHRS11, ESPN,GDPD2,HMOX1,LASP1,LOC151534,MPI,NAPRT, PLEKHG6,SEPHS2,SLC9A3R1,SULT1A2,TMEM82,TOM1,ULK3 |

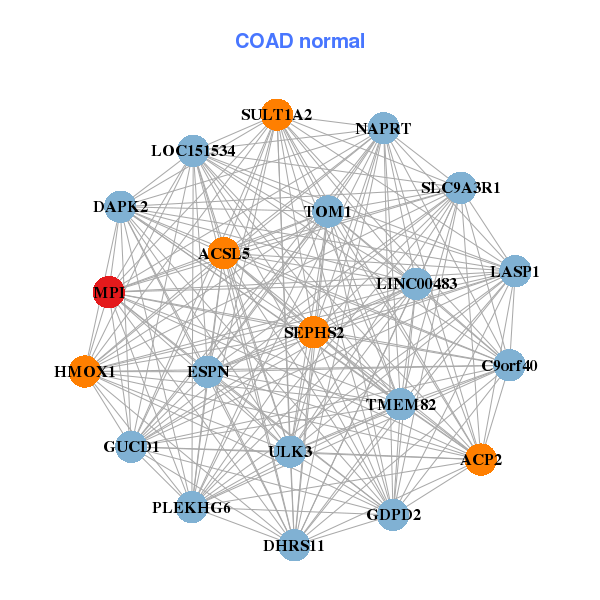
| * Co-Expression network figures were drawn using R package igraph. Only the top 20 genes with the highest correlations were shown. Red circle: input gene, orange circle: cell metabolism gene, sky circle: other gene |
: Open all plots for all cancer types
| Top |
: Open all interacting genes' information including KEGG pathway for all interacting genes from DAVID
| Top |
| Pharmacological Information for MPI |
| There's no related Drug. |
| Top |
| Cross referenced IDs for MPI |
| * We obtained these cross-references from Uniprot database. It covers 150 different DBs, 18 categories. http://www.uniprot.org/help/cross_references_section |
: Open all cross reference information
|
Copyright © 2016-Present - The Univsersity of Texas Health Science Center at Houston @ |