|
||||||||||||||||||||
| |
| Phenotypic Information (metabolism pathway, cancer, disease, phenome) |
| |
| |
| Gene-Gene Network Information: Co-Expression Network, Interacting Genes & KEGG |
| |
|


| Gene Summary for ASPA |
| Basic gene info. | Gene symbol | ASPA |
| Gene name | aspartoacylase | |
| Synonyms | ACY2|ASP | |
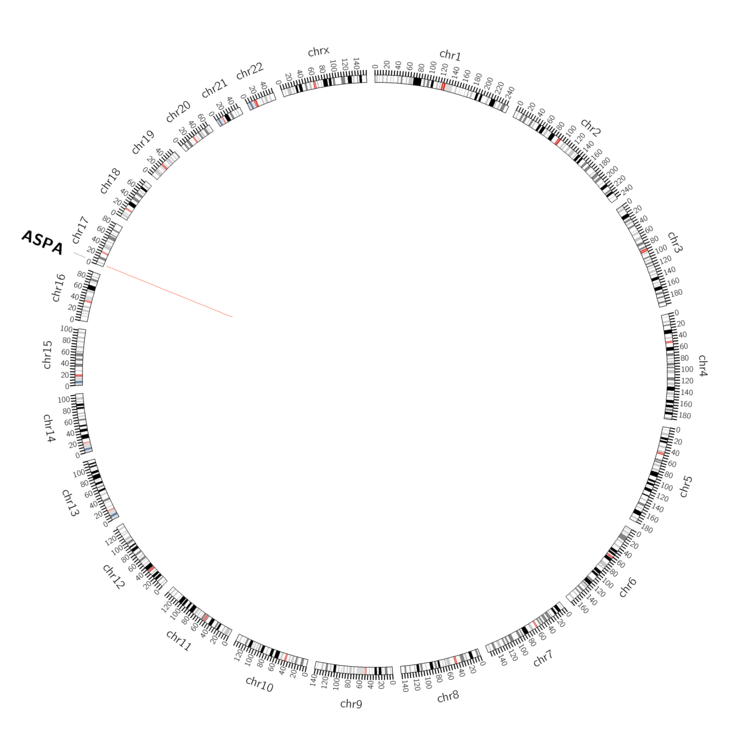
| Cytomap | UCSC genome browser: 17p13.3 | |
| Genomic location | chr17 :3377403-3402700 | |
| Type of gene | protein-coding | |
| RefGenes | NM_000049.2, NM_001128085.1, | |
| Ensembl id | ENSG00000108381 | |
| Description | ACY-2aminoacylase 2aminoacylase-2 | |
| Modification date | 20141219 | |
| dbXrefs | MIM : 608034 | |
| HGNC : HGNC | ||
| HPRD : 02033 | ||
| Protein | UniProt: P45381 go to UniProt's Cross Reference DB Table | |
| Expression | CleanEX: HS_ASPA | |
| BioGPS: 443 | ||
| Gene Expression Atlas: ENSG00000108381 | ||
| The Human Protein Atlas: ENSG00000108381 | ||
| Pathway | NCI Pathway Interaction Database: ASPA | |
| KEGG: ASPA | ||
| REACTOME: ASPA | ||
| ConsensusPathDB | ||
| Pathway Commons: ASPA | ||
| Metabolism | MetaCyc: ASPA | |
| HUMANCyc: ASPA | ||
| Regulation | Ensembl's Regulation: ENSG00000108381 | |
| miRBase: chr17 :3,377,403-3,402,700 | ||
| TargetScan: NM_000049 | ||
| cisRED: ENSG00000108381 | ||
| Context | iHOP: ASPA | |
| cancer metabolism search in PubMed: ASPA | ||
| UCL Cancer Institute: ASPA | ||
| Assigned class in ccmGDB | A - This gene has a literature evidence and it belongs to cancer gene. | |
| References showing role of ASPA in cancer cell metabolism | 1. Oh HR, An CH, Yoo NJ, Lee SH (2014) Somatic mutations of amino acid metabolism-related genes in gastric and colorectal cancers and their regional heterogeneity--a short report. Cell Oncol (Dordr) 37: 455-461. doi: 10.1007/s13402-014-0209-1. go to article 2. Tsen AR, Long PM, Driscoll HE, Davies MT, Teasdale BA, et al. (2014) Triacetin-based acetate supplementation as a chemotherapeutic adjuvant therapy in glioma. Int J Cancer 134: 1300-1310. doi: 10.1002/ijc.28465. pmid: 3947395. go to article 3. Long PM, Moffett JR, Namboodiri AM, Viapiano MS, Lawler SE, et al. (2013) N-acetylaspartate (NAA) and N-acetylaspartylglutamate (NAAG) promote growth and inhibit differentiation of glioma stem-like cells. J Biol Chem 288: 26188-26200. doi: 10.1074/jbc.M113.487553. pmid: 3764823. go to article | |
| Top |
| Phenotypic Information for ASPA(metabolism pathway, cancer, disease, phenome) |
| Cancer | CGAP: ASPA |
| Familial Cancer Database: ASPA | |
| * This gene is included in those cancer gene databases. |
|
|
|
|
|
|
| ||||||||||||||
Oncogene 1 | Significant driver gene in | |||||||||||||||||||
| cf) number; DB name 1 Oncogene; http://nar.oxfordjournals.org/content/35/suppl_1/D721.long, 2 Tumor Suppressor gene; https://bioinfo.uth.edu/TSGene/, 3 Cancer Gene Census; http://www.nature.com/nrc/journal/v4/n3/abs/nrc1299.html, 4 CancerGenes; http://nar.oxfordjournals.org/content/35/suppl_1/D721.long, 5 Network of Cancer Gene; http://ncg.kcl.ac.uk/index.php, 1Therapeutic Vulnerabilities in Cancer; http://cbio.mskcc.org/cancergenomics/statius/ |
| KEGG_ALANINE_ASPARTATE_AND_GLUTAMATE_METABOLISM KEGG_HISTIDINE_METABOLISM | |
| OMIM | 271900; phenotype. 608034; gene. |
| Orphanet | 314911; Severe Canavan disease. 314918; Mild Canavan disease. |
| Disease | KEGG Disease: ASPA |
| MedGen: ASPA (Human Medical Genetics with Condition) | |
| ClinVar: ASPA | |
| Phenotype | MGI: ASPA (International Mouse Phenotyping Consortium) |
| PhenomicDB: ASPA | |
| Mutations for ASPA |
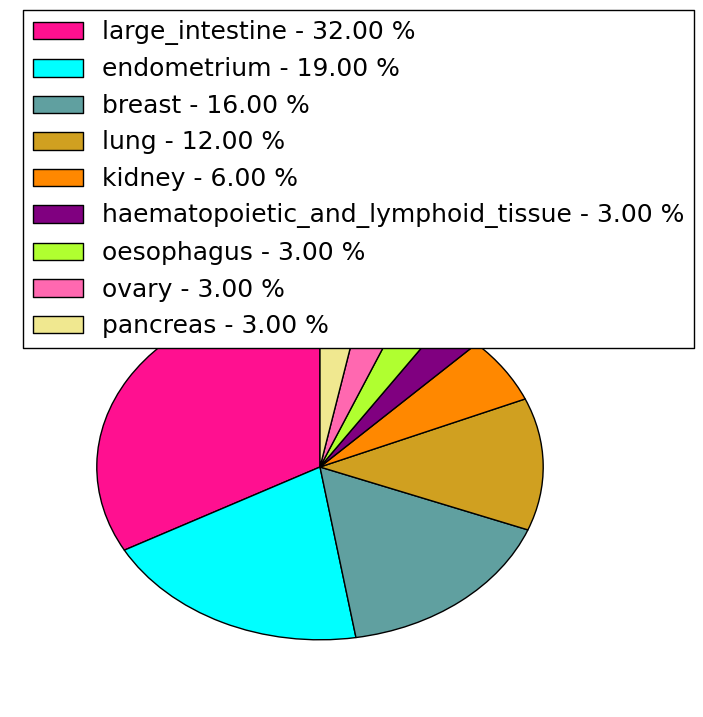
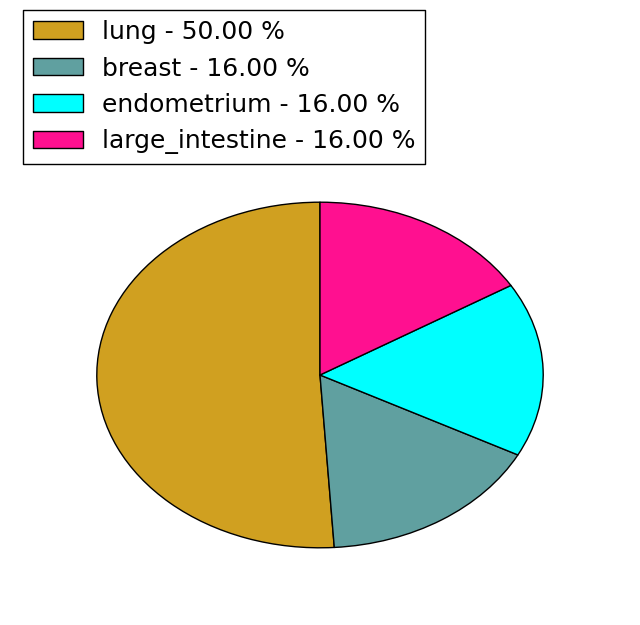
| * Under tables are showing count per each tissue to give us broad intuition about tissue specific mutation patterns.You can go to the detailed page for each mutation database's web site. |
| - Statistics for Tissue and Mutation type | Top |
 |
| - For Inter-chromosomal Variations |
| There's no inter-chromosomal structural variation. |
| - For Intra-chromosomal Variations |
| * Intra-chromosomal variantions includes 'intrachromosomal amplicon to amplicon', 'intrachromosomal amplicon to non-amplified dna', 'intrachromosomal deletion', 'intrachromosomal fold-back inversion', 'intrachromosomal inversion', 'intrachromosomal tandem duplication', 'Intrachromosomal unknown type', 'intrachromosomal with inverted orientation', 'intrachromosomal with non-inverted orientation'. |
 |
| Sample | Symbol_a | Chr_a | Start_a | End_a | Symbol_b | Chr_b | Start_b | End_b |
| ovary | ASPA | chr17 | 3383932 | 3383952 | ASPA | chr17 | 3388191 | 3388211 |
| cf) Tissue number; Tissue name (1;Breast, 2;Central_nervous_system, 3;Haematopoietic_and_lymphoid_tissue, 4;Large_intestine, 5;Liver, 6;Lung, 7;Ovary, 8;Pancreas, 9;Prostate, 10;Skin, 11;Soft_tissue, 12;Upper_aerodigestive_tract) |
| * From mRNA Sanger sequences, Chitars2.0 arranged chimeric transcripts. This table shows ASPA related fusion information. |
| ID | Head Gene | Tail Gene | Accession | Gene_a | qStart_a | qEnd_a | Chromosome_a | tStart_a | tEnd_a | Gene_a | qStart_a | qEnd_a | Chromosome_a | tStart_a | tEnd_a |
| Top |
| There's no copy number variation information in COSMIC data for this gene. |
| Top |
|
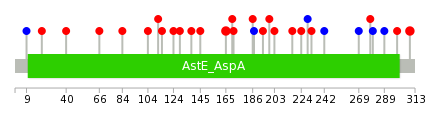
 |
| Top |
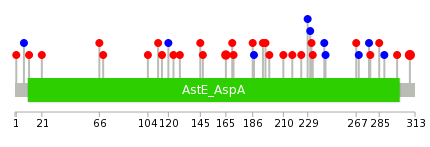
| Stat. for Non-Synonymous SNVs (# total SNVs=31) | (# total SNVs=6) |
 |  |
(# total SNVs=0) | (# total SNVs=0) |
| Top |
| * When you move the cursor on each content, you can see more deailed mutation information on the Tooltip. Those are primary_site,primary_histology,mutation(aa),pubmedID. |
| GRCh37 position | Mutation(aa) | Unique sampleID count |
| chr17:3402365-3402365 | p.R309C | 3 |
| chr17:3386854-3386854 | p.A165V | 2 |
| chr17:3392582-3392582 | p.Q194K | 2 |
| chr17:3386852-3386852 | p.Y164* | 1 |
| chr17:3397658-3397658 | p.P217S | 1 |
| chr17:3402271-3402271 | p.T277T | 1 |
| chr17:3384898-3384898 | p.M82fs*9 | 1 |
| chr17:3397679-3397679 | p.K224E | 1 |
| chr17:3402272-3402272 | p.V278M | 1 |
| chr17:3384971-3384971 | p.D104G | 1 |
| Top |
|
 |
| Point Mutation/ Tissue ID | 1 | 2 | 3 | 4 | 5 | 6 | 7 | 8 | 9 | 10 | 11 | 12 | 13 | 14 | 15 | 16 | 17 | 18 | 19 | 20 |
| # sample | 2 | 8 | 1 | 1 | 4 | 1 | 1 | 1 | 4 | 2 | 5 | |||||||||
| # mutation | 2 | 8 | 1 | 1 | 4 | 1 | 1 | 1 | 4 | 2 | 5 | |||||||||
| nonsynonymous SNV | 2 | 7 | 1 | 1 | 2 | 1 | 4 | 1 | 4 | |||||||||||
| synonymous SNV | 1 | 2 | 1 | 1 | 1 | 1 |
| cf) Tissue ID; Tissue type (1; BLCA[Bladder Urothelial Carcinoma], 2; BRCA[Breast invasive carcinoma], 3; CESC[Cervical squamous cell carcinoma and endocervical adenocarcinoma], 4; COAD[Colon adenocarcinoma], 5; GBM[Glioblastoma multiforme], 6; Glioma Low Grade, 7; HNSC[Head and Neck squamous cell carcinoma], 8; KICH[Kidney Chromophobe], 9; KIRC[Kidney renal clear cell carcinoma], 10; KIRP[Kidney renal papillary cell carcinoma], 11; LAML[Acute Myeloid Leukemia], 12; LUAD[Lung adenocarcinoma], 13; LUSC[Lung squamous cell carcinoma], 14; OV[Ovarian serous cystadenocarcinoma ], 15; PAAD[Pancreatic adenocarcinoma], 16; PRAD[Prostate adenocarcinoma], 17; SKCM[Skin Cutaneous Melanoma], 18:STAD[Stomach adenocarcinoma], 19:THCA[Thyroid carcinoma], 20:UCEC[Uterine Corpus Endometrial Carcinoma]) |
| Top |
| * We represented just top 10 SNVs. When you move the cursor on each content, you can see more deailed mutation information on the Tooltip. Those are primary_site, primary_histology, mutation(aa), pubmedID. |
| Genomic Position | Mutation(aa) | Unique sampleID count |
| chr17:3402365 | p.A165V,ASPA | 2 |
| chr17:3386854 | p.R309C,ASPA | 2 |
| chr17:3384996 | p.L115I,ASPA | 1 |
| chr17:3392582 | p.P232S,ASPA | 1 |
| chr17:3402307 | p.C124F,ASPA | 1 |
| chr17:3385003 | p.I242I,ASPA | 1 |
| chr17:3392598 | p.E129D,ASPA | 1 |
| chr17:3402335 | p.T269T,ASPA | 1 |
| chr17:3385031 | p.Q138H,ASPA | 1 |
| chr17:3392609 | p.V278M,ASPA | 1 |
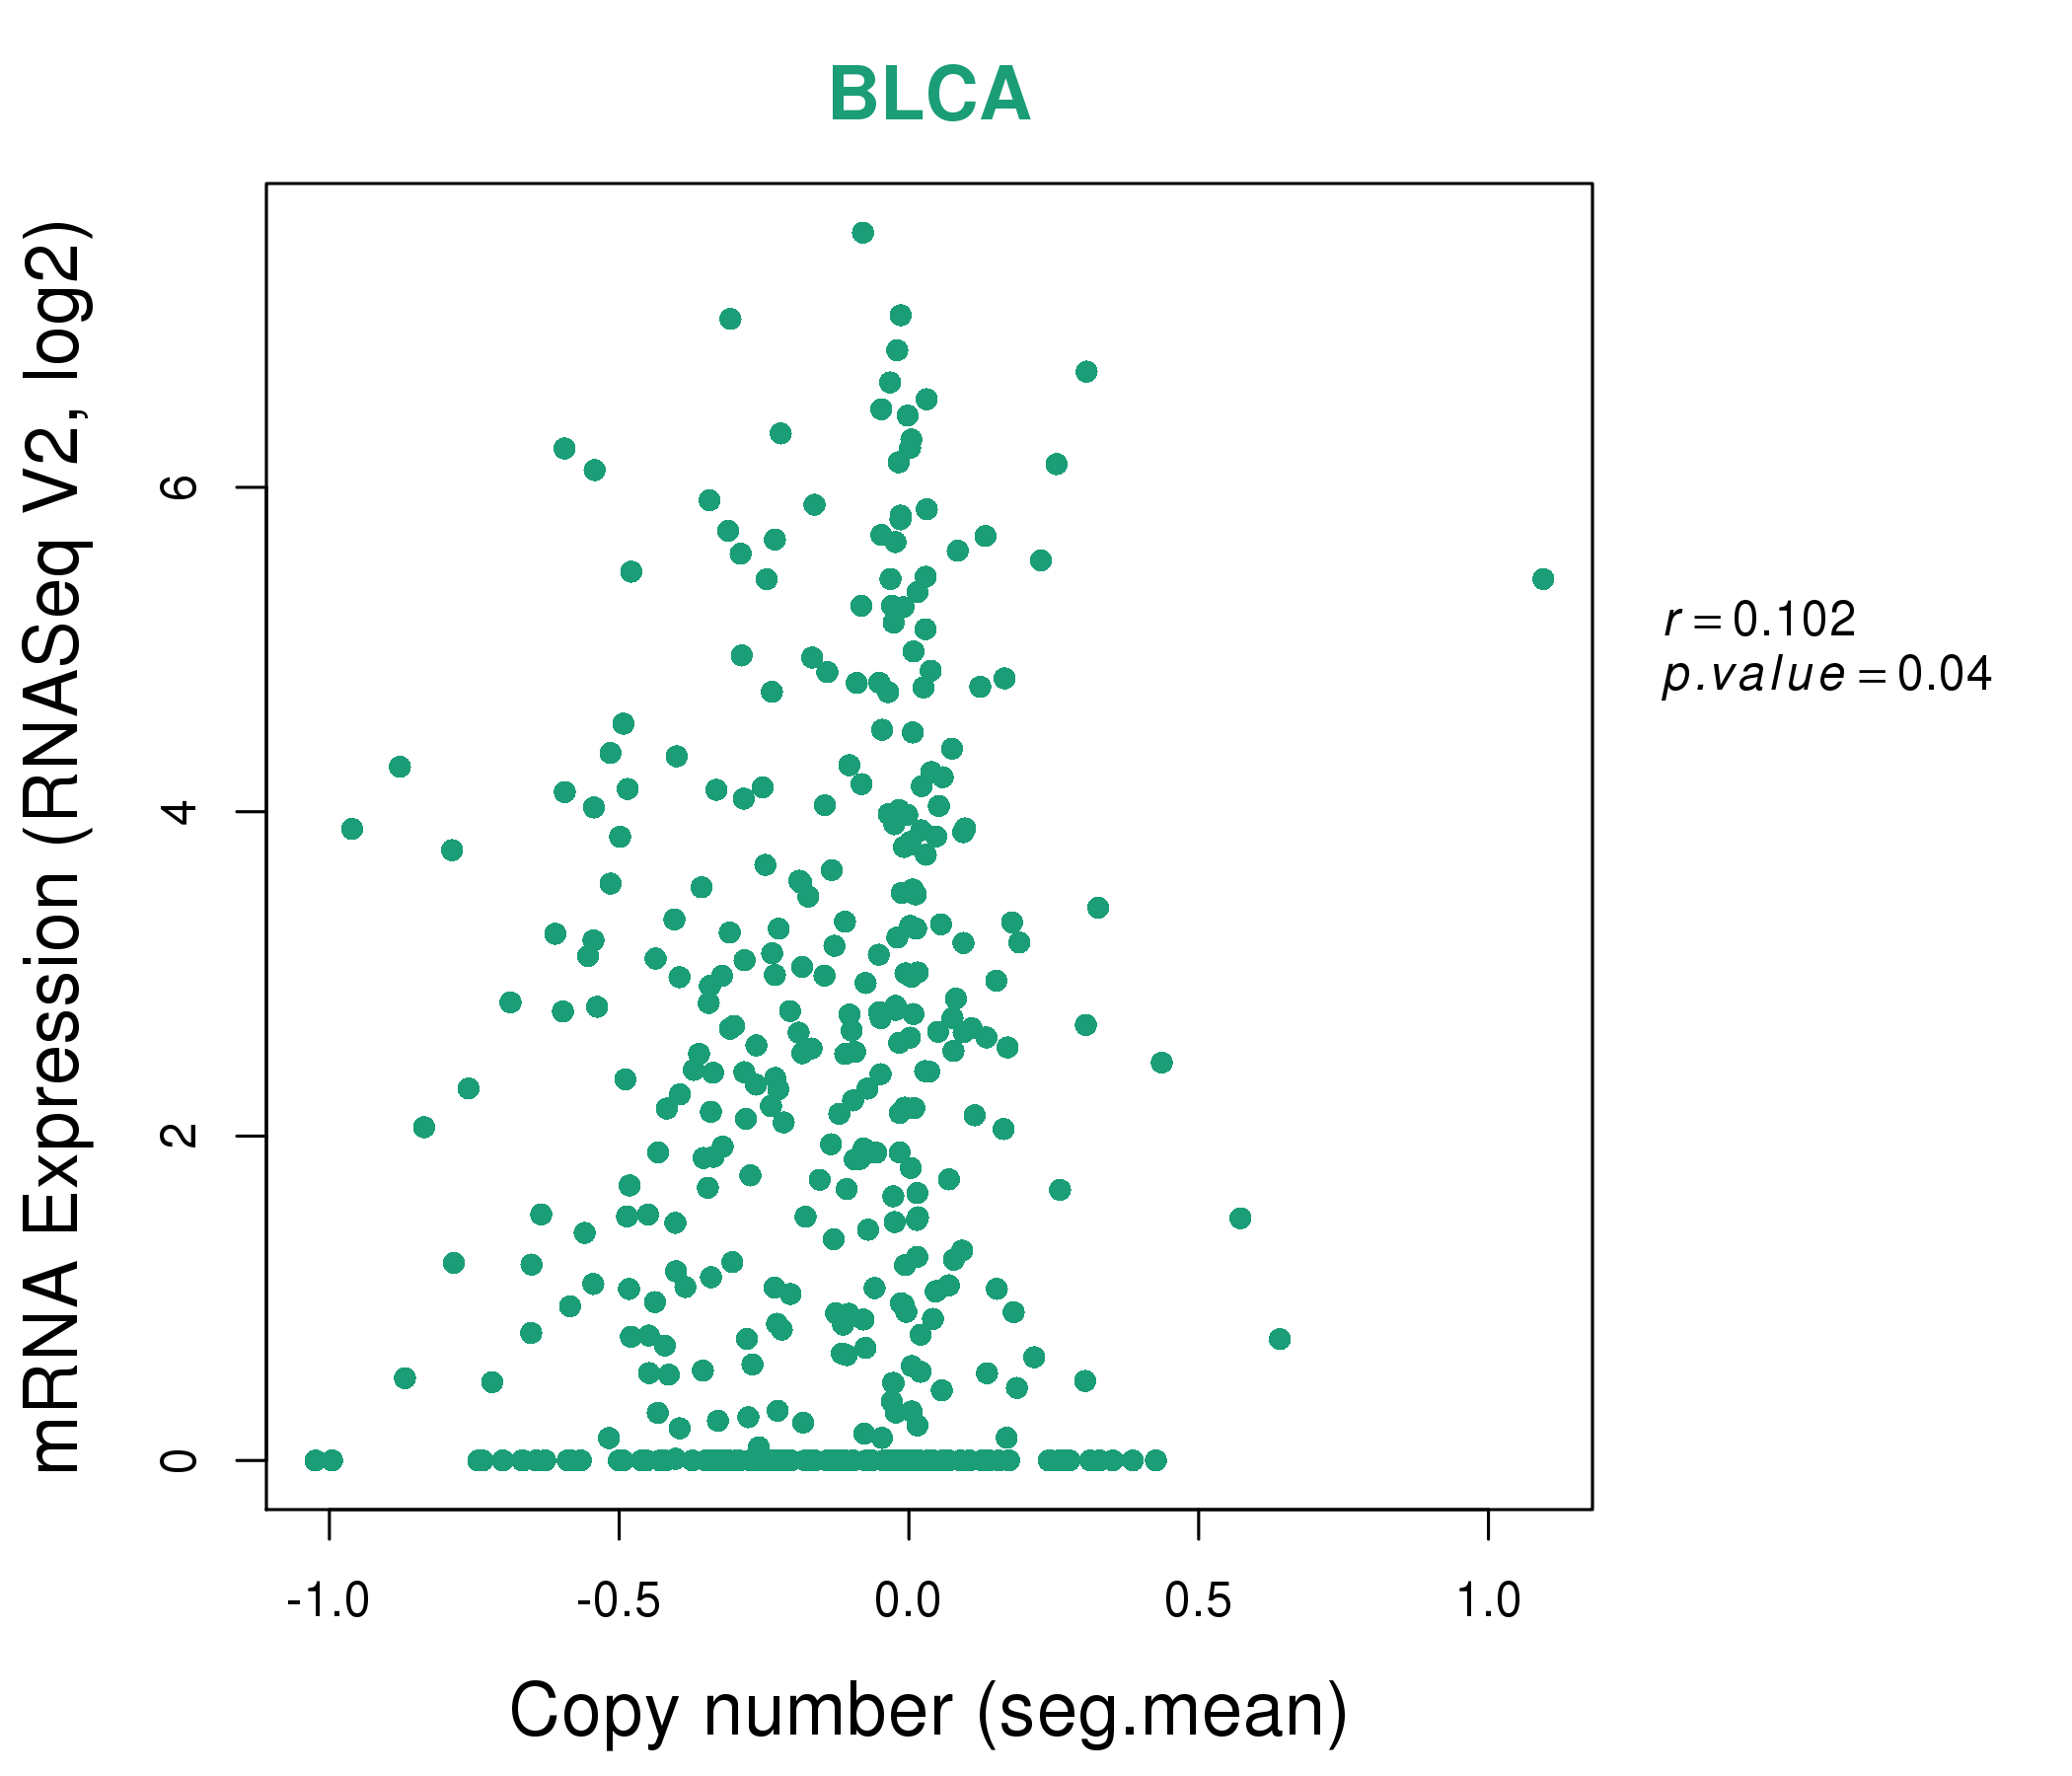
| * Copy number data were extracted from TCGA using R package TCGA-Assembler. The URLs of all public data files on TCGA DCC data server were gathered on Jan-05-2015. Function ProcessCNAData in TCGA-Assembler package was used to obtain gene-level copy number value which is calculated as the average copy number of the genomic region of a gene. |
 |
| cf) Tissue ID[Tissue type]: BLCA[Bladder Urothelial Carcinoma], BRCA[Breast invasive carcinoma], CESC[Cervical squamous cell carcinoma and endocervical adenocarcinoma], COAD[Colon adenocarcinoma], GBM[Glioblastoma multiforme], Glioma Low Grade, HNSC[Head and Neck squamous cell carcinoma], KICH[Kidney Chromophobe], KIRC[Kidney renal clear cell carcinoma], KIRP[Kidney renal papillary cell carcinoma], LAML[Acute Myeloid Leukemia], LUAD[Lung adenocarcinoma], LUSC[Lung squamous cell carcinoma], OV[Ovarian serous cystadenocarcinoma ], PAAD[Pancreatic adenocarcinoma], PRAD[Prostate adenocarcinoma], SKCM[Skin Cutaneous Melanoma], STAD[Stomach adenocarcinoma], THCA[Thyroid carcinoma], UCEC[Uterine Corpus Endometrial Carcinoma] |
| Top |
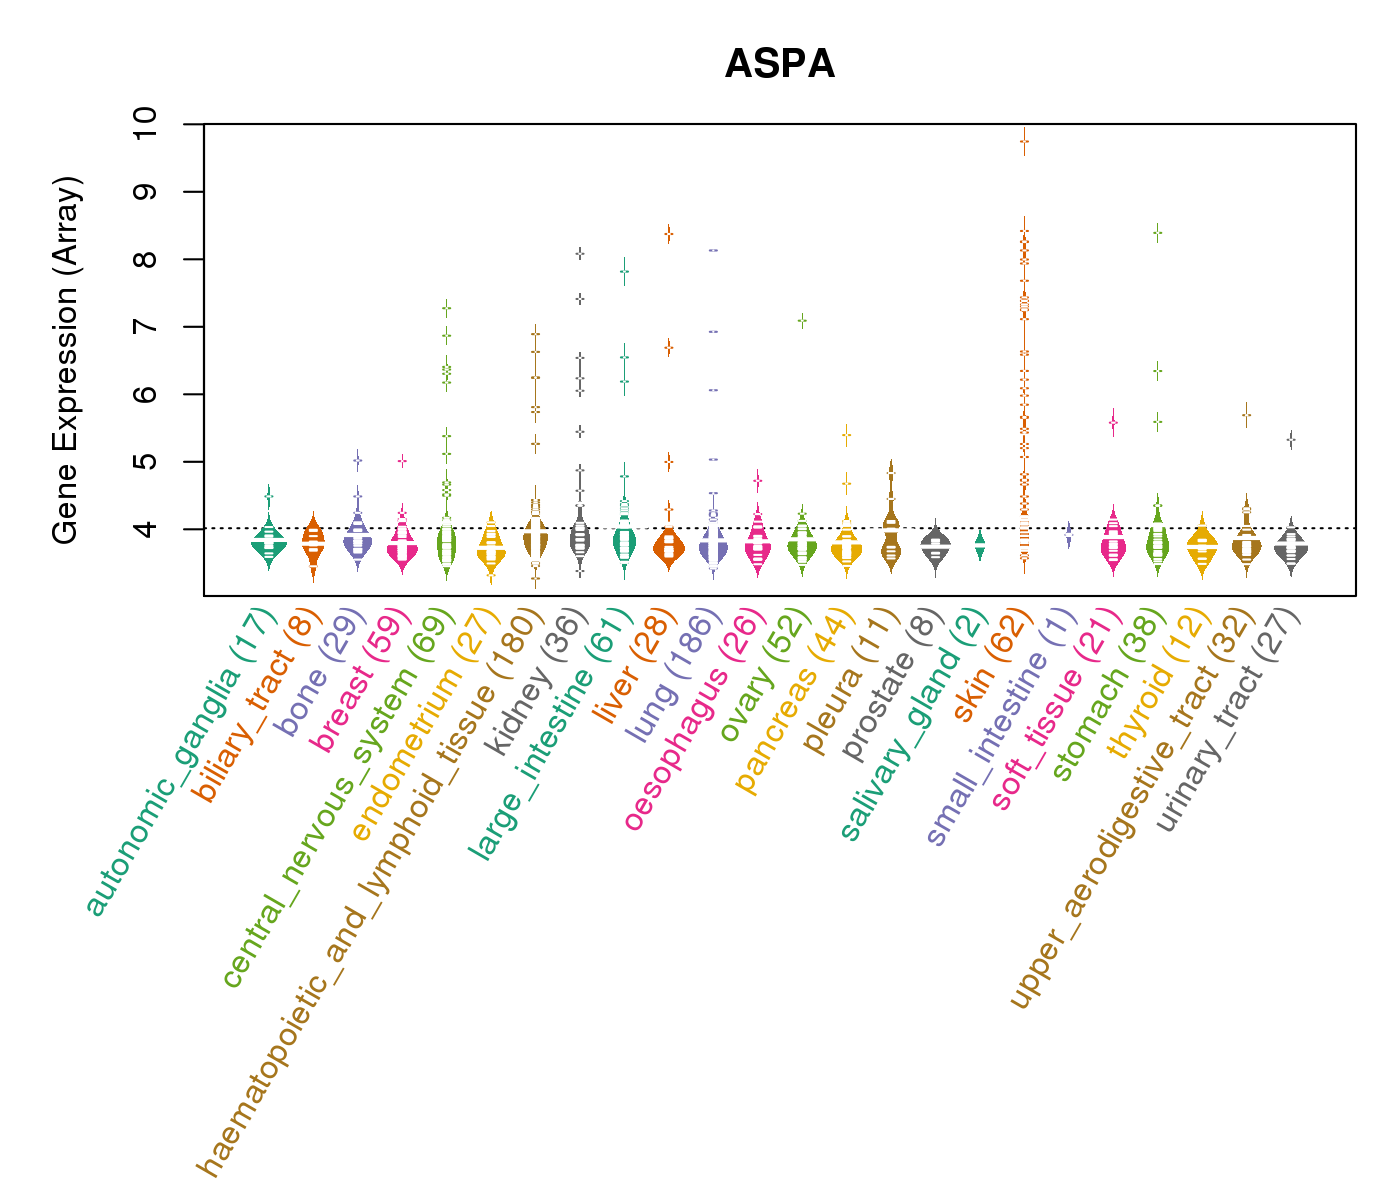
| Gene Expression for ASPA |
| * CCLE gene expression data were extracted from CCLE_Expression_Entrez_2012-10-18.res: Gene-centric RMA-normalized mRNA expression data. |
 |
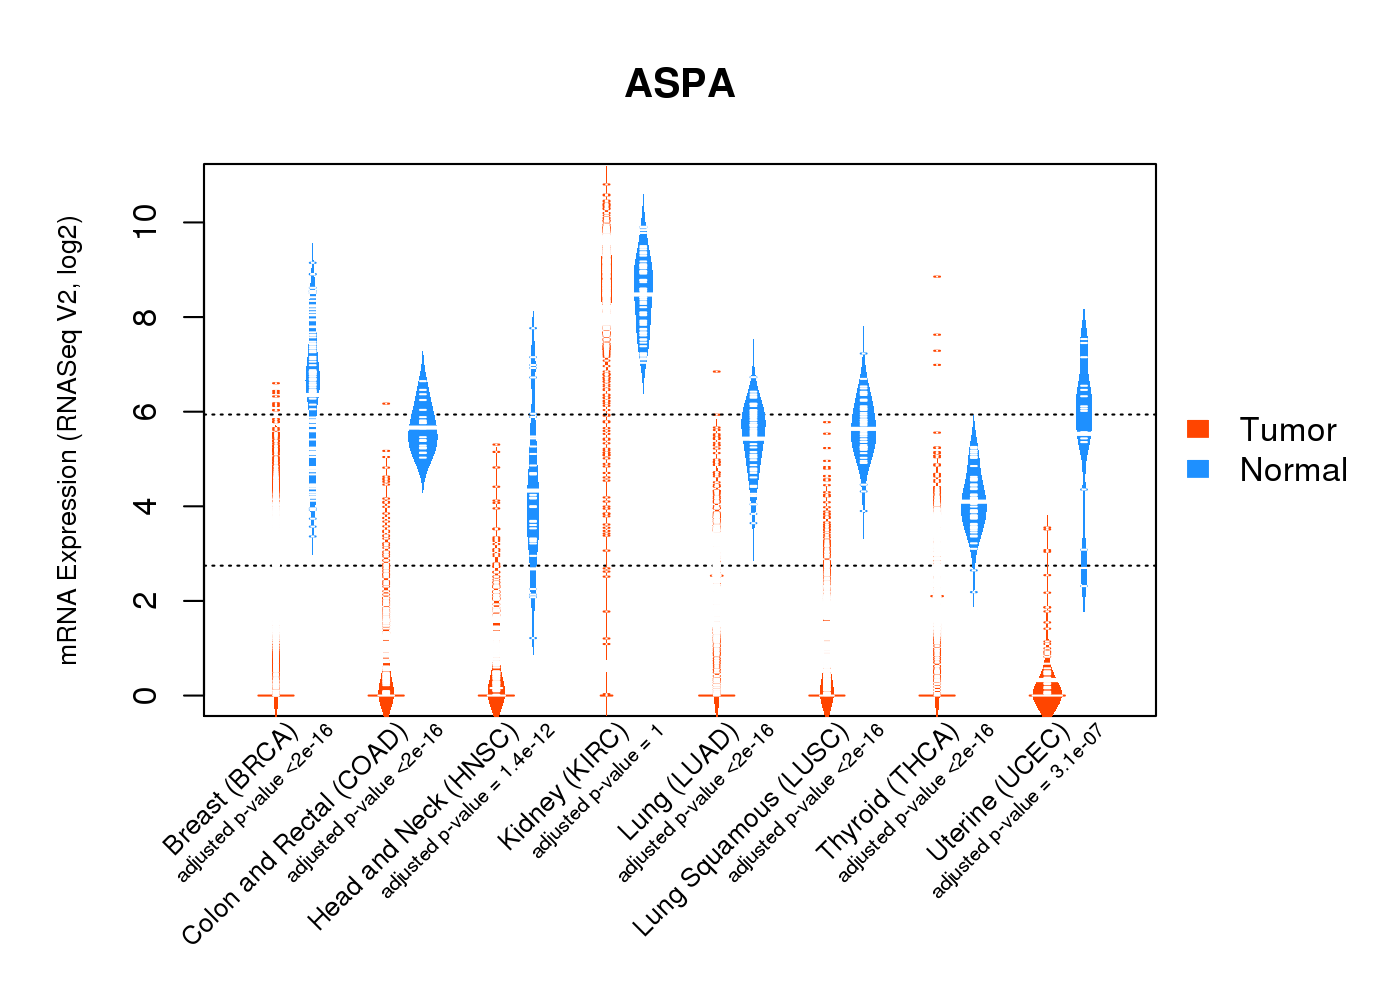
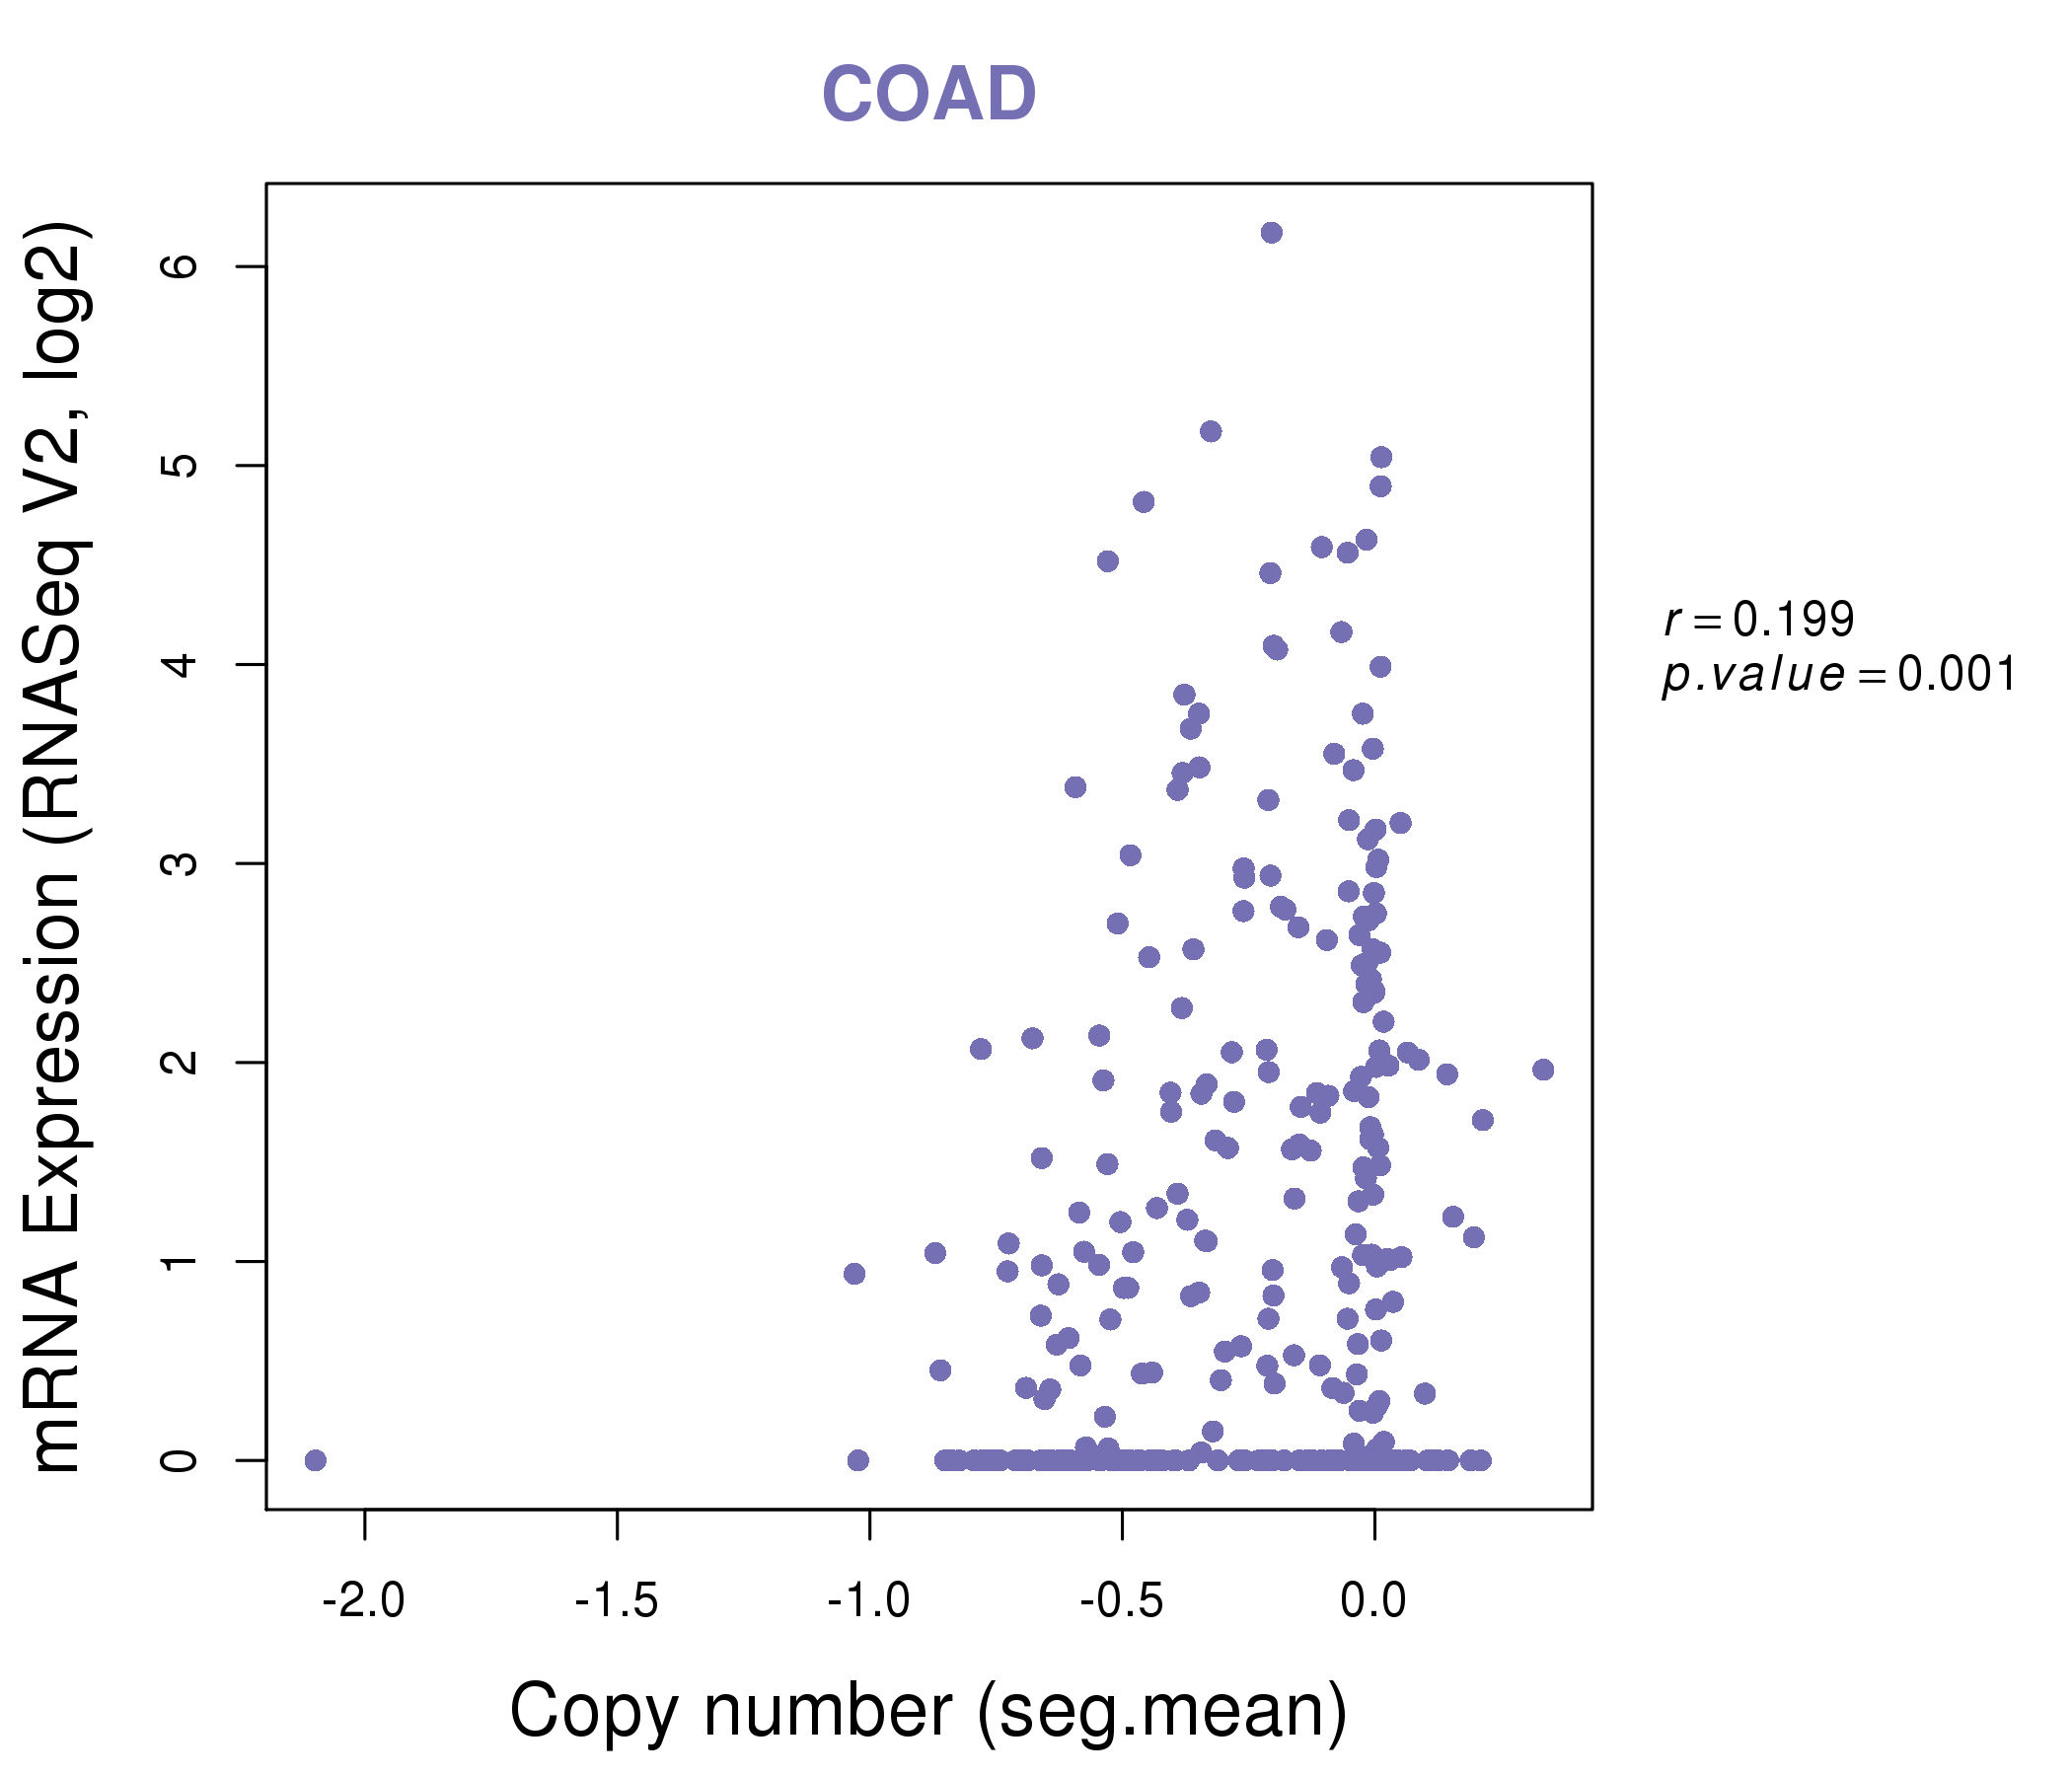
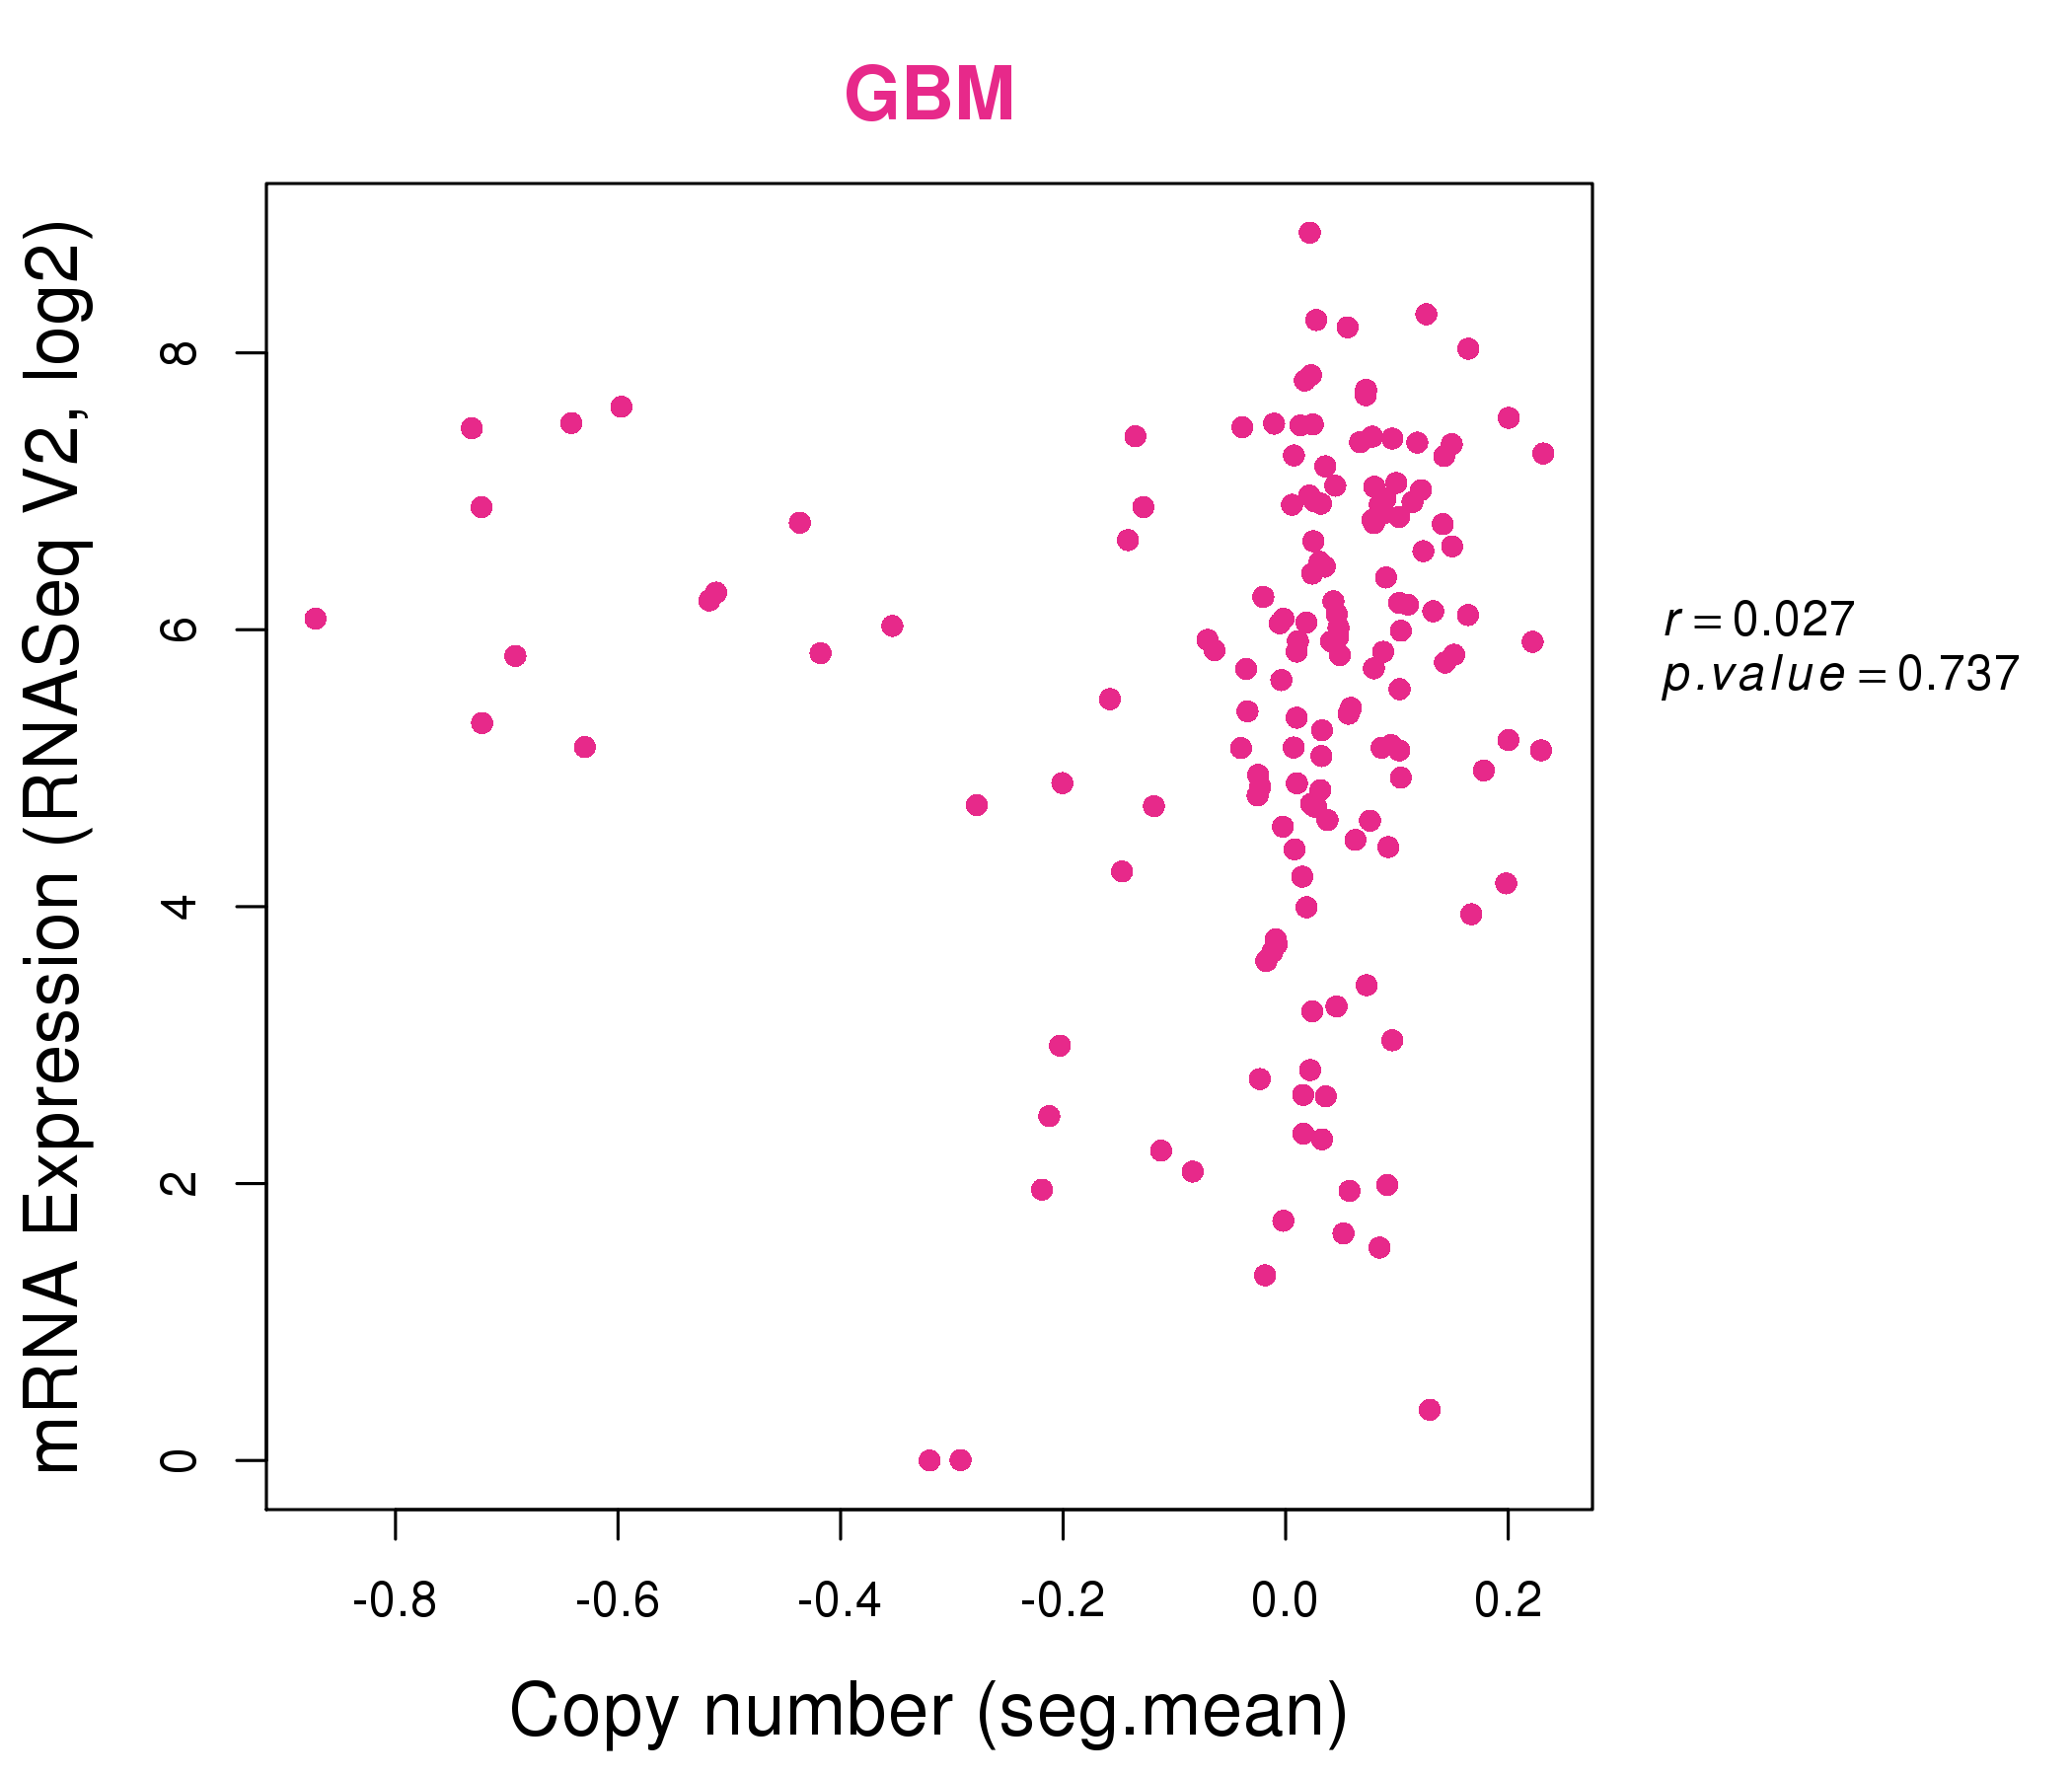
| * Normalized gene expression data of RNASeqV2 was extracted from TCGA using R package TCGA-Assembler. The URLs of all public data files on TCGA DCC data server were gathered at Jan-05-2015. Only eight cancer types have enough normal control samples for differential expression analysis. (t test, adjusted p<0.05 (using Benjamini-Hochberg FDR)) |
 |
| Top |
| * This plots show the correlation between CNV and gene expression. |
: Open all plots for all cancer types
 |
|
 |
|

| Top |
| Gene-Gene Network Information |
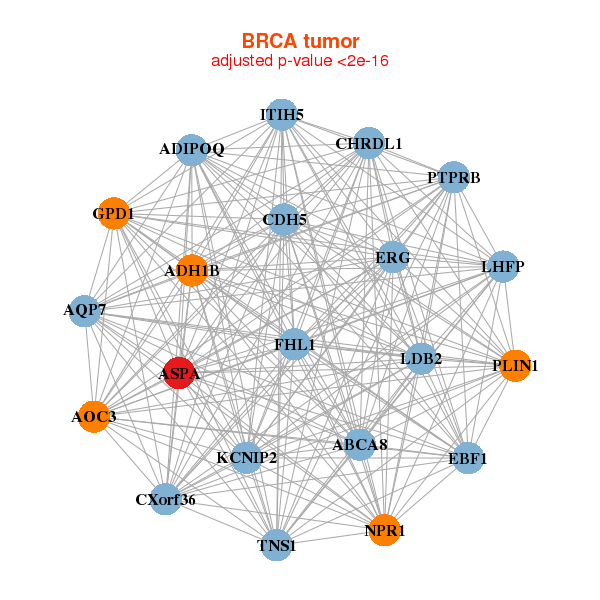
| * Co-Expression network figures were drawn using R package igraph. Only the top 20 genes with the highest correlations were shown. Red circle: input gene, orange circle: cell metabolism gene, sky circle: other gene |
: Open all plots for all cancer types
 |
| ||||
| ABCA8,ADH1B,ADIPOQ,AOC3,AQP7,ASPA,CDH5, CHRDL1,CXorf36,EBF1,ERG,FHL1,GPD1,ITIH5, KCNIP2,LDB2,LHFP,NPR1,PLIN1,PTPRB,TNS1 | ABCC9,ANKRD40,APOL6,ARHGEF7,ASPA,DIAPH2,DMGDH, RMDN1,HSDL2,MAP7D3,NRP1,PALMD,PPP2R1B,SEC23A, SH3GLB1,SORT1,TSPAN3,TTC7B,UGP2,YWHAG,ZEB1 | ||||
 |
| ||||
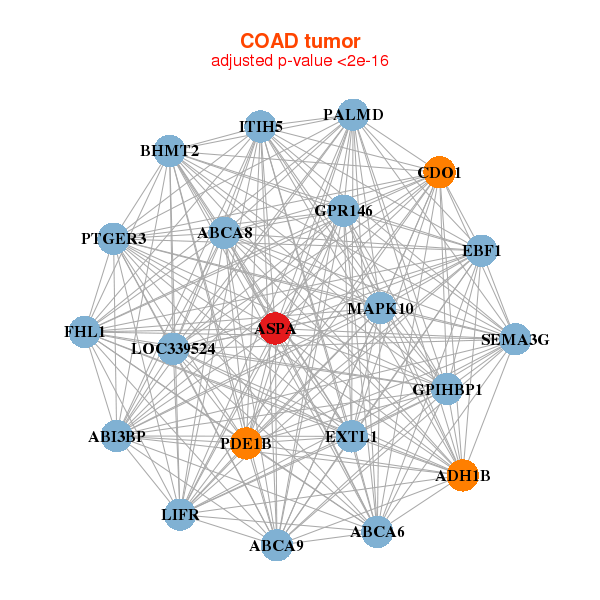
| ABCA6,ABCA8,ABCA9,ABI3BP,ADH1B,ASPA,BHMT2, CDO1,EBF1,EXTL1,FHL1,GPIHBP1,GPR146,ITIH5, LIFR,LOC339524,MAPK10,PALMD,PDE1B,PTGER3,SEMA3G | AIG1,ARHGDIG,ASPA,CYBRD1,DEFA5,DEFA6,DFNA5, GATA5,HOXC8,HOXC9,KHK,LRAT,MRO,OAT, OTC,PHYHIPL,PRSS1,REG3A,RHOBTB2,SFRP5,PRSS3P2 |
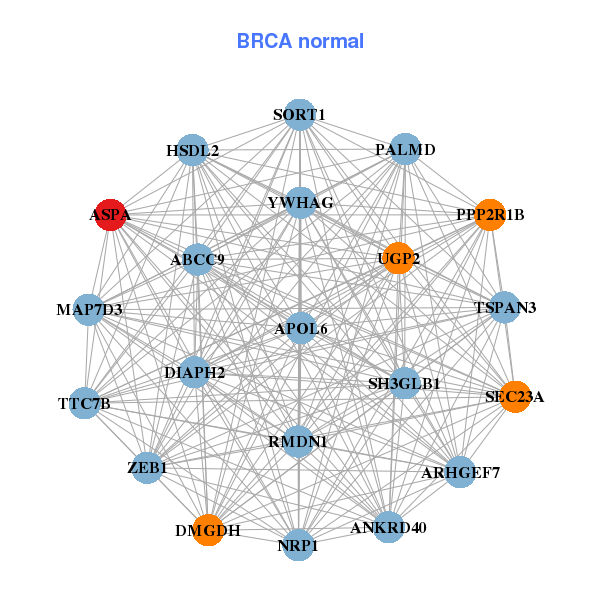
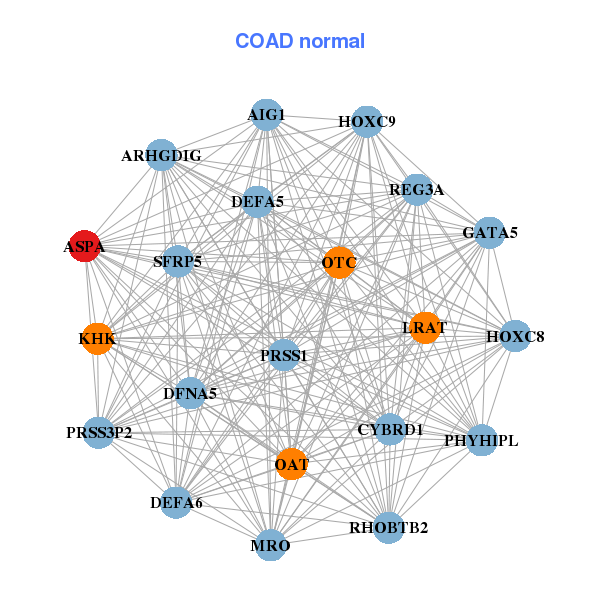
| * Co-Expression network figures were drawn using R package igraph. Only the top 20 genes with the highest correlations were shown. Red circle: input gene, orange circle: cell metabolism gene, sky circle: other gene |
: Open all plots for all cancer types
| Top |
: Open all interacting genes' information including KEGG pathway for all interacting genes from DAVID
| Top |
| Pharmacological Information for ASPA |
| DB Category | DB Name | DB's ID and Url link |
| Organism-specific databases | PharmGKB | PA25055; -. |
| Organism-specific databases | CTD | 443; -. |
| * Gene Centered Interaction Network. |
 |
| * Drug Centered Interaction Network. |
| DrugBank ID | Target Name | Drug Groups | Generic Name | Drug Centered Network | Drug Structure |
| DB00128 | aspartoacylase | approved; nutraceutical | L-Aspartic Acid | 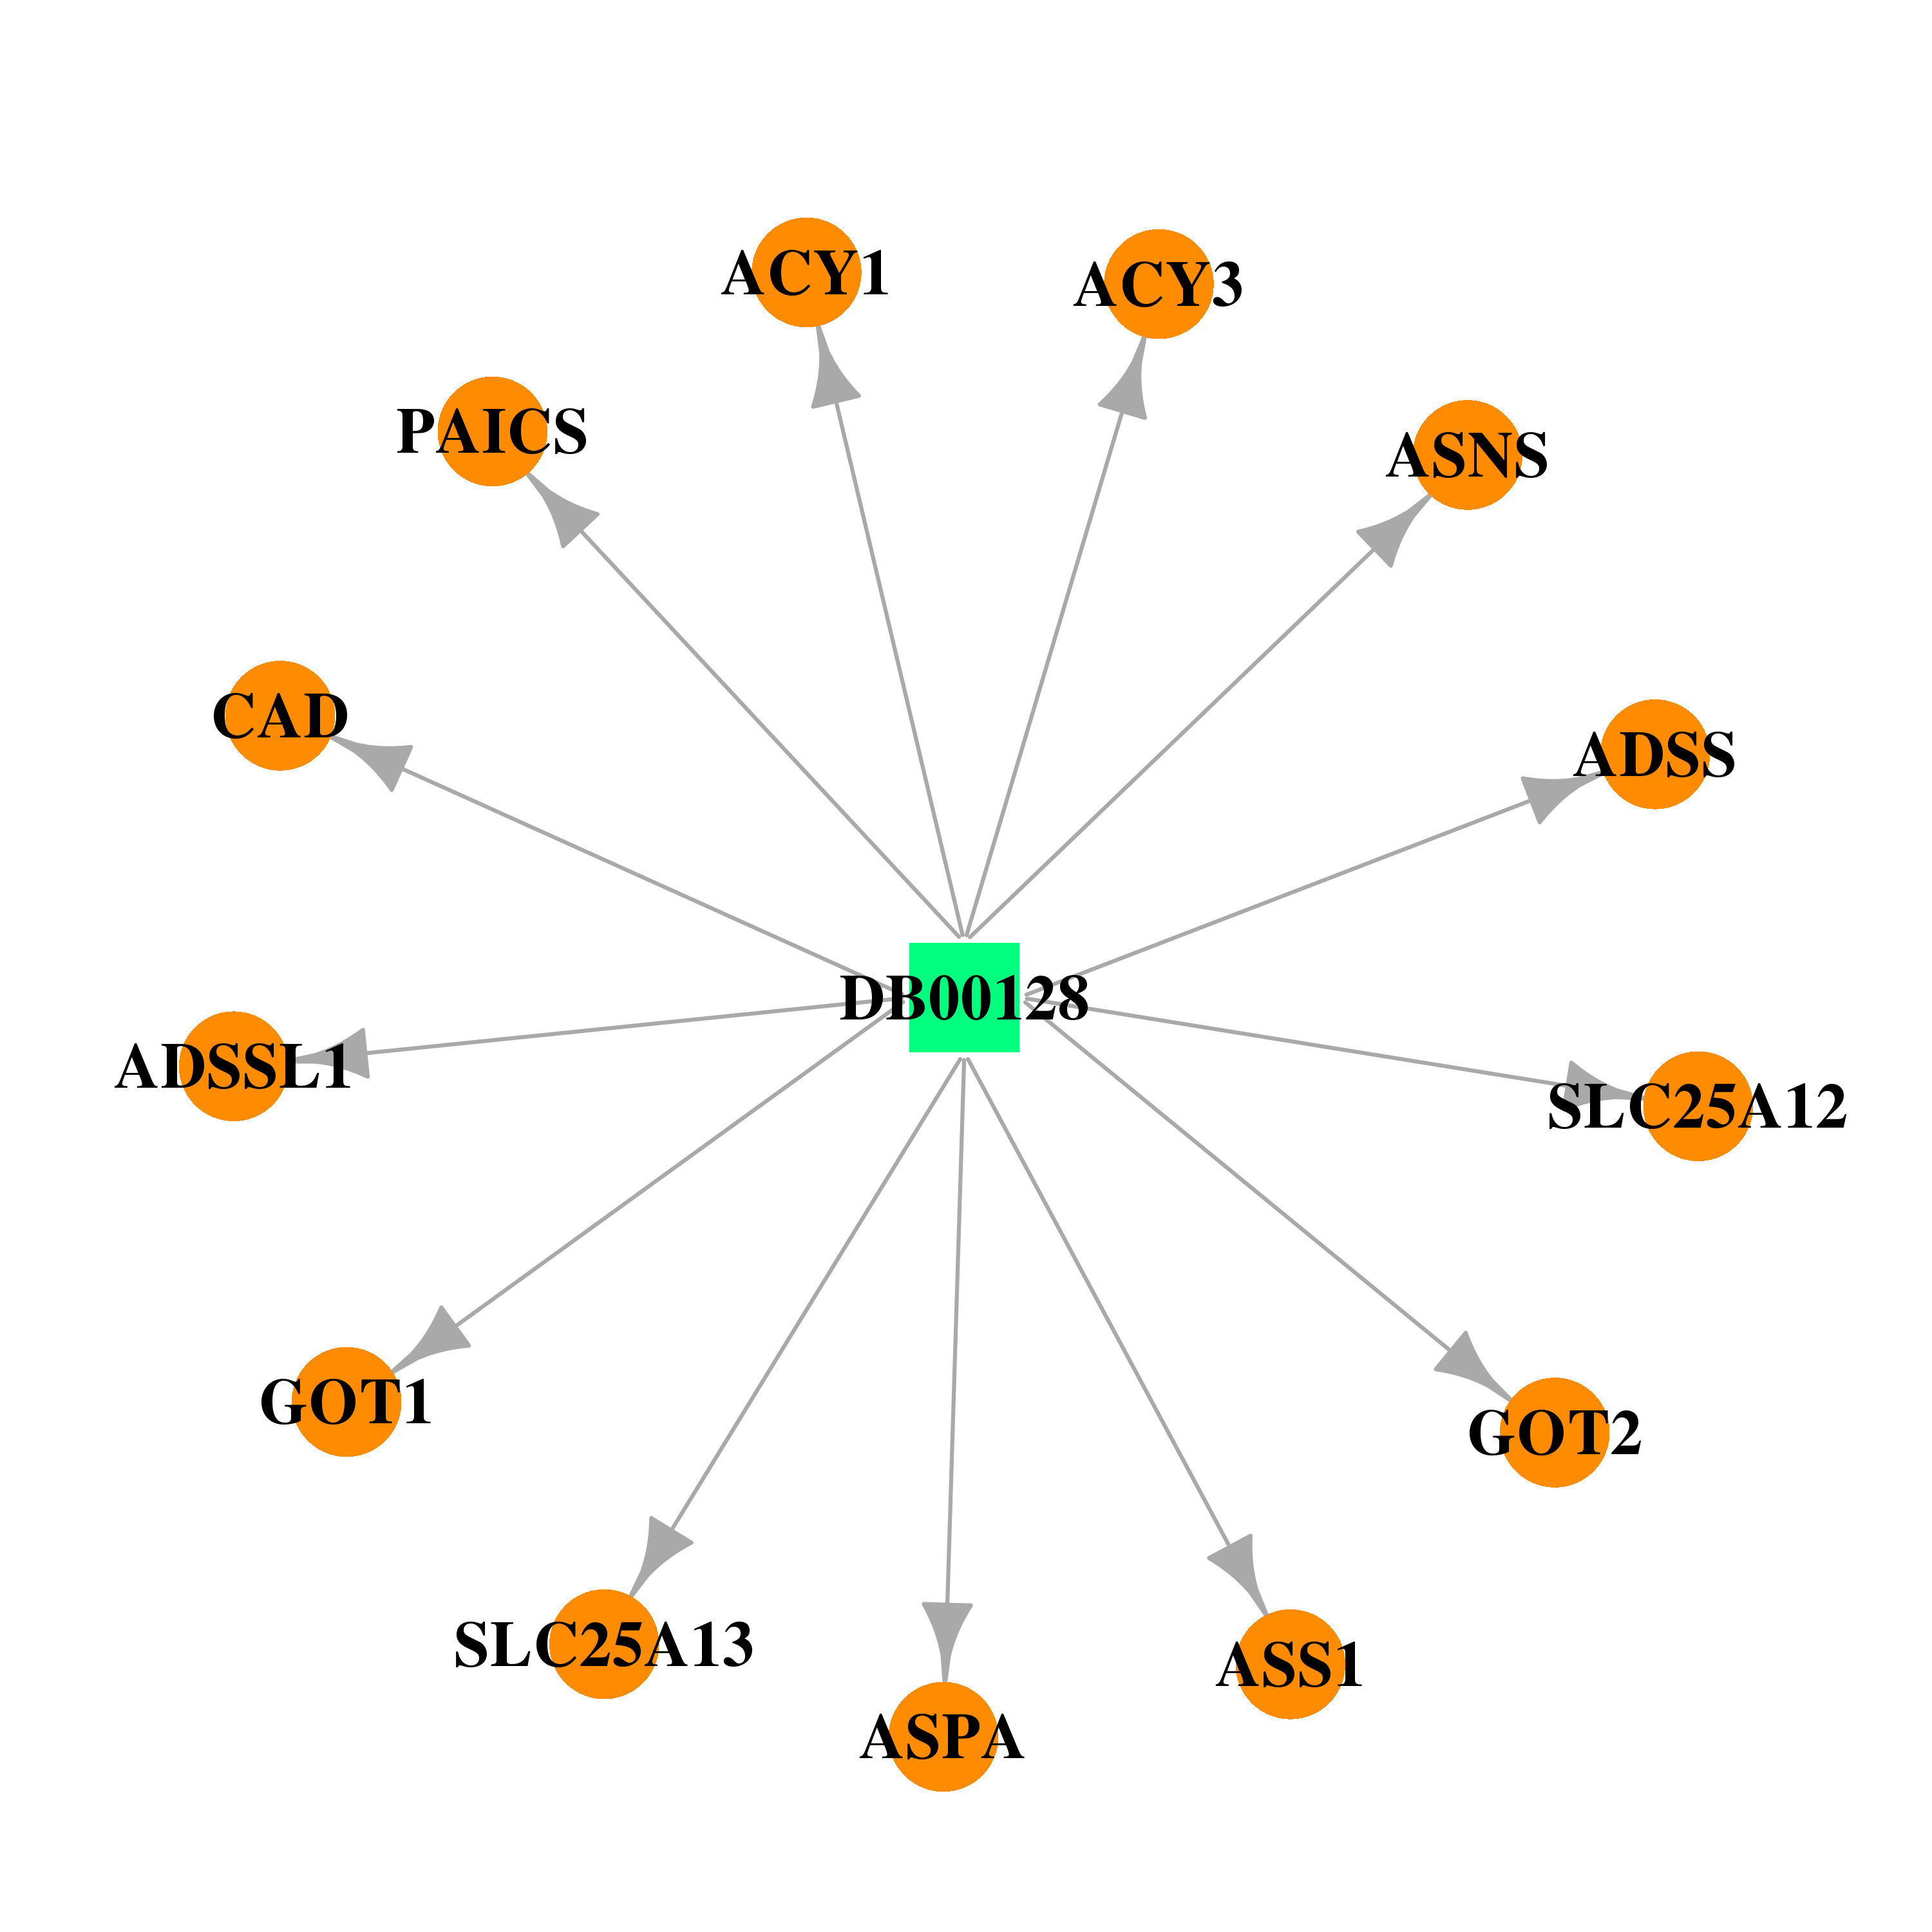 | 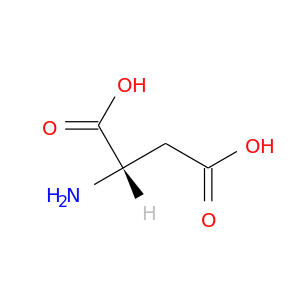 |
| Top |
| Cross referenced IDs for ASPA |
| * We obtained these cross-references from Uniprot database. It covers 150 different DBs, 18 categories. http://www.uniprot.org/help/cross_references_section |
: Open all cross reference information
|
Copyright © 2016-Present - The Univsersity of Texas Health Science Center at Houston @ |