|
|||||||||||||||||||||||||||||||||||||||||||||||||||||||||||||||||||||||||||||||||||||||||||||||||||||||||||||||||||||||||||||||||||||||||||||||||||||||||||||||||||||||||||||||||||||||||||||||||||||||||||||||||||||||||||||||||||||||||||||||||||||||||||||||||||||||||||||||||||||||||||||||||||||||||||||||||||||||||||||||||||||||||||||||||||||||||||||||||||||||||||||||||||||||||||||
| |
| Phenotypic Information (metabolism pathway, cancer, disease, phenome) |
| |
| |
| Gene-Gene Network Information: Co-Expression Network, Interacting Genes & KEGG |
| |
|


| Gene Summary for ASS1 |
| Top |
| Phenotypic Information for ASS1(metabolism pathway, cancer, disease, phenome) |
| Cancer | CGAP: ASS1 |
| Familial Cancer Database: ASS1 | |
| * This gene is included in those cancer gene databases. |
|
|
|
|
|
| . | |||||||||||||||||||||||||||||||||||||||||||||||||||||||||||||||||||||||||||||||||||||||||||||||||||||||||||||||||||||||||||||||||||||||||||||||||||||||||||||||||||||||||||||||||||||||||||||||||||||||||||||||||||||||||||||||||||||||||||||||||||||||||||||||||||||||||||||||||||||||||||||||||||||||||||||||||||||||||||||||||||||||||||||||||||||||||||||||||||||||||||||||||||||||
Oncogene 1 | Significant driver gene in | ||||||||||||||||||||||||||||||||||||||||||||||||||||||||||||||||||||||||||||||||||||||||||||||||||||||||||||||||||||||||||||||||||||||||||||||||||||||||||||||||||||||||||||||||||||||||||||||||||||||||||||||||||||||||||||||||||||||||||||||||||||||||||||||||||||||||||||||||||||||||||||||||||||||||||||||||||||||||||||||||||||||||||||||||||||||||||||||||||||||||||||||||||||||||||||
| cf) number; DB name 1 Oncogene; http://nar.oxfordjournals.org/content/35/suppl_1/D721.long, 2 Tumor Suppressor gene; https://bioinfo.uth.edu/TSGene/, 3 Cancer Gene Census; http://www.nature.com/nrc/journal/v4/n3/abs/nrc1299.html, 4 CancerGenes; http://nar.oxfordjournals.org/content/35/suppl_1/D721.long, 5 Network of Cancer Gene; http://ncg.kcl.ac.uk/index.php, 1Therapeutic Vulnerabilities in Cancer; http://cbio.mskcc.org/cancergenomics/statius/ |
| KEGG_ALANINE_ASPARTATE_AND_GLUTAMATE_METABOLISM KEGG_ARGININE_AND_PROLINE_METABOLISM REACTOME_METABOLISM_OF_AMINO_ACIDS_AND_DERIVATIVES | |
| OMIM | |
| Orphanet | |
| Disease | KEGG Disease: ASS1 |
| MedGen: ASS1 (Human Medical Genetics with Condition) | |
| ClinVar: ASS1 | |
| Phenotype | MGI: ASS1 (International Mouse Phenotyping Consortium) |
| PhenomicDB: ASS1 | |
| Mutations for ASS1 |
| * Under tables are showing count per each tissue to give us broad intuition about tissue specific mutation patterns.You can go to the detailed page for each mutation database's web site. |
| - Statistics for Tissue and Mutation type | Top |
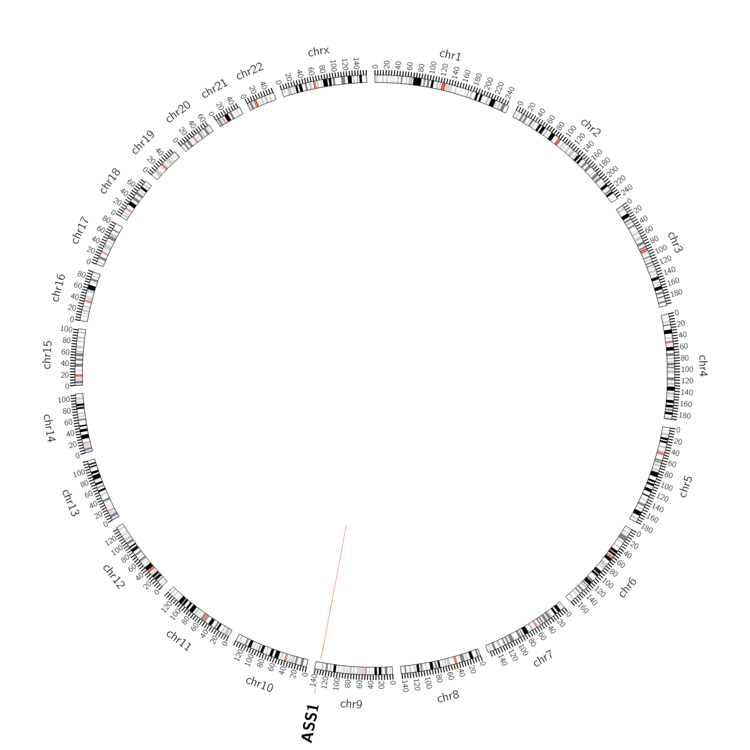 |
| - For Inter-chromosomal Variations |
| There's no inter-chromosomal structural variation. |
| - For Intra-chromosomal Variations |
| * Intra-chromosomal variantions includes 'intrachromosomal amplicon to amplicon', 'intrachromosomal amplicon to non-amplified dna', 'intrachromosomal deletion', 'intrachromosomal fold-back inversion', 'intrachromosomal inversion', 'intrachromosomal tandem duplication', 'Intrachromosomal unknown type', 'intrachromosomal with inverted orientation', 'intrachromosomal with non-inverted orientation'. |
 |
| Sample | Symbol_a | Chr_a | Start_a | End_a | Symbol_b | Chr_b | Start_b | End_b |
| ovary | ASS1 | chr9 | 133346886 | 133346906 | ASS1 | chr9 | 133329317 | 133329337 |
| pancreas | ASS1 | chr9 | 133370913 | 133370933 | ASS1 | chr9 | 133373445 | 133373465 |
| cf) Tissue number; Tissue name (1;Breast, 2;Central_nervous_system, 3;Haematopoietic_and_lymphoid_tissue, 4;Large_intestine, 5;Liver, 6;Lung, 7;Ovary, 8;Pancreas, 9;Prostate, 10;Skin, 11;Soft_tissue, 12;Upper_aerodigestive_tract) |
| * From mRNA Sanger sequences, Chitars2.0 arranged chimeric transcripts. This table shows ASS1 related fusion information. |
| ID | Head Gene | Tail Gene | Accession | Gene_a | qStart_a | qEnd_a | Chromosome_a | tStart_a | tEnd_a | Gene_a | qStart_a | qEnd_a | Chromosome_a | tStart_a | tEnd_a |
| Top |
| Mutation type/ Tissue ID | brca | cns | cerv | endome | haematopo | kidn | Lintest | liver | lung | ns | ovary | pancre | prost | skin | stoma | thyro | urina | |||
| Total # sample | 1 | 1 | ||||||||||||||||||
| GAIN (# sample) | 1 | |||||||||||||||||||
| LOSS (# sample) | 1 |
| cf) Tissue ID; Tissue type (1; Breast, 2; Central_nervous_system, 3; Cervix, 4; Endometrium, 5; Haematopoietic_and_lymphoid_tissue, 6; Kidney, 7; Large_intestine, 8; Liver, 9; Lung, 10; NS, 11; Ovary, 12; Pancreas, 13; Prostate, 14; Skin, 15; Stomach, 16; Thyroid, 17; Urinary_tract) |
| Top |
|
 |
| Top |
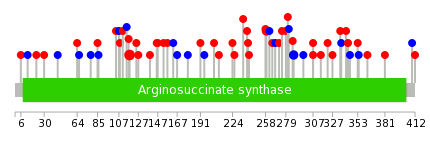
| Stat. for Non-Synonymous SNVs (# total SNVs=28) | (# total SNVs=13) |
 |  |
(# total SNVs=0) | (# total SNVs=0) |
| Top |
| * When you move the cursor on each content, you can see more deailed mutation information on the Tooltip. Those are primary_site,primary_histology,mutation(aa),pubmedID. |
| GRCh37 position | Mutation(aa) | Unique sampleID count |
| chr9:133333965-133333965 | p.A118T | 4 |
| chr9:133364742-133364742 | p.G287G | 2 |
| chr9:133355773-133355773 | p.G259S | 2 |
| chr9:133376396-133376396 | p.V409V | 1 |
| chr9:133329718-133329718 | p.F44F | 1 |
| chr9:133355131-133355131 | p.K239N | 1 |
| chr9:133333958-133333958 | p.S115S | 1 |
| chr9:133364724-133364724 | p.I281M | 1 |
| chr9:133370262-133370262 | p.H327Y | 1 |
| chr9:133346226-133346226 | p.H167H | 1 |
| Top |
|
 |
| Point Mutation/ Tissue ID | 1 | 2 | 3 | 4 | 5 | 6 | 7 | 8 | 9 | 10 | 11 | 12 | 13 | 14 | 15 | 16 | 17 | 18 | 19 | 20 |
| # sample | 3 | 1 | 1 | 5 | 2 | 1 | 4 | 4 | 1 | 11 | 8 | 5 | ||||||||
| # mutation | 3 | 1 | 1 | 5 | 2 | 1 | 4 | 4 | 1 | 13 | 8 | 6 | ||||||||
| nonsynonymous SNV | 2 | 1 | 1 | 3 | 1 | 1 | 2 | 4 | 1 | 7 | 8 | 2 | ||||||||
| synonymous SNV | 1 | 2 | 1 | 2 | 6 | 4 |
| cf) Tissue ID; Tissue type (1; BLCA[Bladder Urothelial Carcinoma], 2; BRCA[Breast invasive carcinoma], 3; CESC[Cervical squamous cell carcinoma and endocervical adenocarcinoma], 4; COAD[Colon adenocarcinoma], 5; GBM[Glioblastoma multiforme], 6; Glioma Low Grade, 7; HNSC[Head and Neck squamous cell carcinoma], 8; KICH[Kidney Chromophobe], 9; KIRC[Kidney renal clear cell carcinoma], 10; KIRP[Kidney renal papillary cell carcinoma], 11; LAML[Acute Myeloid Leukemia], 12; LUAD[Lung adenocarcinoma], 13; LUSC[Lung squamous cell carcinoma], 14; OV[Ovarian serous cystadenocarcinoma ], 15; PAAD[Pancreatic adenocarcinoma], 16; PRAD[Prostate adenocarcinoma], 17; SKCM[Skin Cutaneous Melanoma], 18:STAD[Stomach adenocarcinoma], 19:THCA[Thyroid carcinoma], 20:UCEC[Uterine Corpus Endometrial Carcinoma]) |
| Top |
| * We represented just top 10 SNVs. When you move the cursor on each content, you can see more deailed mutation information on the Tooltip. Those are primary_site, primary_histology, mutation(aa), pubmedID. |
| Genomic Position | Mutation(aa) | Unique sampleID count |
| chr9:133333811 | p.I281M,ASS1 | 1 |
| chr9:133364724 | p.R66R,ASS1 | 1 |
| chr9:133339550 | p.Y163Y,ASS1 | 1 |
| chr9:133370371 | p.Y282Y,ASS1 | 1 |
| chr9:133355132 | p.Q78Q,ASS1 | 1 |
| chr9:133333847 | p.L195L,ASS1 | 1 |
| chr9:133364727 | p.A286T,ASS1 | 1 |
| chr9:133342122 | p.D85Y,ASS1 | 1 |
| chr9:133376396 | p.P198S,ASS1 | 1 |
| chr9:133355136 | p.G287G,ASS1 | 1 |
| * Copy number data were extracted from TCGA using R package TCGA-Assembler. The URLs of all public data files on TCGA DCC data server were gathered on Jan-05-2015. Function ProcessCNAData in TCGA-Assembler package was used to obtain gene-level copy number value which is calculated as the average copy number of the genomic region of a gene. |
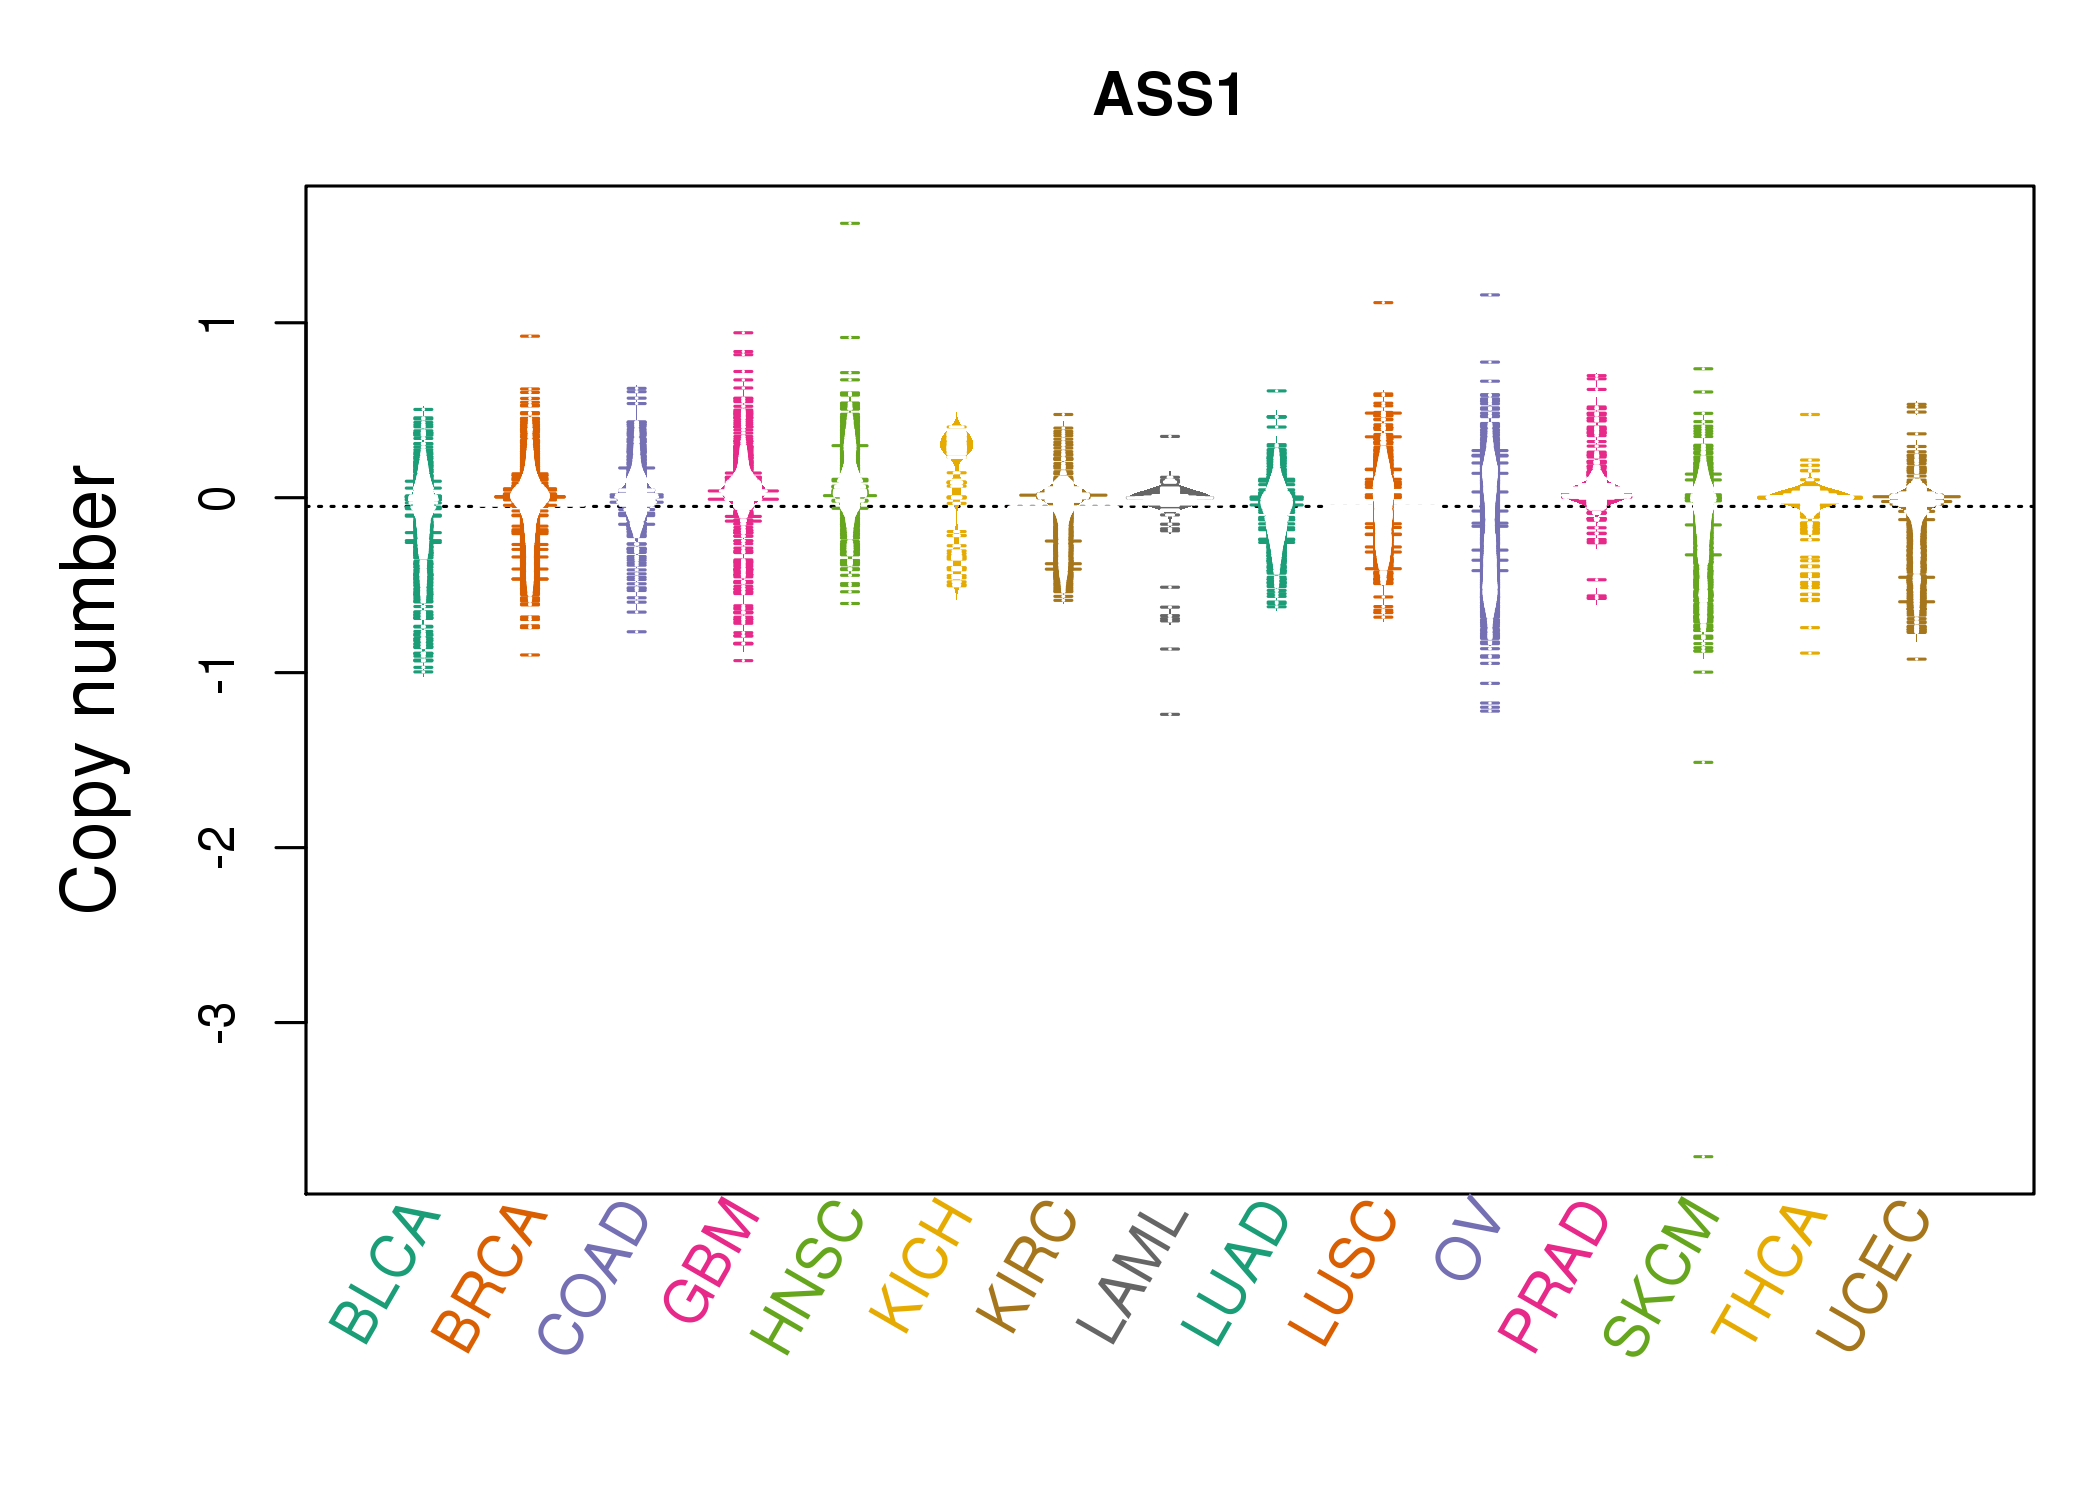 |
| cf) Tissue ID[Tissue type]: BLCA[Bladder Urothelial Carcinoma], BRCA[Breast invasive carcinoma], CESC[Cervical squamous cell carcinoma and endocervical adenocarcinoma], COAD[Colon adenocarcinoma], GBM[Glioblastoma multiforme], Glioma Low Grade, HNSC[Head and Neck squamous cell carcinoma], KICH[Kidney Chromophobe], KIRC[Kidney renal clear cell carcinoma], KIRP[Kidney renal papillary cell carcinoma], LAML[Acute Myeloid Leukemia], LUAD[Lung adenocarcinoma], LUSC[Lung squamous cell carcinoma], OV[Ovarian serous cystadenocarcinoma ], PAAD[Pancreatic adenocarcinoma], PRAD[Prostate adenocarcinoma], SKCM[Skin Cutaneous Melanoma], STAD[Stomach adenocarcinoma], THCA[Thyroid carcinoma], UCEC[Uterine Corpus Endometrial Carcinoma] |
| Top |
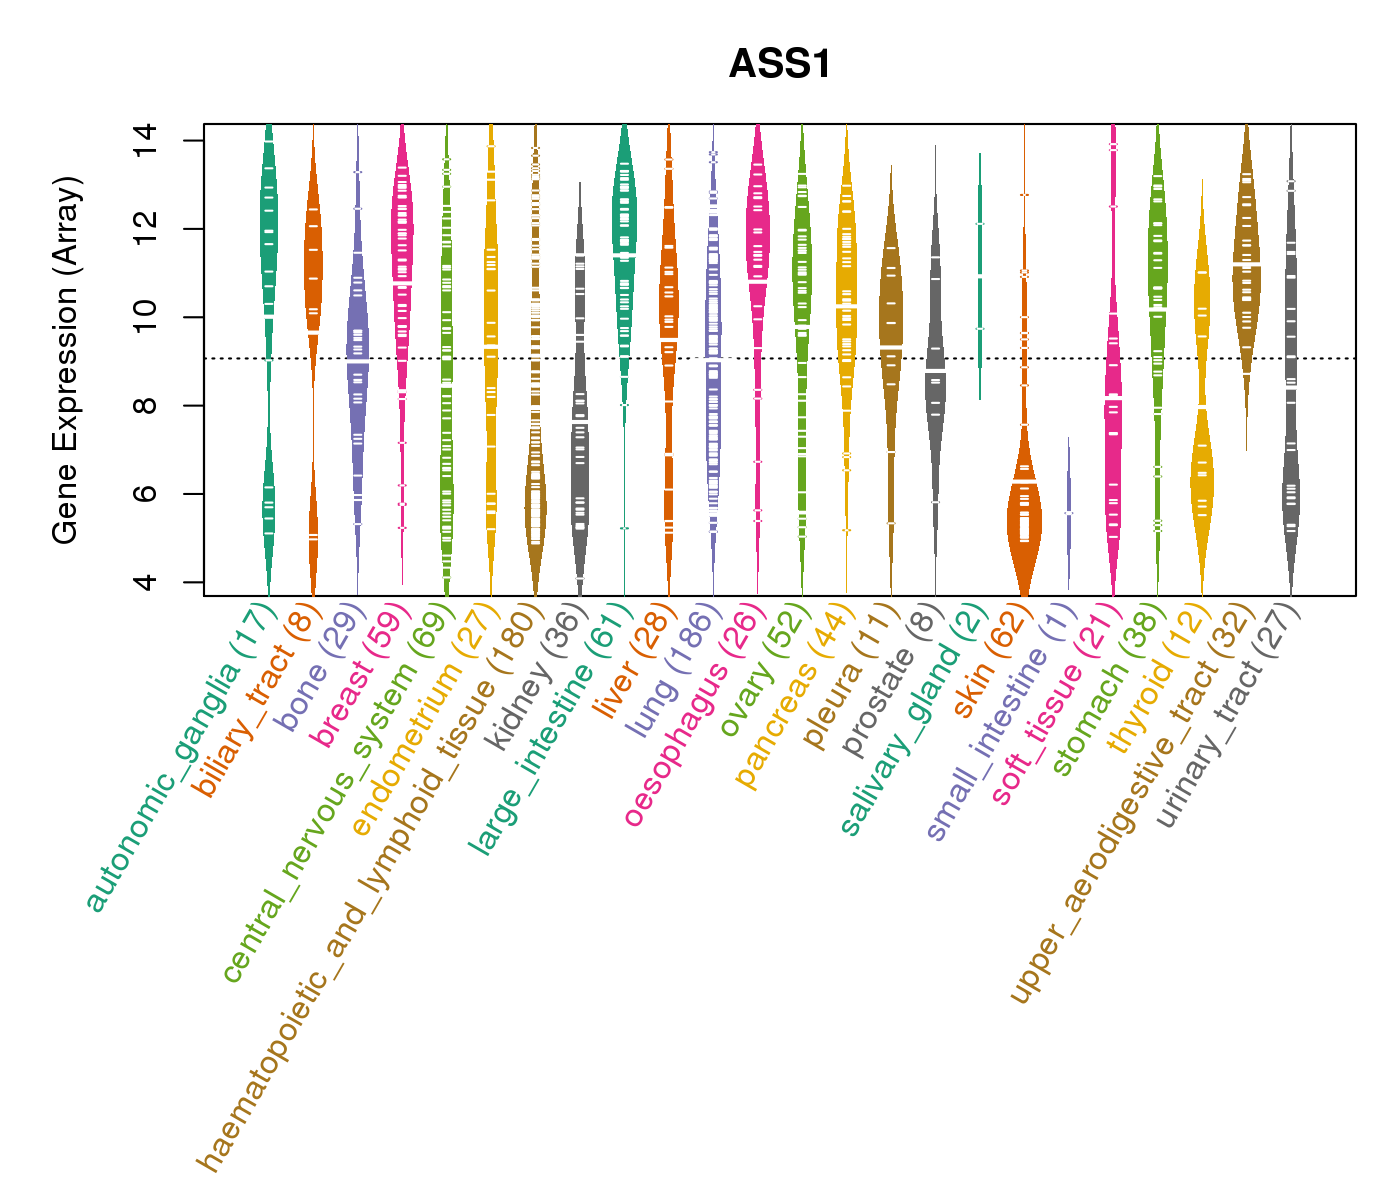
| Gene Expression for ASS1 |
| * CCLE gene expression data were extracted from CCLE_Expression_Entrez_2012-10-18.res: Gene-centric RMA-normalized mRNA expression data. |
 |
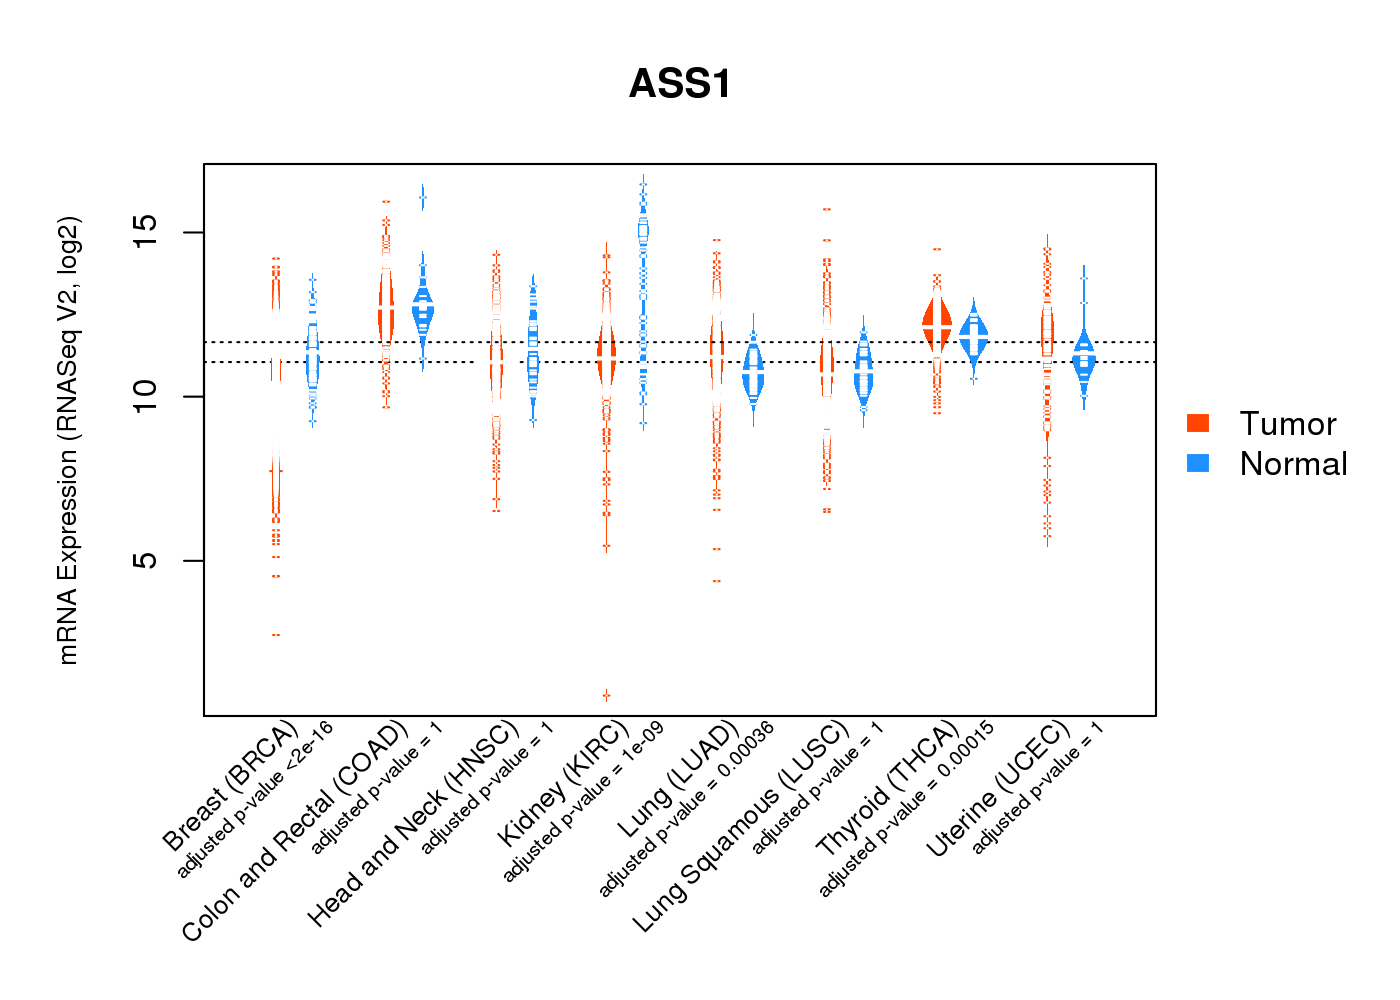
| * Normalized gene expression data of RNASeqV2 was extracted from TCGA using R package TCGA-Assembler. The URLs of all public data files on TCGA DCC data server were gathered at Jan-05-2015. Only eight cancer types have enough normal control samples for differential expression analysis. (t test, adjusted p<0.05 (using Benjamini-Hochberg FDR)) |
 |
| Top |
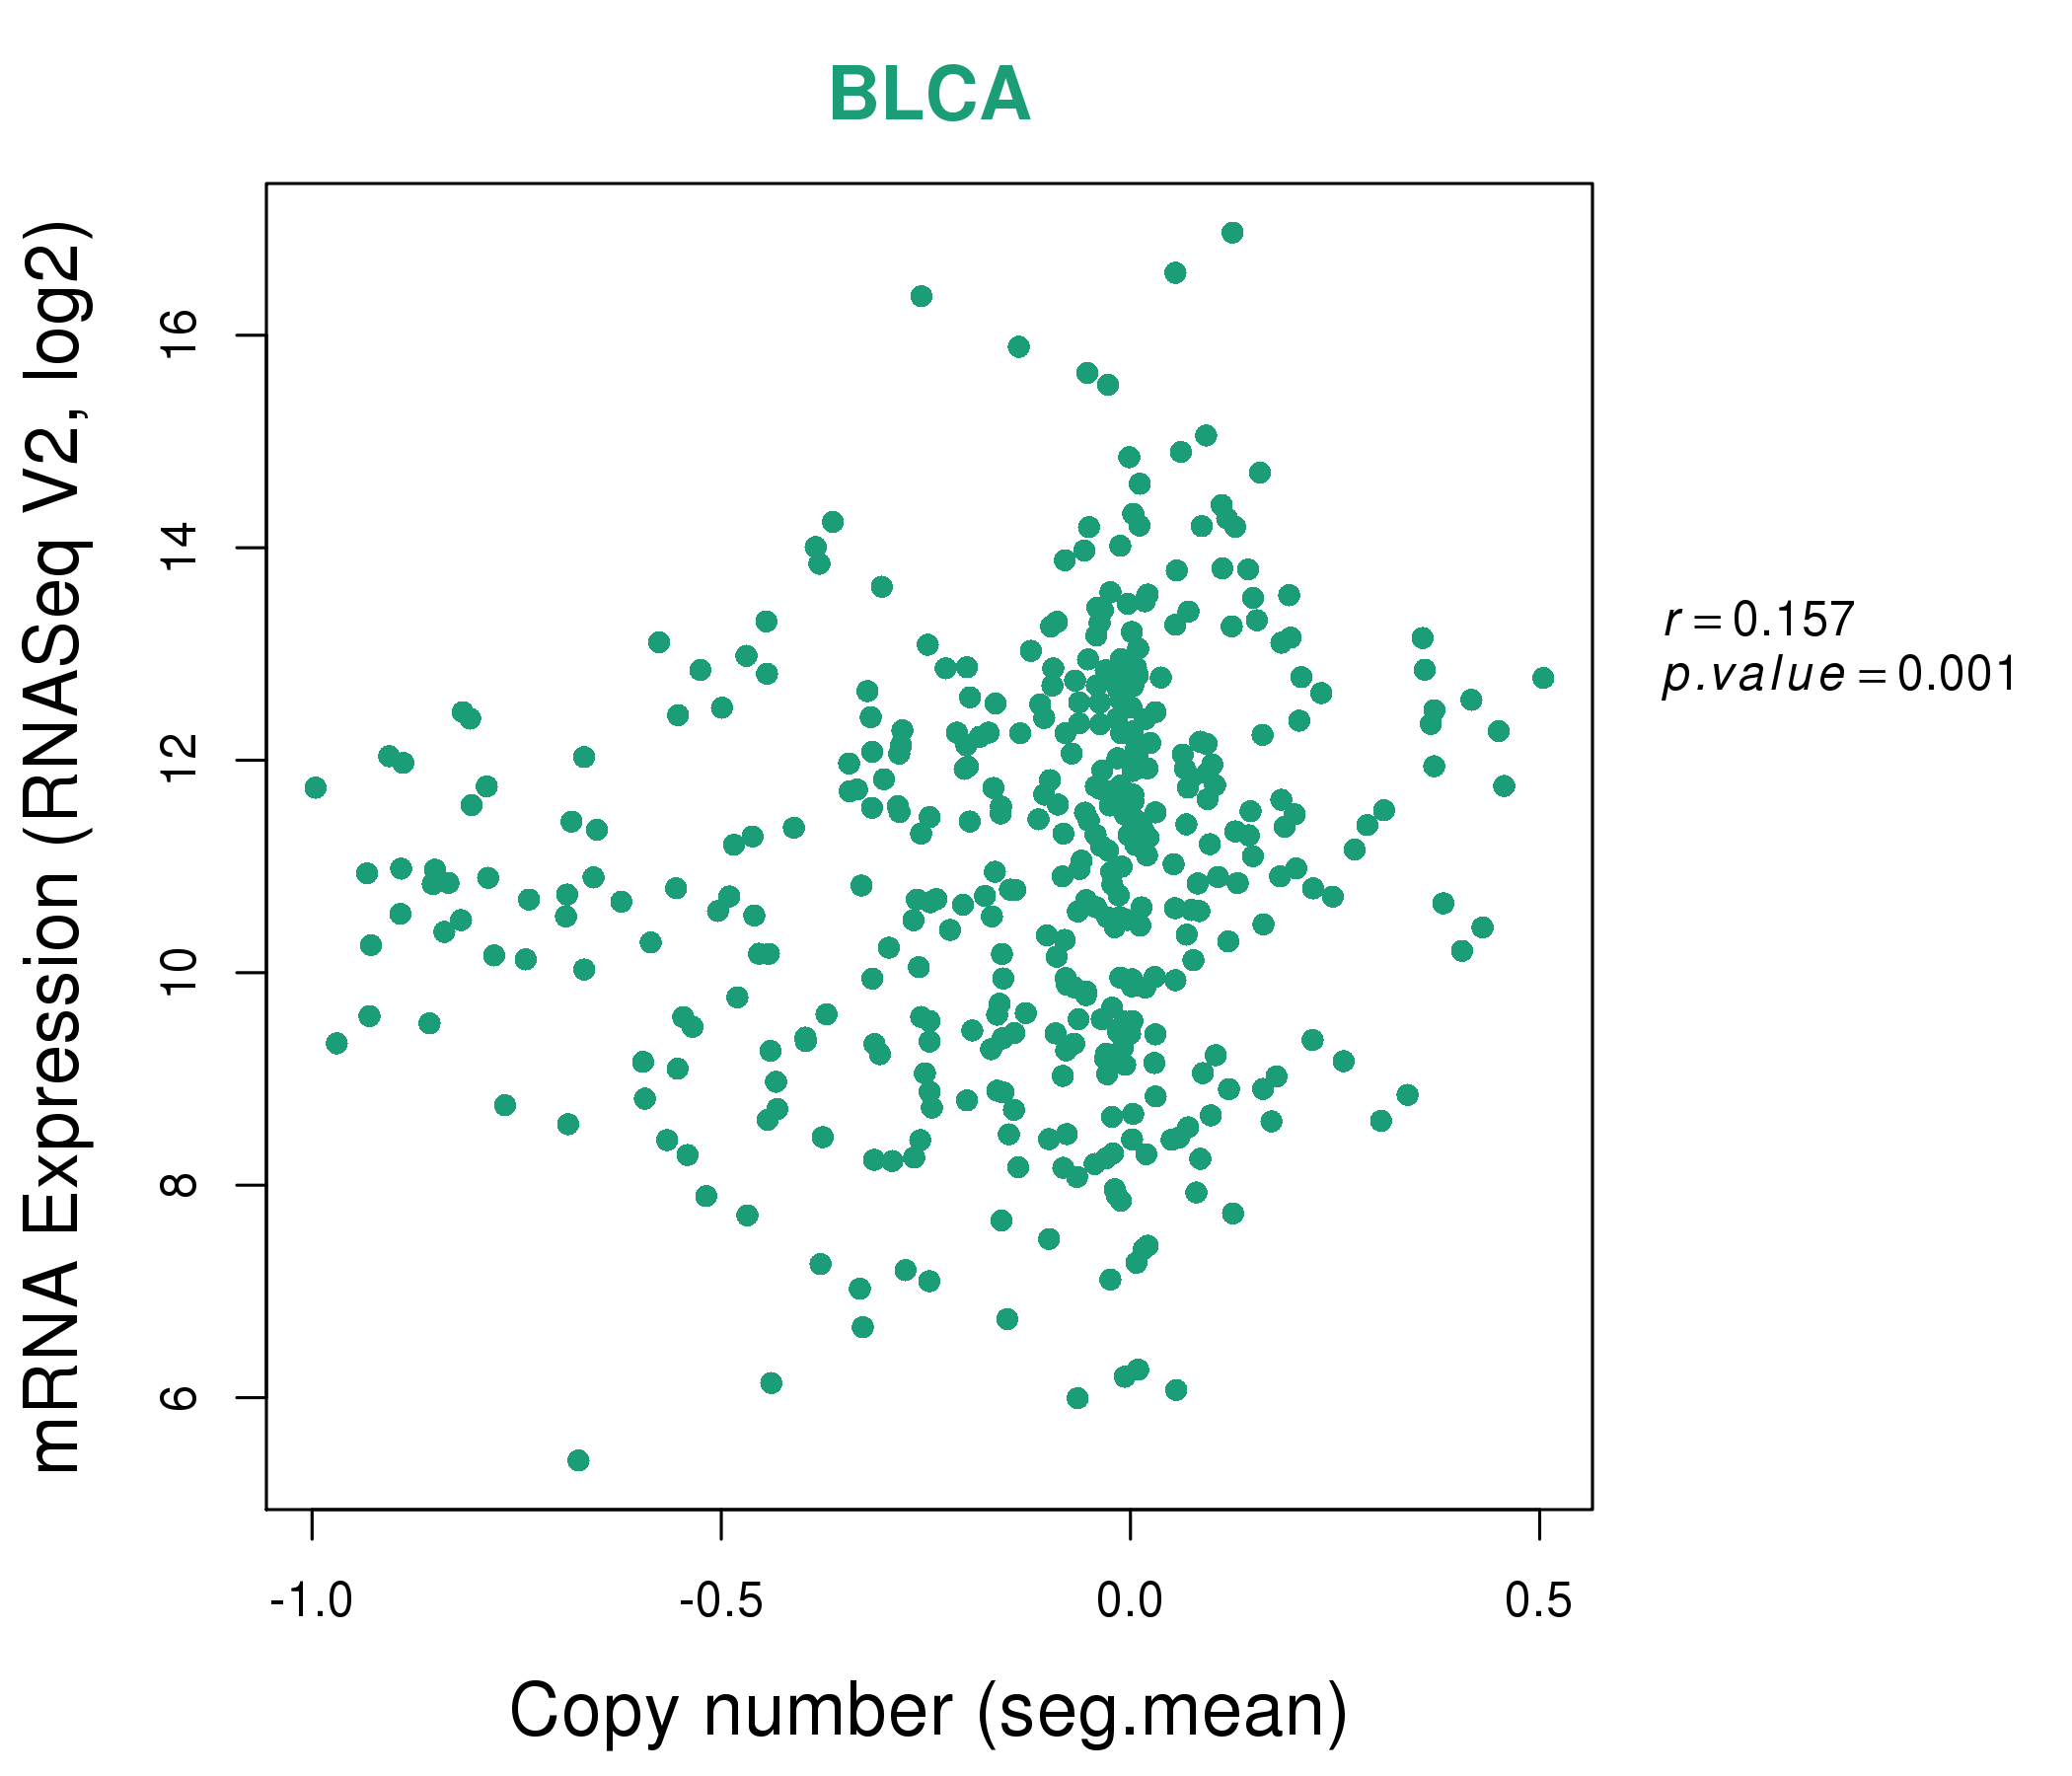
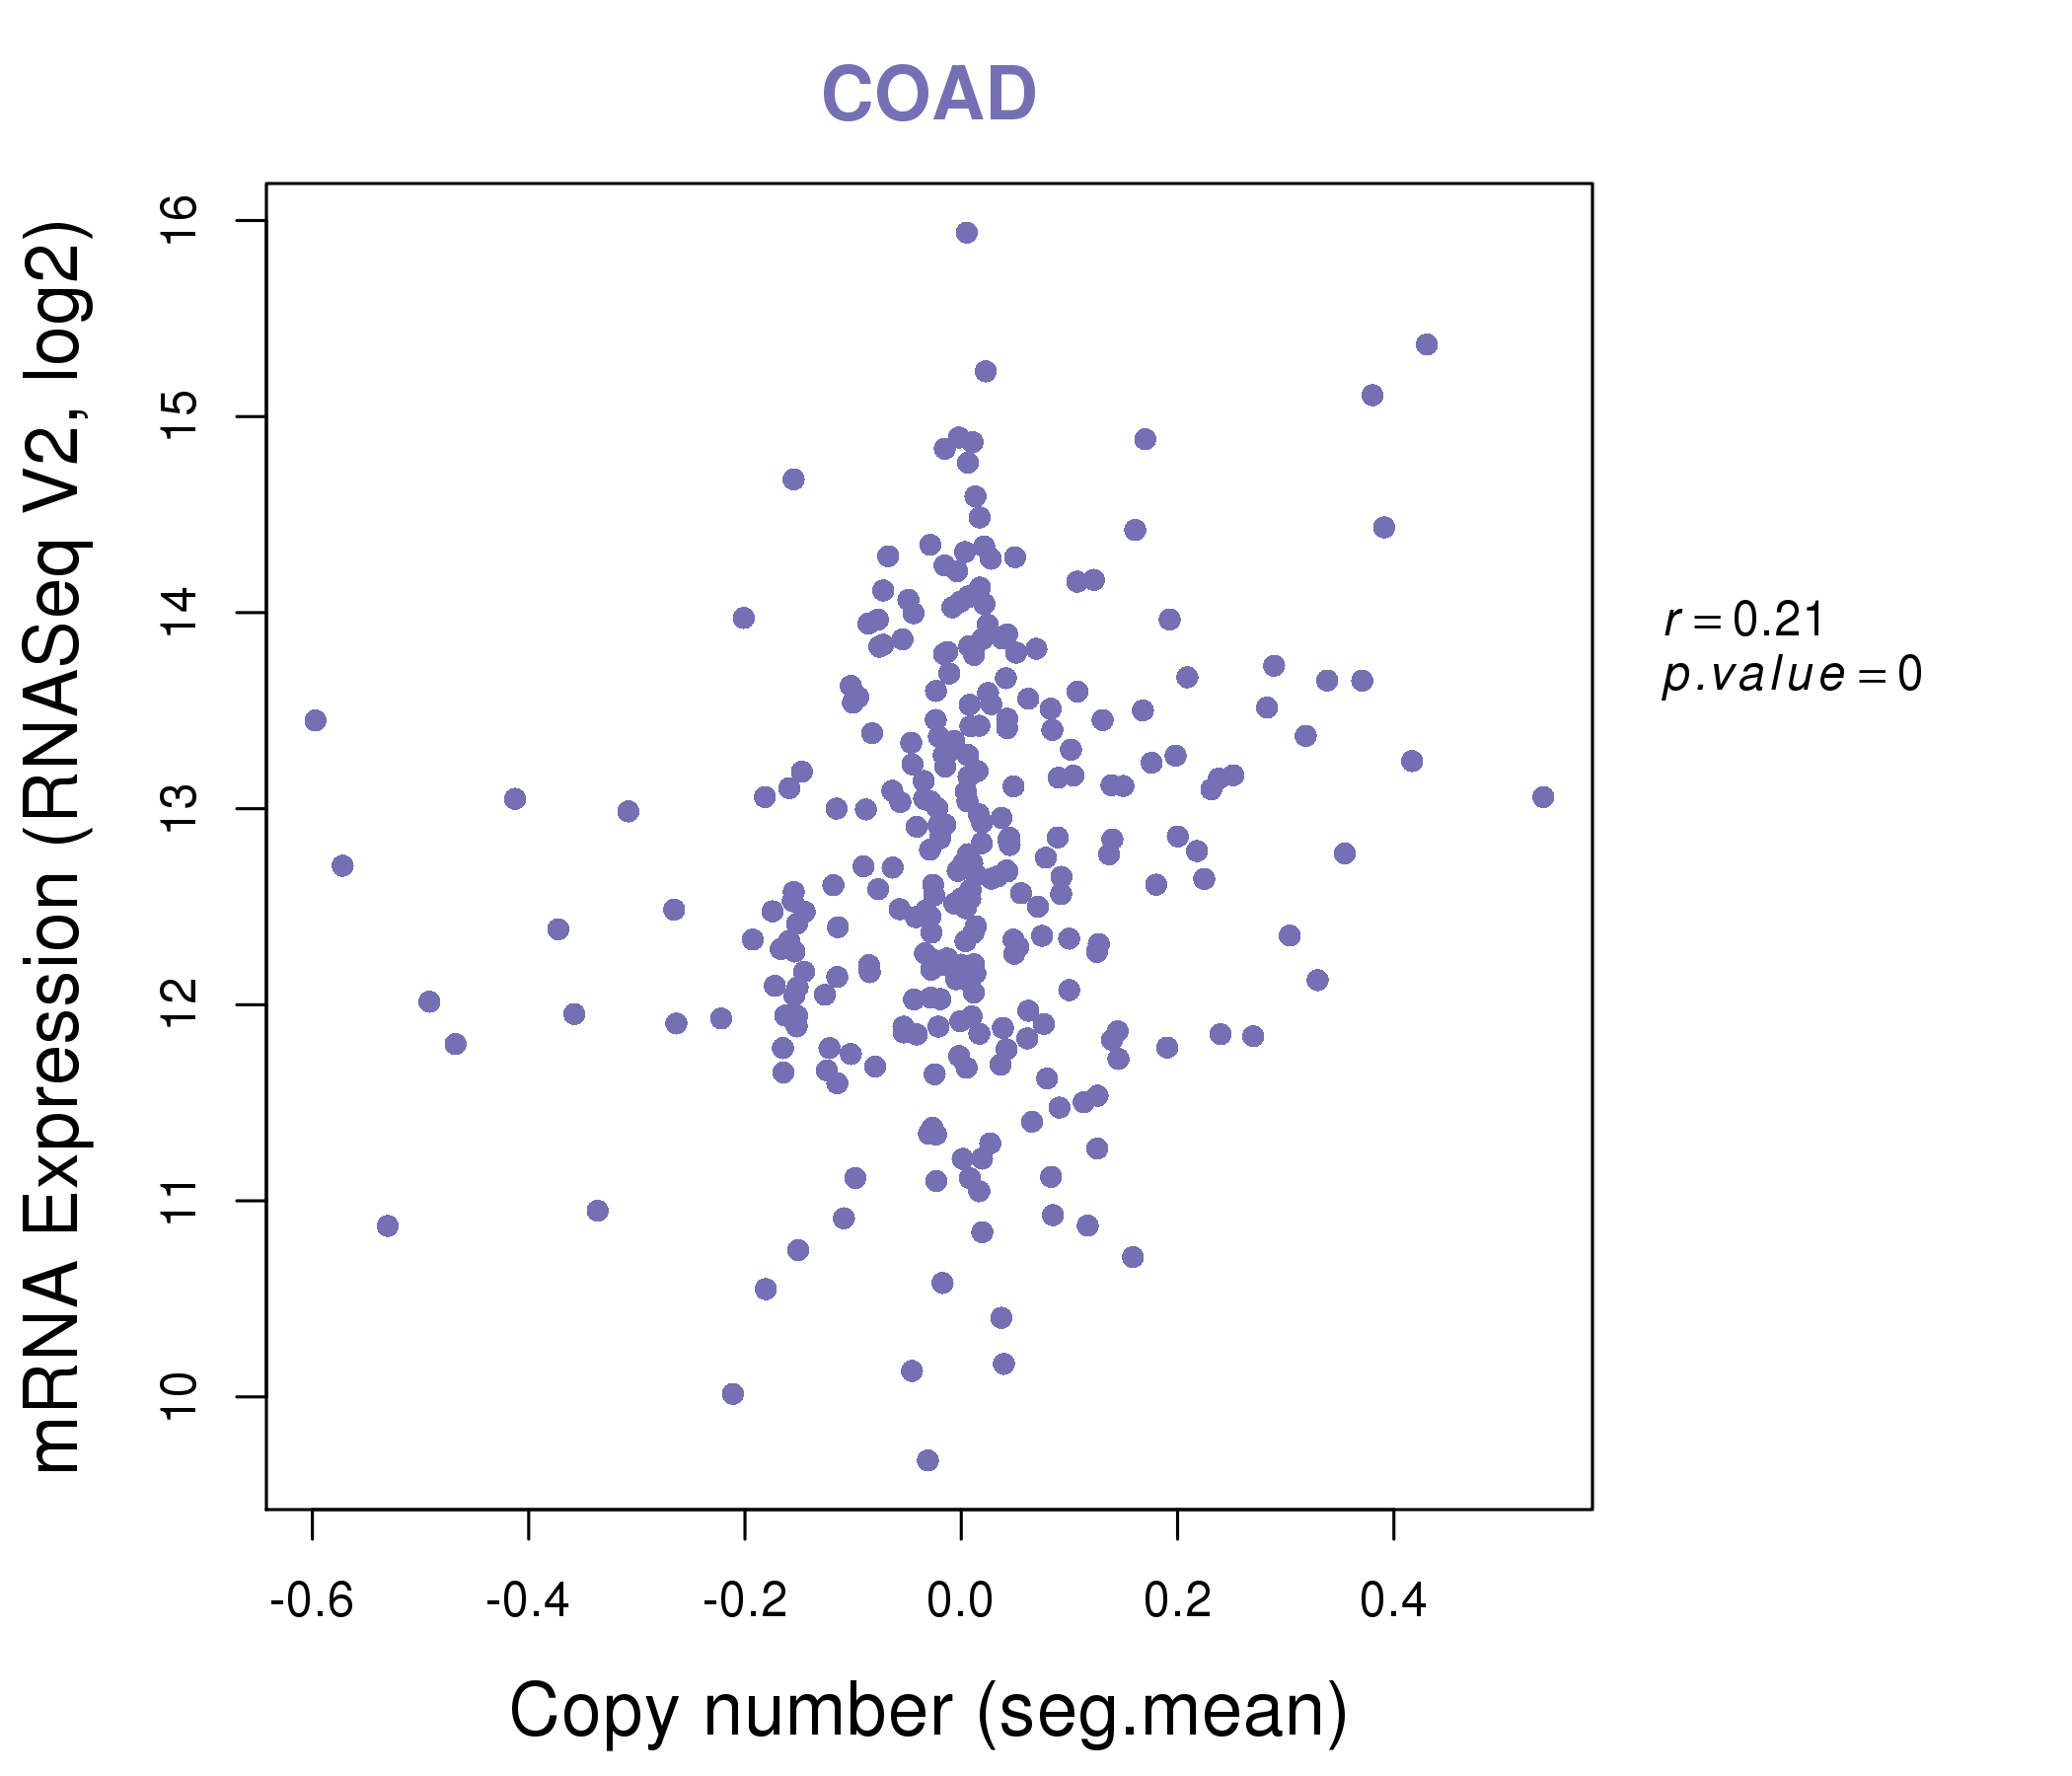
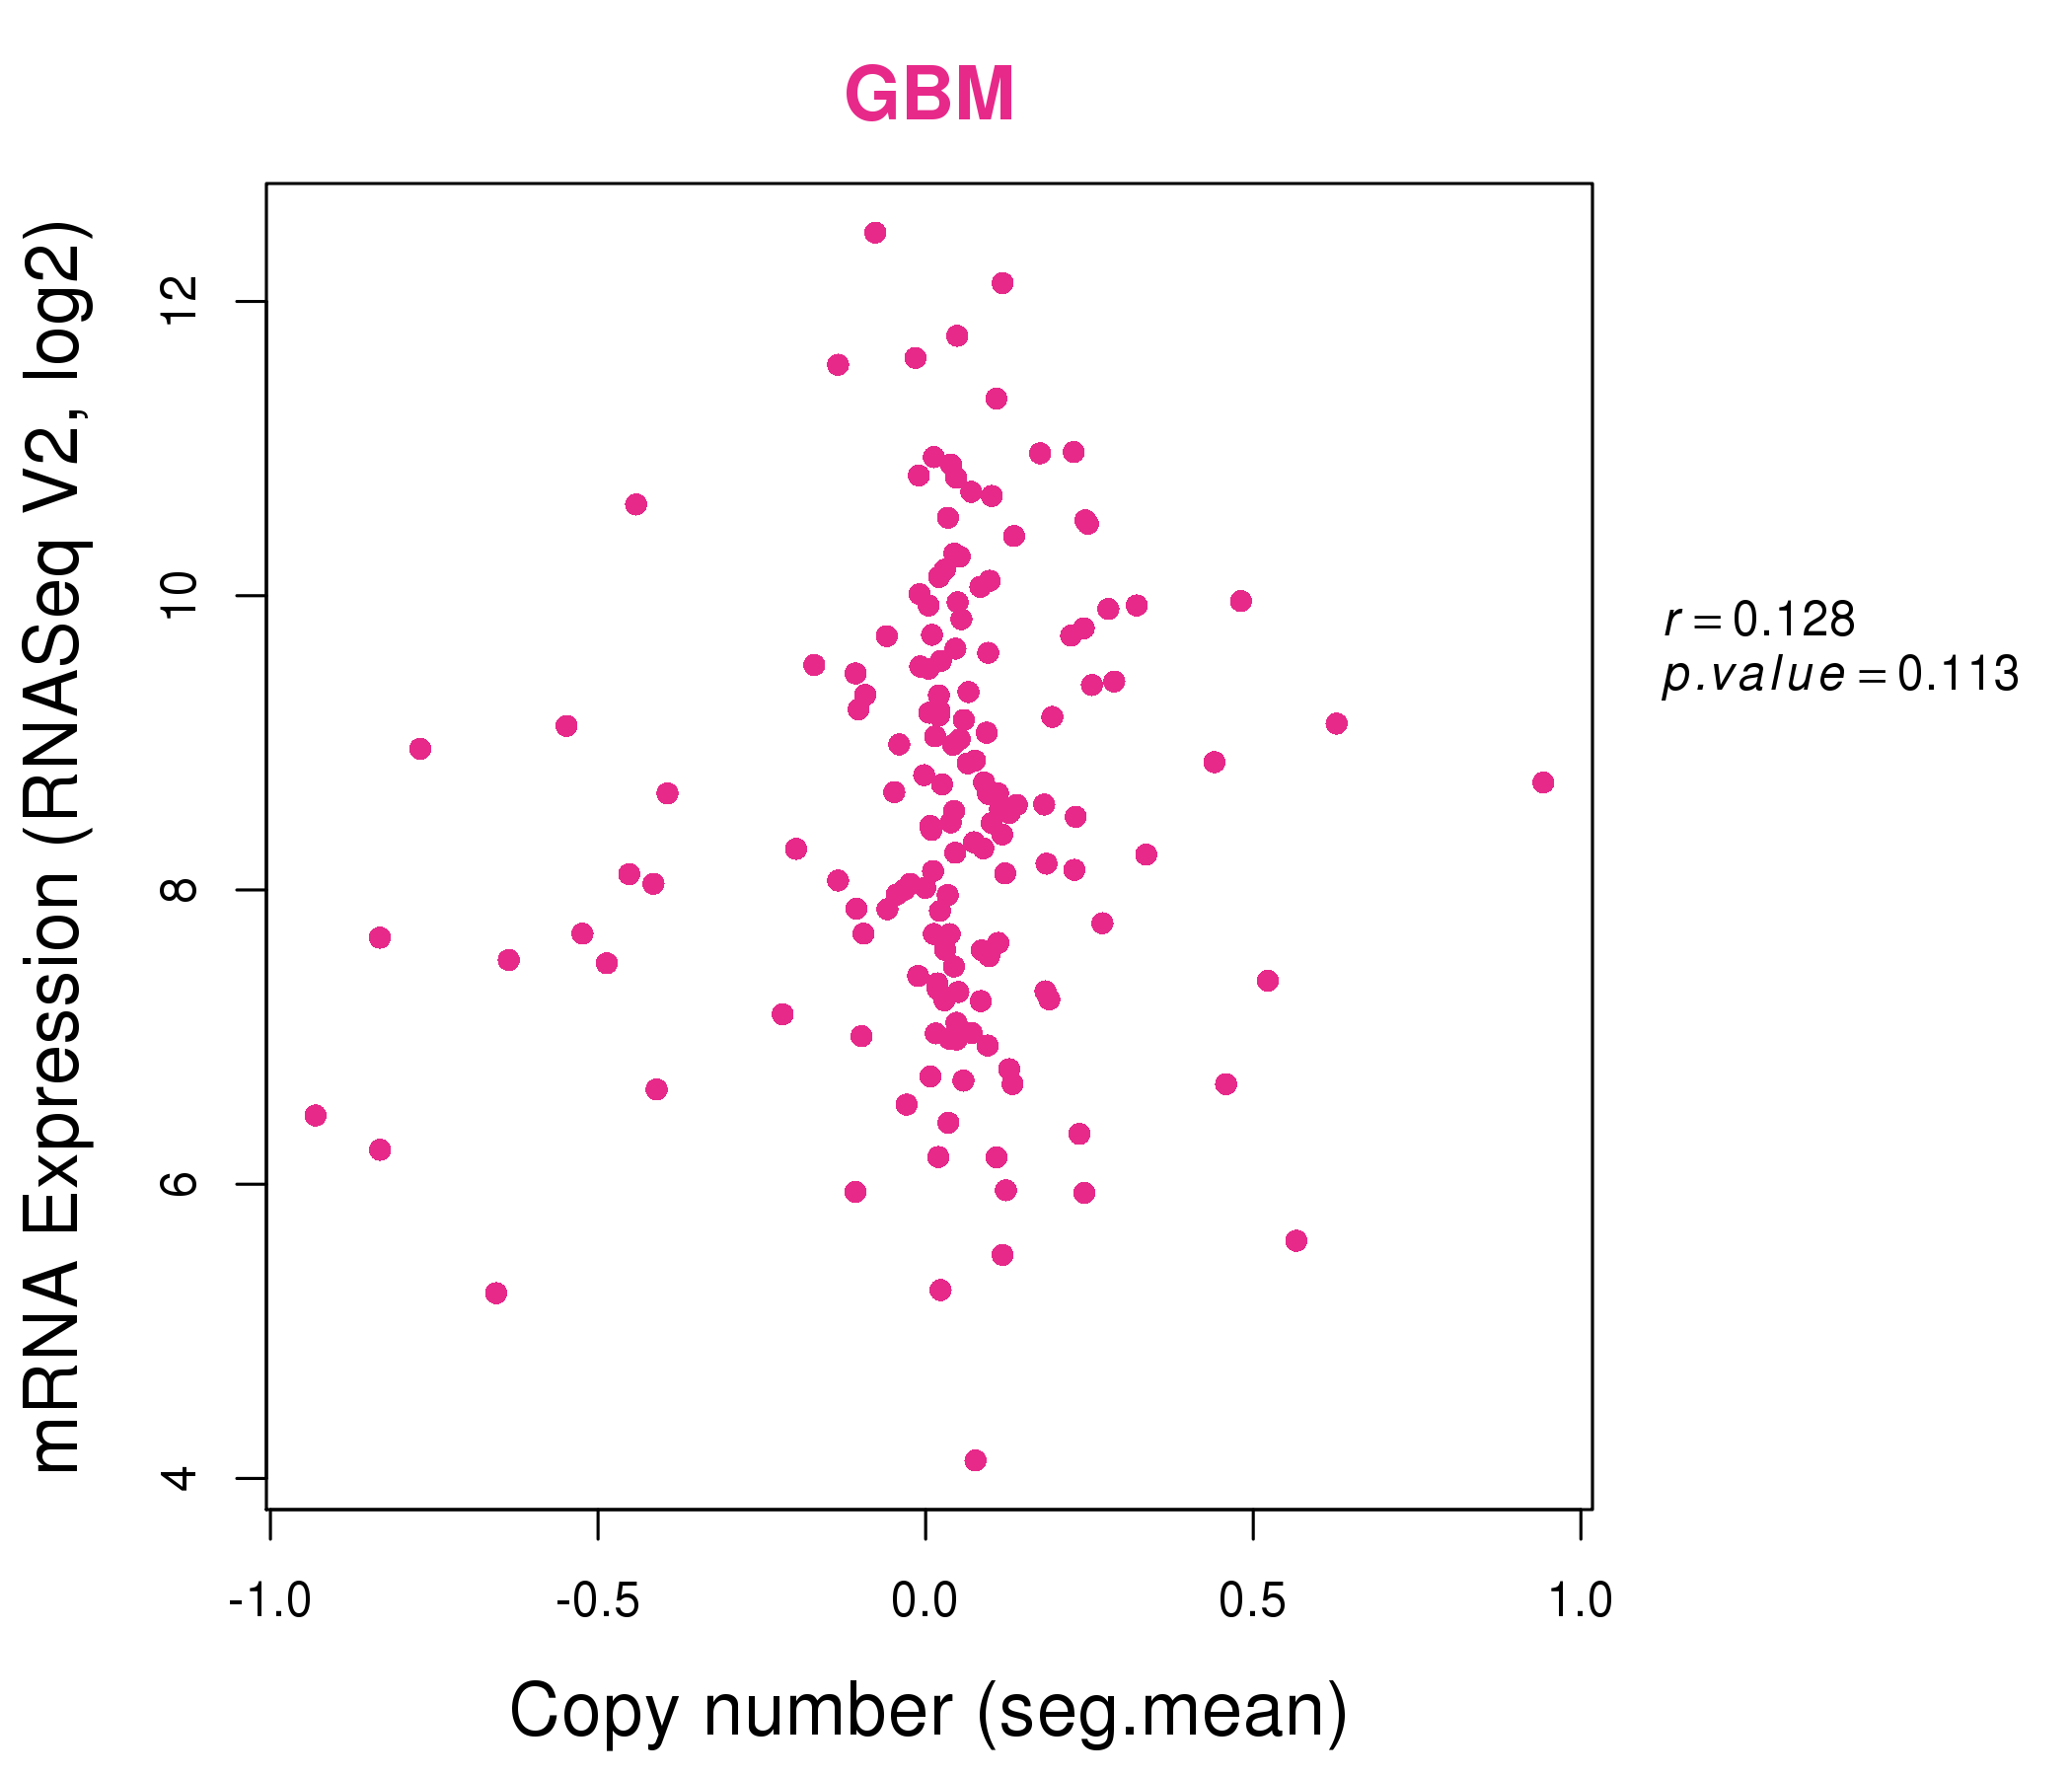
| * This plots show the correlation between CNV and gene expression. |
: Open all plots for all cancer types
 |
|
 |
|

| Top |
| Gene-Gene Network Information |
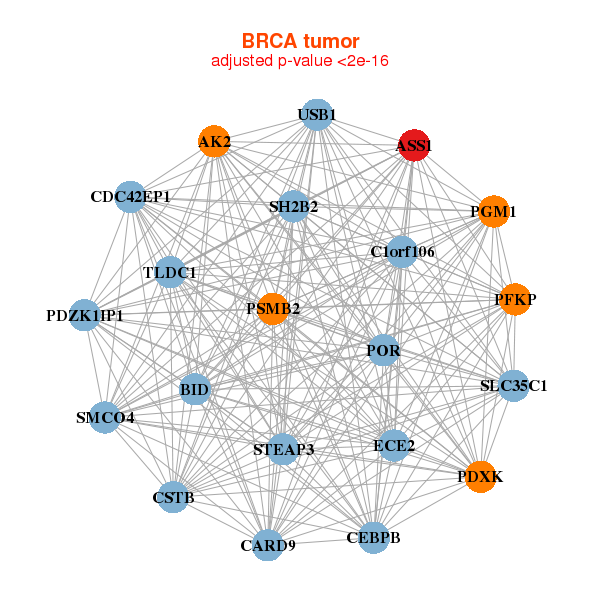
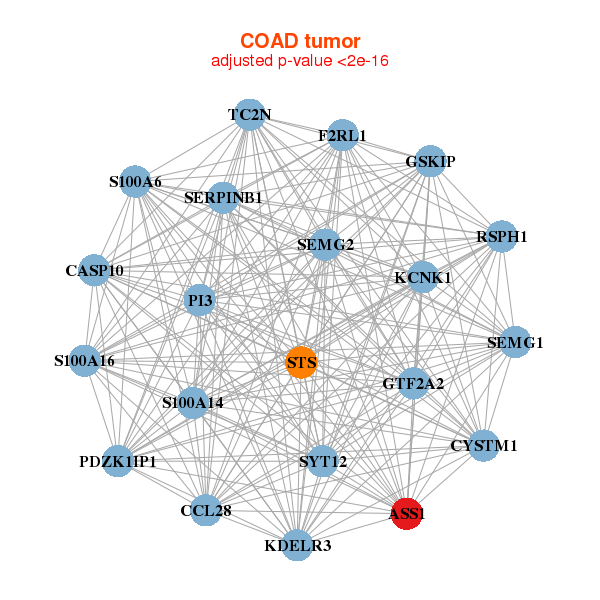
| * Co-Expression network figures were drawn using R package igraph. Only the top 20 genes with the highest correlations were shown. Red circle: input gene, orange circle: cell metabolism gene, sky circle: other gene |
: Open all plots for all cancer types
 |
| ||||
| AK2,ASS1,BID,SMCO4,USB1,C1orf106,CARD9, CDC42EP1,CEBPB,CSTB,ECE2,TLDC1,PDXK,PDZK1IP1, PFKP,PGM1,POR,PSMB2,SH2B2,SLC35C1,STEAP3 | ALDH1L1,ANKRD53,ASS1,C20orf27,APMAP,CALCRL,CIDEA, ECHDC3,GLUL,GLYCTK,HEBP2,HRSP12,MLXIPL,MOCS1, PC,PMM1,RASL10B,SHMT1,TM7SF2,TMEM100,TMEM120A | ||||
 |
| ||||
| ASS1,GSKIP,CYSTM1,CASP10,CCL28,F2RL1,GTF2A2, KCNK1,KDELR3,PDZK1IP1,PI3,RSPH1,S100A14,S100A16, S100A6,SEMG1,SEMG2,SERPINB1,STS,SYT12,TC2N | ASS1,CARD16,CASP1,CASP5,CD274,CLEC6A,ETV7, FAM26F,FCGR1C,GBP1,GRAMD2,IFI35,LOC400696,LYPD5, NOS2,PARP9,PSMA3,PSMB2,PSME1,PSME2,WARS |
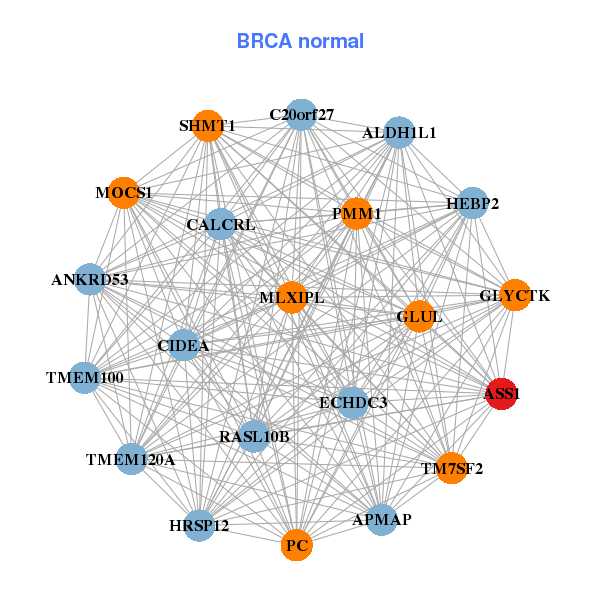
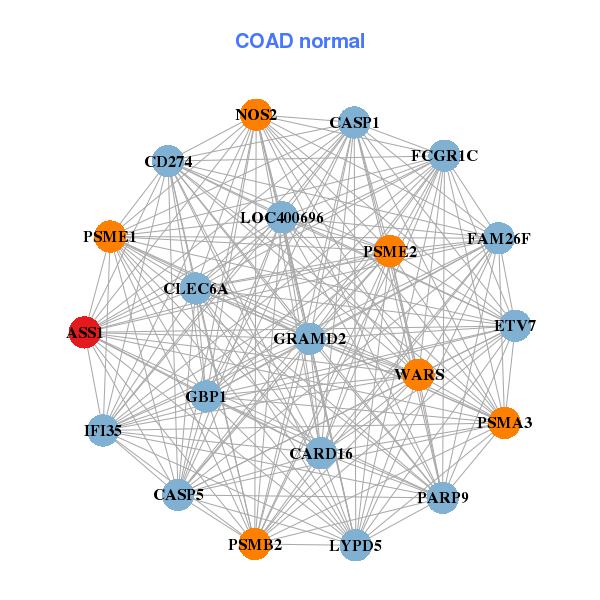
| * Co-Expression network figures were drawn using R package igraph. Only the top 20 genes with the highest correlations were shown. Red circle: input gene, orange circle: cell metabolism gene, sky circle: other gene |
: Open all plots for all cancer types
| Top |
: Open all interacting genes' information including KEGG pathway for all interacting genes from DAVID
| Top |
| Pharmacological Information for ASS1 |
| DB Category | DB Name | DB's ID and Url link |
| * Gene Centered Interaction Network. |
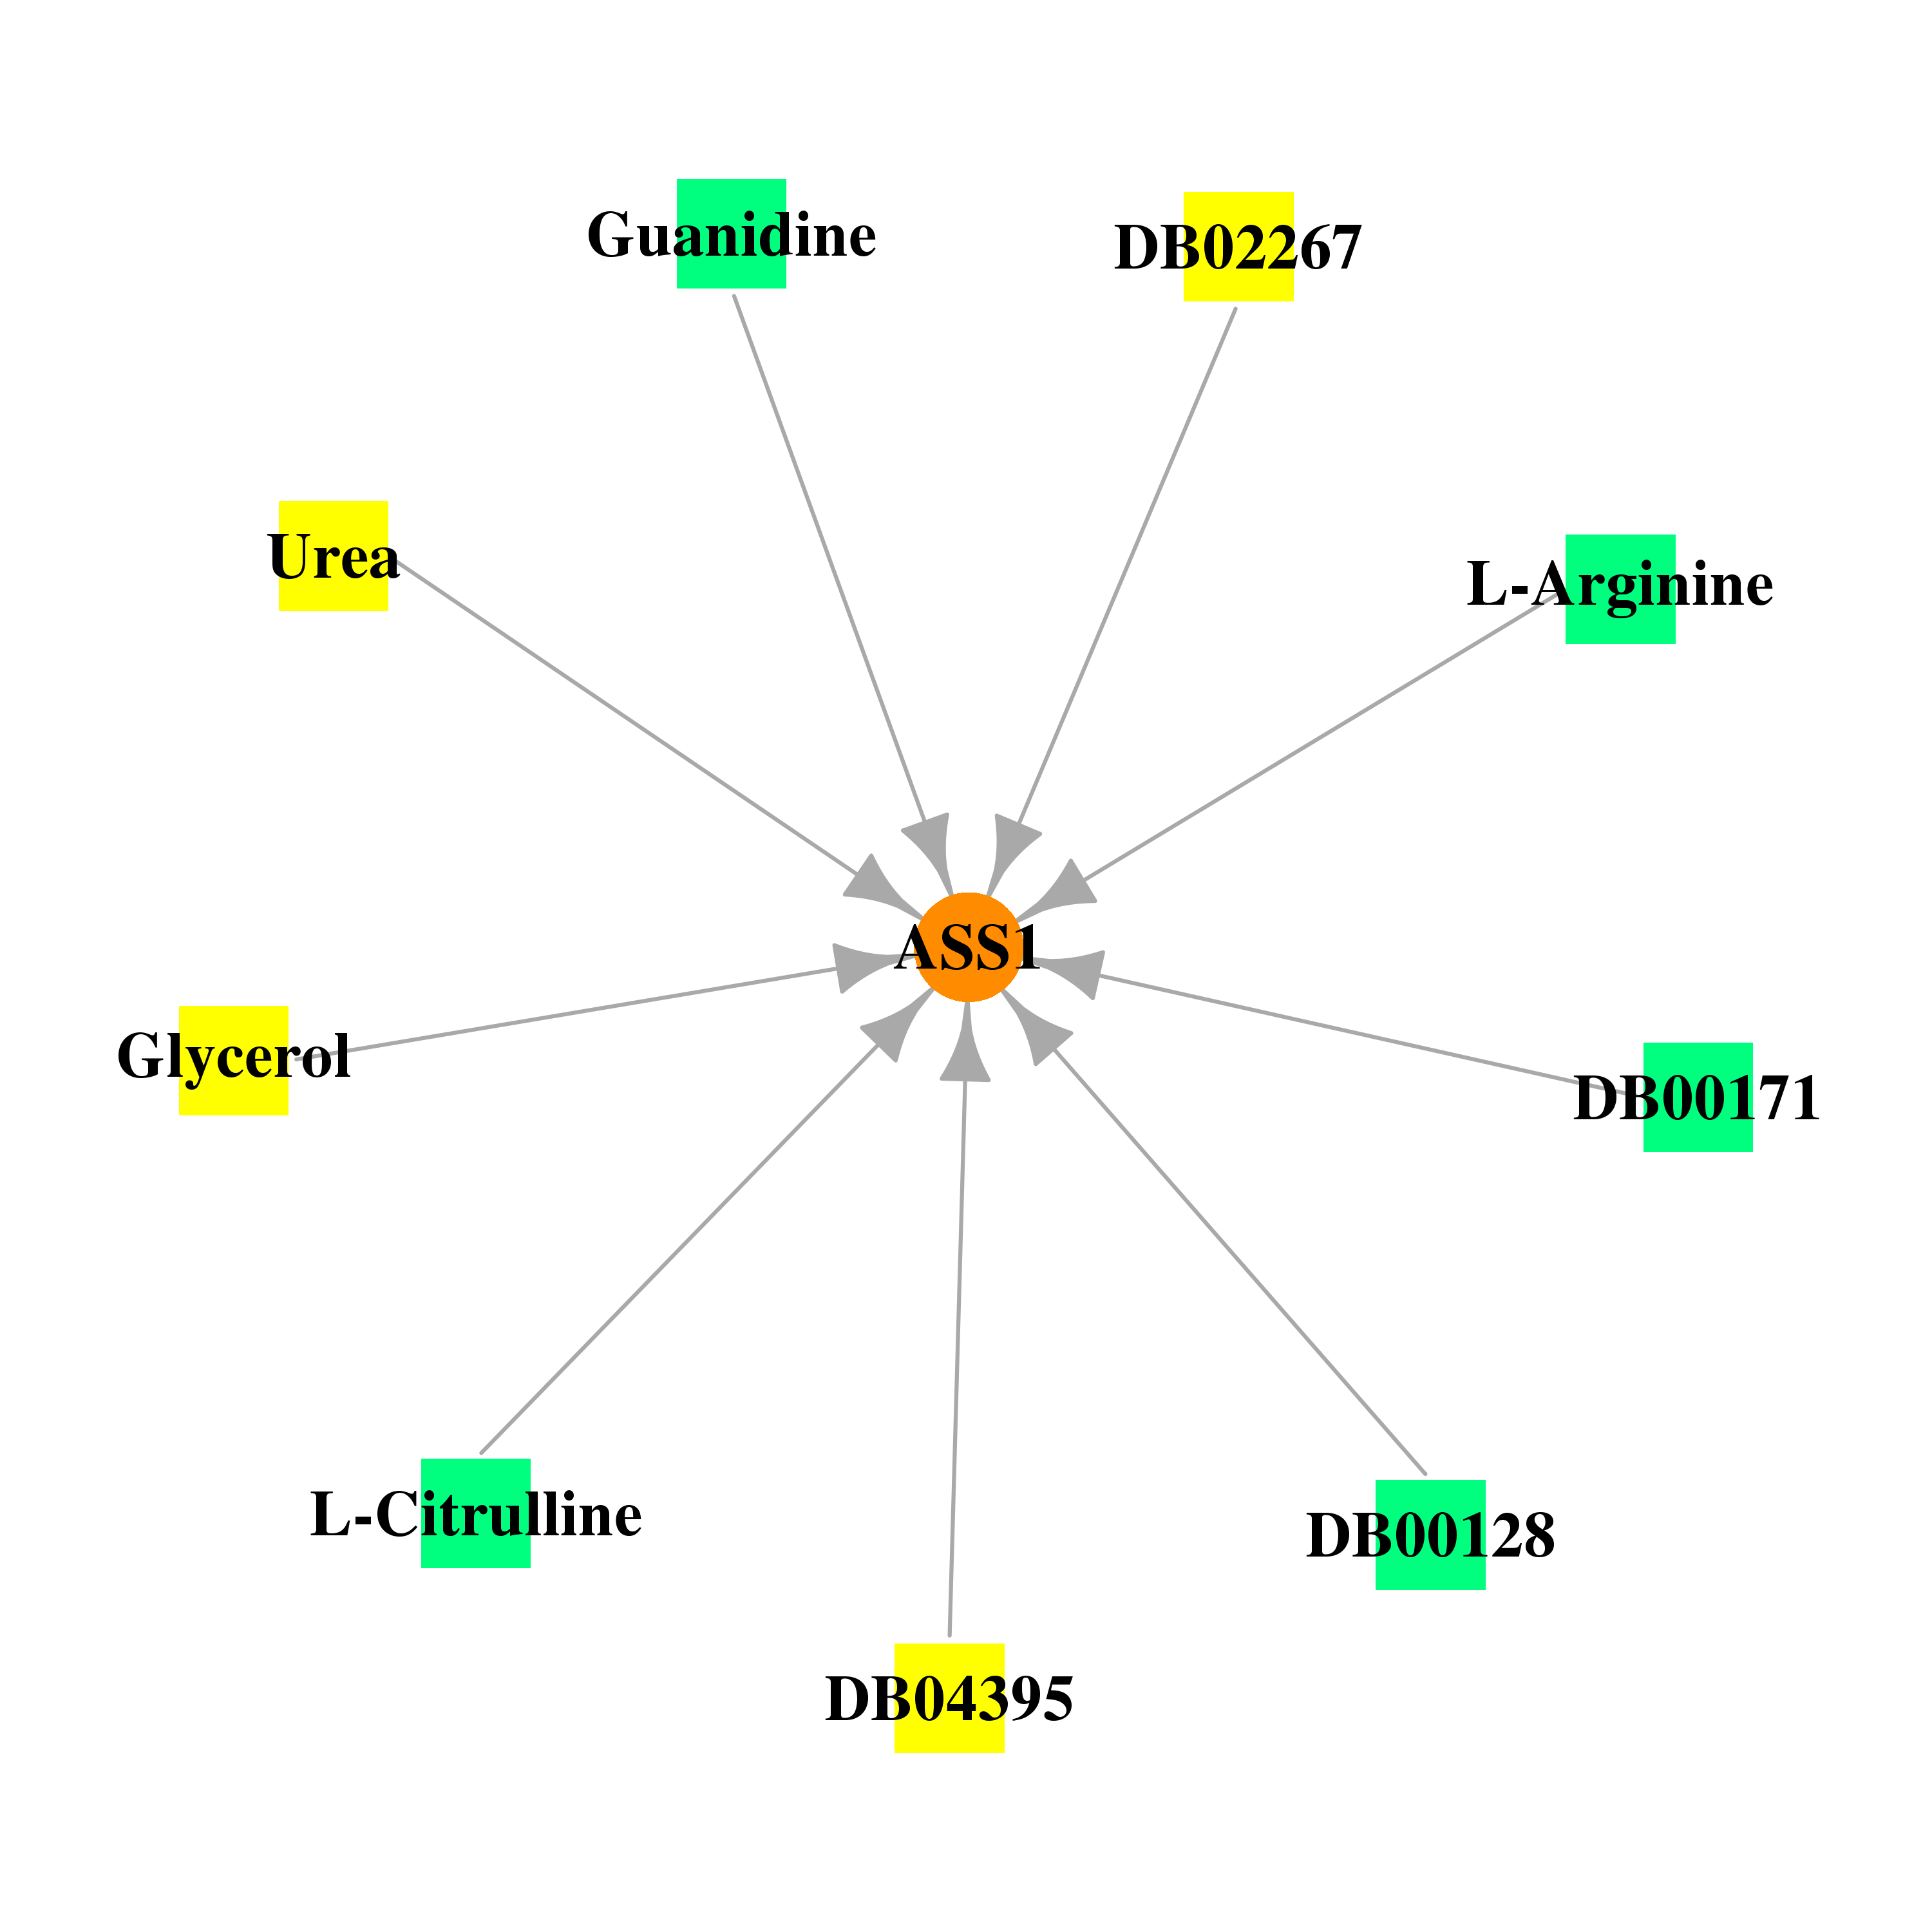 |
| * Drug Centered Interaction Network. |
| DrugBank ID | Target Name | Drug Groups | Generic Name | Drug Centered Network | Drug Structure |
| DB00125 | argininosuccinate synthase 1 | approved; nutraceutical | L-Arginine |  |  |
| DB00128 | argininosuccinate synthase 1 | approved; nutraceutical | L-Aspartic Acid | 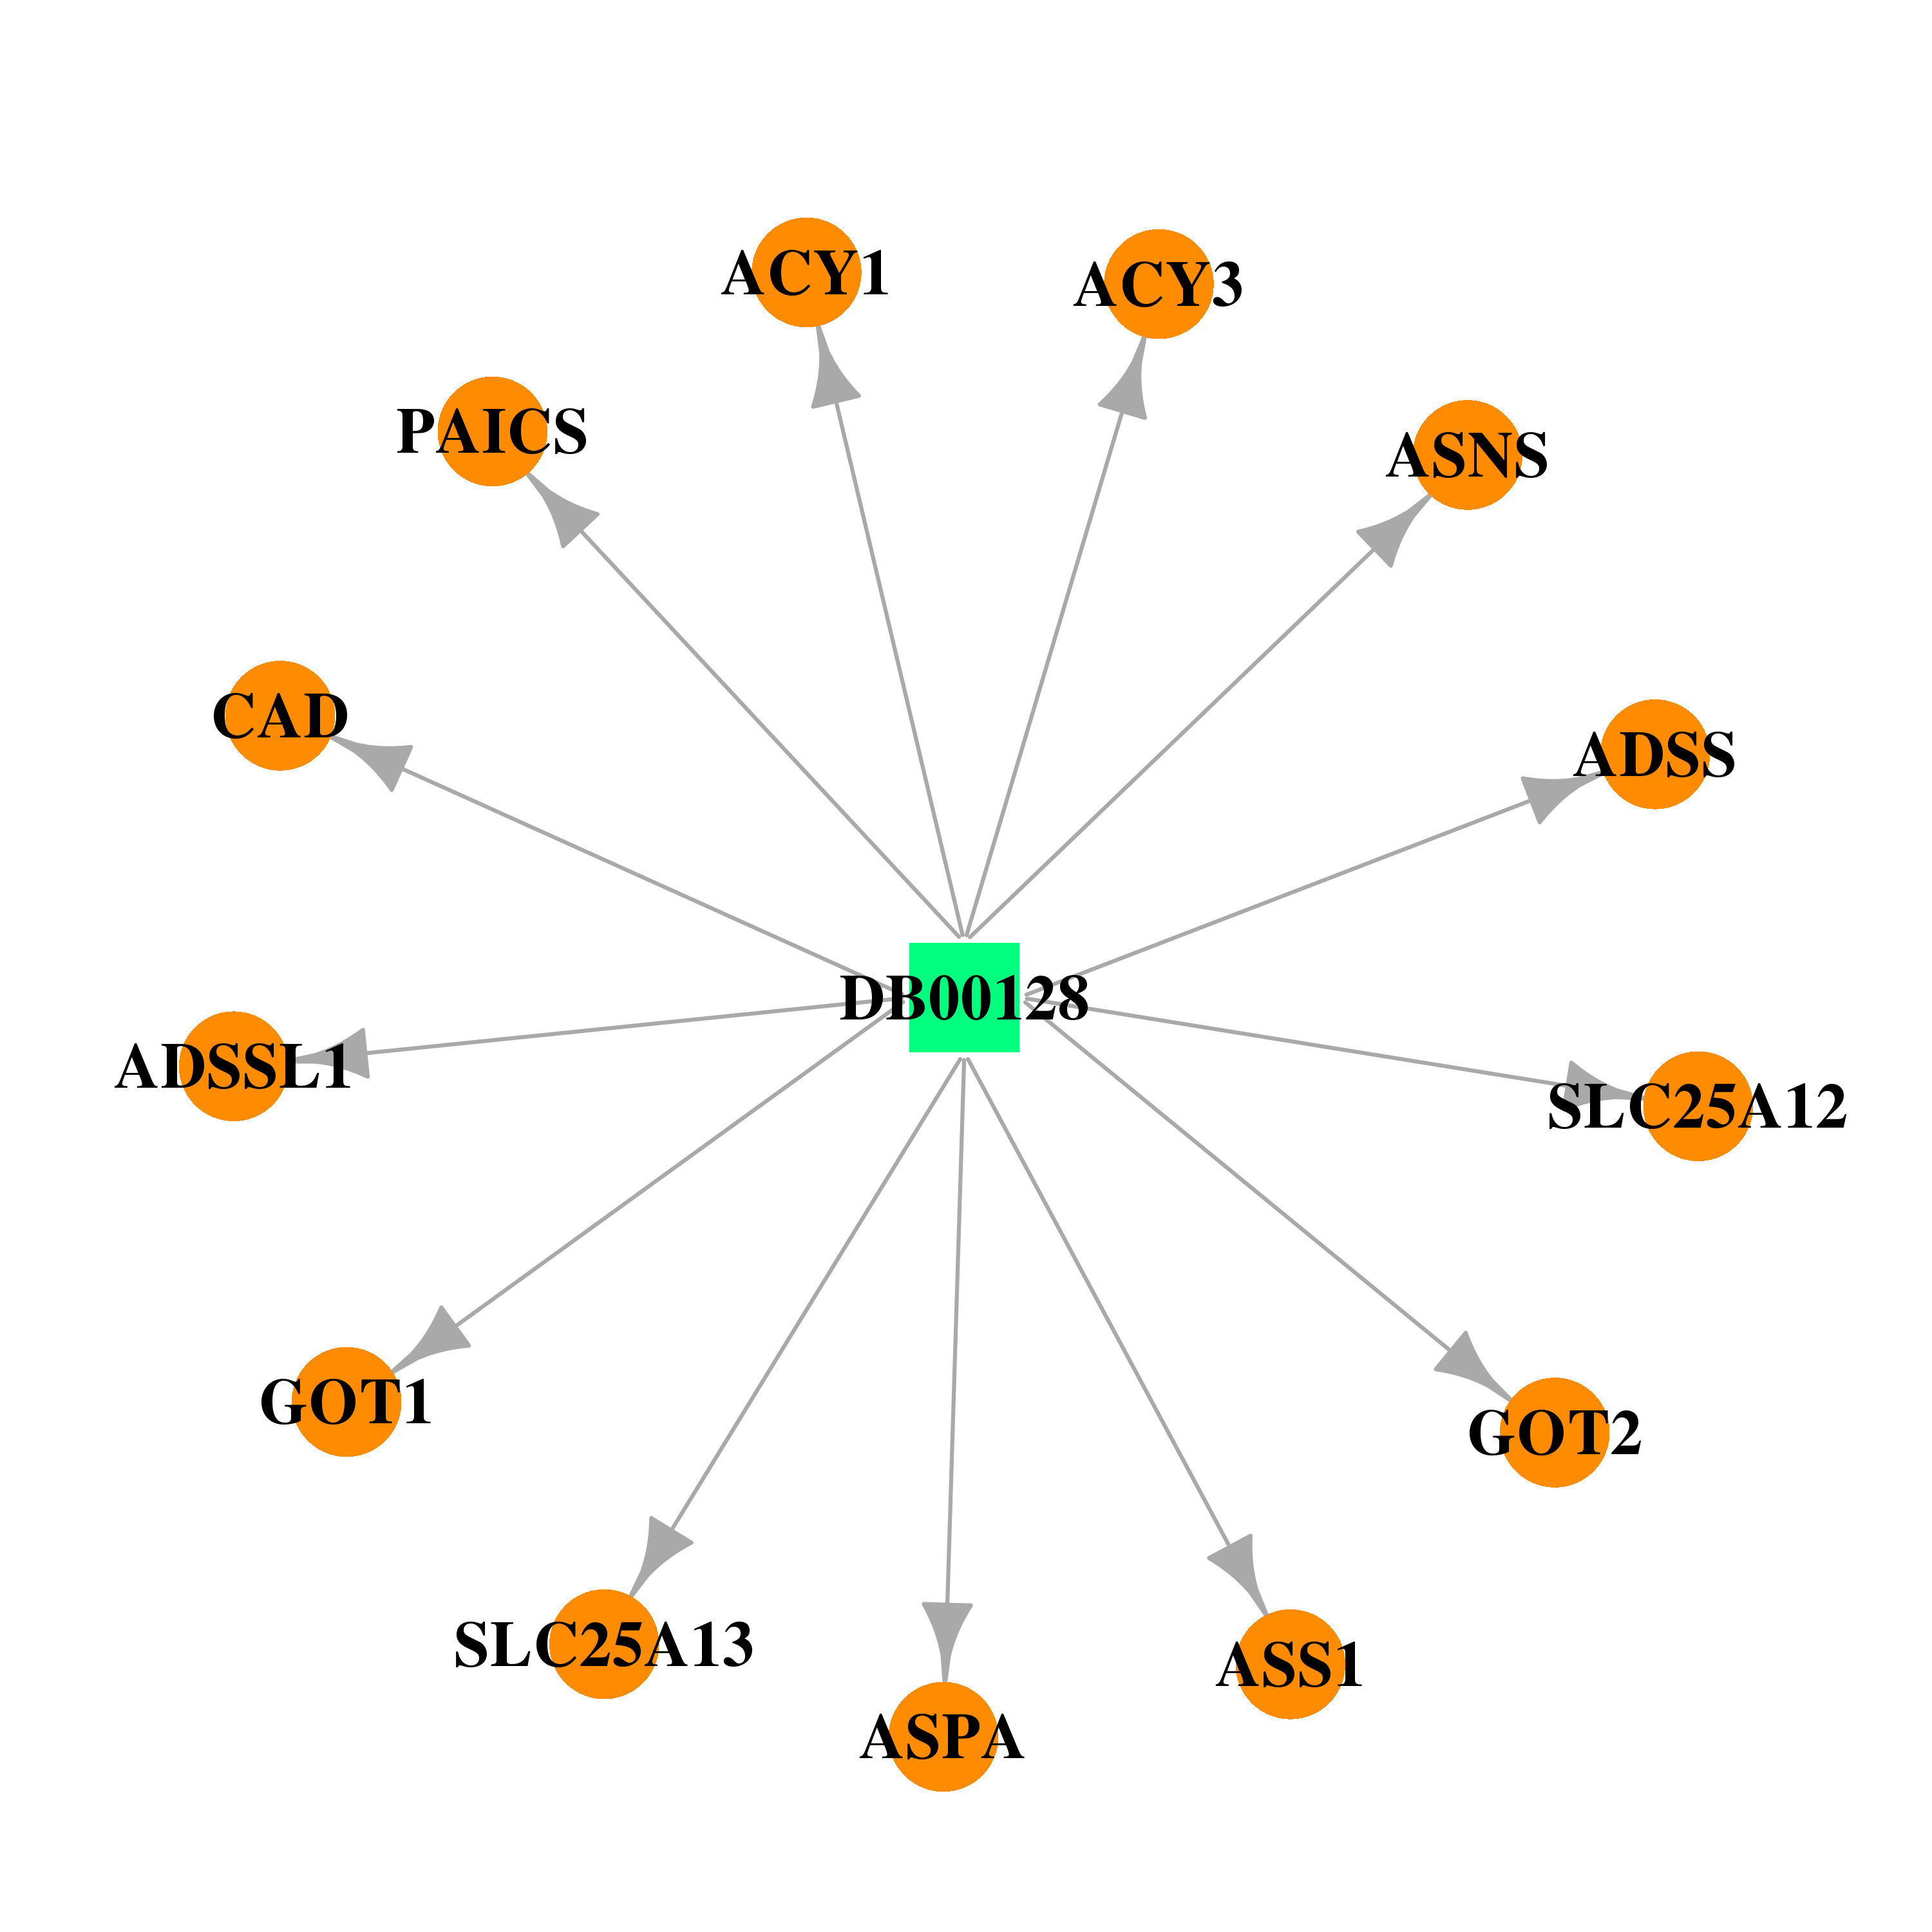 | 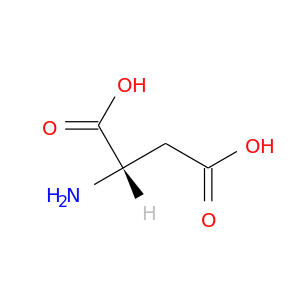 |
| DB00155 | argininosuccinate synthase 1 | approved; nutraceutical | L-Citrulline | 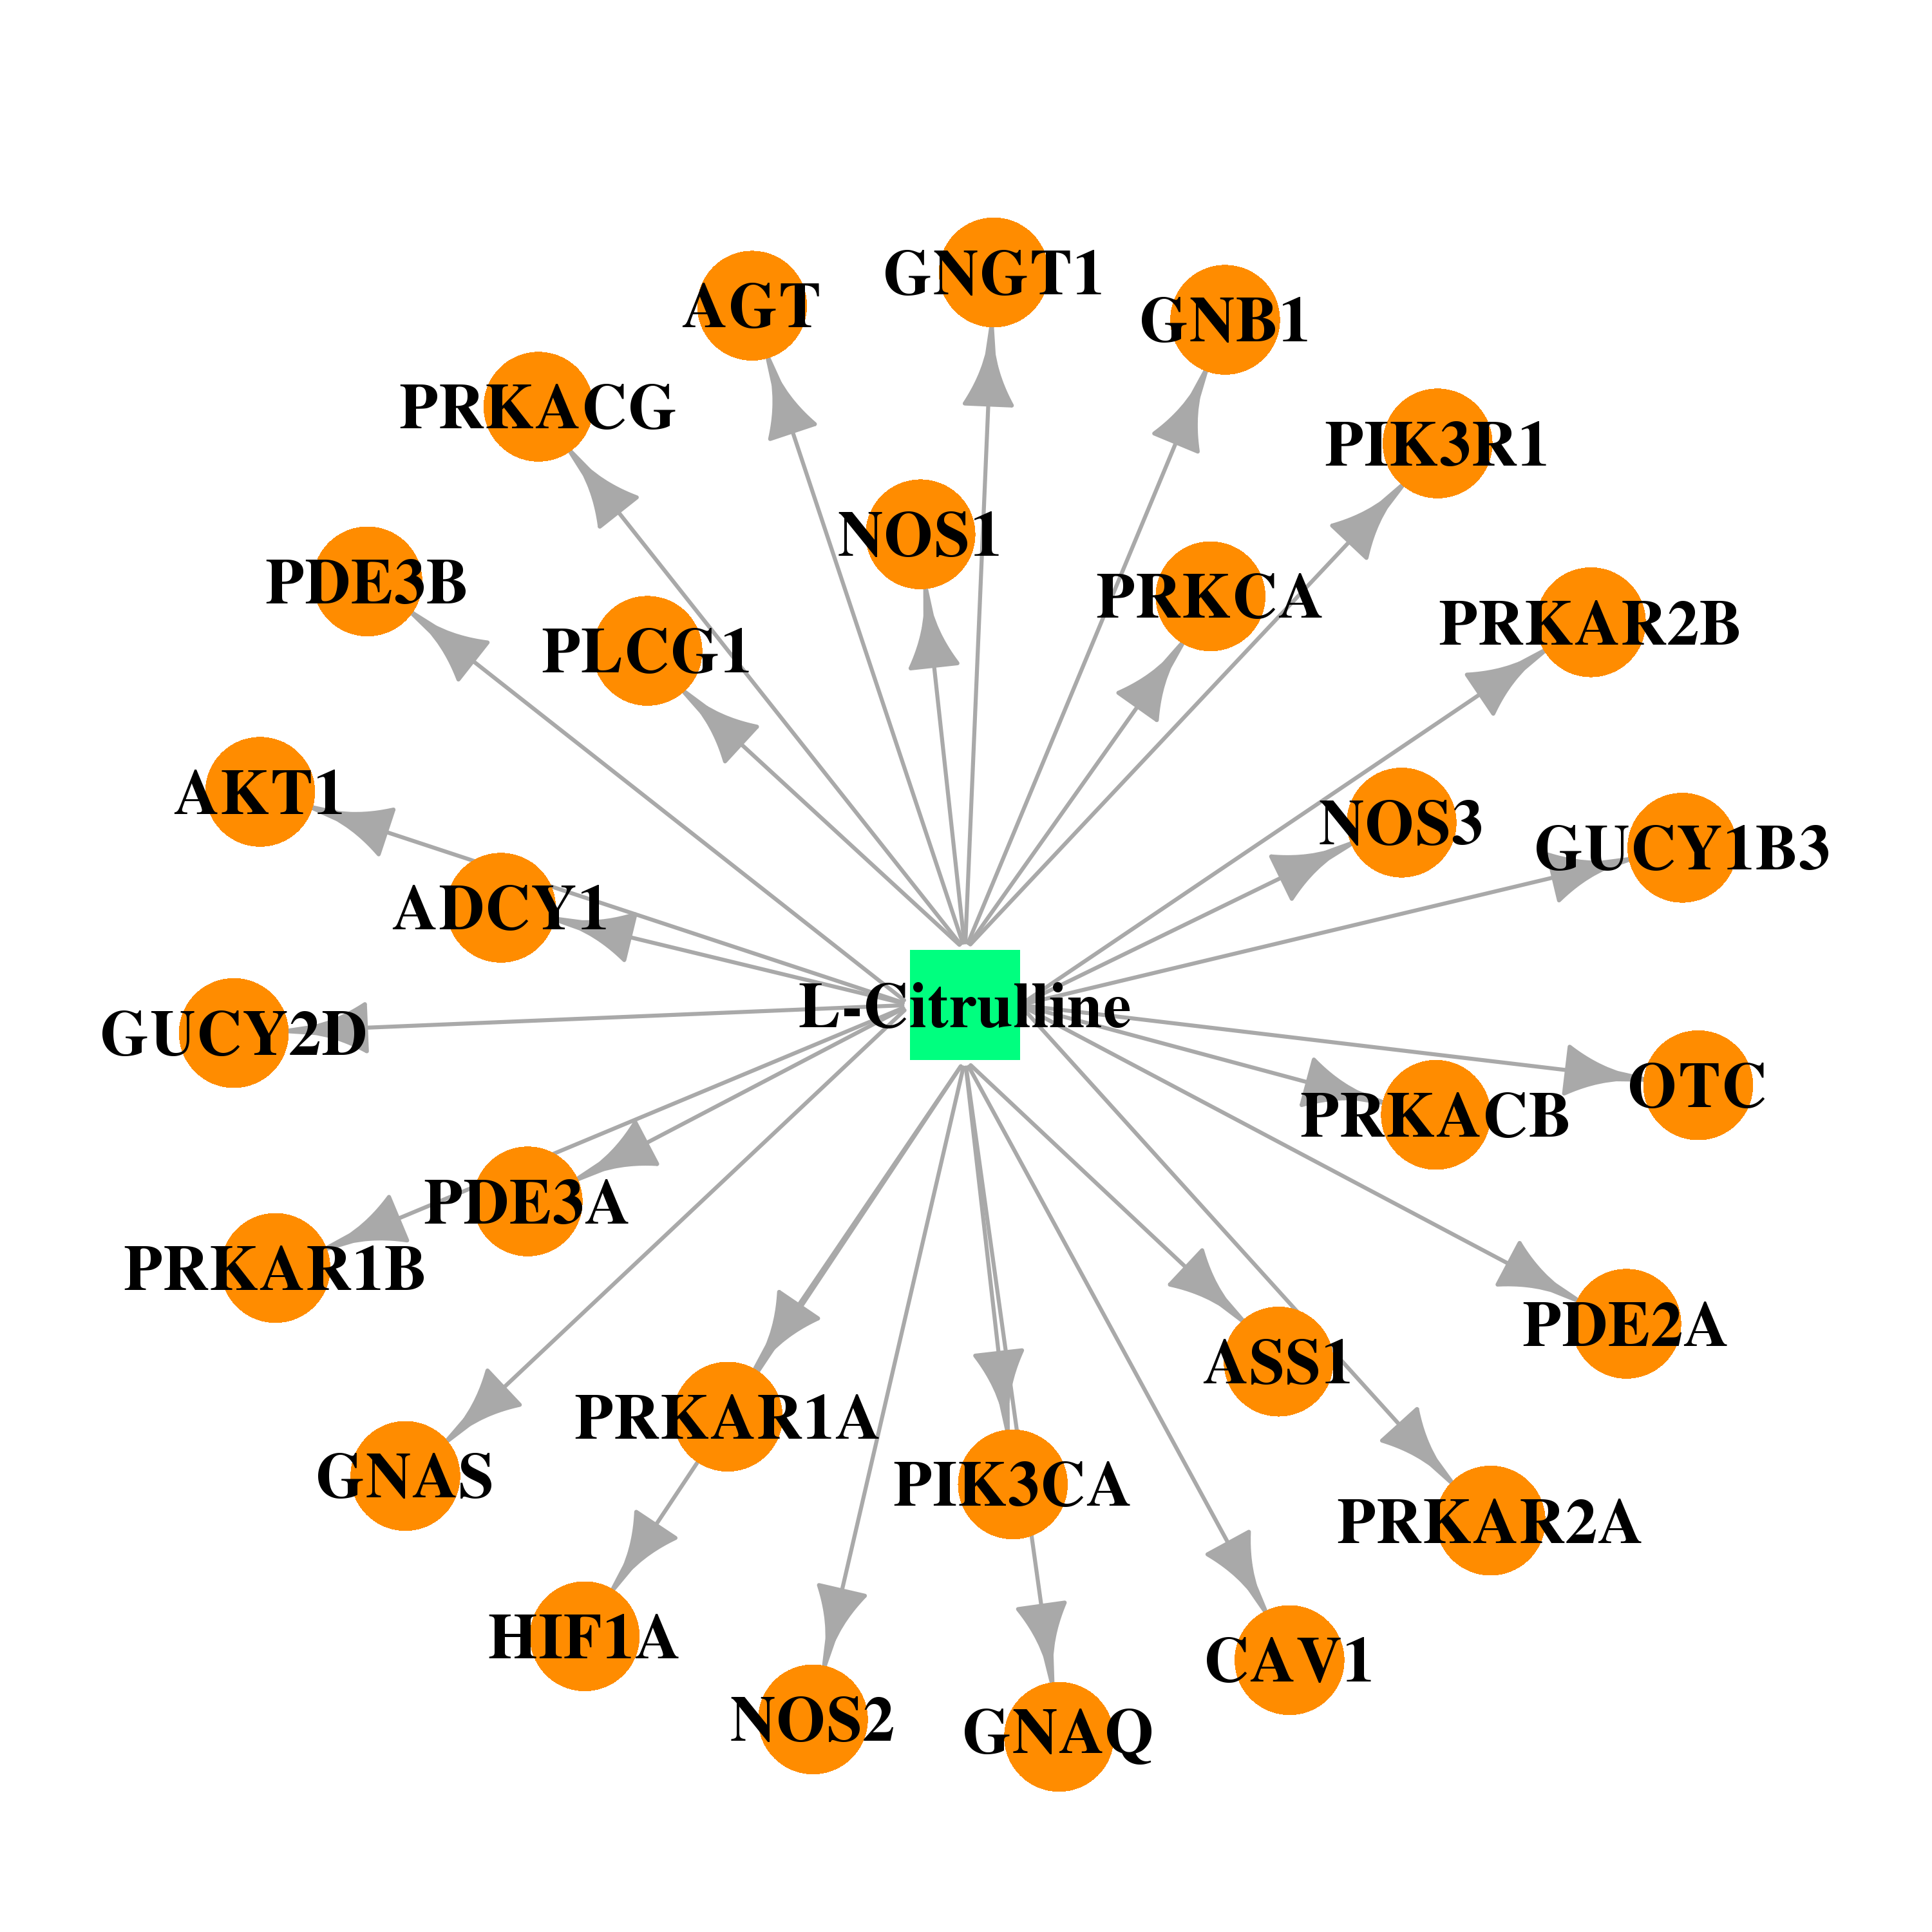 |  |
| DB00171 | argininosuccinate synthase 1 | approved; nutraceutical | Adenosine triphosphate |  |  |
| DB02267 | argininosuccinate synthase 1 | experimental | Argininosuccinate | 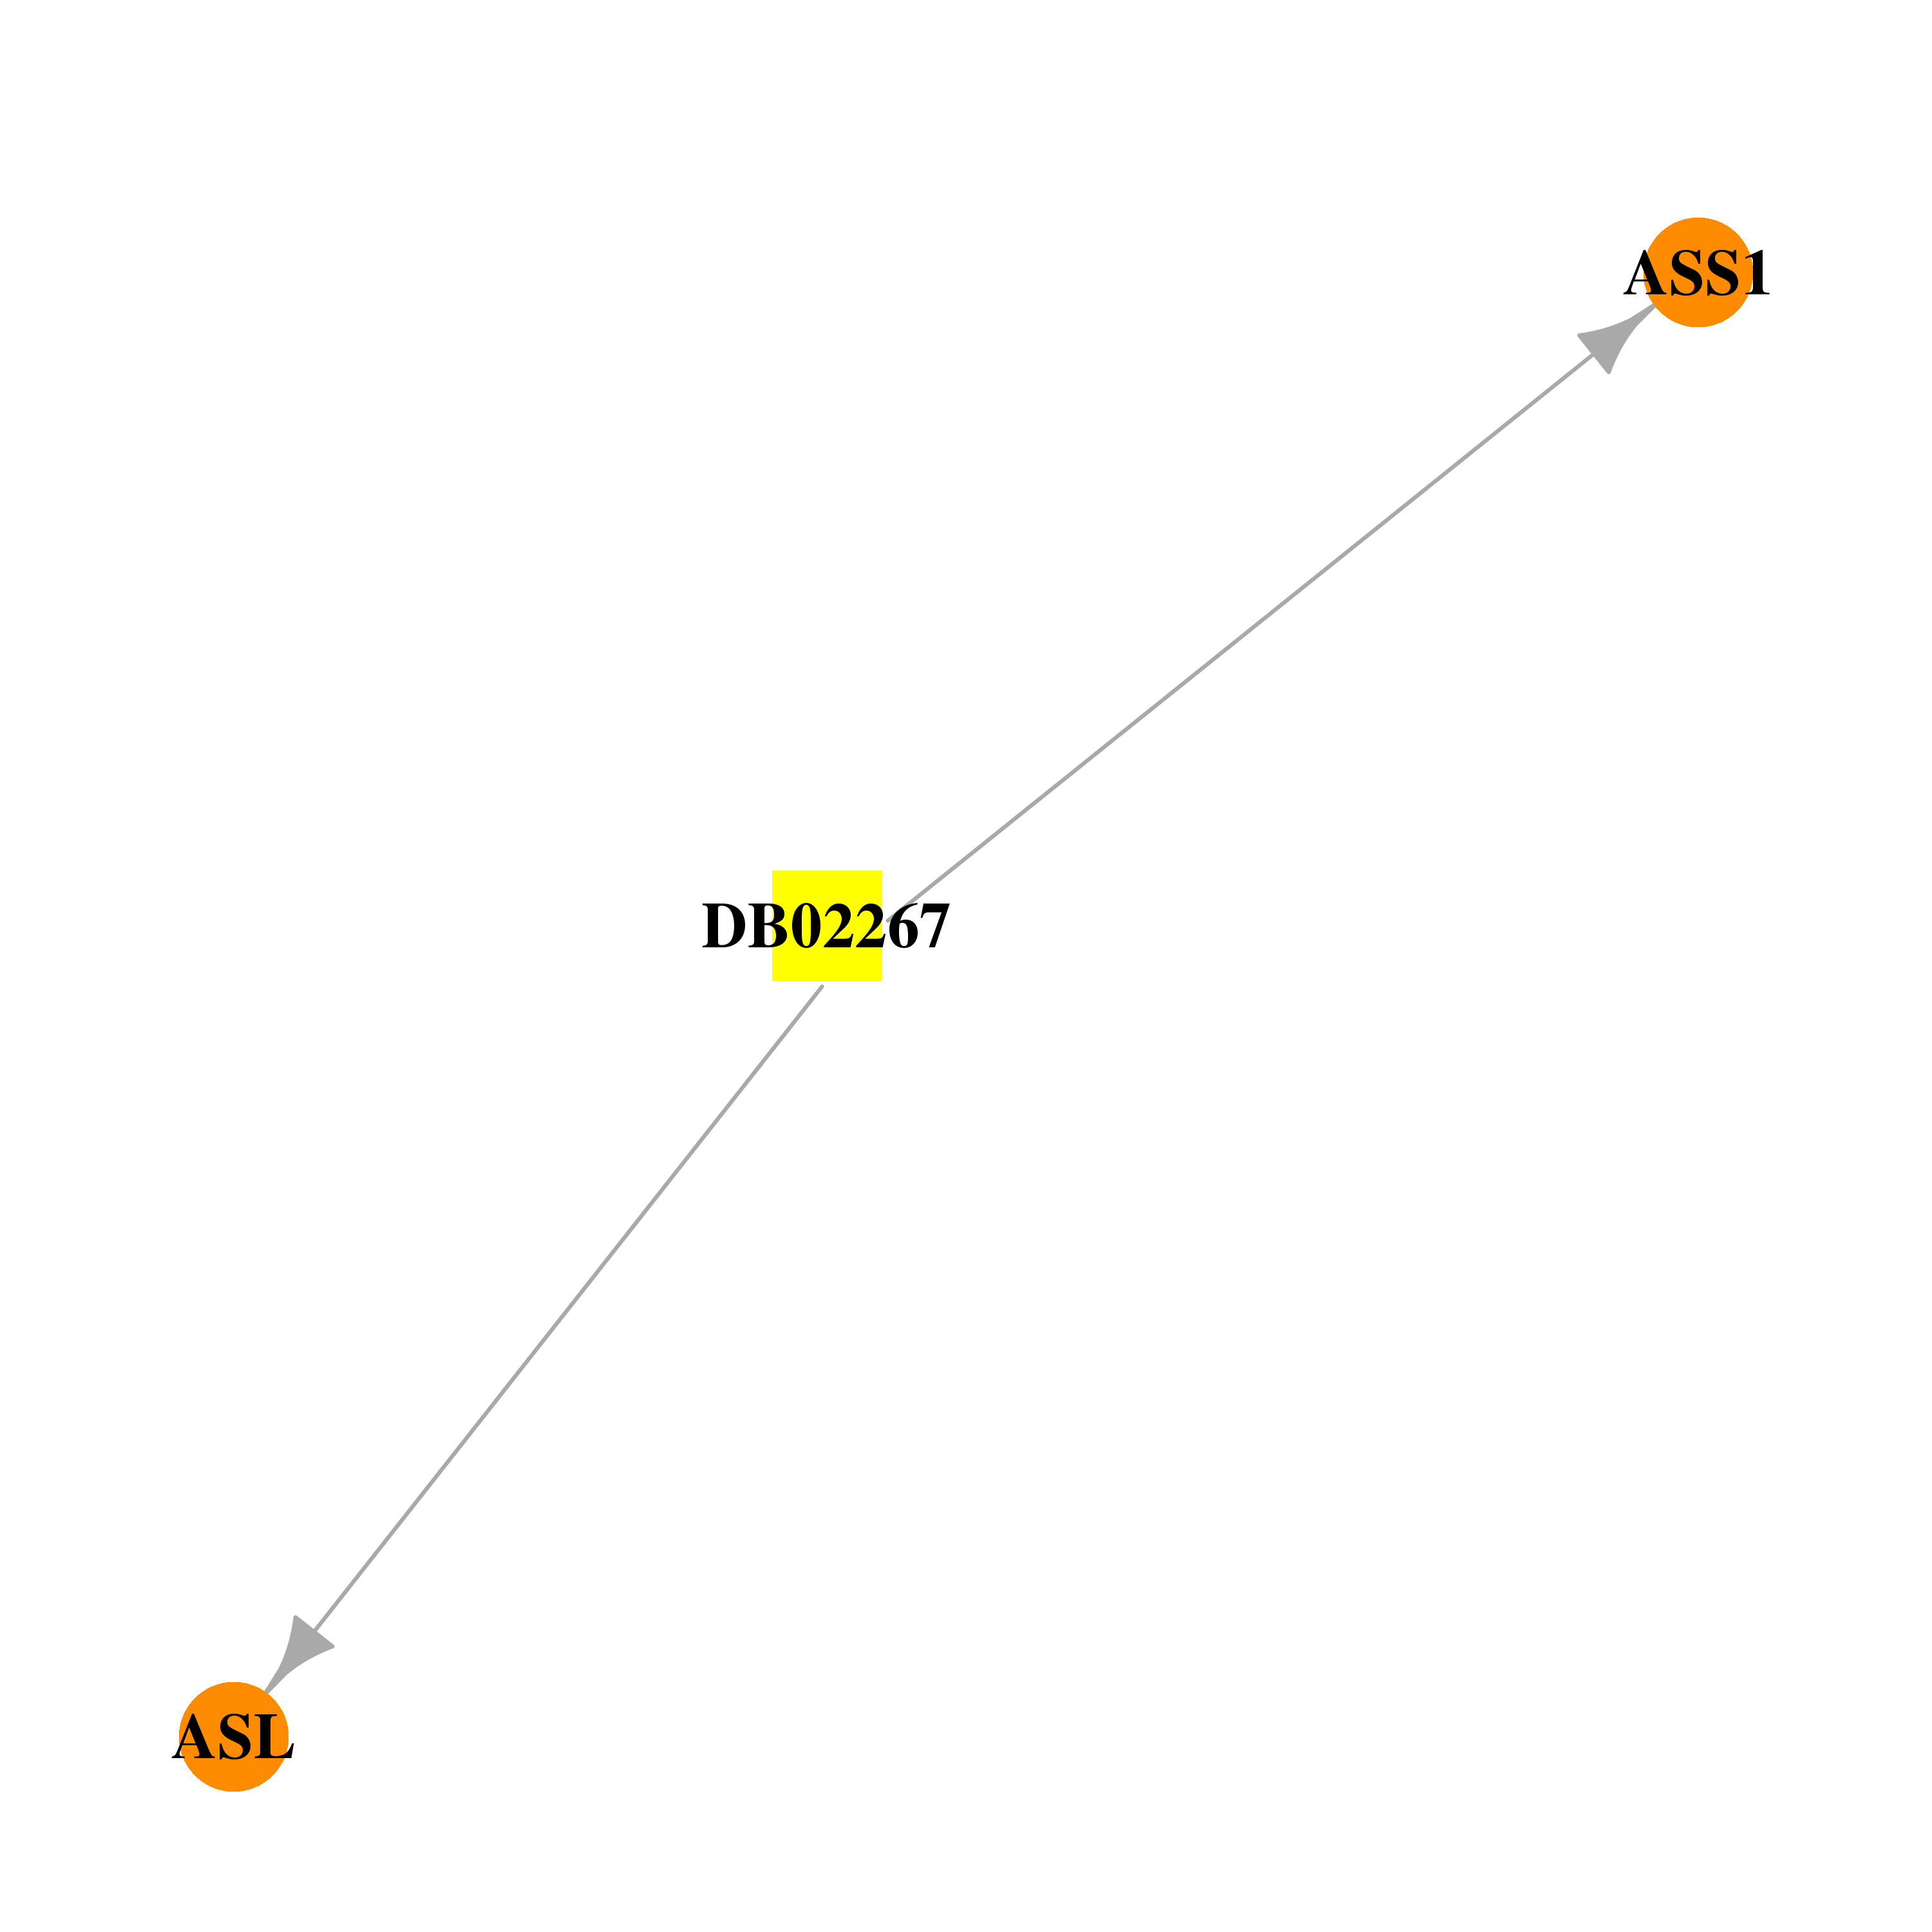 |  |
| DB04395 | argininosuccinate synthase 1 | experimental | Phosphoaminophosphonic Acid-Adenylate Ester | 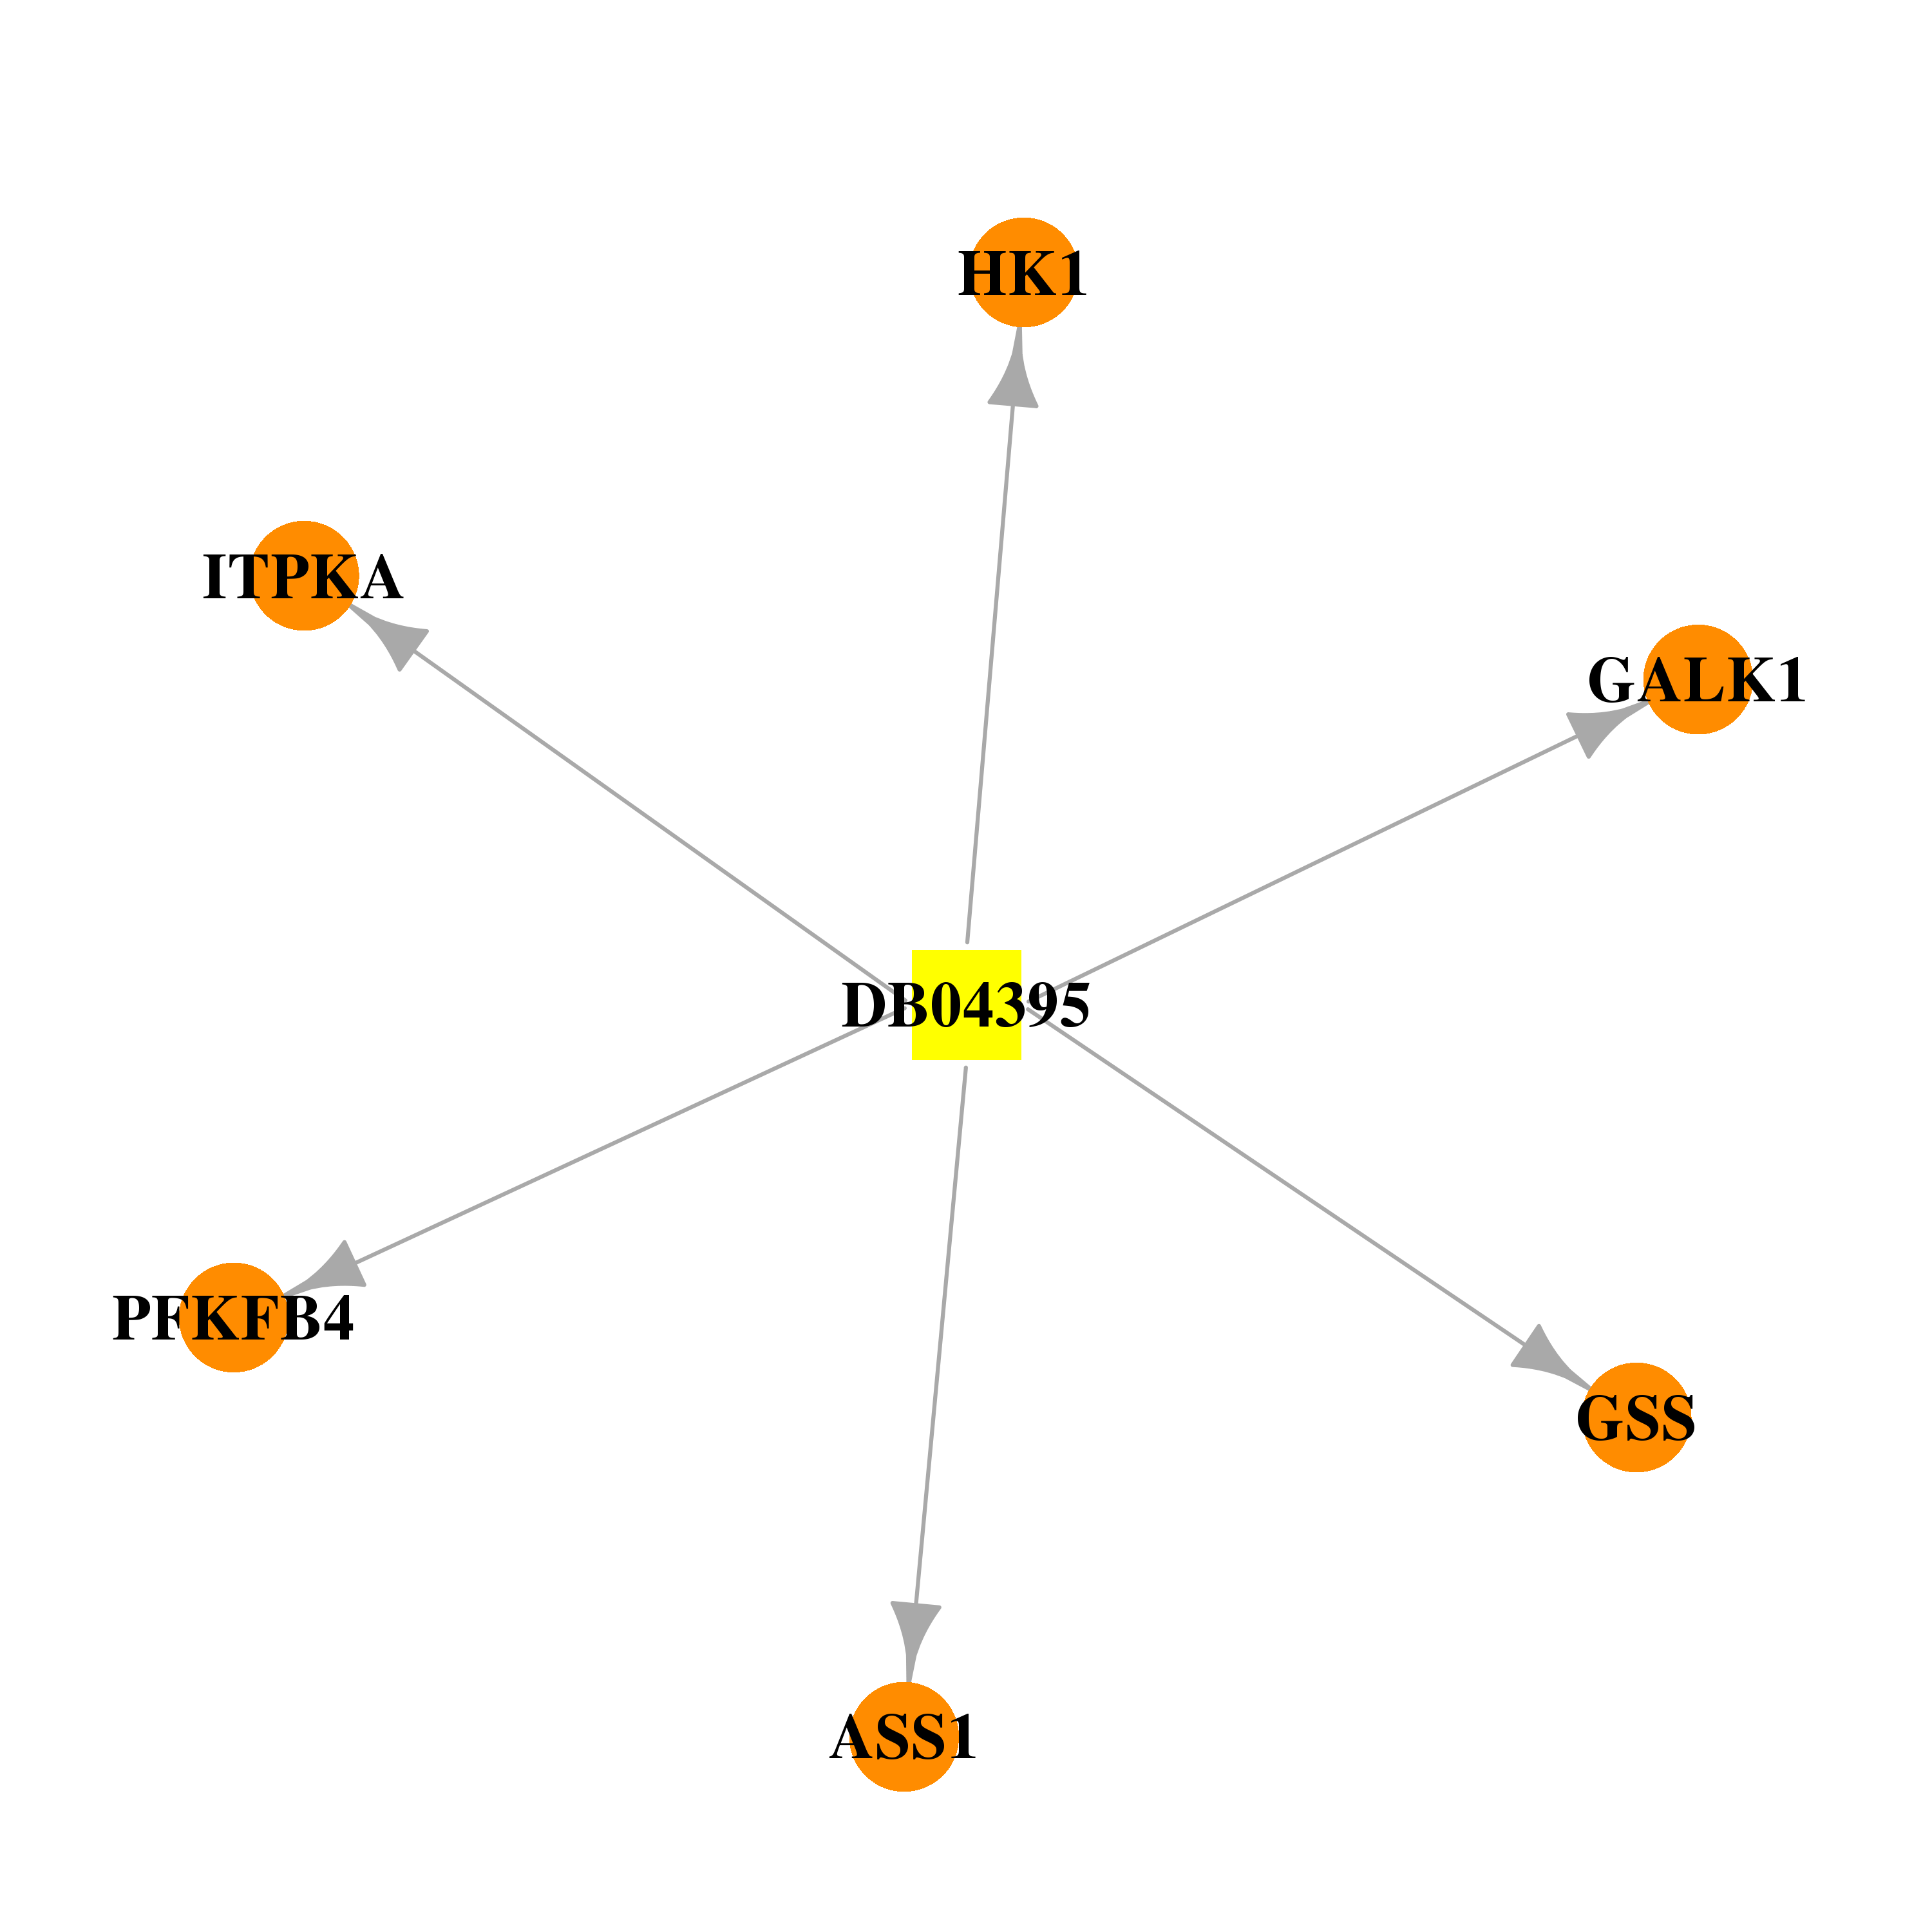 | 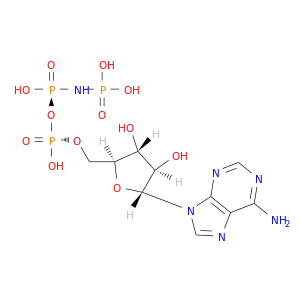 |
| DB00536 | argininosuccinate synthase 1 | approved | Guanidine | 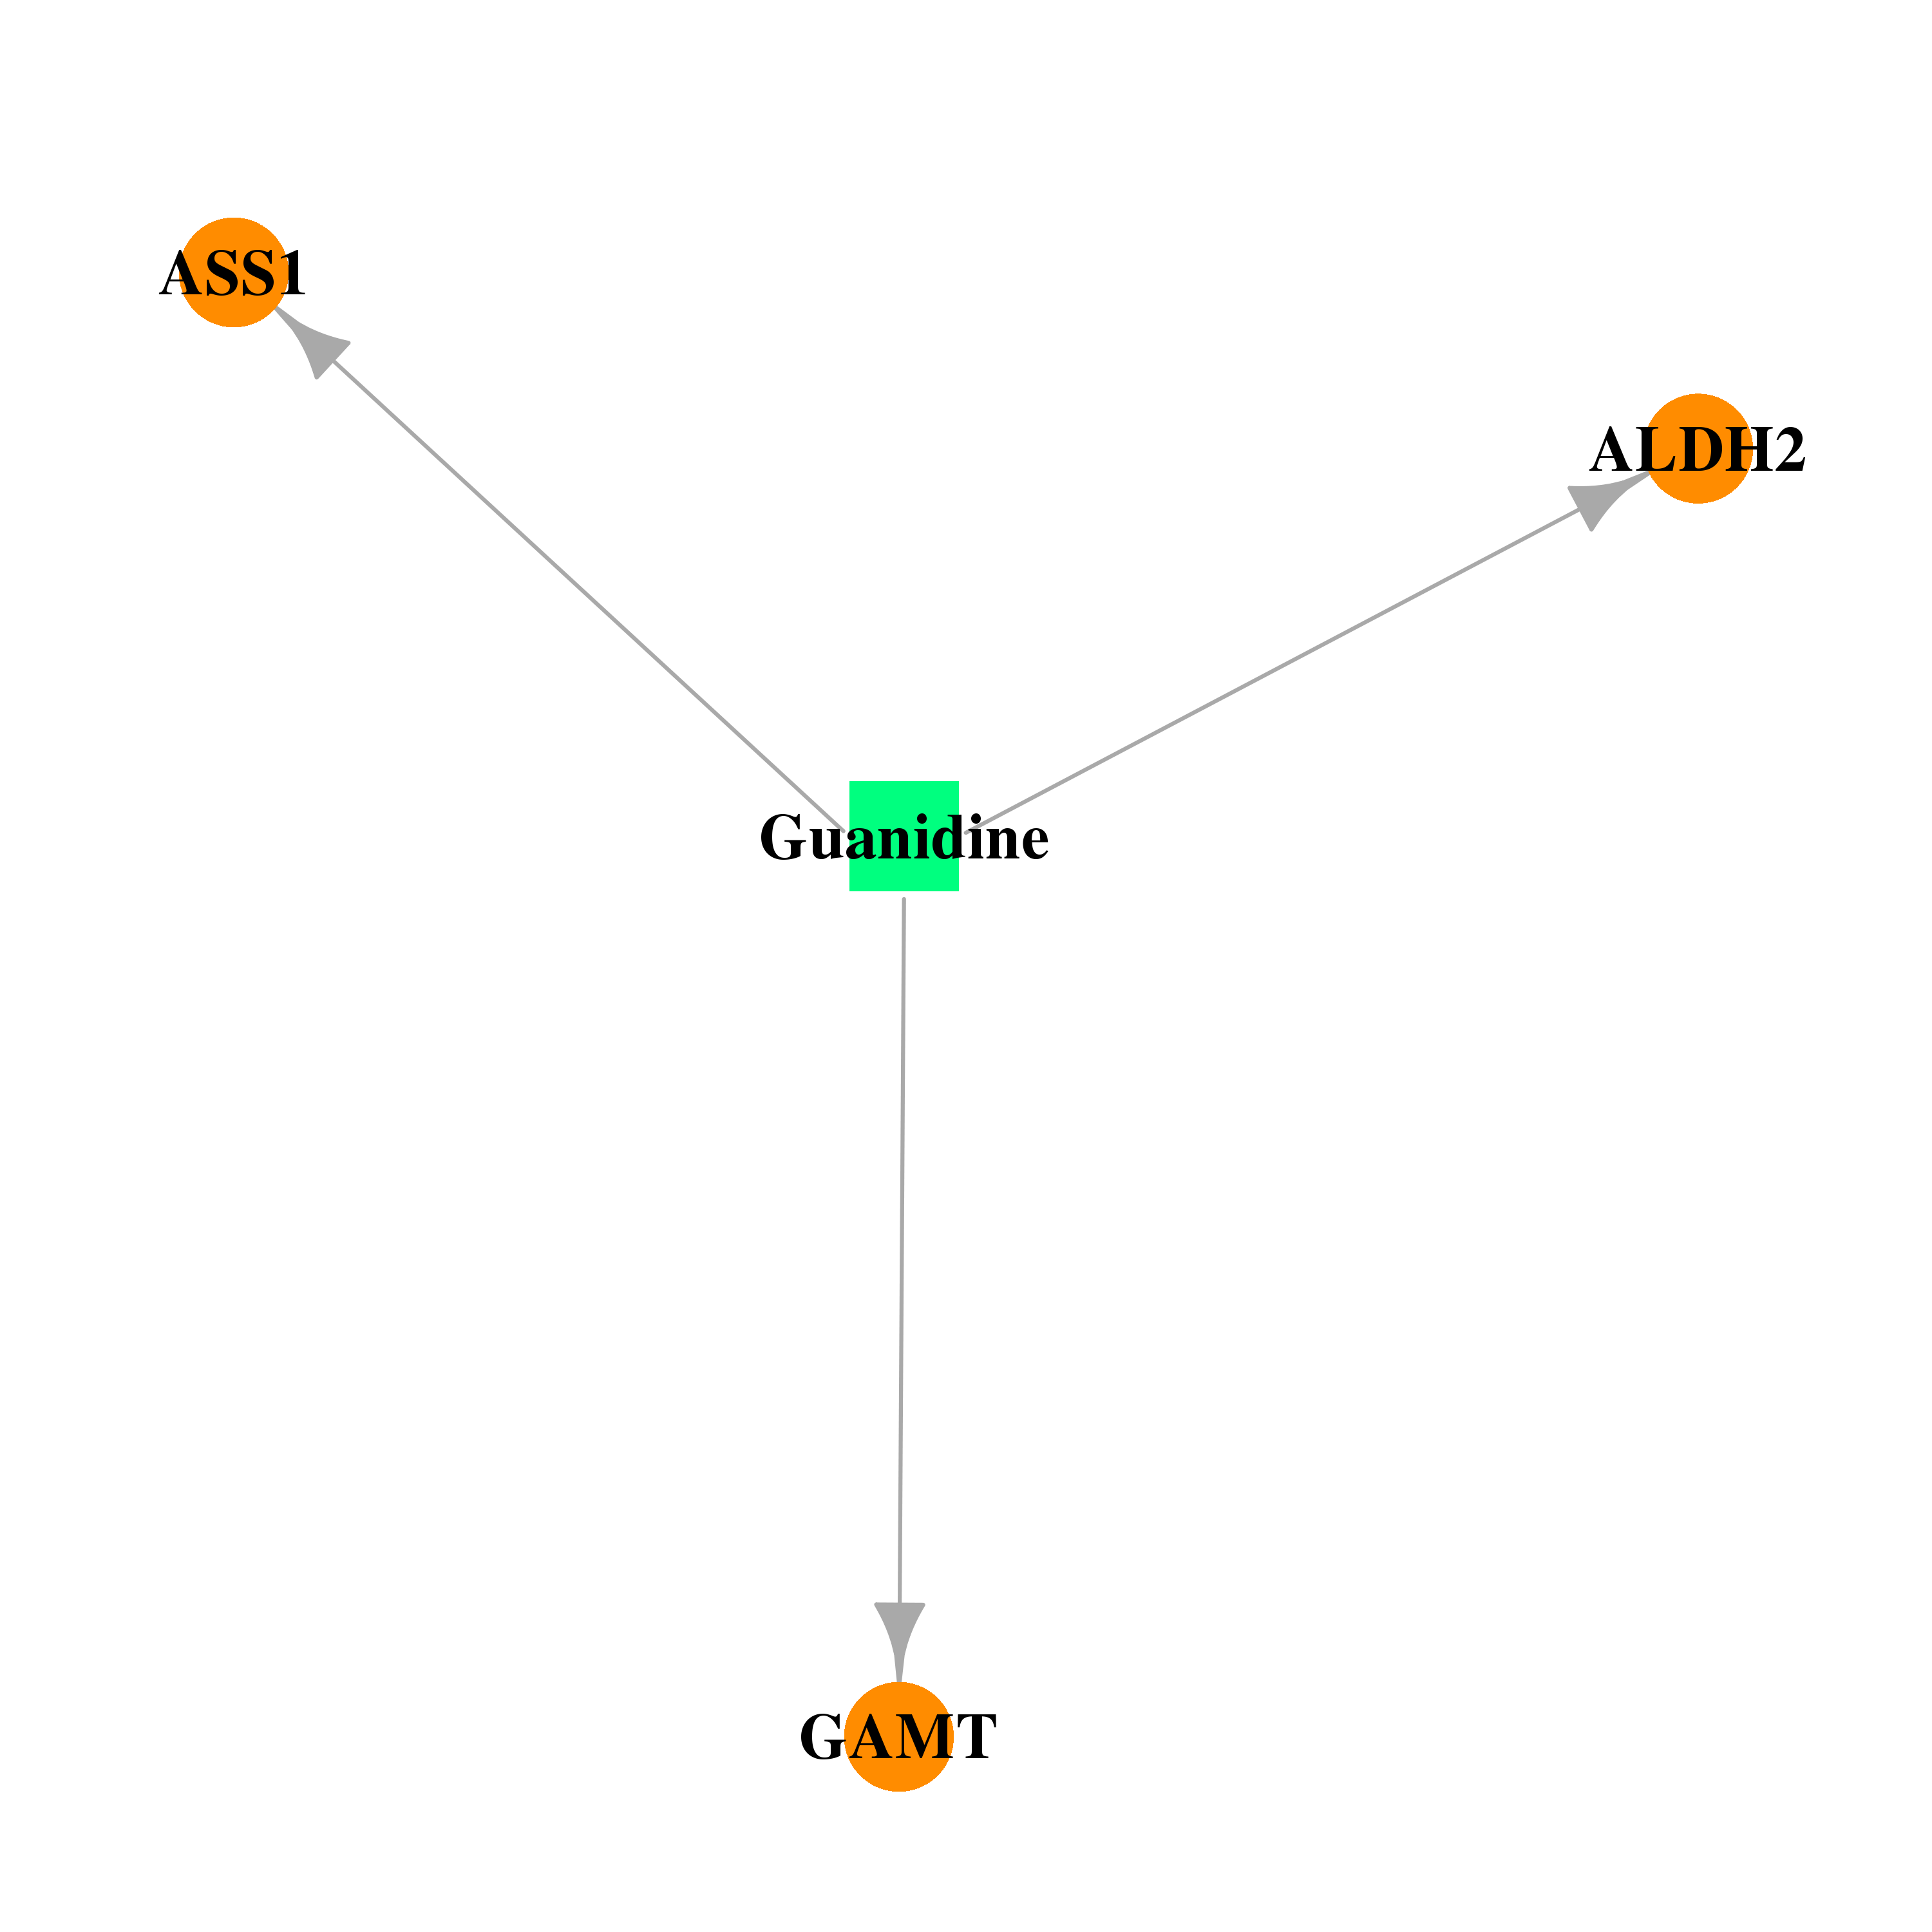 | 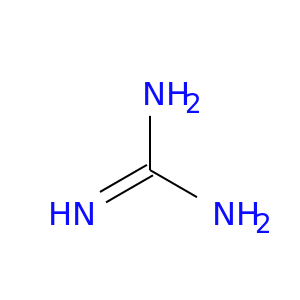 |
| DB04077 | argininosuccinate synthase 1 | experimental | Glycerol | 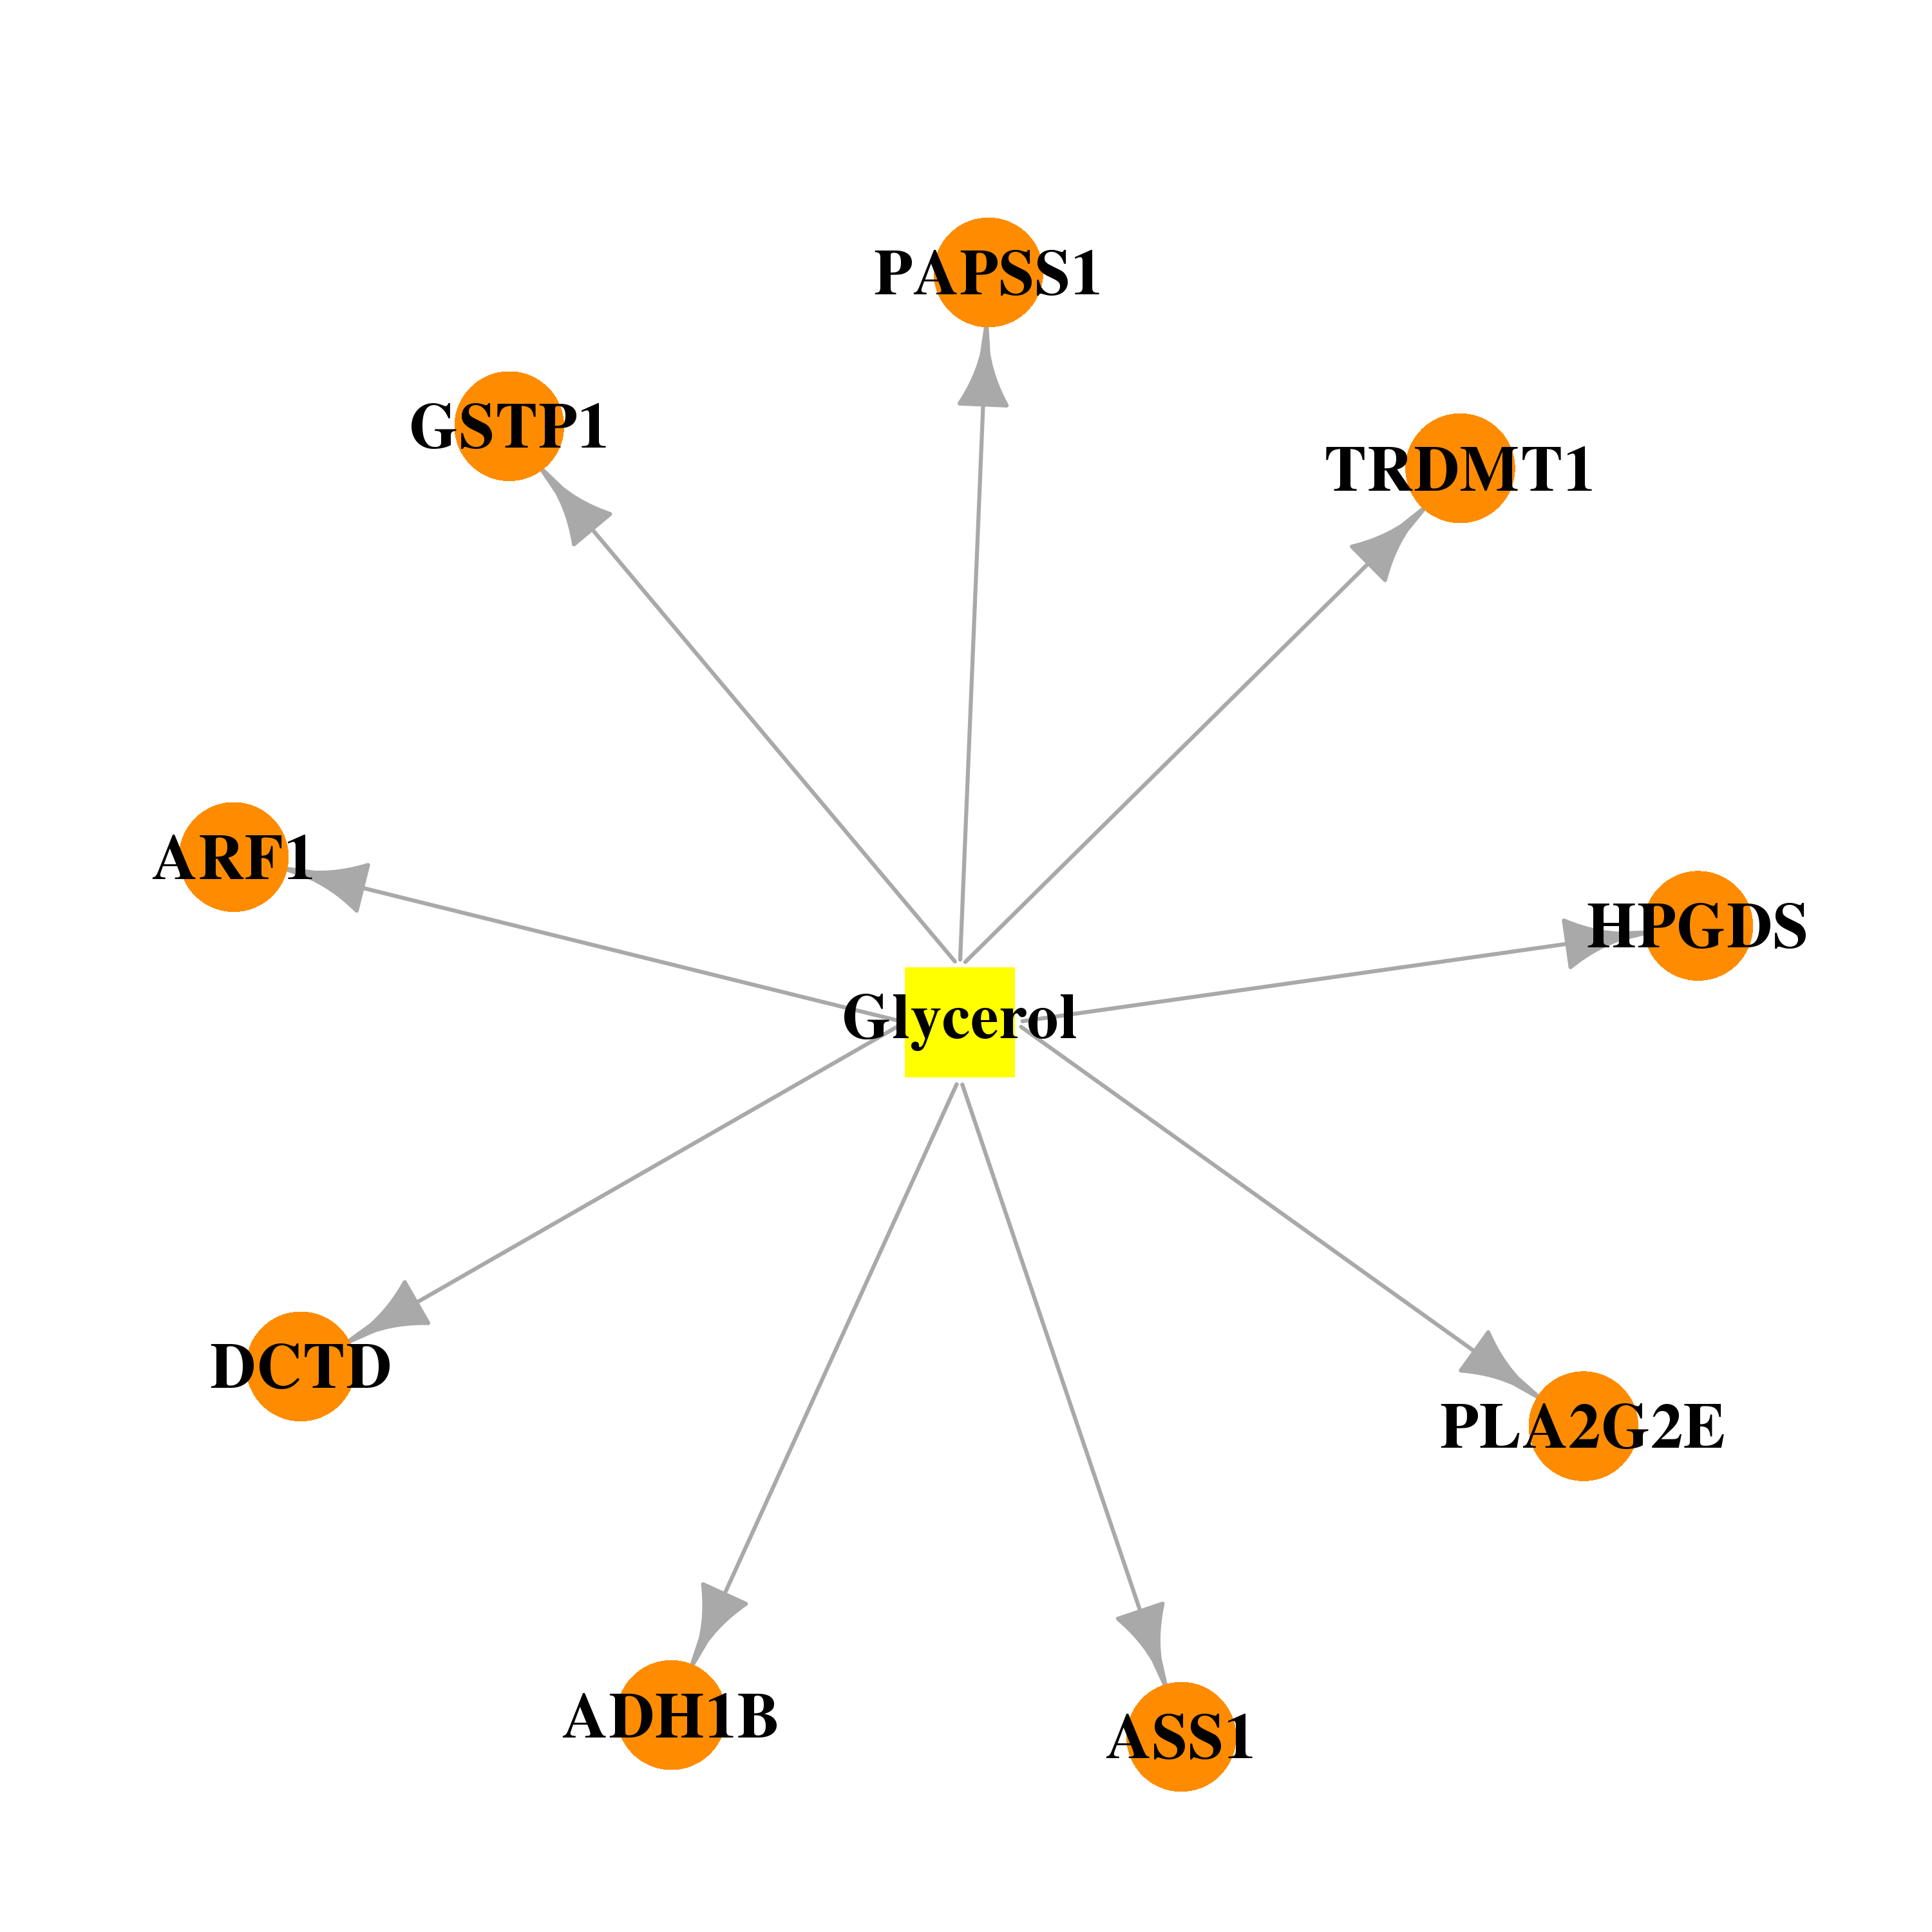 |  |
| DB03904 | argininosuccinate synthase 1 | experimental | Urea |  |  |
| Top |
| Cross referenced IDs for ASS1 |
| * We obtained these cross-references from Uniprot database. It covers 150 different DBs, 18 categories. http://www.uniprot.org/help/cross_references_section |
: Open all cross reference information
|
Copyright © 2016-Present - The Univsersity of Texas Health Science Center at Houston @ |