|
|||||||||||||||||||||||||||||||||||||||||||||||||||||||||||||||||||||||||||||||||||||||||||||||||||||||||||||||||||||||||||||||||||||||||||||||||||||||||||||||||||||||||||||||||||||||||||||||||||||||||||||||||||||||||||||||||||||||||||||||||||||||||||||||||||||||||||||||||||||||||||||||||||||||||||||||||||||||||||||||||||||||||||||||||||||||||||||||||||||||||||||||||||||||||||||
| |
| Phenotypic Information (metabolism pathway, cancer, disease, phenome) |
| |
| |
| Gene-Gene Network Information: Co-Expression Network, Interacting Genes & KEGG |
| |
|


| Gene Summary for MTAP |
| Basic gene info. | Gene symbol | MTAP |
| Gene name | methylthioadenosine phosphorylase | |
| Synonyms | BDMF|DMSFH|DMSMFH|HEL-249|LGMBF|MSAP|c86fus | |
| Cytomap | UCSC genome browser: 9p21 | |
| Genomic location | chr9 :21802634-21865969 | |
| Type of gene | protein-coding | |
| RefGenes | NM_002451.3, | |
| Ensembl id | ENSG00000099810 | |
| Description | 5'-methylthioadenosine phosphorylaseMTA phosphorylaseMTAPaseMeSAdo phosphorylaseS-methyl-5'-thioadenosine phosphorylaseepididymis luminal protein 249 | |
| Modification date | 20141207 | |
| dbXrefs | MIM : 156540 | |
| HGNC : HGNC | ||
| Ensembl : ENSG00000099810 | ||
| HPRD : 01134 | ||
| Vega : OTTHUMG00000019690 | ||
| Protein | UniProt: Q13126 go to UniProt's Cross Reference DB Table | |
| Expression | CleanEX: HS_MTAP | |
| BioGPS: 4507 | ||
| Gene Expression Atlas: ENSG00000099810 | ||
| The Human Protein Atlas: ENSG00000099810 | ||
| Pathway | NCI Pathway Interaction Database: MTAP | |
| KEGG: MTAP | ||
| REACTOME: MTAP | ||
| ConsensusPathDB | ||
| Pathway Commons: MTAP | ||
| Metabolism | MetaCyc: MTAP | |
| HUMANCyc: MTAP | ||
| Regulation | Ensembl's Regulation: ENSG00000099810 | |
| miRBase: chr9 :21,802,634-21,865,969 | ||
| TargetScan: NM_002451 | ||
| cisRED: ENSG00000099810 | ||
| Context | iHOP: MTAP | |
| cancer metabolism search in PubMed: MTAP | ||
| UCL Cancer Institute: MTAP | ||
| Assigned class in ccmGDB | A - This gene has a literature evidence and it belongs to cancer gene. | |
| References showing role of MTAP in cancer cell metabolism | 1. Shlomi T, Fan J, Tang B, Kruger WD, Rabinowitz JD (2014) Quantitation of cellular metabolic fluxes of methionine. Analytical chemistry 86: 1583-1591. go to article 2. Munshi PN, Lubin M, Bertino JR (2014) 6-Thioguanine: A drug with unrealized potential for cancer therapy. The oncologist: theoncologist. 2014-0178. go to article | |
| Top |
| Phenotypic Information for MTAP(metabolism pathway, cancer, disease, phenome) |
| Cancer | CGAP: MTAP |
| Familial Cancer Database: MTAP | |
| * This gene is included in those cancer gene databases. |
|
|
|
|
|
| . | |||||||||||||||||||||||||||||||||||||||||||||||||||||||||||||||||||||||||||||||||||||||||||||||||||||||||||||||||||||||||||||||||||||||||||||||||||||||||||||||||||||||||||||||||||||||||||||||||||||||||||||||||||||||||||||||||||||||||||||||||||||||||||||||||||||||||||||||||||||||||||||||||||||||||||||||||||||||||||||||||||||||||||||||||||||||||||||||||||||||||||||||||||||||
Oncogene 1 | Significant driver gene in | ||||||||||||||||||||||||||||||||||||||||||||||||||||||||||||||||||||||||||||||||||||||||||||||||||||||||||||||||||||||||||||||||||||||||||||||||||||||||||||||||||||||||||||||||||||||||||||||||||||||||||||||||||||||||||||||||||||||||||||||||||||||||||||||||||||||||||||||||||||||||||||||||||||||||||||||||||||||||||||||||||||||||||||||||||||||||||||||||||||||||||||||||||||||||||||
| cf) number; DB name 1 Oncogene; http://nar.oxfordjournals.org/content/35/suppl_1/D721.long, 2 Tumor Suppressor gene; https://bioinfo.uth.edu/TSGene/, 3 Cancer Gene Census; http://www.nature.com/nrc/journal/v4/n3/abs/nrc1299.html, 4 CancerGenes; http://nar.oxfordjournals.org/content/35/suppl_1/D721.long, 5 Network of Cancer Gene; http://ncg.kcl.ac.uk/index.php, 1Therapeutic Vulnerabilities in Cancer; http://cbio.mskcc.org/cancergenomics/statius/ |
| KEGG_CYSTEINE_AND_METHIONINE_METABOLISM REACTOME_SULFUR_AMINO_ACID_METABOLISM REACTOME_METABOLISM_OF_AMINO_ACIDS_AND_DERIVATIVES REACTOME_METABOLISM_OF_POLYAMINES | |
| OMIM | 112250; phenotype. 112250; phenotype. 156540; gene. 156540; gene. |
| Orphanet | 85182; Diaphyseal medullary stenosis - bone malignancy. 85182; Diaphyseal medullary stenosis - bone malignancy. |
| Disease | KEGG Disease: MTAP |
| MedGen: MTAP (Human Medical Genetics with Condition) | |
| ClinVar: MTAP | |
| Phenotype | MGI: MTAP (International Mouse Phenotyping Consortium) |
| PhenomicDB: MTAP | |
| Mutations for MTAP |
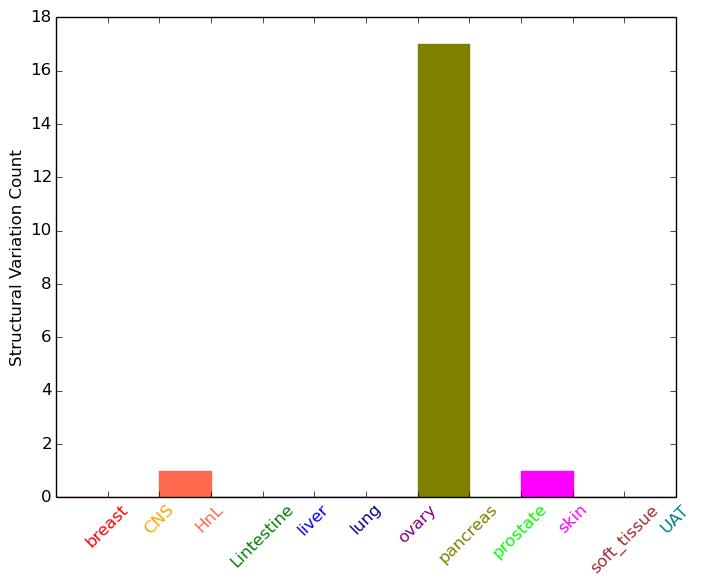
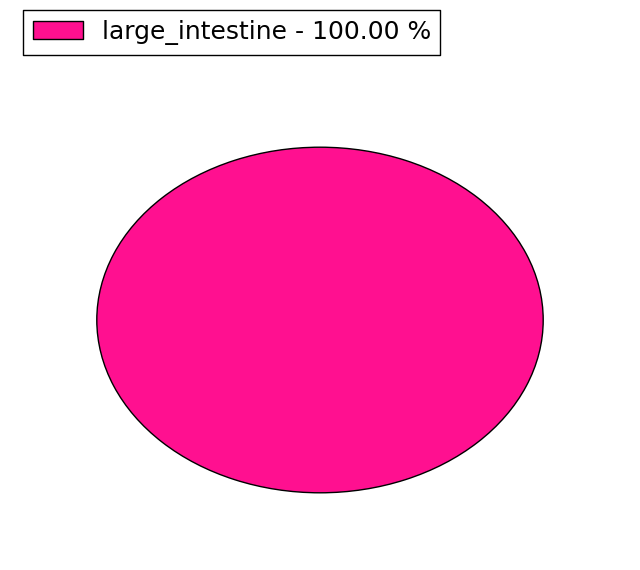
| * Under tables are showing count per each tissue to give us broad intuition about tissue specific mutation patterns.You can go to the detailed page for each mutation database's web site. |
| - Statistics for Tissue and Mutation type | Top |
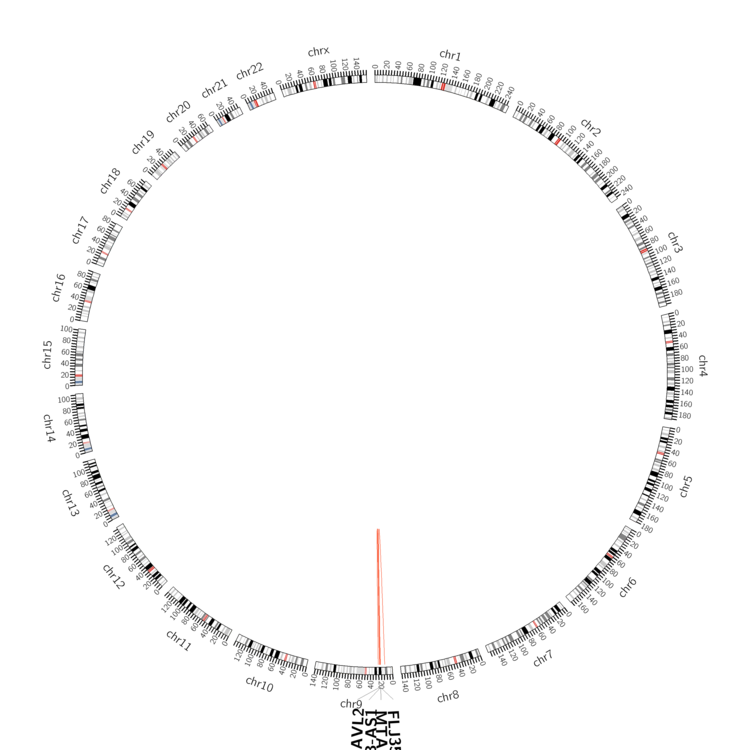 |
| - For Inter-chromosomal Variations |
| There's no inter-chromosomal structural variation. |
| - For Intra-chromosomal Variations |
| * Intra-chromosomal variantions includes 'intrachromosomal amplicon to amplicon', 'intrachromosomal amplicon to non-amplified dna', 'intrachromosomal deletion', 'intrachromosomal fold-back inversion', 'intrachromosomal inversion', 'intrachromosomal tandem duplication', 'Intrachromosomal unknown type', 'intrachromosomal with inverted orientation', 'intrachromosomal with non-inverted orientation'. |
 |
| Sample | Symbol_a | Chr_a | Start_a | End_a | Symbol_b | Chr_b | Start_b | End_b |
| haematopoietic_and_lymphoid_tissue | MTAP | chr9 | 21848957 | 21848957 | MTAP | chr9 | 21848957 | 21848957 |
| pancreas | MTAP | chr9 | 21802628 | 21802648 | chr9 | 13766693 | 13766713 | |
| pancreas | MTAP | chr9 | 21803377 | 21803397 | MTAP | chr9 | 21803677 | 21803697 |
| pancreas | MTAP | chr9 | 21812289 | 21812309 | chr9 | 22237408 | 22237428 | |
| pancreas | MTAP | chr9 | 21821029 | 21821049 | chr9 | 22518205 | 22518225 | |
| pancreas | MTAP | chr9 | 21828665 | 21828685 | MTAP | chr9 | 21829729 | 21829749 |
| pancreas | MTAP | chr9 | 21828675 | 21828695 | MTAP | chr9 | 21829912 | 21829932 |
| pancreas | MTAP | chr9 | 21829139 | 21829159 | chr9 | 22572342 | 22572362 | |
| pancreas | MTAP | chr9 | 21829732 | 21829752 | MTAP | chr9 | 21829920 | 21829940 |
| pancreas | MTAP | chr9 | 21833558 | 21833578 | CDKN2B-AS1 | chr9 | 22023490 | 22023510 |
| pancreas | MTAP | chr9 | 21840363 | 21840363 | chr9 | 22834629 | 22834629 | |
| pancreas | MTAP | chr9 | 21842693 | 21842713 | CDKN2B-AS1 | chr9 | 22047646 | 22047666 |
| pancreas | MTAP | chr9 | 21849319 | 21849319 | ELAVL2 | chr9 | 23745195 | 23745195 |
| pancreas | MTAP | chr9 | 21851148 | 21851168 | CDKN2B-AS1 | chr9 | 22076414 | 22076434 |
| pancreas | MTAP | chr9 | 21855379 | 21855399 | chr9 | 25852755 | 25852775 | |
| pancreas | MTAP | chr9 | 21860741 | 21860761 | CDKN2B-AS1 | chr9 | 22026721 | 22026741 |
| pancreas | MTAP | chr9 | 21864488 | 21864508 | chr9 | 22320545 | 22320565 | |
| pancreas | MTAP | chr9 | 21865657 | 21865677 | CDKN2B-AS1 | chr9 | 22085313 | 22085333 |
| skin | MTAP | chr9 | 21810667 | 21810667 | FLJ35282 | chr9 | 22697036 | 22697036 |
| cf) Tissue number; Tissue name (1;Breast, 2;Central_nervous_system, 3;Haematopoietic_and_lymphoid_tissue, 4;Large_intestine, 5;Liver, 6;Lung, 7;Ovary, 8;Pancreas, 9;Prostate, 10;Skin, 11;Soft_tissue, 12;Upper_aerodigestive_tract) |
| * From mRNA Sanger sequences, Chitars2.0 arranged chimeric transcripts. This table shows MTAP related fusion information. |
| ID | Head Gene | Tail Gene | Accession | Gene_a | qStart_a | qEnd_a | Chromosome_a | tStart_a | tEnd_a | Gene_a | qStart_a | qEnd_a | Chromosome_a | tStart_a | tEnd_a |
| CN365873 | MTAP | 1 | 110 | 9 | 21970908 | 21971017 | MTAP | 105 | 167 | 9 | 21974715 | 21974777 | |
| CR738223 | UPF2 | 1 | 61 | 10 | 12011461 | 12011521 | MTAP | 55 | 220 | 9 | 21861026 | 21861193 | |
| Top |
| Mutation type/ Tissue ID | brca | cns | cerv | endome | haematopo | kidn | Lintest | liver | lung | ns | ovary | pancre | prost | skin | stoma | thyro | urina | |||
| Total # sample | 5 | 29 | 1 | 1 | 14 | 1 | 14 | 4 | 12 | |||||||||||
| GAIN (# sample) | 1 | 1 | ||||||||||||||||||
| LOSS (# sample) | 4 | 29 | 1 | 1 | 14 | 14 | 4 | 12 |
| cf) Tissue ID; Tissue type (1; Breast, 2; Central_nervous_system, 3; Cervix, 4; Endometrium, 5; Haematopoietic_and_lymphoid_tissue, 6; Kidney, 7; Large_intestine, 8; Liver, 9; Lung, 10; NS, 11; Ovary, 12; Pancreas, 13; Prostate, 14; Skin, 15; Stomach, 16; Thyroid, 17; Urinary_tract) |
| Top |
|
 |
| Top |
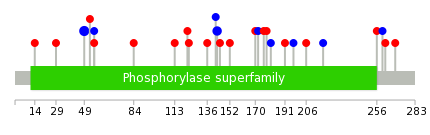
| Stat. for Non-Synonymous SNVs (# total SNVs=14) | (# total SNVs=9) |
 |  |
(# total SNVs=1) | (# total SNVs=0) |
 |
| Top |
| * When you move the cursor on each content, you can see more deailed mutation information on the Tooltip. Those are primary_site,primary_histology,mutation(aa),pubmedID. |
| GRCh37 position | Mutation(aa) | Unique sampleID count |
| chr9:21816739-21816739 | p.K49K | 3 |
| chr9:21837988-21837988 | p.P143P | 2 |
| chr9:21854833-21854833 | p.A218A | 1 |
| chr9:21837992-21837992 | p.C145G | 1 |
| chr9:21859377-21859377 | p.P256S | 1 |
| chr9:21816750-21816750 | p.V53A | 1 |
| chr9:21854633-21854633 | p.L152F | 1 |
| chr9:21859391-21859391 | p.S260S | 1 |
| chr9:21816758-21816758 | p.V56I | 1 |
| chr9:21854687-21854687 | p.V170I | 1 |
| Top |
|
 |
| Point Mutation/ Tissue ID | 1 | 2 | 3 | 4 | 5 | 6 | 7 | 8 | 9 | 10 | 11 | 12 | 13 | 14 | 15 | 16 | 17 | 18 | 19 | 20 |
| # sample | 1 | 1 | 2 | 3 | 1 | 2 | 5 | 1 | 7 | |||||||||||
| # mutation | 1 | 1 | 2 | 3 | 1 | 2 | 7 | 1 | 8 | |||||||||||
| nonsynonymous SNV | 1 | 2 | 2 | 2 | 4 | 1 | 4 | |||||||||||||
| synonymous SNV | 1 | 1 | 1 | 3 | 4 |
| cf) Tissue ID; Tissue type (1; BLCA[Bladder Urothelial Carcinoma], 2; BRCA[Breast invasive carcinoma], 3; CESC[Cervical squamous cell carcinoma and endocervical adenocarcinoma], 4; COAD[Colon adenocarcinoma], 5; GBM[Glioblastoma multiforme], 6; Glioma Low Grade, 7; HNSC[Head and Neck squamous cell carcinoma], 8; KICH[Kidney Chromophobe], 9; KIRC[Kidney renal clear cell carcinoma], 10; KIRP[Kidney renal papillary cell carcinoma], 11; LAML[Acute Myeloid Leukemia], 12; LUAD[Lung adenocarcinoma], 13; LUSC[Lung squamous cell carcinoma], 14; OV[Ovarian serous cystadenocarcinoma ], 15; PAAD[Pancreatic adenocarcinoma], 16; PRAD[Prostate adenocarcinoma], 17; SKCM[Skin Cutaneous Melanoma], 18:STAD[Stomach adenocarcinoma], 19:THCA[Thyroid carcinoma], 20:UCEC[Uterine Corpus Endometrial Carcinoma]) |
| Top |
| * We represented just top 10 SNVs. When you move the cursor on each content, you can see more deailed mutation information on the Tooltip. Those are primary_site, primary_histology, mutation(aa), pubmedID. |
| Genomic Position | Mutation(aa) | Unique sampleID count |
| chr9:21837988 | p.P143P | 2 |
| chr9:21859395 | p.F113L | 1 |
| chr9:21816760 | p.A218A | 1 |
| chr9:21854706 | p.S123F | 1 |
| chr9:21818104 | p.P256S | 1 |
| chr9:21854712 | p.C136R | 1 |
| chr9:21818193 | p.S260S | 1 |
| chr9:21854722 | p.E142E | 1 |
| chr9:21837927 | p.E262K | 1 |
| chr9:21854770 | p.C145G | 1 |
| * Copy number data were extracted from TCGA using R package TCGA-Assembler. The URLs of all public data files on TCGA DCC data server were gathered on Jan-05-2015. Function ProcessCNAData in TCGA-Assembler package was used to obtain gene-level copy number value which is calculated as the average copy number of the genomic region of a gene. |
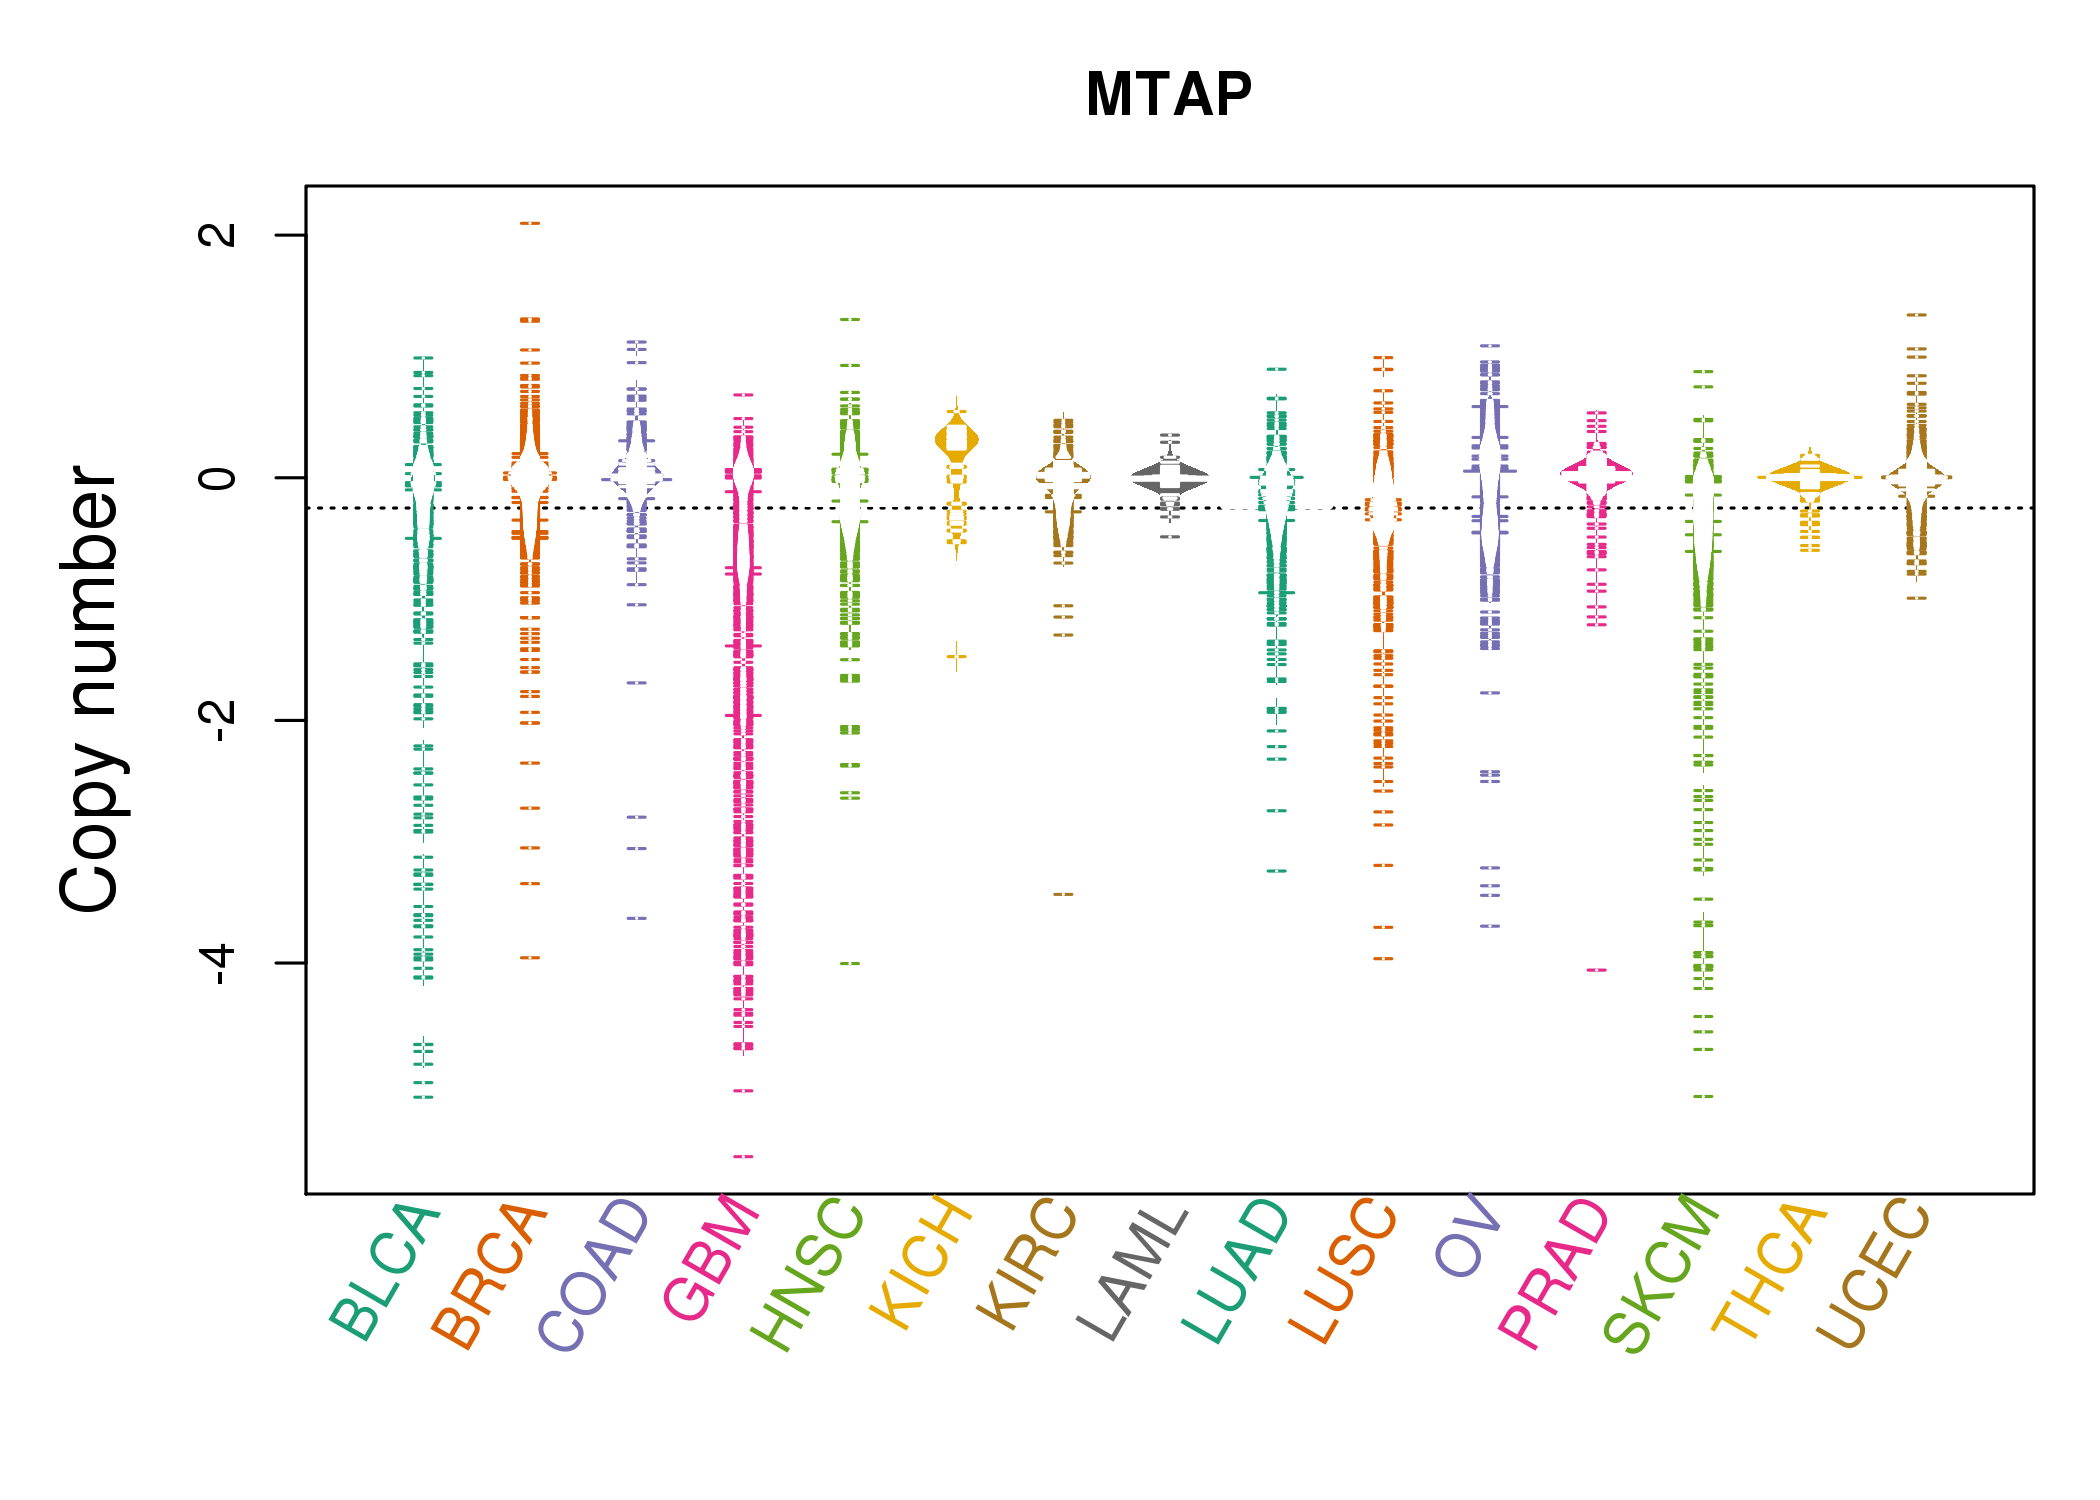 |
| cf) Tissue ID[Tissue type]: BLCA[Bladder Urothelial Carcinoma], BRCA[Breast invasive carcinoma], CESC[Cervical squamous cell carcinoma and endocervical adenocarcinoma], COAD[Colon adenocarcinoma], GBM[Glioblastoma multiforme], Glioma Low Grade, HNSC[Head and Neck squamous cell carcinoma], KICH[Kidney Chromophobe], KIRC[Kidney renal clear cell carcinoma], KIRP[Kidney renal papillary cell carcinoma], LAML[Acute Myeloid Leukemia], LUAD[Lung adenocarcinoma], LUSC[Lung squamous cell carcinoma], OV[Ovarian serous cystadenocarcinoma ], PAAD[Pancreatic adenocarcinoma], PRAD[Prostate adenocarcinoma], SKCM[Skin Cutaneous Melanoma], STAD[Stomach adenocarcinoma], THCA[Thyroid carcinoma], UCEC[Uterine Corpus Endometrial Carcinoma] |
| Top |
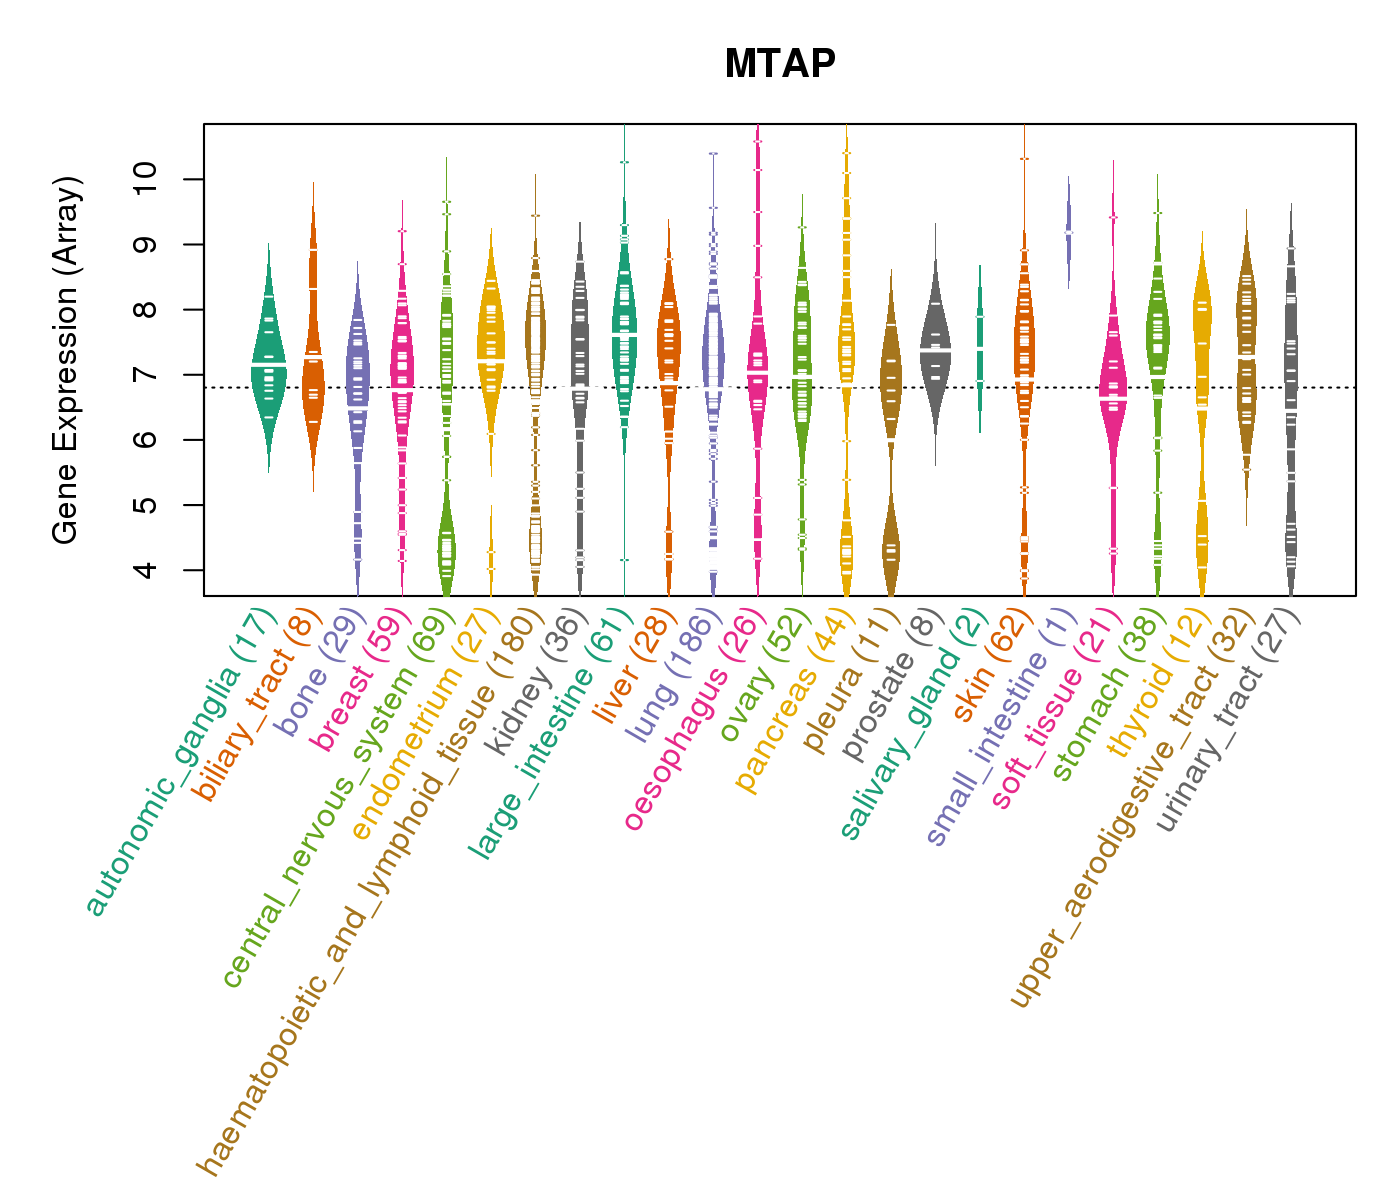
| Gene Expression for MTAP |
| * CCLE gene expression data were extracted from CCLE_Expression_Entrez_2012-10-18.res: Gene-centric RMA-normalized mRNA expression data. |
 |
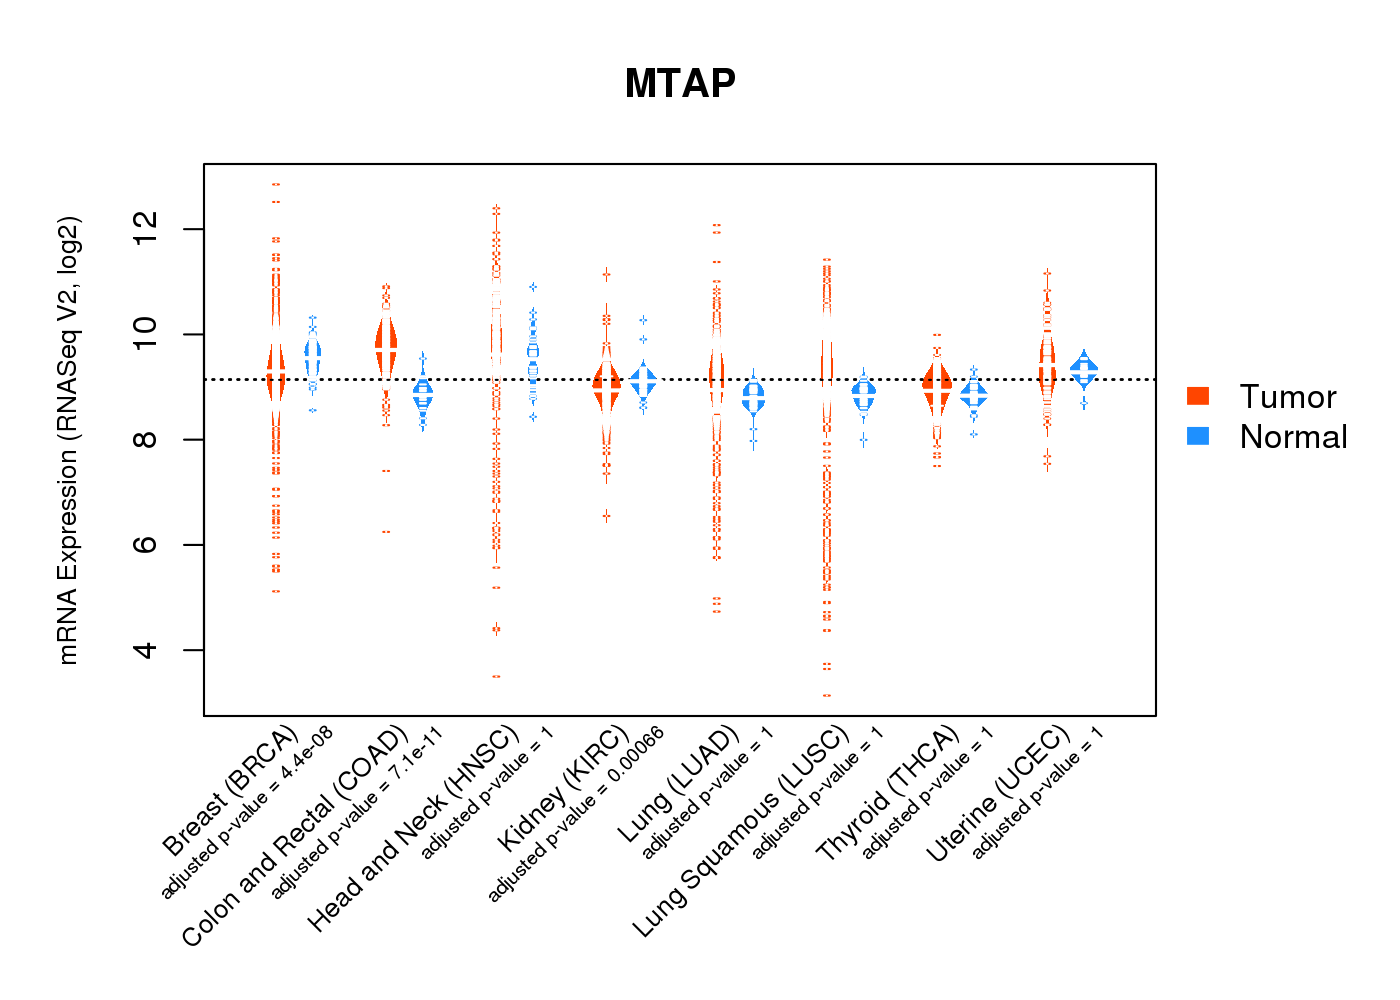
| * Normalized gene expression data of RNASeqV2 was extracted from TCGA using R package TCGA-Assembler. The URLs of all public data files on TCGA DCC data server were gathered at Jan-05-2015. Only eight cancer types have enough normal control samples for differential expression analysis. (t test, adjusted p<0.05 (using Benjamini-Hochberg FDR)) |
 |
| Top |
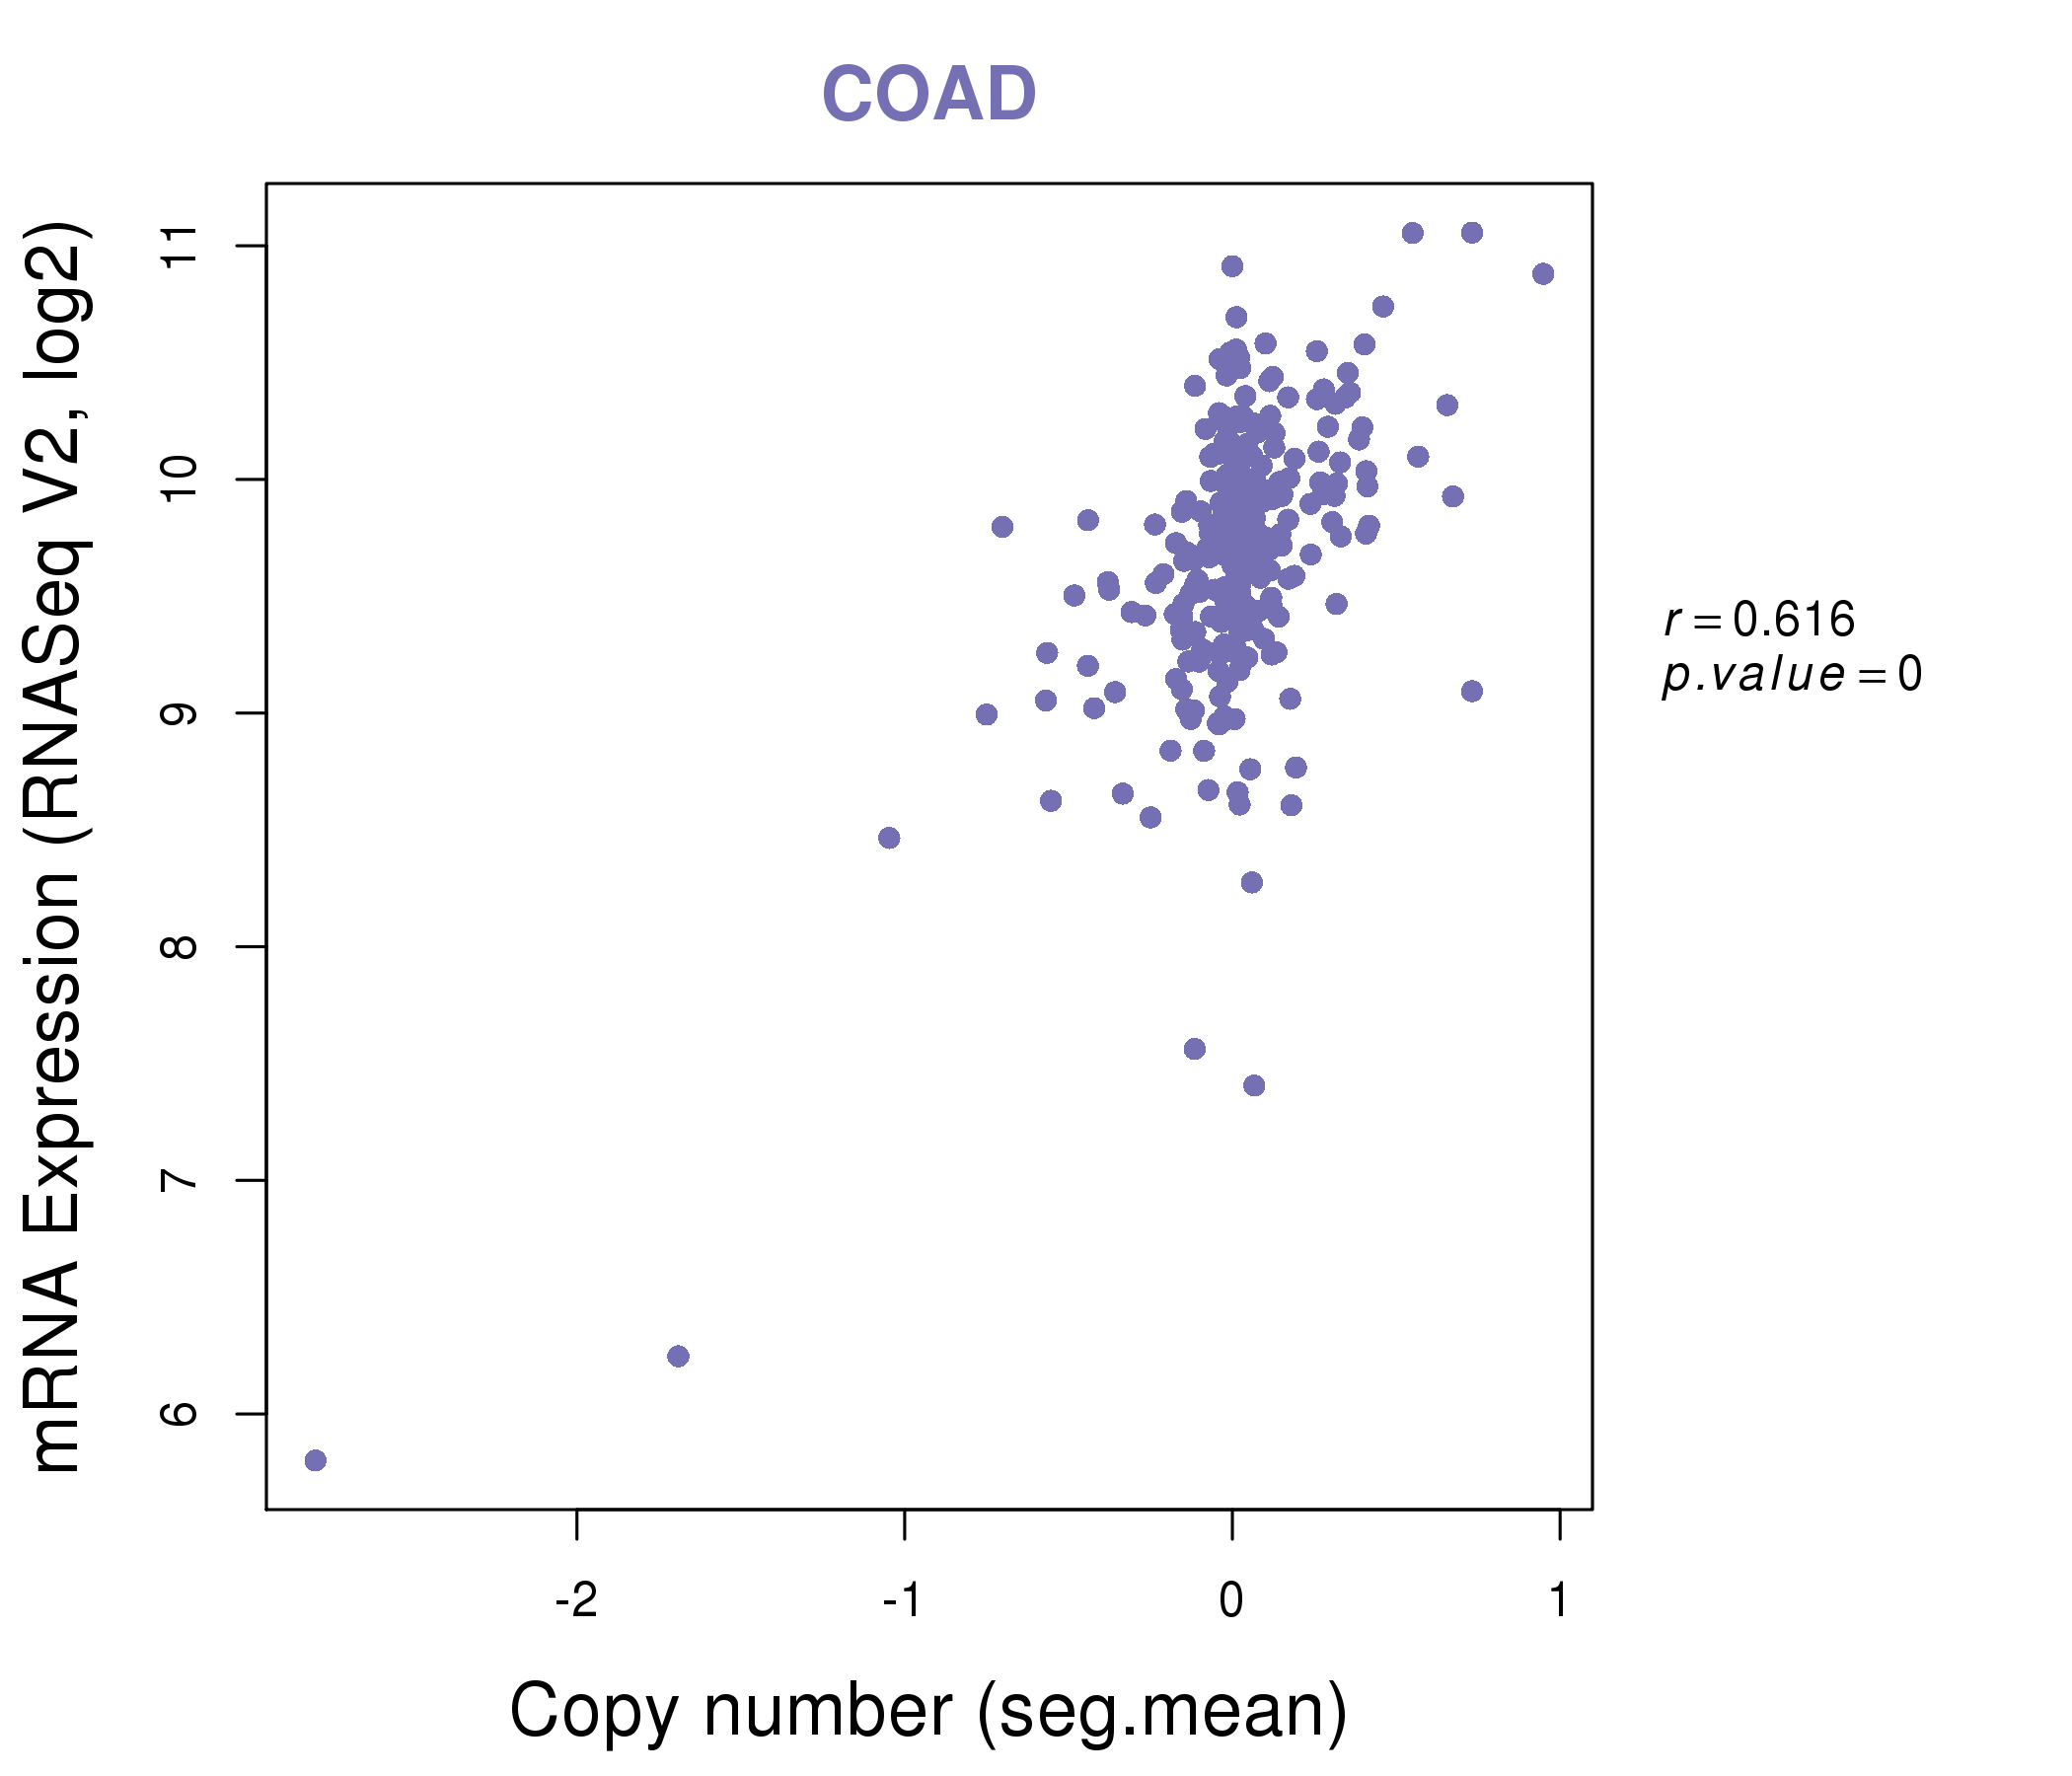
| * This plots show the correlation between CNV and gene expression. |
: Open all plots for all cancer types
 |
|
 |
|


| Top |
| Gene-Gene Network Information |
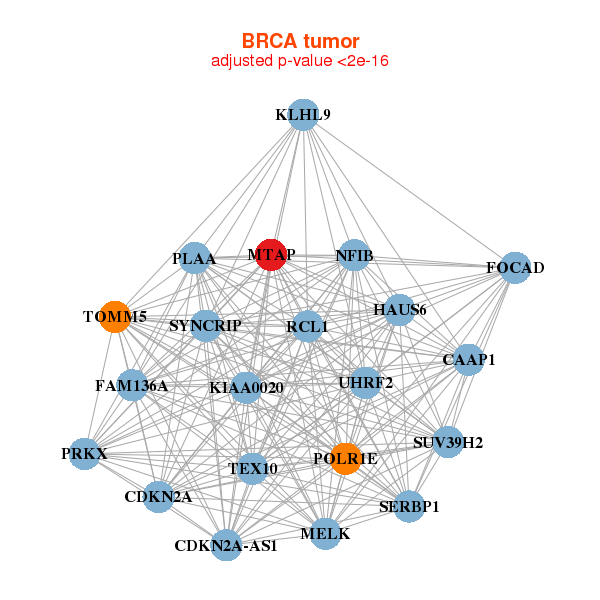
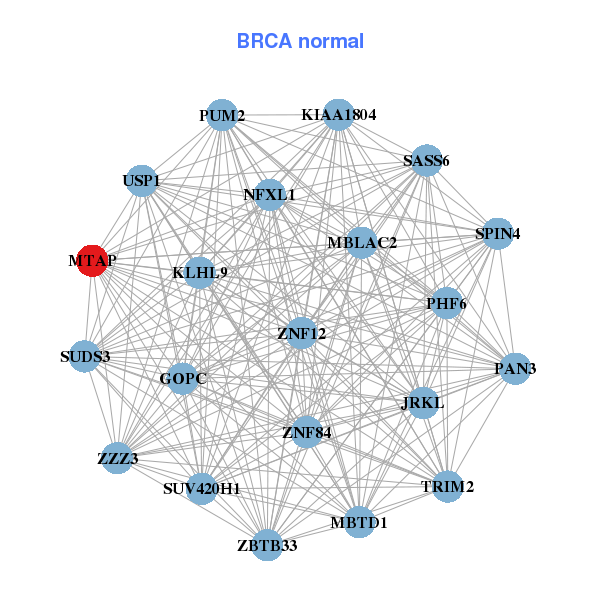
| * Co-Expression network figures were drawn using R package igraph. Only the top 20 genes with the highest correlations were shown. Red circle: input gene, orange circle: cell metabolism gene, sky circle: other gene |
: Open all plots for all cancer types
 |
| ||||
| CDKN2A-AS1,CAAP1,CDKN2A,FAM136A,HAUS6,KIAA0020,FOCAD, KLHL9,MELK,MTAP,NFIB,PLAA,POLR1E,PRKX, RCL1,SERBP1,SUV39H2,SYNCRIP,TEX10,TOMM5,UHRF2 | GOPC,JRKL,KIAA1804,KLHL9,MBLAC2,MBTD1,MTAP, NFXL1,PAN3,PHF6,PUM2,SASS6,SPIN4,SUDS3, SUV420H1,TRIM2,USP1,ZBTB33,ZNF12,ZNF84,ZZZ3 | ||||
 |
| ||||
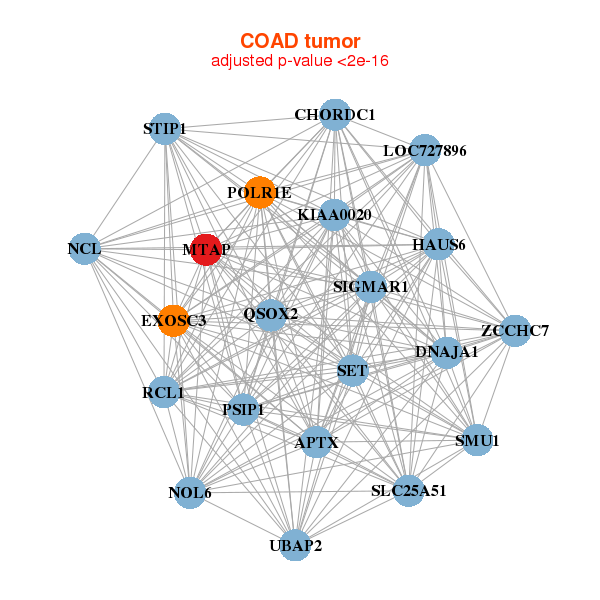
| APTX,CHORDC1,DNAJA1,EXOSC3,HAUS6,KIAA0020,LOC727896, SLC25A51,MTAP,NCL,NOL6,POLR1E,PSIP1,QSOX2, RCL1,SET,SIGMAR1,SMU1,STIP1,UBAP2,ZCCHC7 | AP3M1,ARMCX3,KANSL1L,C3orf58,DDX19A,DHX57,EIF5B, GEMIN5,HLTF,IPO7,CFAP97,LOC221710,LRRC58,MTAP, MYEF2,NEDD1,NUCKS1,JADE3,PHF20,TOMM70A,ZMYM4 |
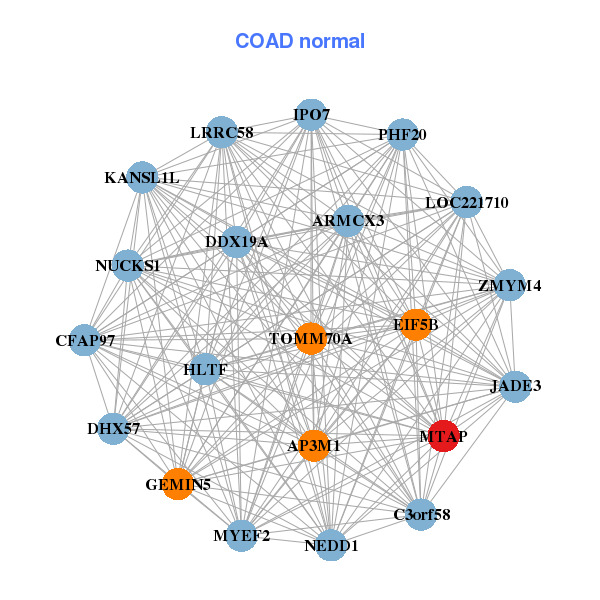
| * Co-Expression network figures were drawn using R package igraph. Only the top 20 genes with the highest correlations were shown. Red circle: input gene, orange circle: cell metabolism gene, sky circle: other gene |
: Open all plots for all cancer types
| Top |
: Open all interacting genes' information including KEGG pathway for all interacting genes from DAVID
| Top |
| Pharmacological Information for MTAP |
| DB Category | DB Name | DB's ID and Url link |
| Chemistry | BindingDB | Q13126; -. |
| Chemistry | ChEMBL | CHEMBL4941; -. |
| Chemistry | BindingDB | Q13126; -. |
| Chemistry | ChEMBL | CHEMBL4941; -. |
| Organism-specific databases | PharmGKB | PA31220; -. |
| Organism-specific databases | PharmGKB | PA31220; -. |
| Organism-specific databases | CTD | 4507; -. |
| Organism-specific databases | CTD | 4507; -. |
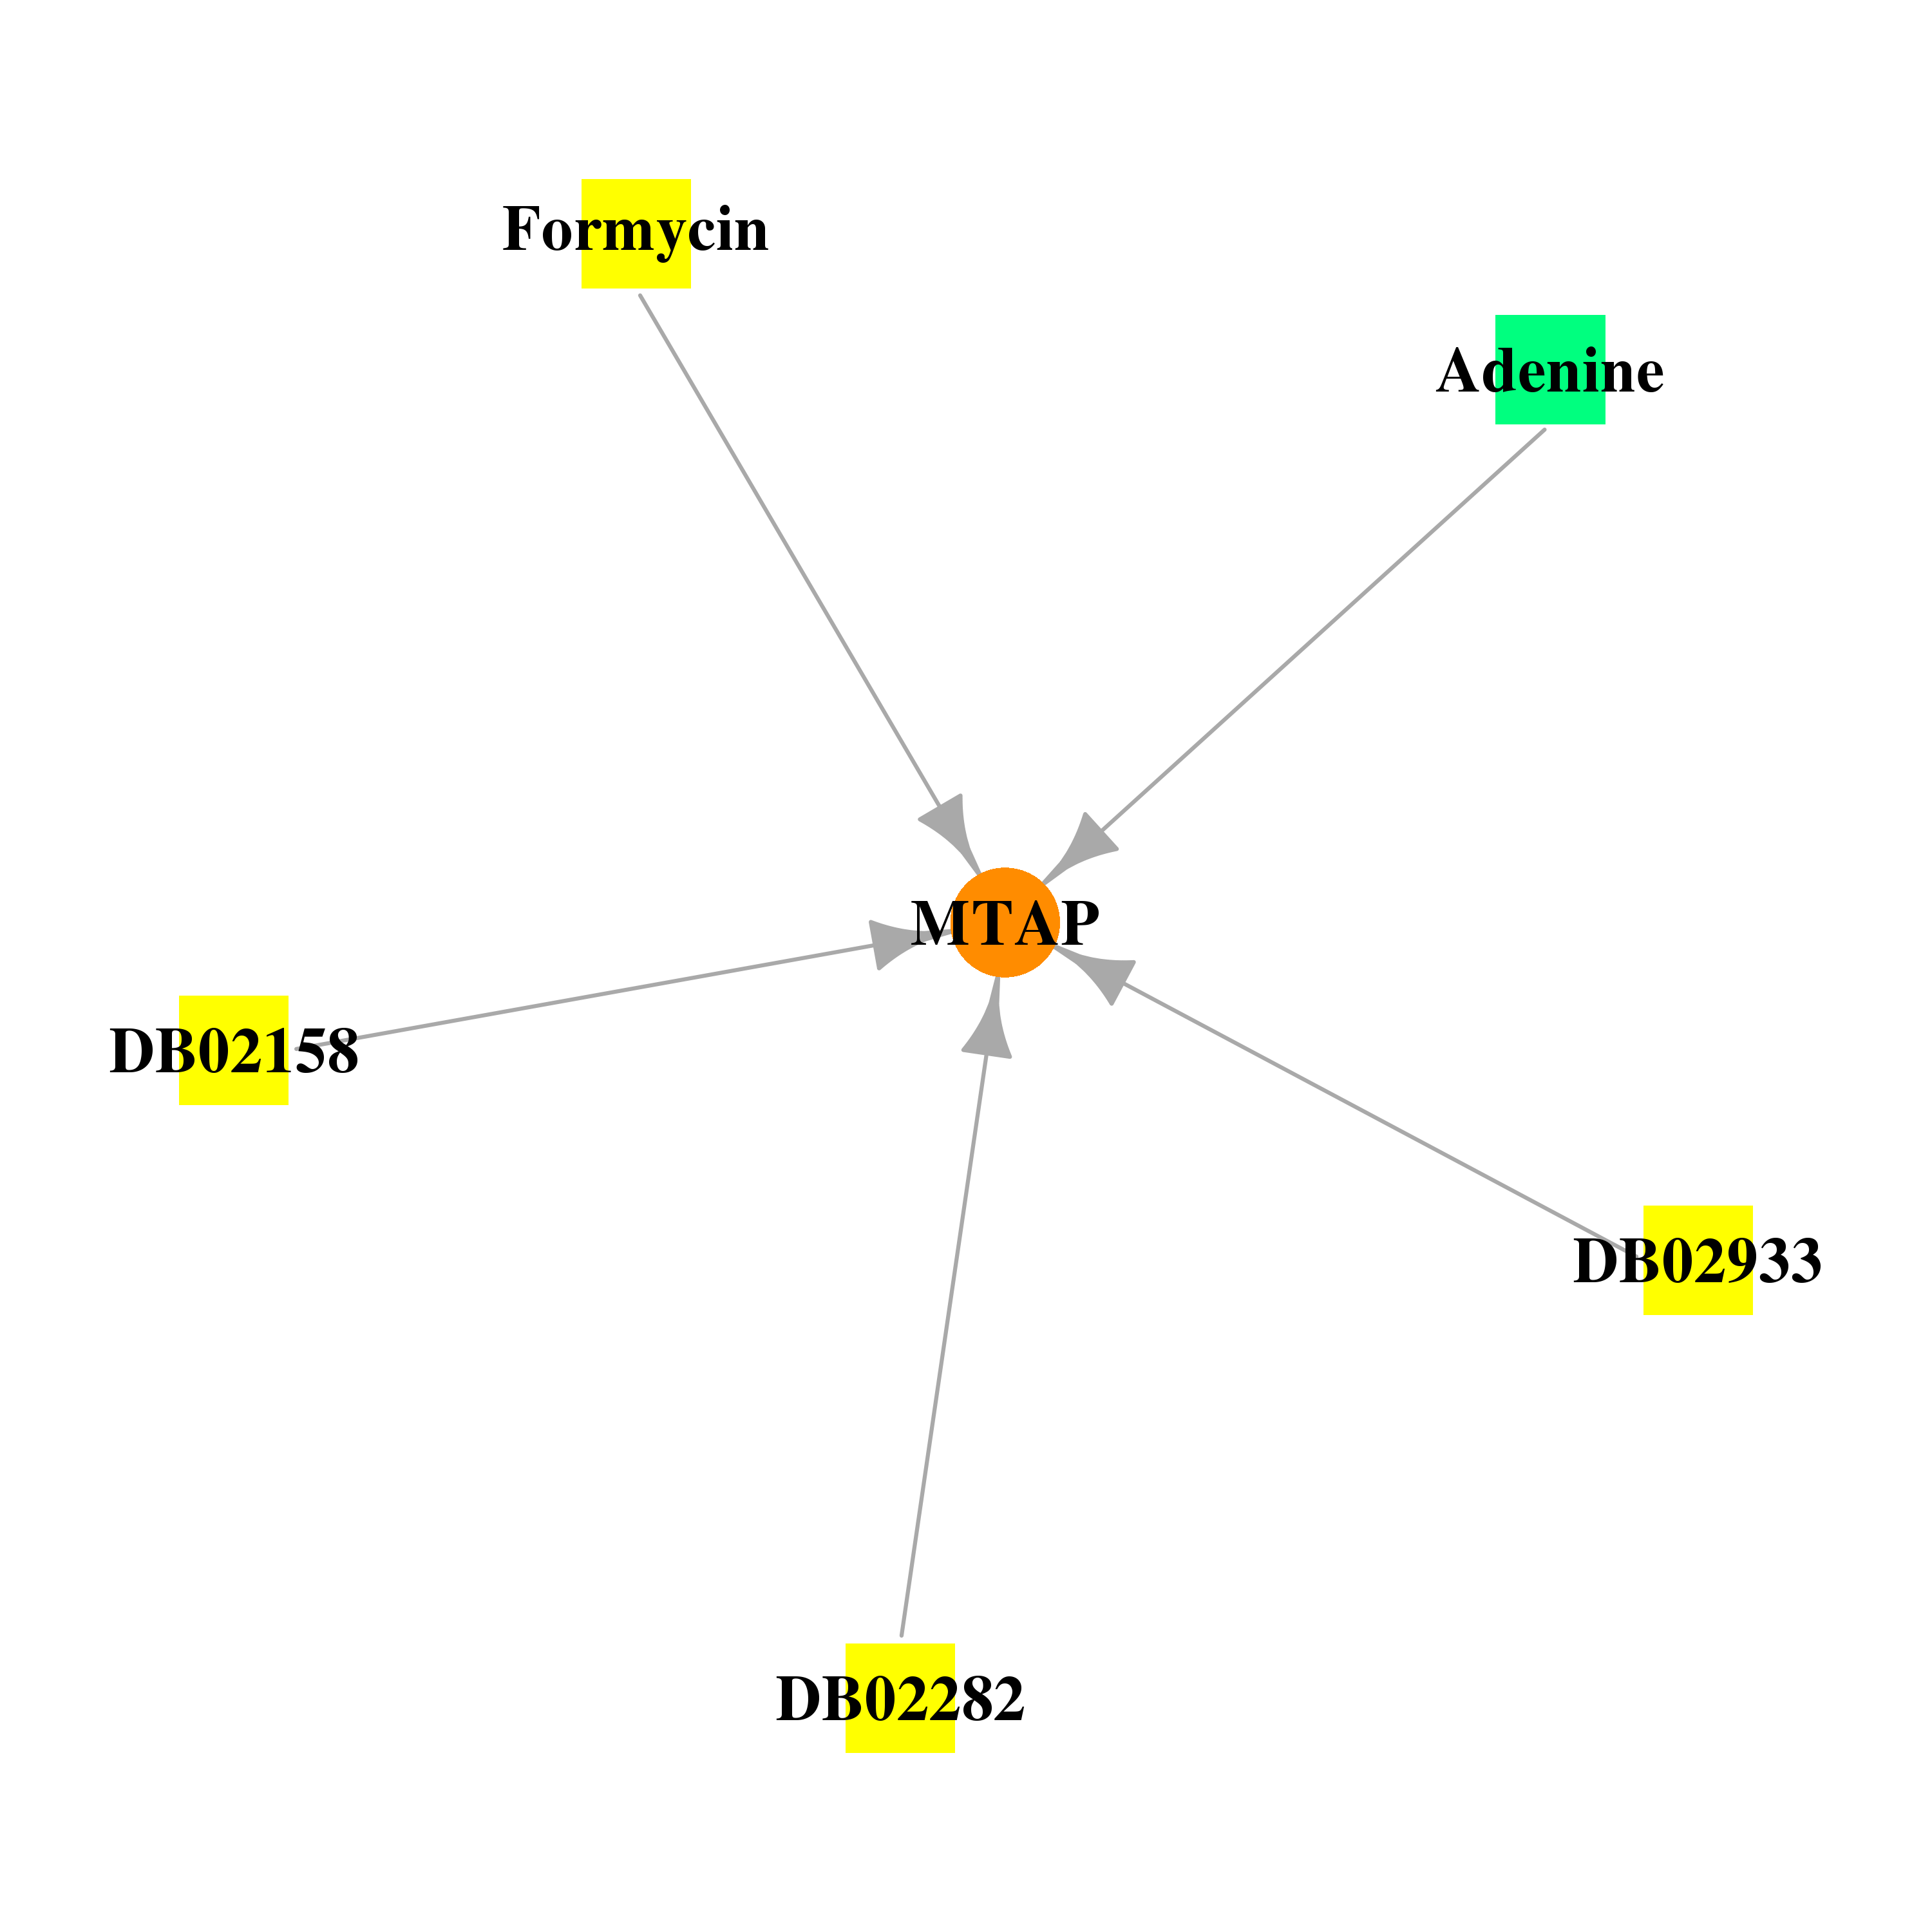
| * Gene Centered Interaction Network. |
 |
| * Drug Centered Interaction Network. |
| DrugBank ID | Target Name | Drug Groups | Generic Name | Drug Centered Network | Drug Structure |
| DB00173 | methylthioadenosine phosphorylase | approved; nutraceutical | Adenine | 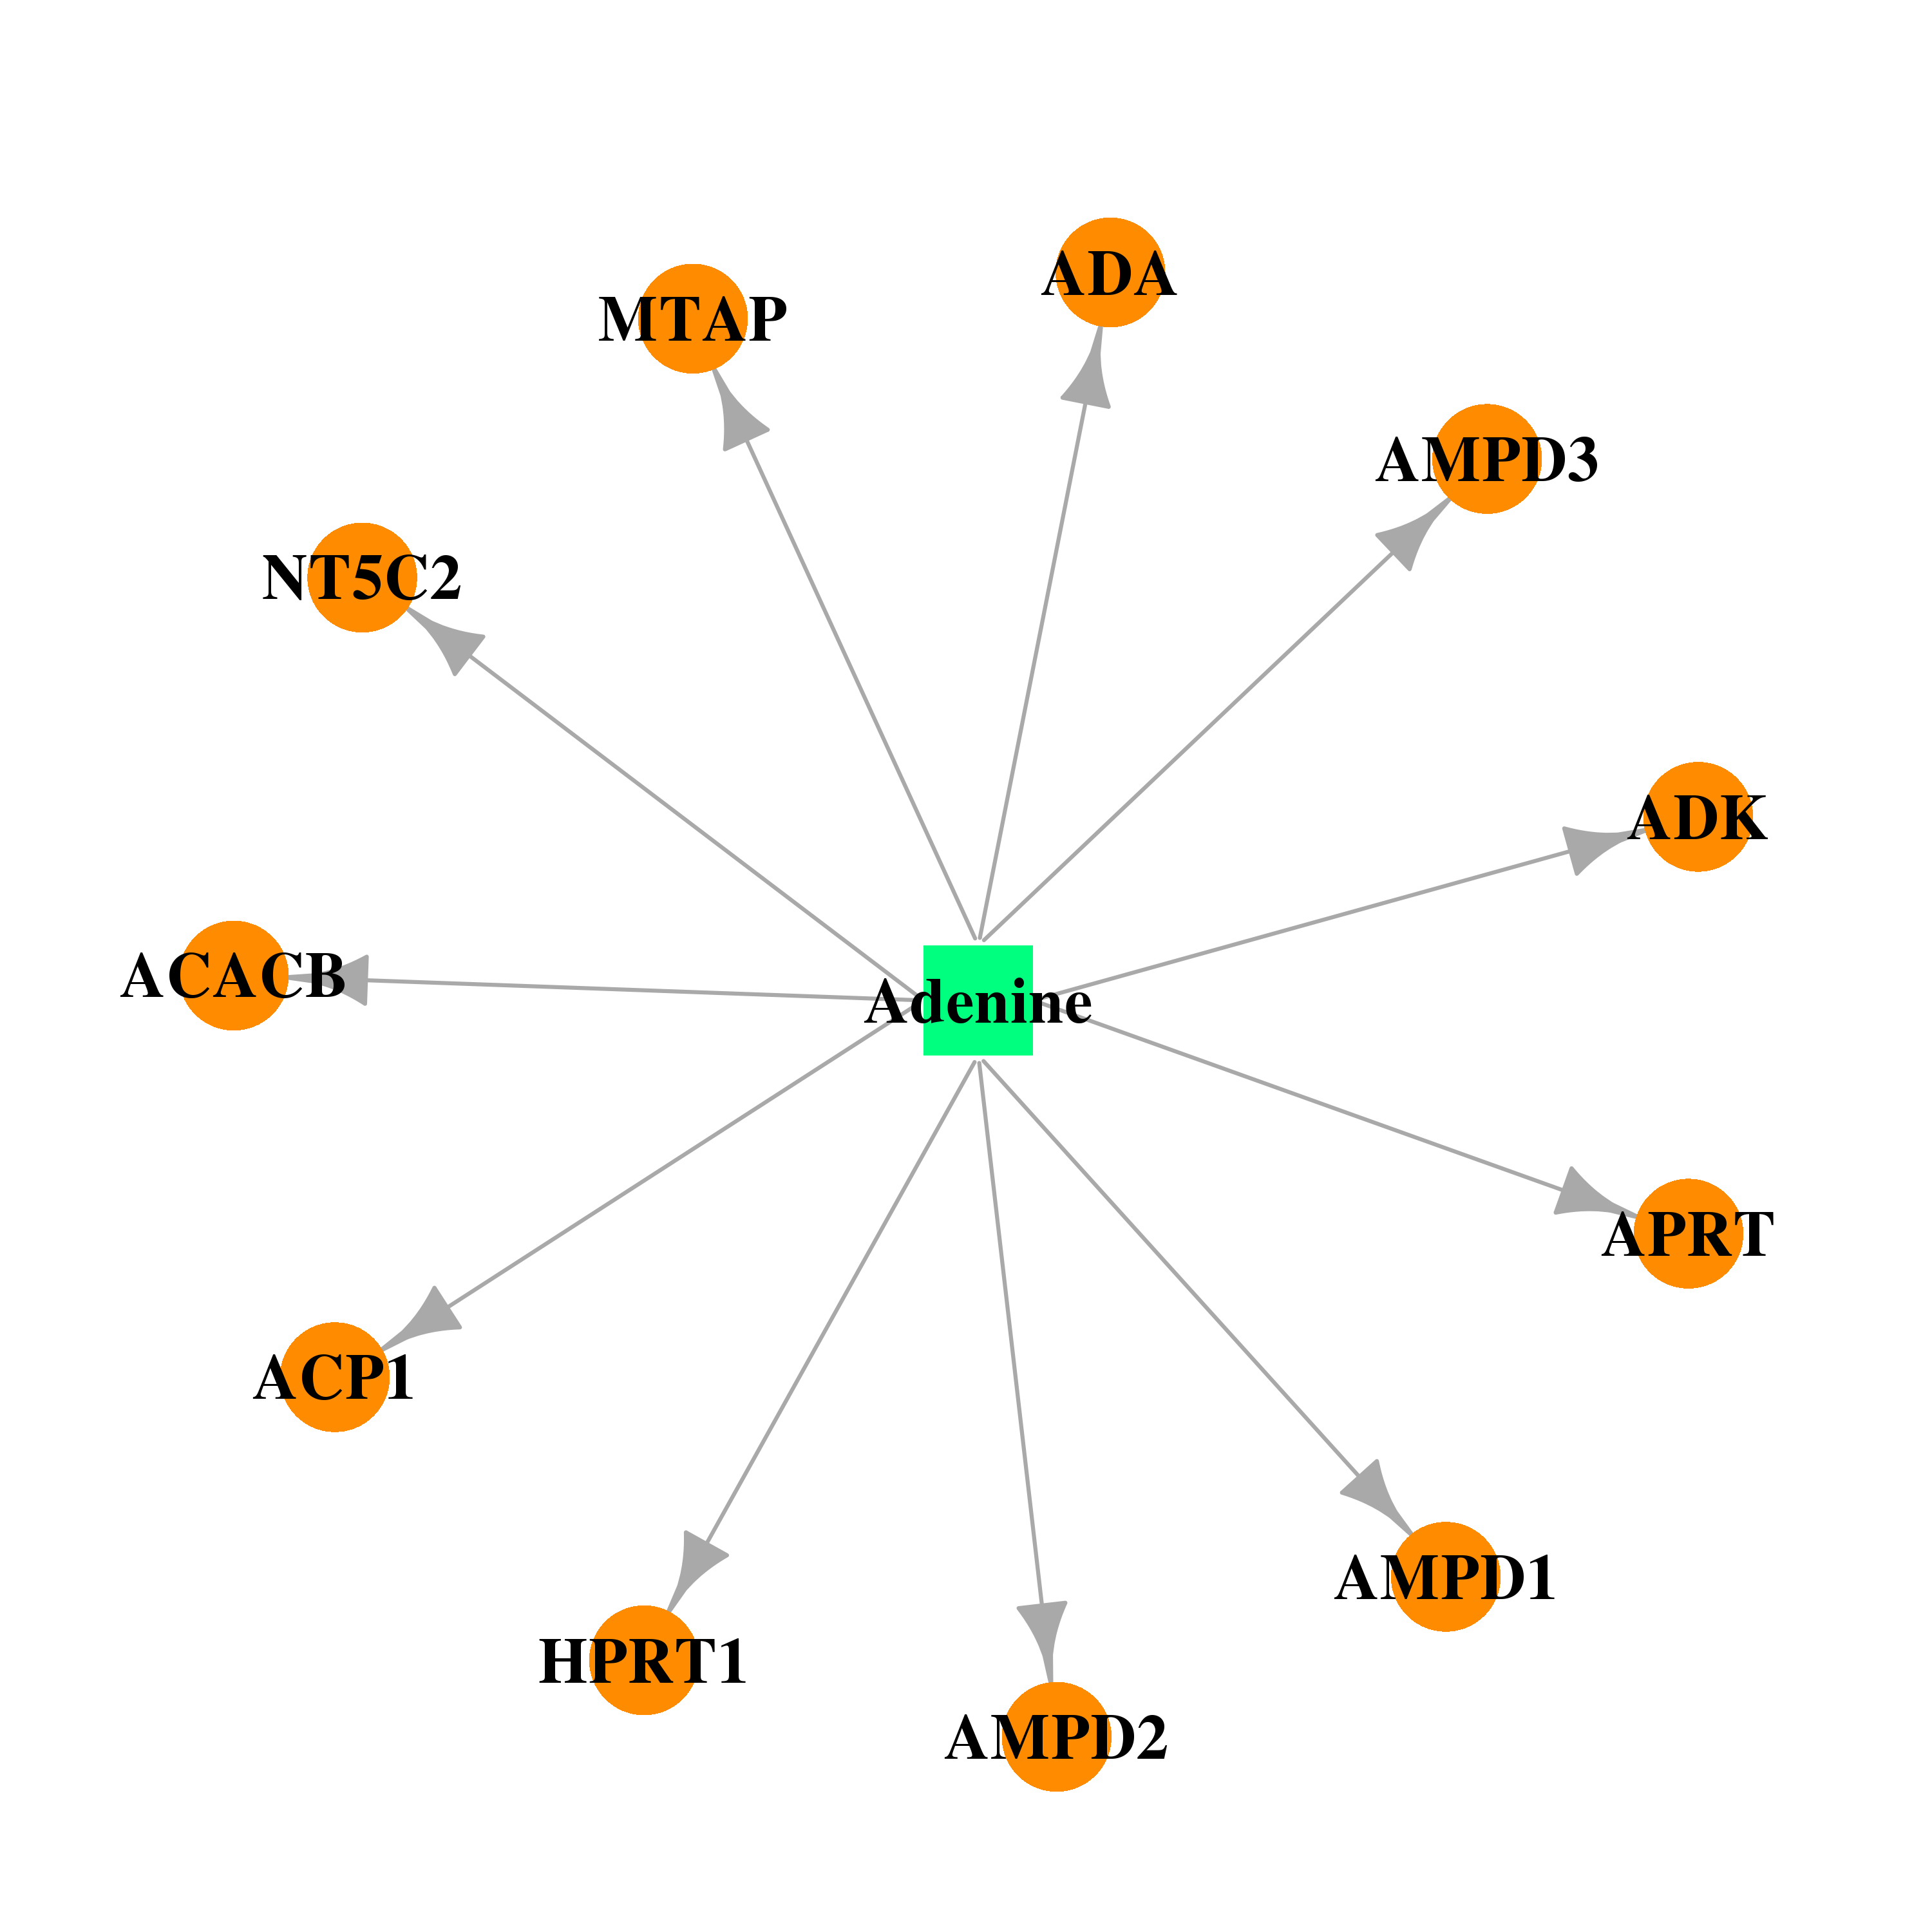 | 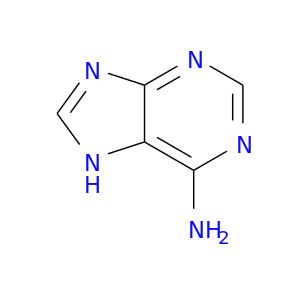 |
| DB02158 | methylthioadenosine phosphorylase | experimental | (1s)-1-(9-Deazaadenin-9-Yl)-1,4,5-Trideoxy-1,4-Imino-5-Methylthio-D-Ribitol | 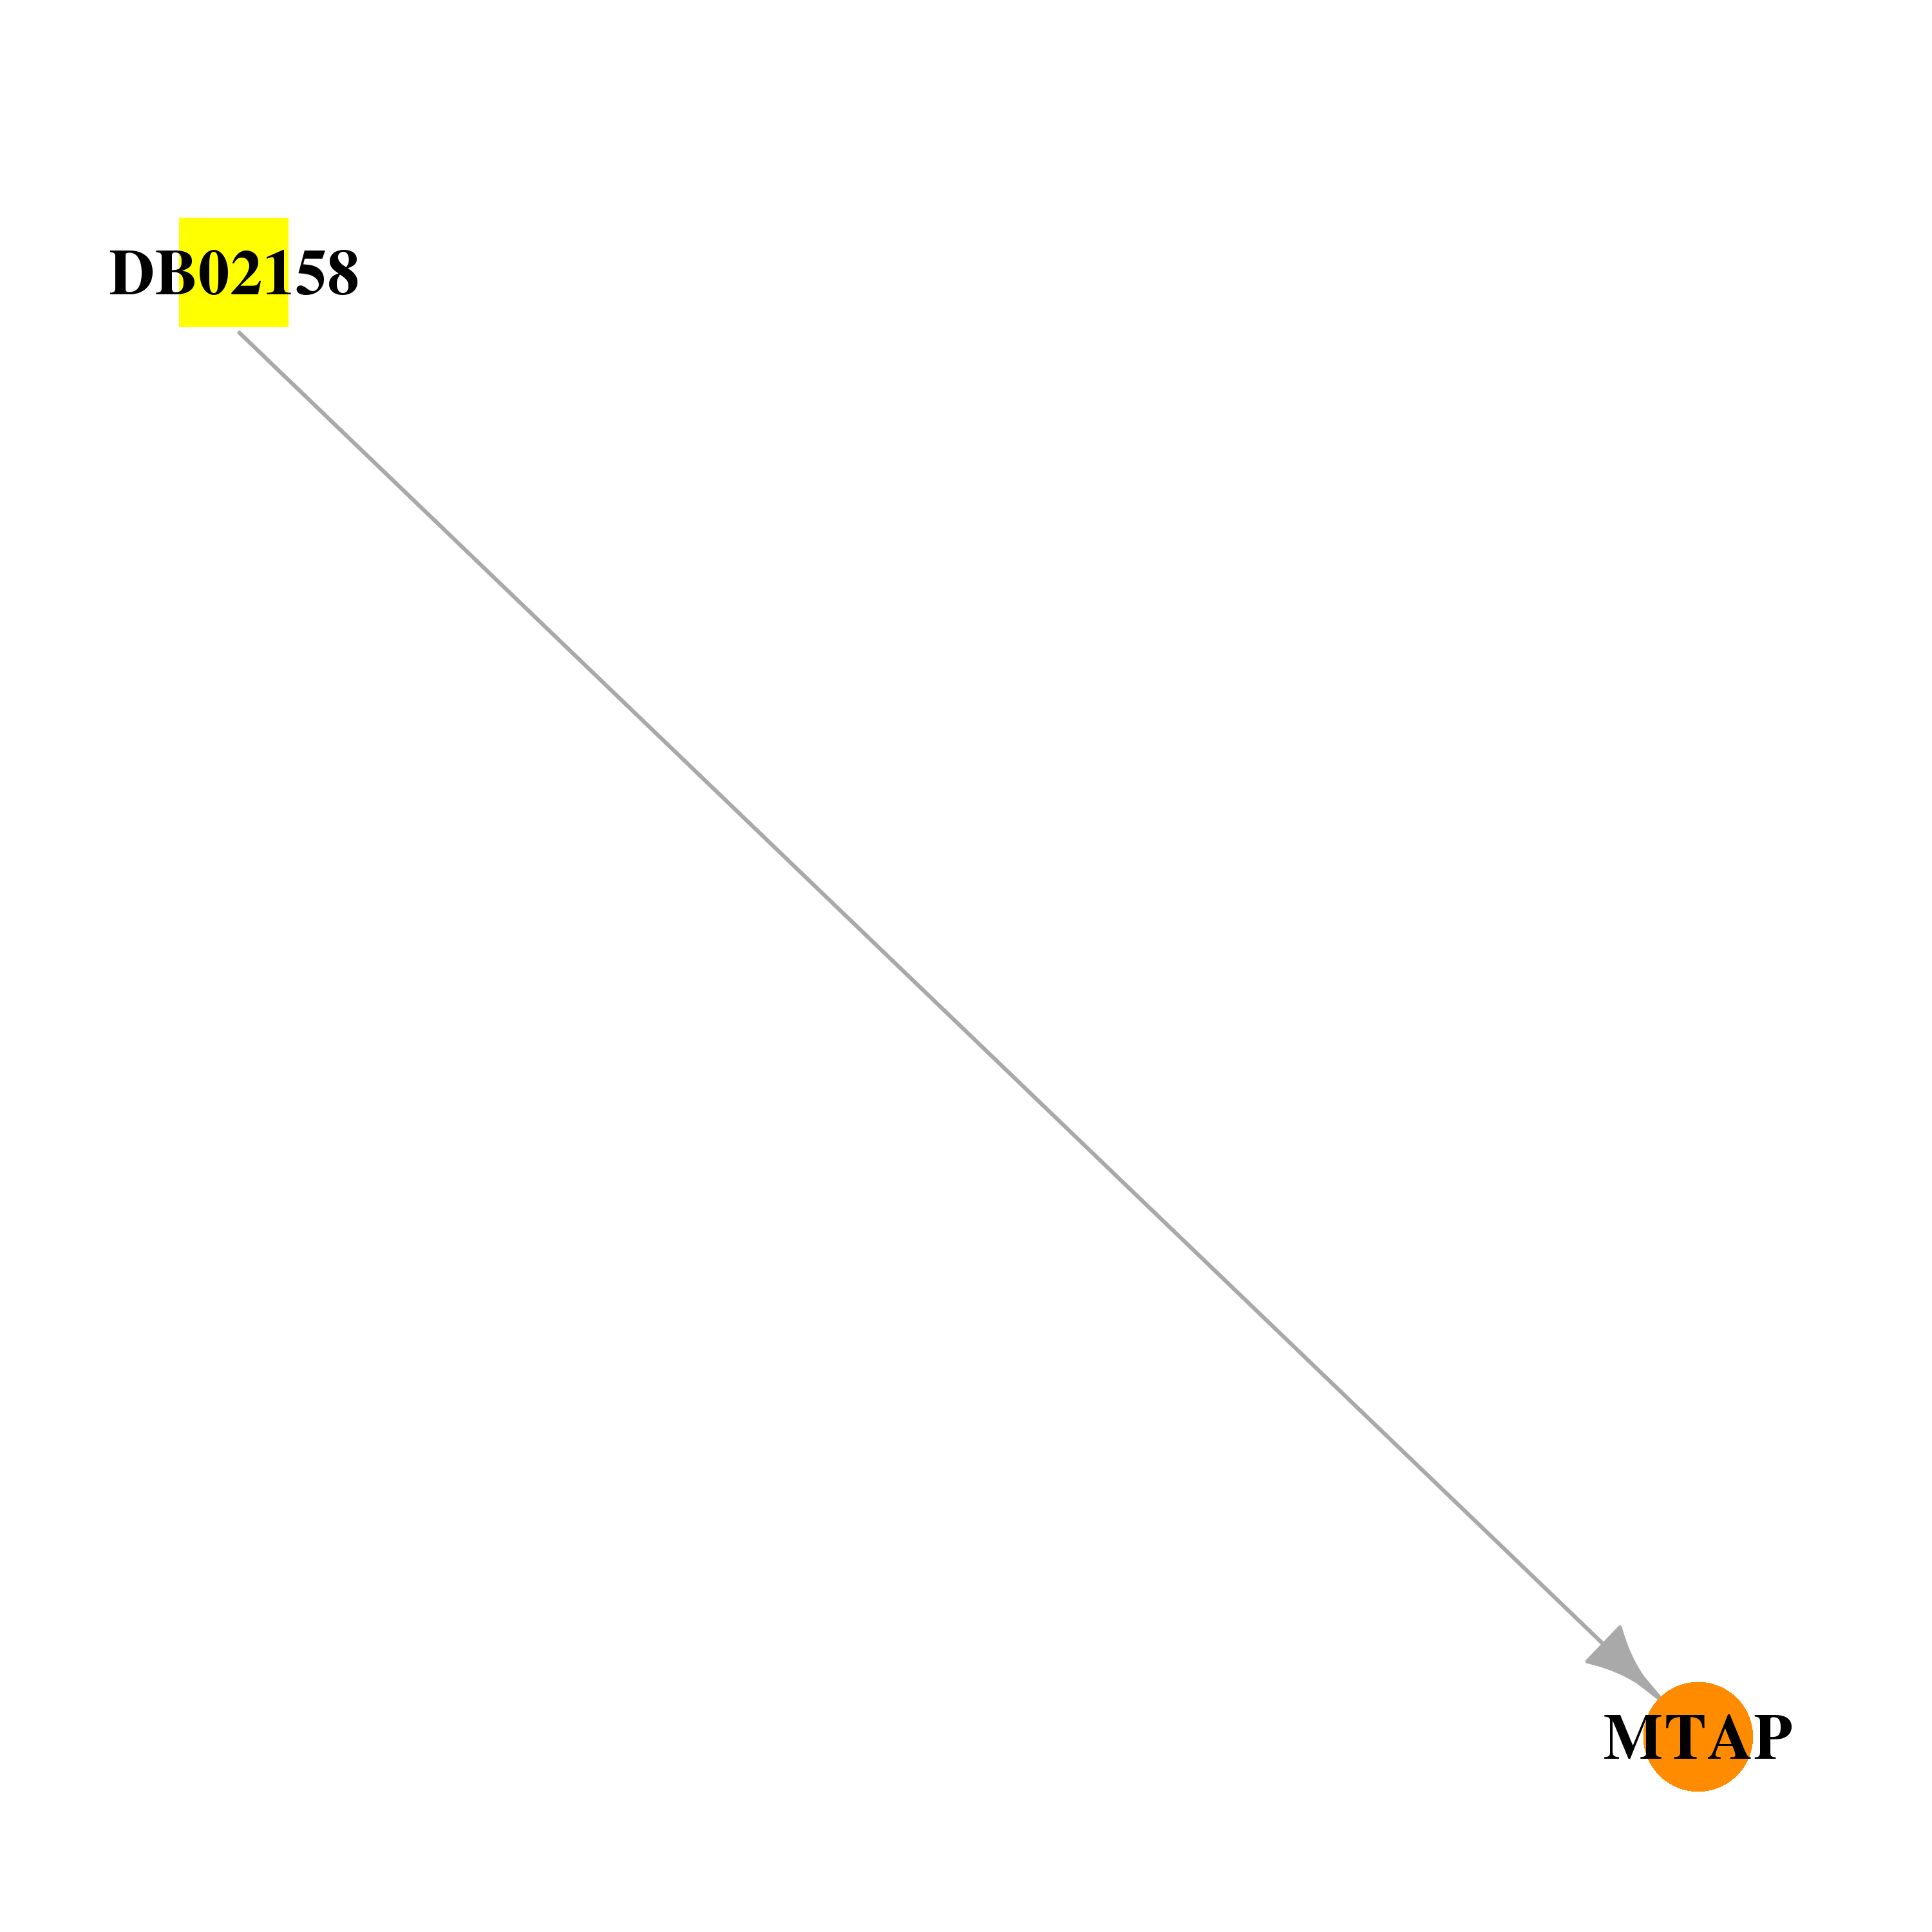 | 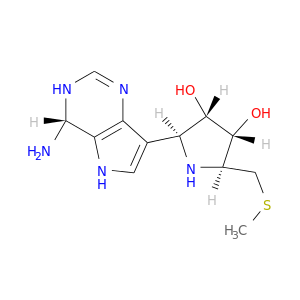 |
| DB02281 | methylthioadenosine phosphorylase | experimental | Formycin | 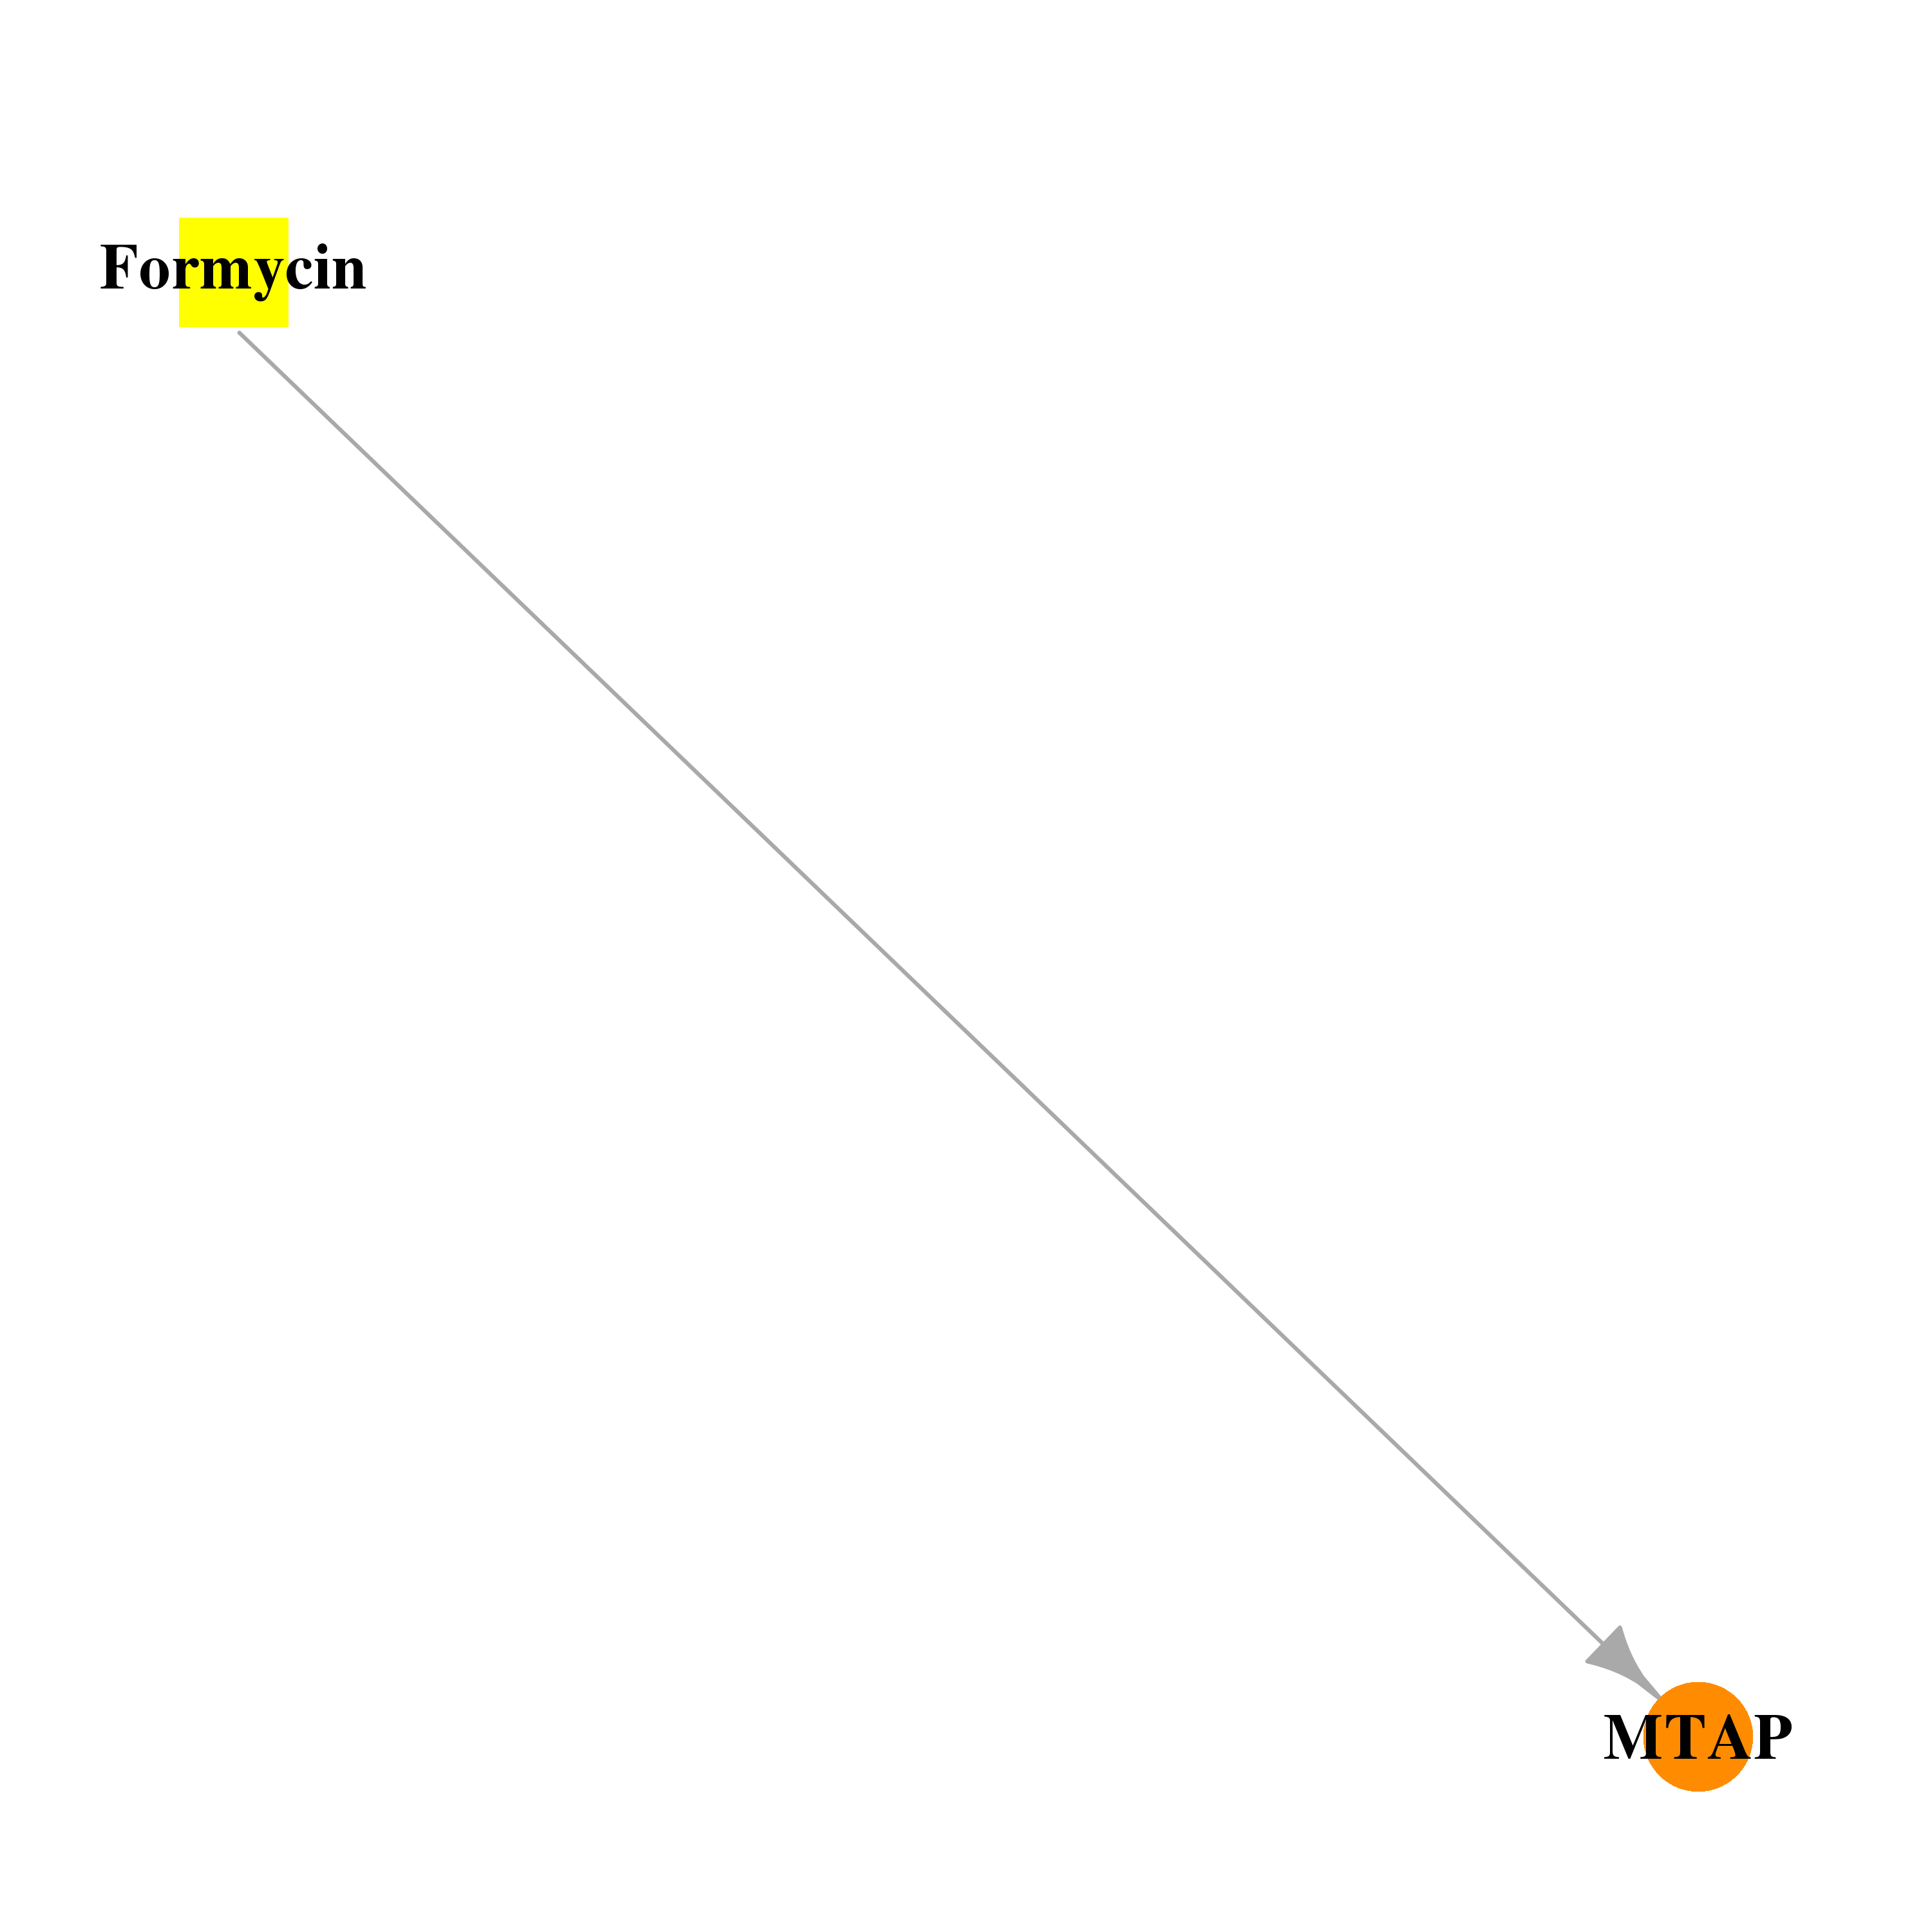 |  |
| DB02282 | methylthioadenosine phosphorylase | experimental | 5'-Deoxy-5'-Methylthioadenosine | 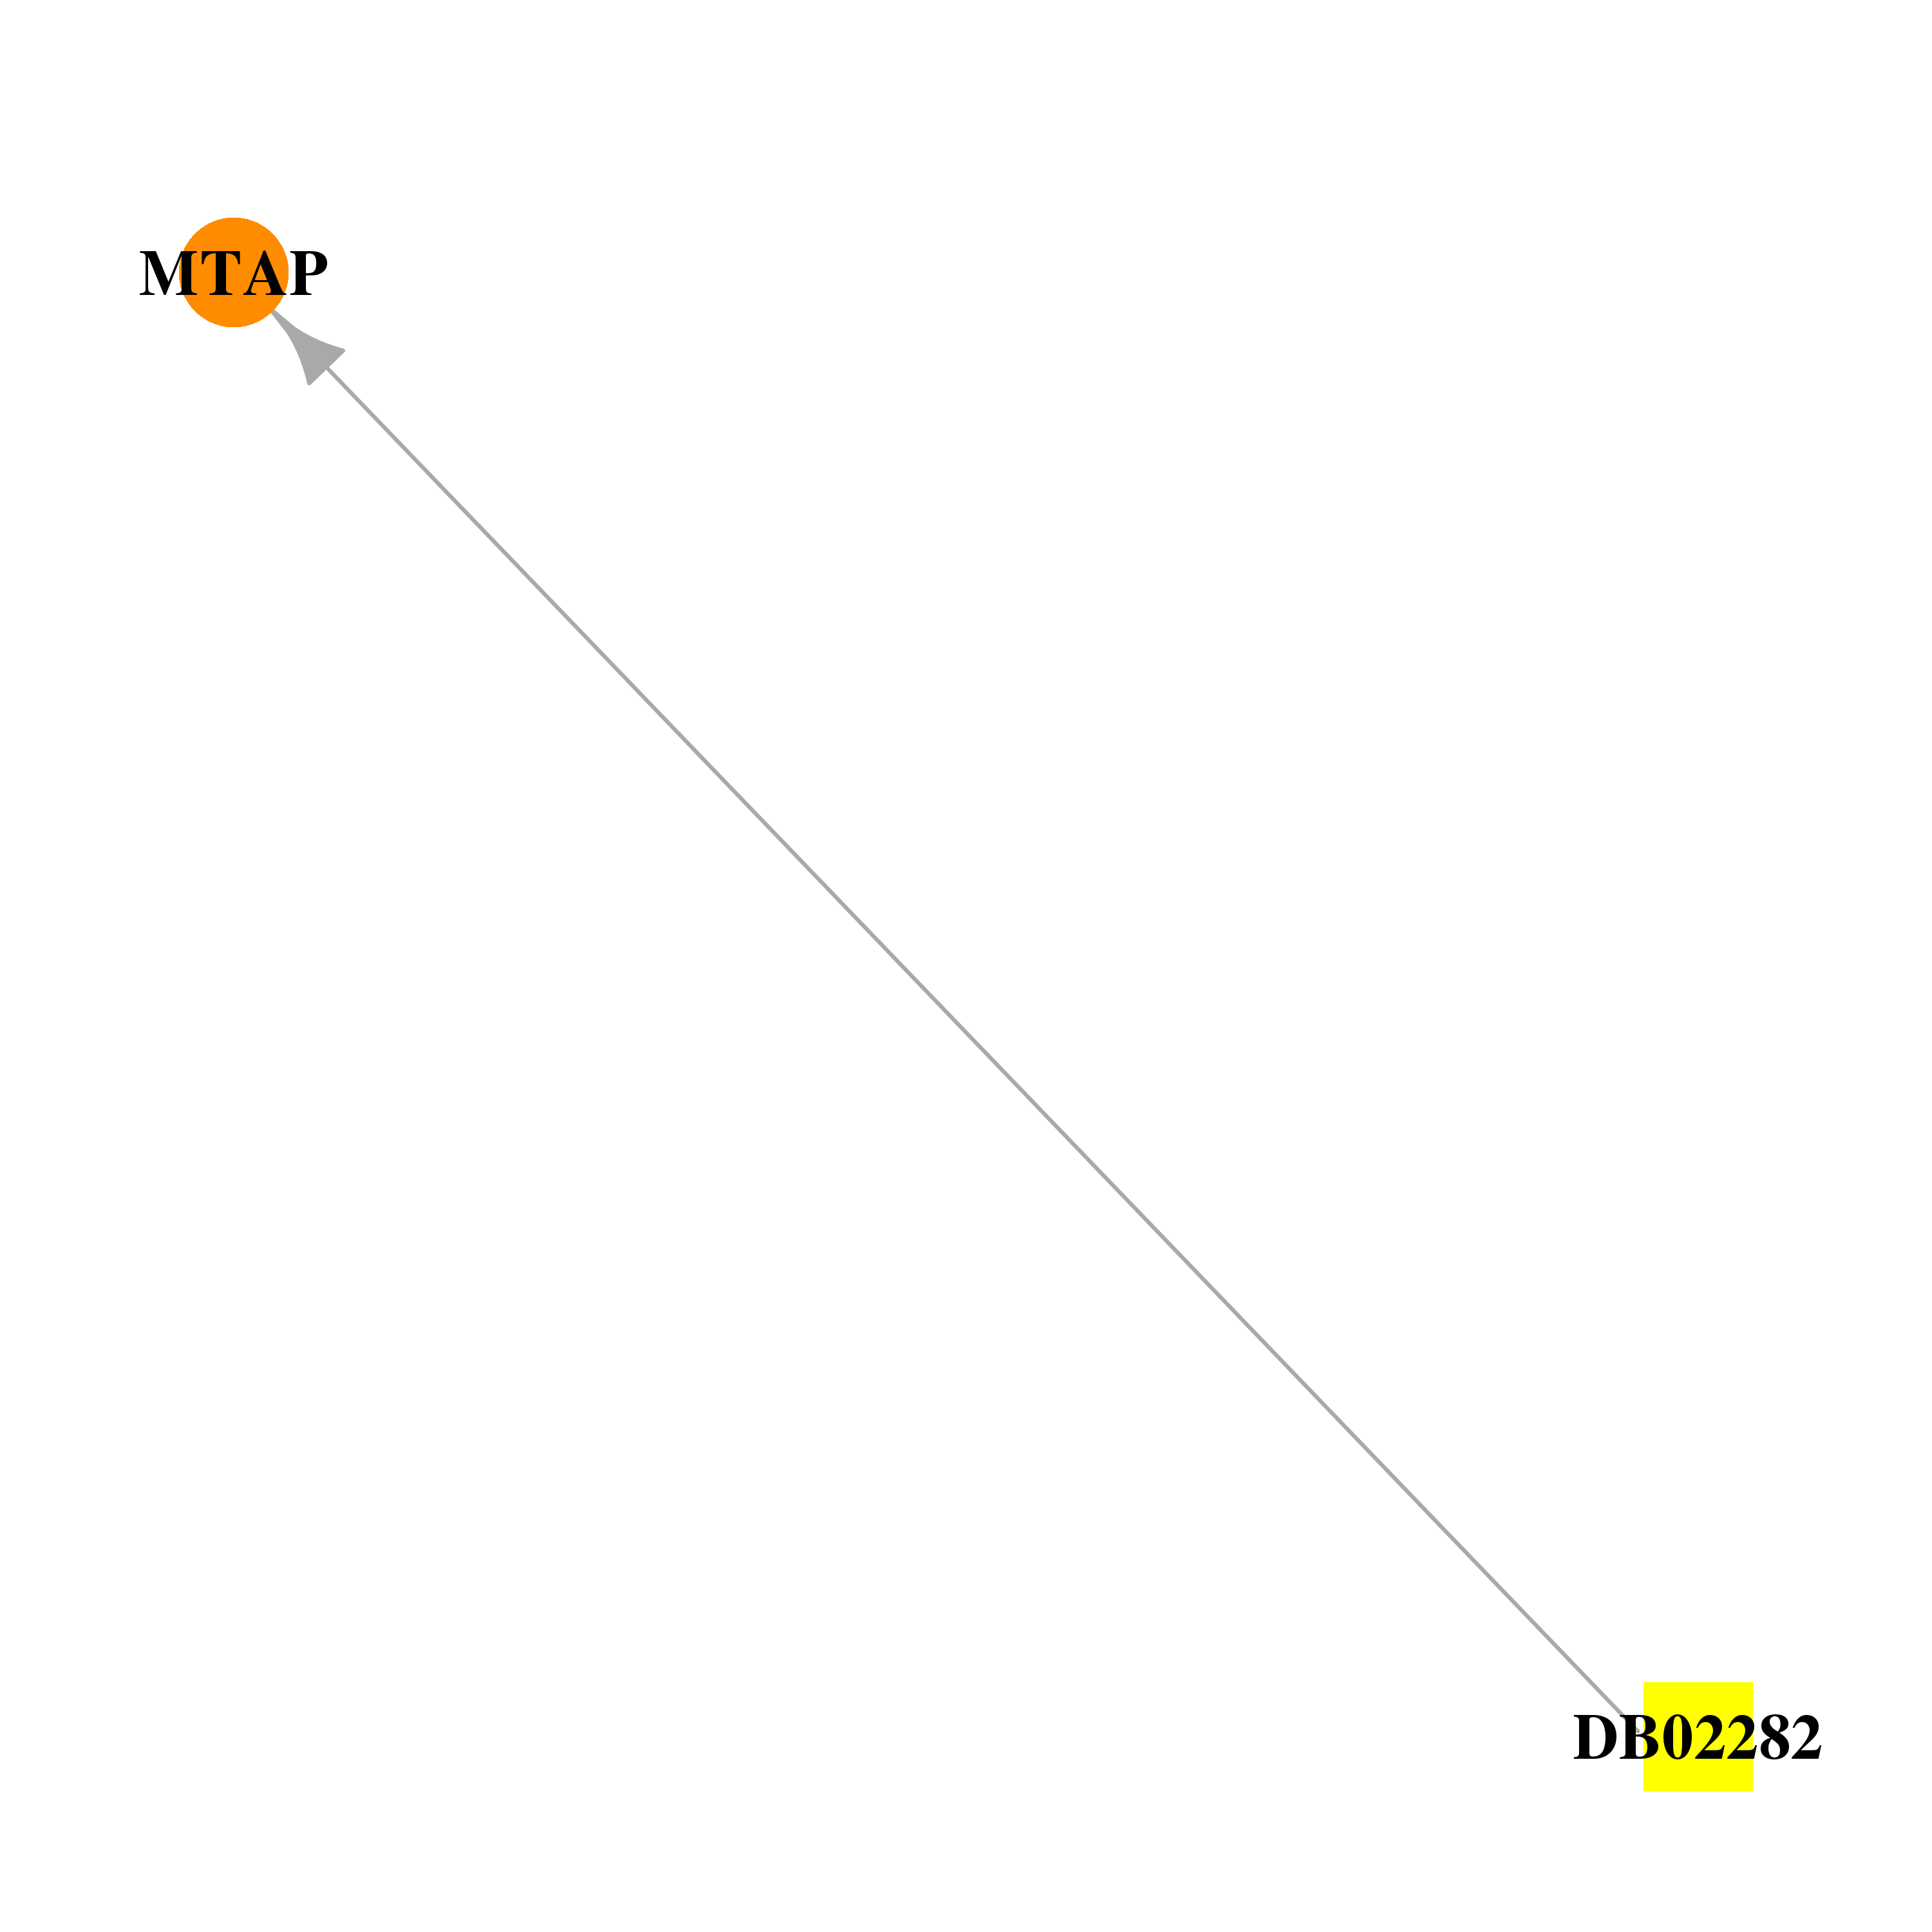 | 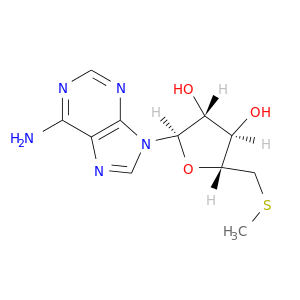 |
| DB02933 | methylthioadenosine phosphorylase | experimental | 5'-Deoxy-5'-(Methylthio)-Tubercidin |  |  |
| Top |
| Cross referenced IDs for MTAP |
| * We obtained these cross-references from Uniprot database. It covers 150 different DBs, 18 categories. http://www.uniprot.org/help/cross_references_section |
: Open all cross reference information
|
Copyright © 2016-Present - The Univsersity of Texas Health Science Center at Houston @ |