|
||||||||||||||||||||
| |
| Phenotypic Information (metabolism pathway, cancer, disease, phenome) |
| |
| |
| Gene-Gene Network Information: Co-Expression Network, Interacting Genes & KEGG |
| |
|


| Gene Summary for MTM1 |
| Top |
| Phenotypic Information for MTM1(metabolism pathway, cancer, disease, phenome) |
| Cancer | CGAP: MTM1 |
| Familial Cancer Database: MTM1 | |
| * This gene is included in those cancer gene databases. |
|
|
|
|
|
|
| ||||||||||||||
Oncogene 1 | Significant driver gene in | |||||||||||||||||||
| cf) number; DB name 1 Oncogene; http://nar.oxfordjournals.org/content/35/suppl_1/D721.long, 2 Tumor Suppressor gene; https://bioinfo.uth.edu/TSGene/, 3 Cancer Gene Census; http://www.nature.com/nrc/journal/v4/n3/abs/nrc1299.html, 4 CancerGenes; http://nar.oxfordjournals.org/content/35/suppl_1/D721.long, 5 Network of Cancer Gene; http://ncg.kcl.ac.uk/index.php, 1Therapeutic Vulnerabilities in Cancer; http://cbio.mskcc.org/cancergenomics/statius/ |
| REACTOME_PHOSPHOLIPID_METABOLISM REACTOME_PI_METABOLISM REACTOME_METABOLISM_OF_LIPIDS_AND_LIPOPROTEINS | |
| OMIM | |
| Orphanet | |
| Disease | KEGG Disease: MTM1 |
| MedGen: MTM1 (Human Medical Genetics with Condition) | |
| ClinVar: MTM1 | |
| Phenotype | MGI: MTM1 (International Mouse Phenotyping Consortium) |
| PhenomicDB: MTM1 | |
| Mutations for MTM1 |
| * Under tables are showing count per each tissue to give us broad intuition about tissue specific mutation patterns.You can go to the detailed page for each mutation database's web site. |
| There's no structural variation information in COSMIC data for this gene. |
| * From mRNA Sanger sequences, Chitars2.0 arranged chimeric transcripts. This table shows MTM1 related fusion information. |
| ID | Head Gene | Tail Gene | Accession | Gene_a | qStart_a | qEnd_a | Chromosome_a | tStart_a | tEnd_a | Gene_a | qStart_a | qEnd_a | Chromosome_a | tStart_a | tEnd_a |
| AU125262 | MTM1 | 1 | 74 | X | 149840337 | 149840410 | EMG1 | 73 | 781 | 12 | 7090246 | 7125842 | |
| AA506682 | MTM1 | 8 | 212 | X | 149841153 | 149841357 | MTM1 | 208 | 285 | X | 149841310 | 149841387 | |
| Top |
| There's no copy number variation information in COSMIC data for this gene. |
| Top |
|
 |
| Top |
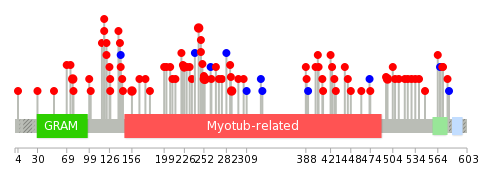
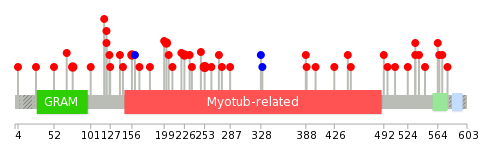
| Stat. for Non-Synonymous SNVs (# total SNVs=80) | (# total SNVs=10) |
 |  |
(# total SNVs=1) | (# total SNVs=0) |
 |
| Top |
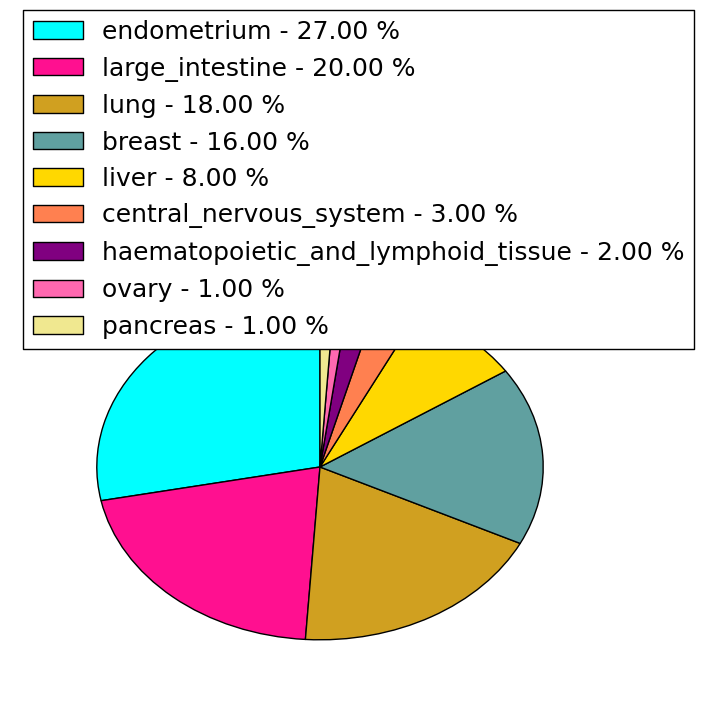
| * When you move the cursor on each content, you can see more deailed mutation information on the Tooltip. Those are primary_site,primary_histology,mutation(aa),pubmedID. |
| GRCh37 position | Mutation(aa) | Unique sampleID count |
| chr23:149809883-149809883 | p.R224* | 3 |
| chr23:149814235-149814235 | p.R253Q | 3 |
| chr23:149767149-149767149 | p.T77M | 2 |
| chr23:149809889-149809889 | p.P226S | 2 |
| chr23:149814211-149814211 | p.P245R | 2 |
| chr23:149828946-149828946 | p.R486* | 2 |
| chr23:149831928-149831928 | p.S497Y | 2 |
| chr23:149807437-149807437 | p.E156K | 2 |
| chr23:149814343-149814343 | p.K289T | 2 |
| chr23:149826450-149826450 | p.E404K | 1 |
| Top |
|
 |
| Point Mutation/ Tissue ID | 1 | 2 | 3 | 4 | 5 | 6 | 7 | 8 | 9 | 10 | 11 | 12 | 13 | 14 | 15 | 16 | 17 | 18 | 19 | 20 |
| # sample | 3 | 7 | 8 | 2 | 1 | 7 | 2 | 1 | 6 | 1 | 1 | 12 | ||||||||
| # mutation | 3 | 7 | 8 | 2 | 1 | 7 | 2 | 1 | 6 | 1 | 1 | 13 | ||||||||
| nonsynonymous SNV | 3 | 7 | 7 | 2 | 1 | 6 | 2 | 1 | 6 | 1 | 1 | 12 | ||||||||
| synonymous SNV | 1 | 1 | 1 |
| cf) Tissue ID; Tissue type (1; BLCA[Bladder Urothelial Carcinoma], 2; BRCA[Breast invasive carcinoma], 3; CESC[Cervical squamous cell carcinoma and endocervical adenocarcinoma], 4; COAD[Colon adenocarcinoma], 5; GBM[Glioblastoma multiforme], 6; Glioma Low Grade, 7; HNSC[Head and Neck squamous cell carcinoma], 8; KICH[Kidney Chromophobe], 9; KIRC[Kidney renal clear cell carcinoma], 10; KIRP[Kidney renal papillary cell carcinoma], 11; LAML[Acute Myeloid Leukemia], 12; LUAD[Lung adenocarcinoma], 13; LUSC[Lung squamous cell carcinoma], 14; OV[Ovarian serous cystadenocarcinoma ], 15; PAAD[Pancreatic adenocarcinoma], 16; PRAD[Prostate adenocarcinoma], 17; SKCM[Skin Cutaneous Melanoma], 18:STAD[Stomach adenocarcinoma], 19:THCA[Thyroid carcinoma], 20:UCEC[Uterine Corpus Endometrial Carcinoma]) |
| Top |
| * We represented just top 10 SNVs. When you move the cursor on each content, you can see more deailed mutation information on the Tooltip. Those are primary_site, primary_histology, mutation(aa), pubmedID. |
| Genomic Position | Mutation(aa) | Unique sampleID count |
| chrX:149814235 | p.R253Q | 3 |
| chrX:149809889 | p.L202F | 2 |
| chrX:149807437 | p.T77M | 2 |
| chrX:149767149 | p.P226S | 2 |
| chrX:149809819 | p.E156K | 2 |
| chrX:149787548 | p.Q547R | 1 |
| chrX:149832009 | p.N160N | 1 |
| chrX:149809878 | p.A287T | 1 |
| chrX:149761086 | p.R564C | 1 |
| chrX:149818311 | p.V166I | 1 |
| * Copy number data were extracted from TCGA using R package TCGA-Assembler. The URLs of all public data files on TCGA DCC data server were gathered on Jan-05-2015. Function ProcessCNAData in TCGA-Assembler package was used to obtain gene-level copy number value which is calculated as the average copy number of the genomic region of a gene. |
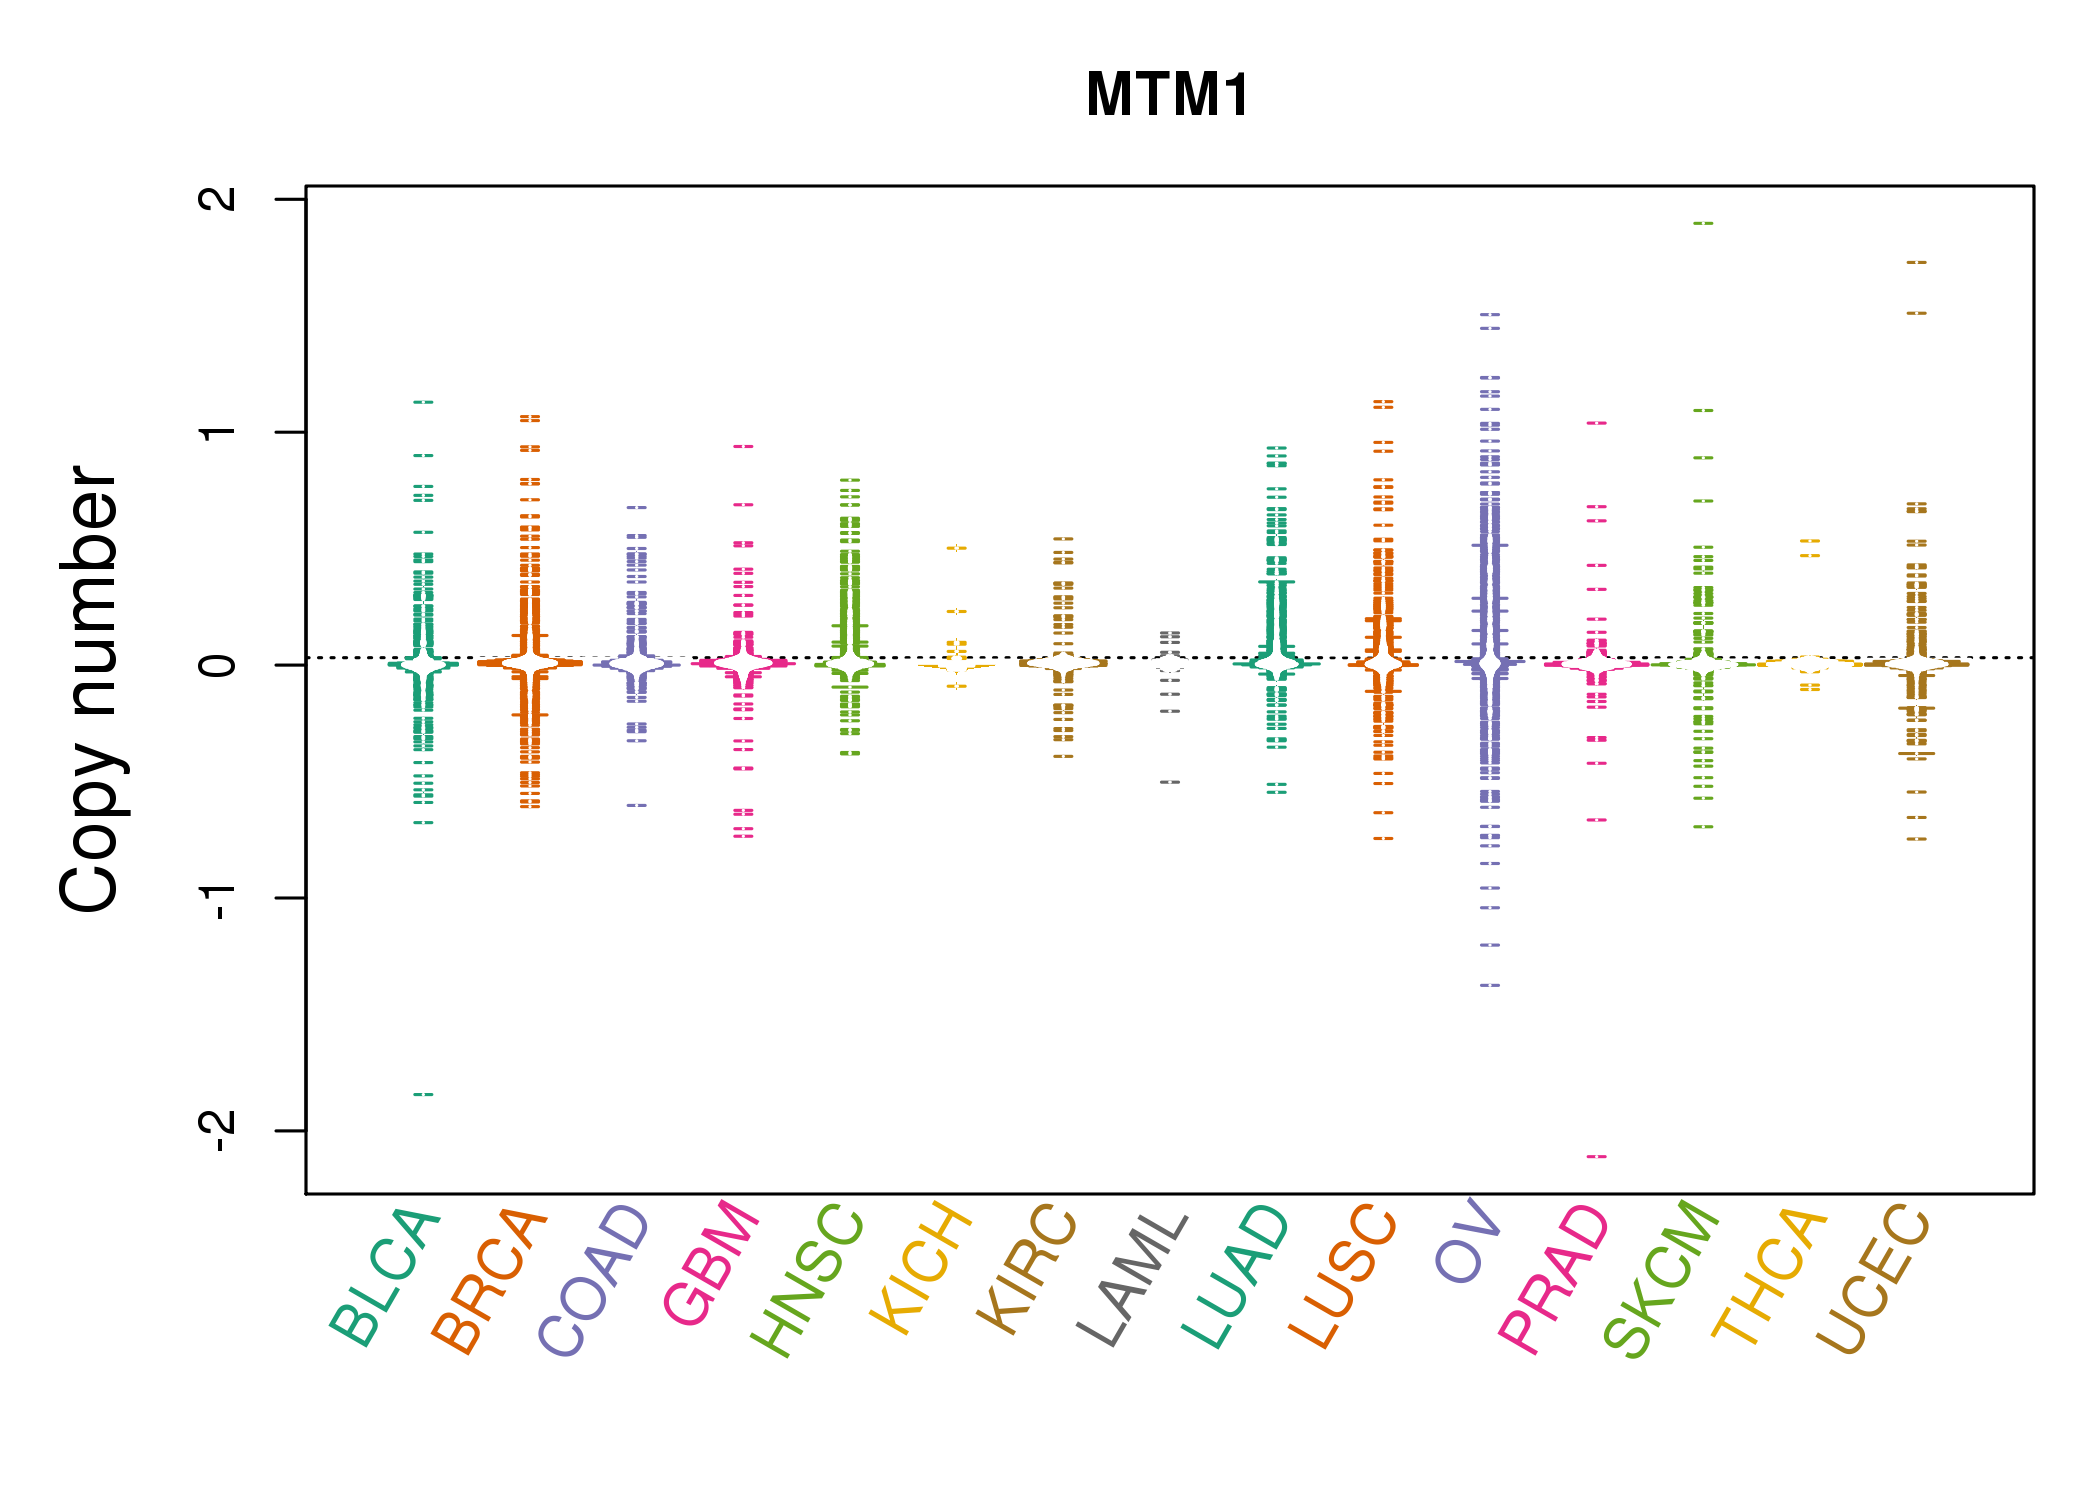 |
| cf) Tissue ID[Tissue type]: BLCA[Bladder Urothelial Carcinoma], BRCA[Breast invasive carcinoma], CESC[Cervical squamous cell carcinoma and endocervical adenocarcinoma], COAD[Colon adenocarcinoma], GBM[Glioblastoma multiforme], Glioma Low Grade, HNSC[Head and Neck squamous cell carcinoma], KICH[Kidney Chromophobe], KIRC[Kidney renal clear cell carcinoma], KIRP[Kidney renal papillary cell carcinoma], LAML[Acute Myeloid Leukemia], LUAD[Lung adenocarcinoma], LUSC[Lung squamous cell carcinoma], OV[Ovarian serous cystadenocarcinoma ], PAAD[Pancreatic adenocarcinoma], PRAD[Prostate adenocarcinoma], SKCM[Skin Cutaneous Melanoma], STAD[Stomach adenocarcinoma], THCA[Thyroid carcinoma], UCEC[Uterine Corpus Endometrial Carcinoma] |
| Top |
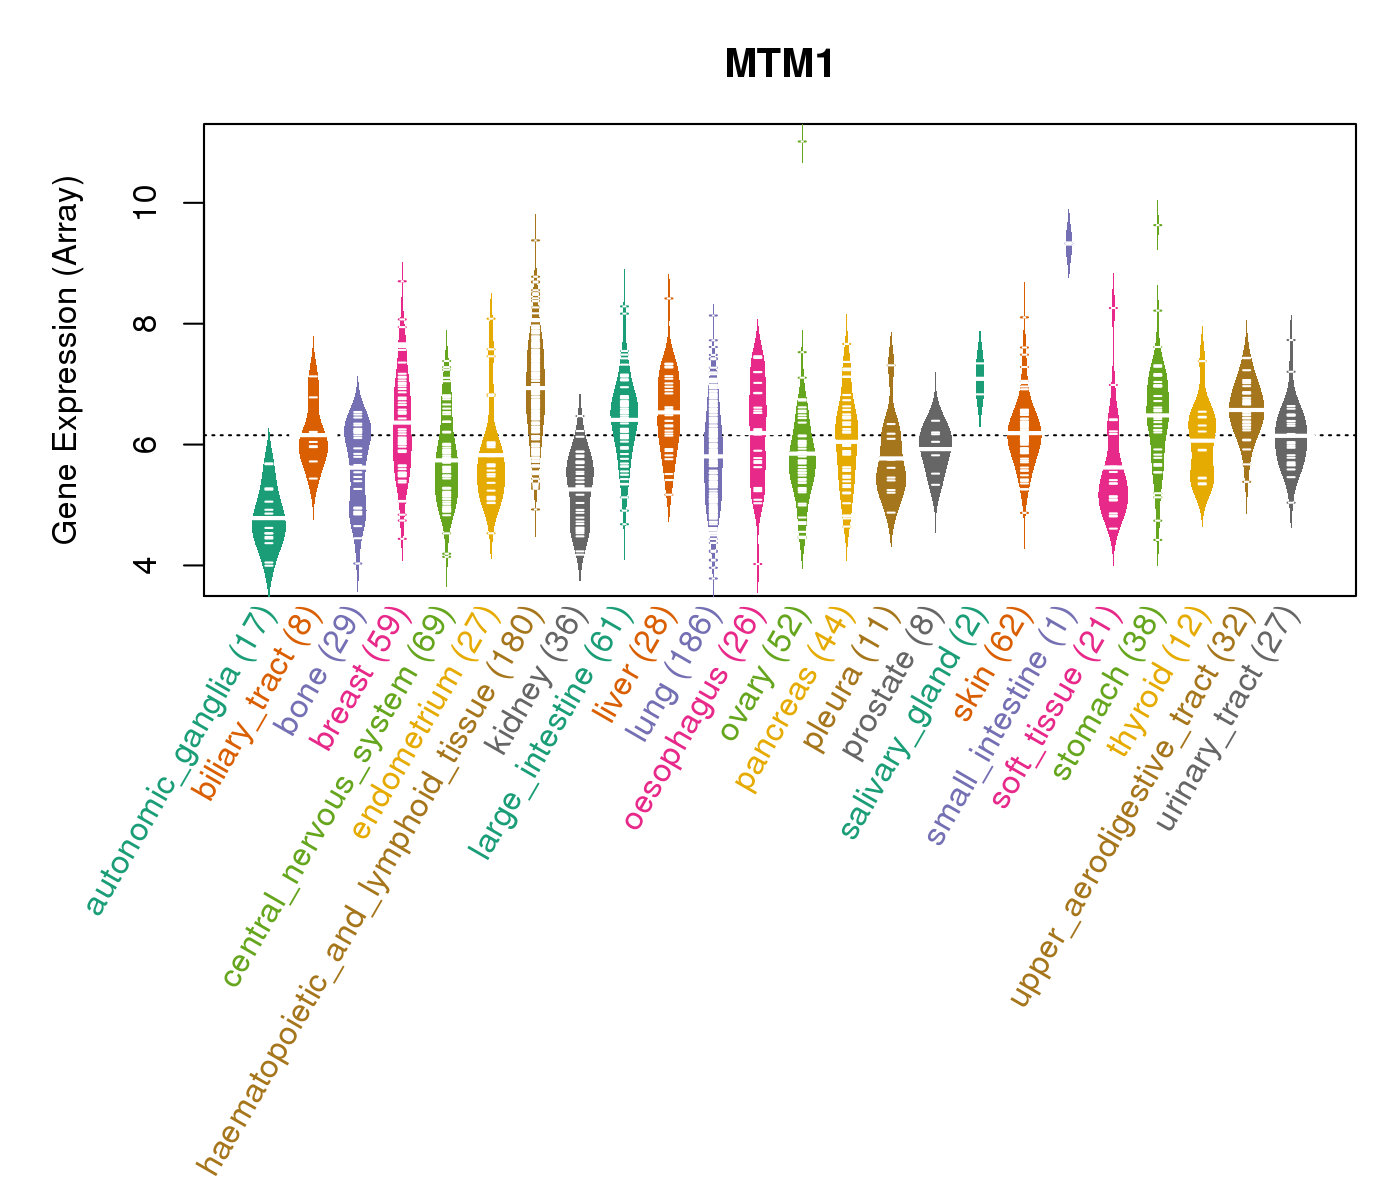
| Gene Expression for MTM1 |
| * CCLE gene expression data were extracted from CCLE_Expression_Entrez_2012-10-18.res: Gene-centric RMA-normalized mRNA expression data. |
 |
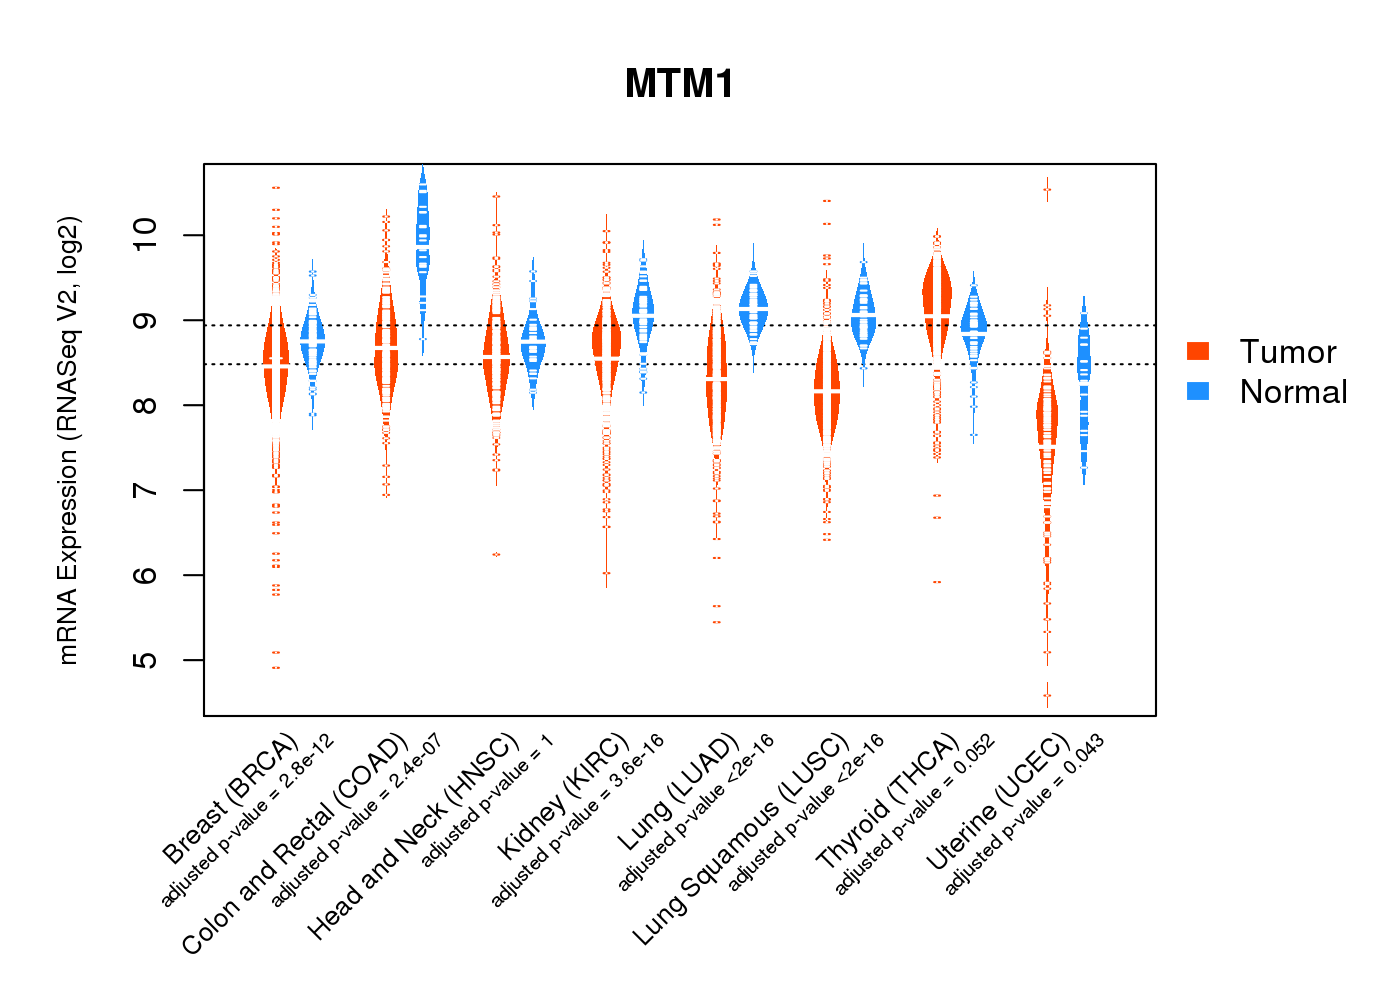
| * Normalized gene expression data of RNASeqV2 was extracted from TCGA using R package TCGA-Assembler. The URLs of all public data files on TCGA DCC data server were gathered at Jan-05-2015. Only eight cancer types have enough normal control samples for differential expression analysis. (t test, adjusted p<0.05 (using Benjamini-Hochberg FDR)) |
 |
| Top |
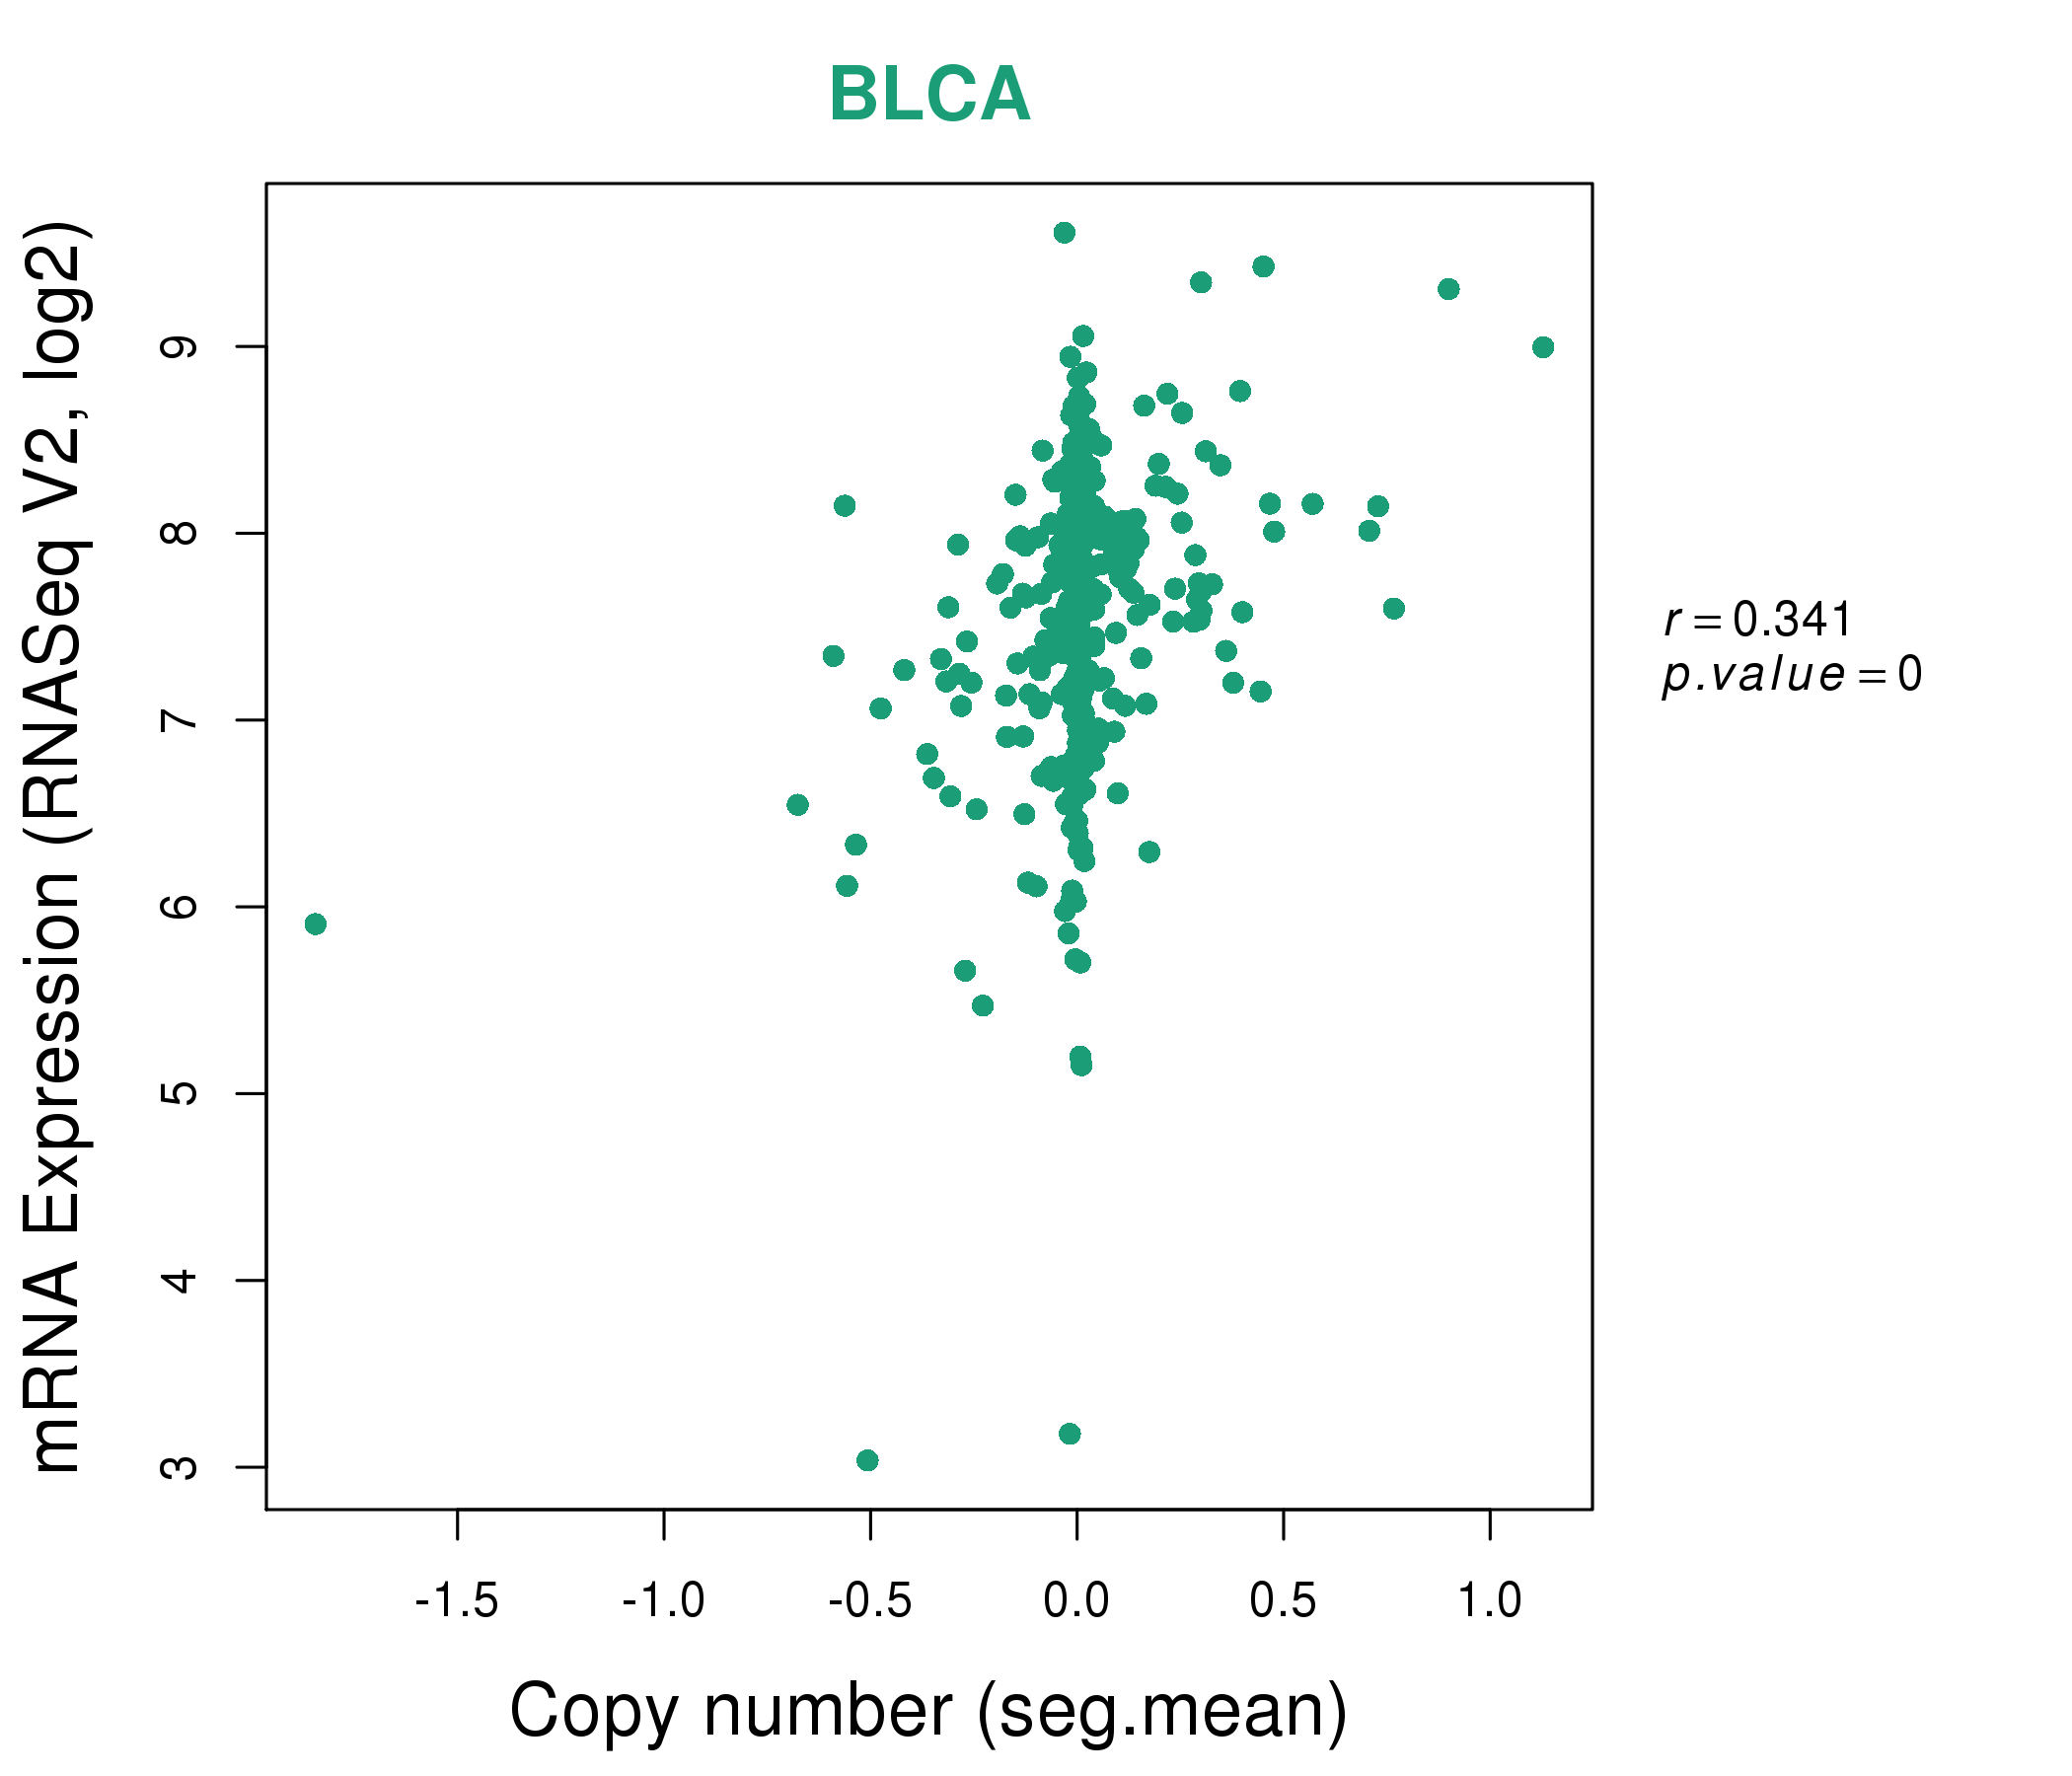
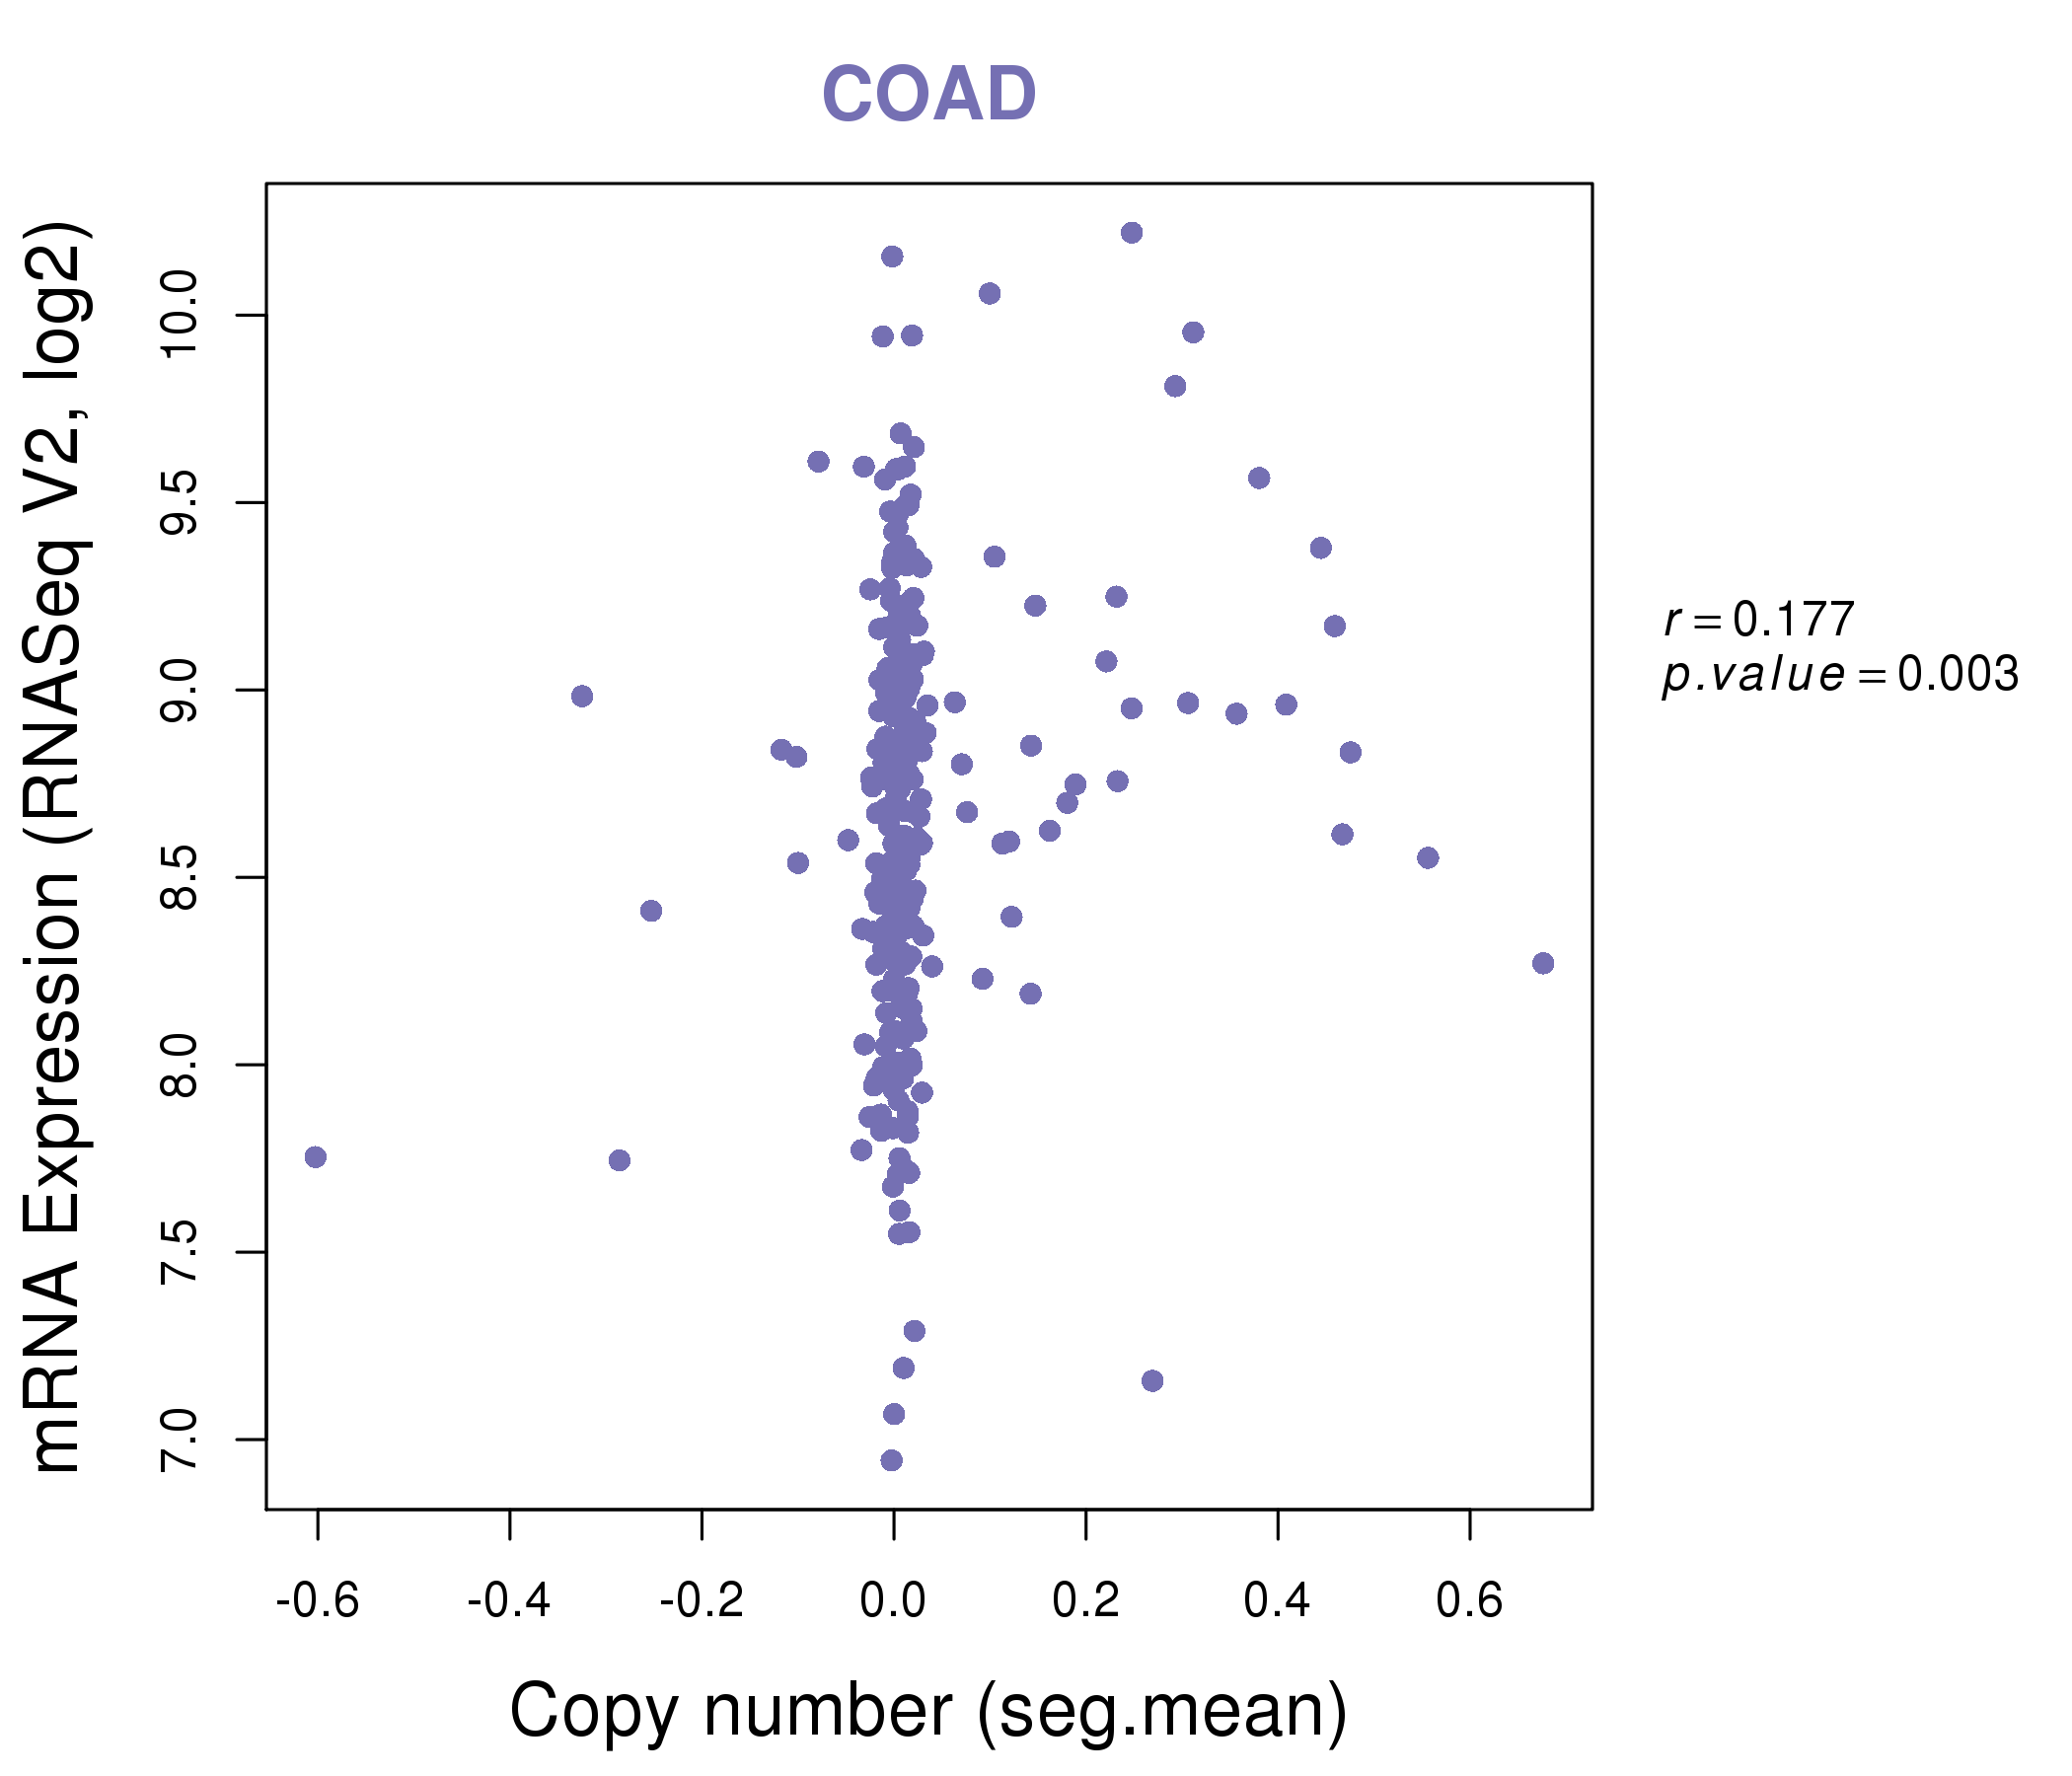
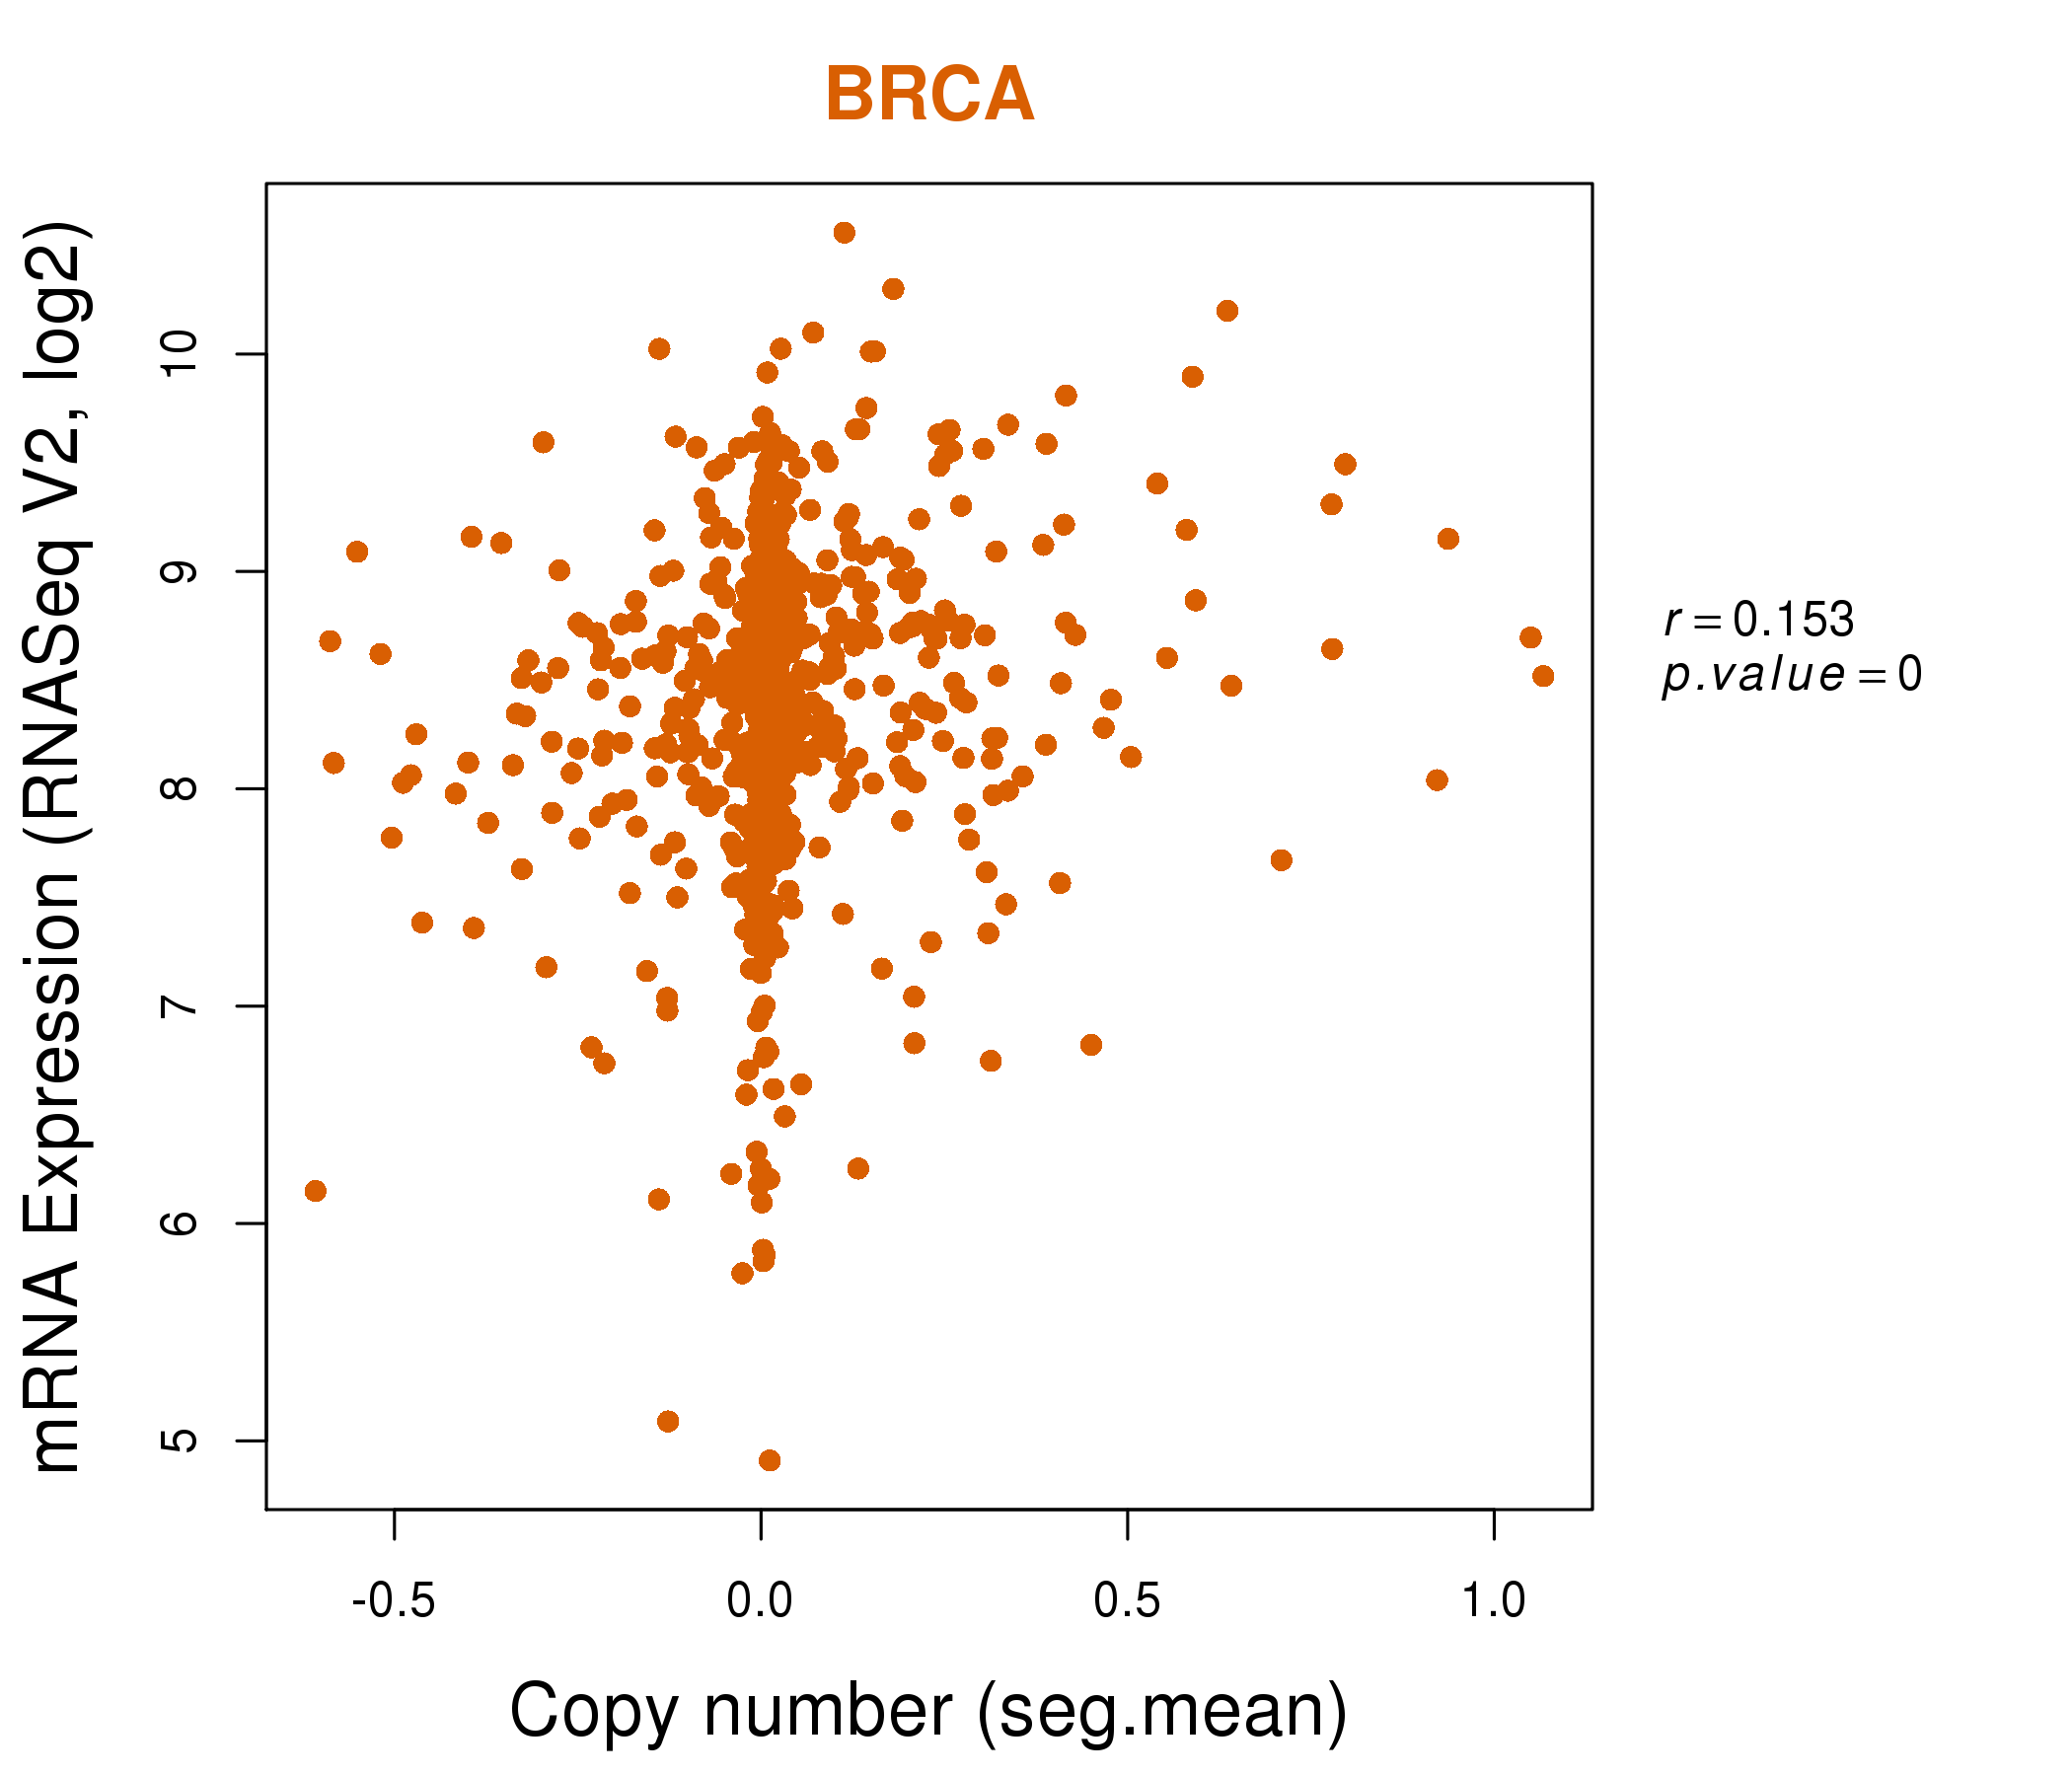
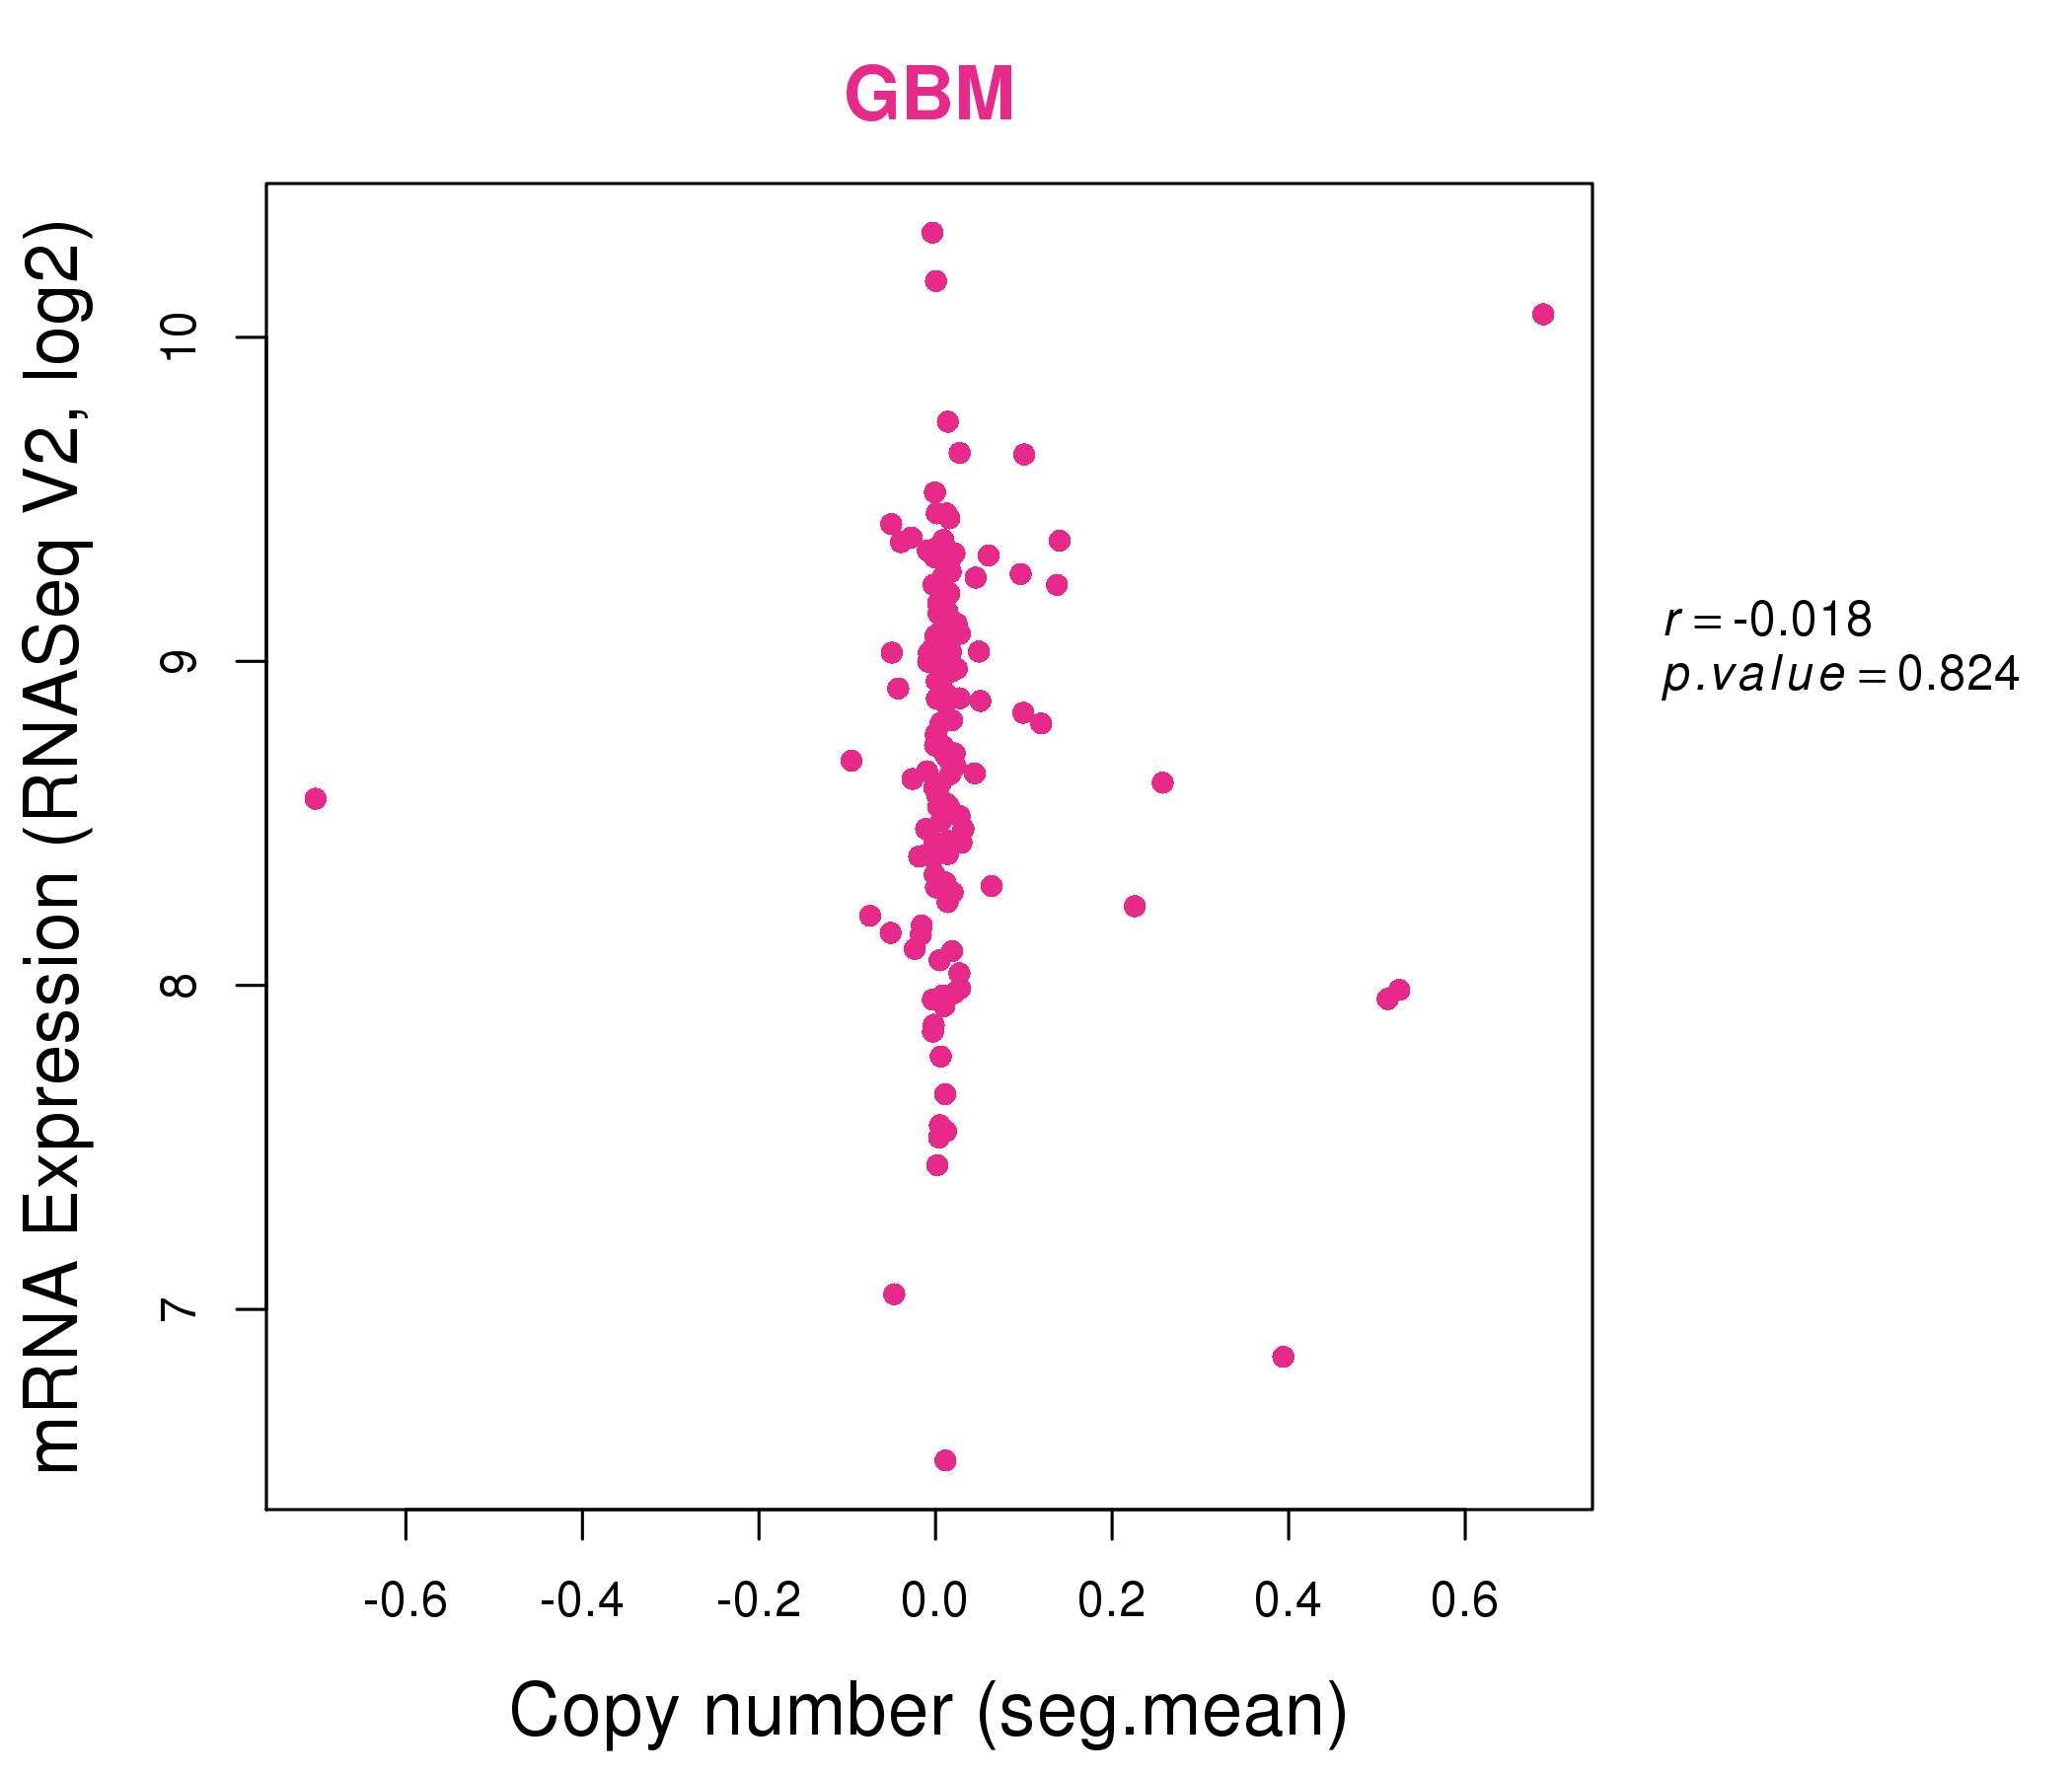
| * This plots show the correlation between CNV and gene expression. |
: Open all plots for all cancer types
 |
|
 |
|
| Top |
| Gene-Gene Network Information |
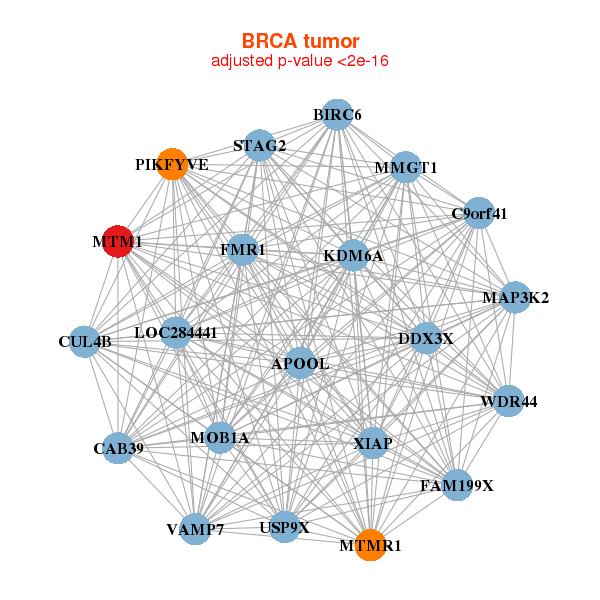
| * Co-Expression network figures were drawn using R package igraph. Only the top 20 genes with the highest correlations were shown. Red circle: input gene, orange circle: cell metabolism gene, sky circle: other gene |
: Open all plots for all cancer types
 |
|
| APOOL,BIRC6,C9orf41,CAB39,CUL4B,DDX3X,FAM199X, FMR1,KDM6A,LOC284441,MAP3K2,MMGT1,MOB1A,MTM1, MTMR1,PIKFYVE,STAG2,USP9X,VAMP7,WDR44,XIAP | ABHD13,ACBD3,ATF1,BIRC2,TRAPPC13,MAGT1,MARCH7, MFN1,MTM1,MTMR6,MYNN,NAPG,NEDD1,STXBP3, TBK1,TWISTNB,UBXN4,UTP15,VEZF1,YTHDC2,ZNF800 |
 |
|
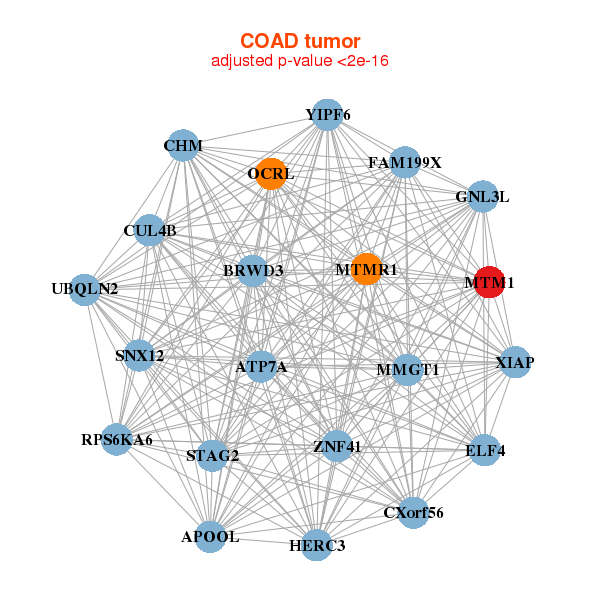
| APOOL,ATP7A,BRWD3,CHM,CUL4B,CXorf56,ELF4, FAM199X,GNL3L,HERC3,MMGT1,MTM1,MTMR1,OCRL, RPS6KA6,SNX12,STAG2,UBQLN2,XIAP,YIPF6,ZNF41 | ACVR1B,BCAS1,CAPN5,CLMN,EIF2AK3,ENDOD1,FGFR3, GALNT12,IRF6,ITM2C,MCTP2,MTM1,NR3C2,PARM1, PSD3,SCNN1A,SLC4A4,SPIRE2,STYK1,SYTL2,TMEM63B |
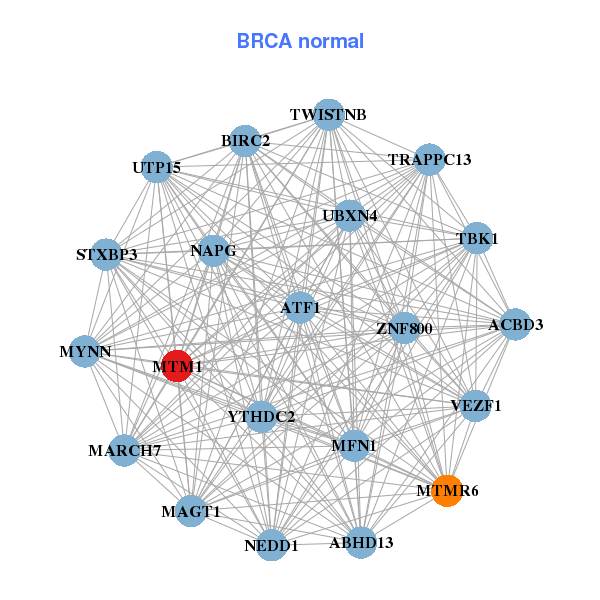
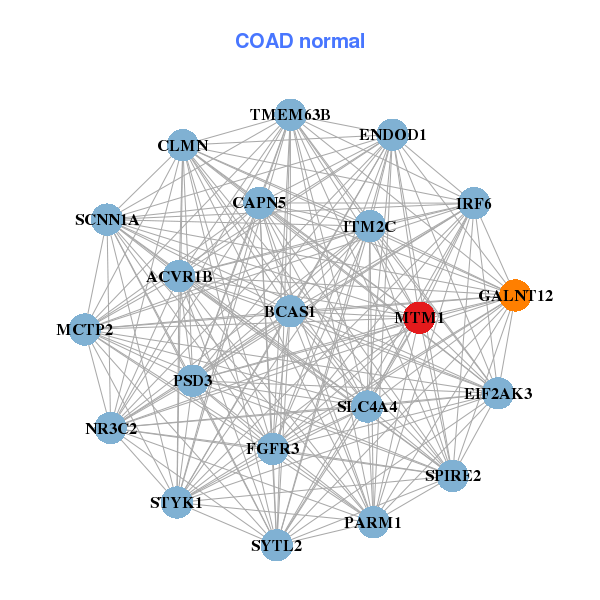
| * Co-Expression network figures were drawn using R package igraph. Only the top 20 genes with the highest correlations were shown. Red circle: input gene, orange circle: cell metabolism gene, sky circle: other gene |
: Open all plots for all cancer types
| Top |
: Open all interacting genes' information including KEGG pathway for all interacting genes from DAVID
| Top |
| Pharmacological Information for MTM1 |
| There's no related Drug. |
| Top |
| Cross referenced IDs for MTM1 |
| * We obtained these cross-references from Uniprot database. It covers 150 different DBs, 18 categories. http://www.uniprot.org/help/cross_references_section |
: Open all cross reference information
|
Copyright © 2016-Present - The Univsersity of Texas Health Science Center at Houston @ |