|
||||||||||||||||||||
| |
| Phenotypic Information (metabolism pathway, cancer, disease, phenome) |
| |
| |
| Gene-Gene Network Information: Co-Expression Network, Interacting Genes & KEGG |
| |
|


| Gene Summary for MTTP |
| Basic gene info. | Gene symbol | MTTP |
| Gene name | microsomal triglyceride transfer protein | |
| Synonyms | ABL|MTP | |
| Cytomap | UCSC genome browser: 4q24 | |
| Genomic location | chr4 :100485239-100545154 | |
| Type of gene | protein-coding | |
| RefGenes | NM_000253.3, NM_001300785.1, | |
| Ensembl id | ENSG00000138823 | |
| Description | microsomal triglyceride transfer protein (large polypeptide, 88kDa)microsomal triglyceride transfer protein large subunit | |
| Modification date | 20141207 | |
| dbXrefs | MIM : 157147 | |
| HGNC : HGNC | ||
| Ensembl : ENSG00000138823 | ||
| HPRD : 01144 | ||
| Vega : OTTHUMG00000131023 | ||
| Protein | UniProt: P55157 go to UniProt's Cross Reference DB Table | |
| Expression | CleanEX: HS_MTTP | |
| BioGPS: 4547 | ||
| Gene Expression Atlas: ENSG00000138823 | ||
| The Human Protein Atlas: ENSG00000138823 | ||
| Pathway | NCI Pathway Interaction Database: MTTP | |
| KEGG: MTTP | ||
| REACTOME: MTTP | ||
| ConsensusPathDB | ||
| Pathway Commons: MTTP | ||
| Metabolism | MetaCyc: MTTP | |
| HUMANCyc: MTTP | ||
| Regulation | Ensembl's Regulation: ENSG00000138823 | |
| miRBase: chr4 :100,485,239-100,545,154 | ||
| TargetScan: NM_000253 | ||
| cisRED: ENSG00000138823 | ||
| Context | iHOP: MTTP | |
| cancer metabolism search in PubMed: MTTP | ||
| UCL Cancer Institute: MTTP | ||
| Assigned class in ccmGDB | A - This gene has a literature evidence and it belongs to cancer gene. | |
| References showing role of MTTP in cancer cell metabolism | 1. Meidtner K, Fisher E, Ängquist L, Holst C, Vimaleswaran KS, et al. (2014) Variation in genes related to hepatic lipid metabolism and changes in waist circumference and body weight. Genes & nutrition 9: 1-11. go to article | |
| Top |
| Phenotypic Information for MTTP(metabolism pathway, cancer, disease, phenome) |
| Cancer | CGAP: MTTP |
| Familial Cancer Database: MTTP | |
| * This gene is included in those cancer gene databases. |
|
|
|
|
|
|
| ||||||||||||||
Oncogene 1 | Significant driver gene in | |||||||||||||||||||
| cf) number; DB name 1 Oncogene; http://nar.oxfordjournals.org/content/35/suppl_1/D721.long, 2 Tumor Suppressor gene; https://bioinfo.uth.edu/TSGene/, 3 Cancer Gene Census; http://www.nature.com/nrc/journal/v4/n3/abs/nrc1299.html, 4 CancerGenes; http://nar.oxfordjournals.org/content/35/suppl_1/D721.long, 5 Network of Cancer Gene; http://ncg.kcl.ac.uk/index.php, 1Therapeutic Vulnerabilities in Cancer; http://cbio.mskcc.org/cancergenomics/statius/ |
| REACTOME_METABOLISM_OF_LIPIDS_AND_LIPOPROTEINS REACTOME_LIPOPROTEIN_METABOLISM | |
| OMIM | 157147; gene. 200100; phenotype. |
| Orphanet | 14; Abetalipoproteinemia. 426; Familial hypobetalipoproteinemia. |
| Disease | KEGG Disease: MTTP |
| MedGen: MTTP (Human Medical Genetics with Condition) | |
| ClinVar: MTTP | |
| Phenotype | MGI: MTTP (International Mouse Phenotyping Consortium) |
| PhenomicDB: MTTP | |
| Mutations for MTTP |
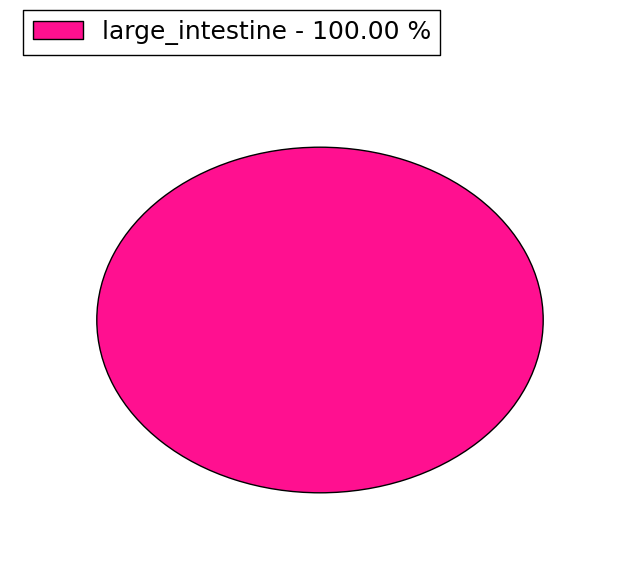
| * Under tables are showing count per each tissue to give us broad intuition about tissue specific mutation patterns.You can go to the detailed page for each mutation database's web site. |
| - Statistics for Tissue and Mutation type | Top |
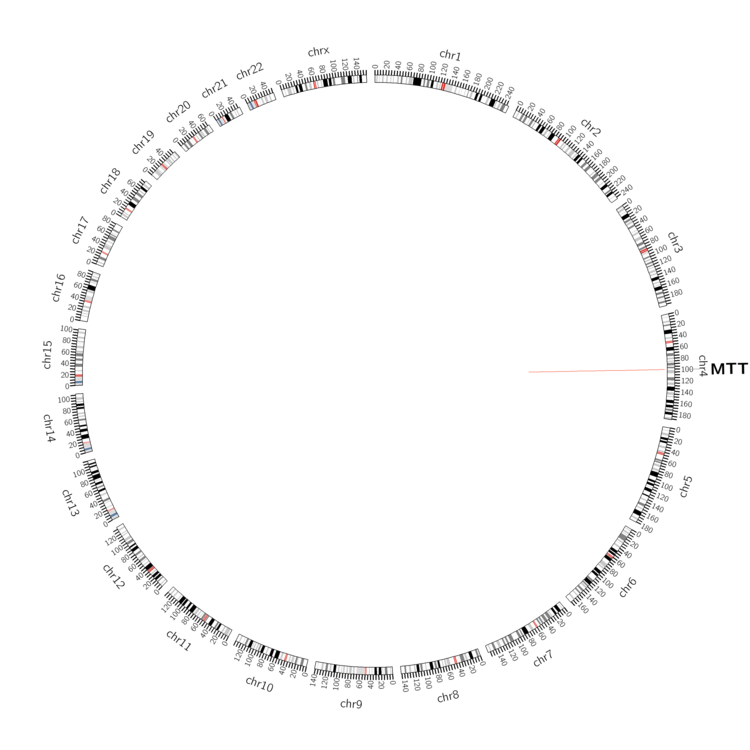 |
| - For Inter-chromosomal Variations |
| There's no inter-chromosomal structural variation. |
| - For Intra-chromosomal Variations |
| * Intra-chromosomal variantions includes 'intrachromosomal amplicon to amplicon', 'intrachromosomal amplicon to non-amplified dna', 'intrachromosomal deletion', 'intrachromosomal fold-back inversion', 'intrachromosomal inversion', 'intrachromosomal tandem duplication', 'Intrachromosomal unknown type', 'intrachromosomal with inverted orientation', 'intrachromosomal with non-inverted orientation'. |
 |
| Sample | Symbol_a | Chr_a | Start_a | End_a | Symbol_b | Chr_b | Start_b | End_b |
| ovary | MTTP | chr4 | 100543395 | 100543415 | MTTP | chr4 | 100544692 | 100544712 |
| cf) Tissue number; Tissue name (1;Breast, 2;Central_nervous_system, 3;Haematopoietic_and_lymphoid_tissue, 4;Large_intestine, 5;Liver, 6;Lung, 7;Ovary, 8;Pancreas, 9;Prostate, 10;Skin, 11;Soft_tissue, 12;Upper_aerodigestive_tract) |
| * From mRNA Sanger sequences, Chitars2.0 arranged chimeric transcripts. This table shows MTTP related fusion information. |
| ID | Head Gene | Tail Gene | Accession | Gene_a | qStart_a | qEnd_a | Chromosome_a | tStart_a | tEnd_a | Gene_a | qStart_a | qEnd_a | Chromosome_a | tStart_a | tEnd_a |
| Top |
| There's no copy number variation information in COSMIC data for this gene. |
| Top |
|
 |
| Top |
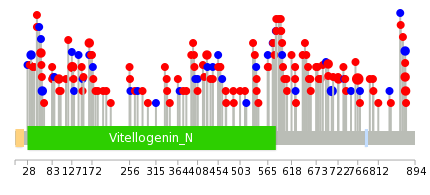
| Stat. for Non-Synonymous SNVs (# total SNVs=97) | (# total SNVs=31) |
 |  |
(# total SNVs=1) | (# total SNVs=1) |
 |  |
| Top |
| * When you move the cursor on each content, you can see more deailed mutation information on the Tooltip. Those are primary_site,primary_histology,mutation(aa),pubmedID. |
| GRCh37 position | Mutation(aa) | Unique sampleID count |
| chr4:100540210-100540210 | p.E766G | 6 |
| chr4:100534204-100534204 | p.N708N | 3 |
| chr4:100532398-100532398 | p.? | 3 |
| chr4:100504664-100504664 | p.I128T | 3 |
| chr4:100503146-100503146 | p.G49V | 2 |
| chr4:100504575-100504575 | p.E98D | 2 |
| chr4:100503173-100503173 | p.R58H | 2 |
| chr4:100534247-100534247 | p.D723N | 2 |
| chr4:100534268-100534268 | p.G730* | 2 |
| chr4:100522814-100522814 | p.M429I | 2 |
| Top |
|
 |
| Point Mutation/ Tissue ID | 1 | 2 | 3 | 4 | 5 | 6 | 7 | 8 | 9 | 10 | 11 | 12 | 13 | 14 | 15 | 16 | 17 | 18 | 19 | 20 |
| # sample | 5 | 6 | 1 | 31 | 1 | 4 | 4 | 12 | 9 | 3 | 1 | 3 | 15 | 11 | 2 | 11 | ||||
| # mutation | 5 | 6 | 1 | 27 | 1 | 4 | 4 | 13 | 9 | 3 | 1 | 3 | 20 | 11 | 2 | 12 | ||||
| nonsynonymous SNV | 3 | 3 | 20 | 1 | 2 | 3 | 10 | 4 | 3 | 2 | 16 | 10 | 1 | 9 | ||||||
| synonymous SNV | 2 | 3 | 1 | 8 | 2 | 1 | 3 | 5 | 1 | 1 | 4 | 1 | 1 | 3 |
| cf) Tissue ID; Tissue type (1; BLCA[Bladder Urothelial Carcinoma], 2; BRCA[Breast invasive carcinoma], 3; CESC[Cervical squamous cell carcinoma and endocervical adenocarcinoma], 4; COAD[Colon adenocarcinoma], 5; GBM[Glioblastoma multiforme], 6; Glioma Low Grade, 7; HNSC[Head and Neck squamous cell carcinoma], 8; KICH[Kidney Chromophobe], 9; KIRC[Kidney renal clear cell carcinoma], 10; KIRP[Kidney renal papillary cell carcinoma], 11; LAML[Acute Myeloid Leukemia], 12; LUAD[Lung adenocarcinoma], 13; LUSC[Lung squamous cell carcinoma], 14; OV[Ovarian serous cystadenocarcinoma ], 15; PAAD[Pancreatic adenocarcinoma], 16; PRAD[Prostate adenocarcinoma], 17; SKCM[Skin Cutaneous Melanoma], 18:STAD[Stomach adenocarcinoma], 19:THCA[Thyroid carcinoma], 20:UCEC[Uterine Corpus Endometrial Carcinoma]) |
| Top |
| * We represented just top 10 SNVs. When you move the cursor on each content, you can see more deailed mutation information on the Tooltip. Those are primary_site, primary_histology, mutation(aa), pubmedID. |
| Genomic Position | Mutation(aa) | Unique sampleID count |
| chr4:100540210 | p.E766G | 6 |
| chr4:100534204 | p.N708N | 3 |
| chr4:100532503 | p.R626C | 2 |
| chr4:100543935 | p.A628T | 2 |
| chr4:100543939 | p.L36L | 2 |
| chr4:100532497 | p.Q872L | 2 |
| chr4:100503108 | p.E873D | 2 |
| chr4:100503146 | p.A676T | 1 |
| chr4:100518334 | p.R58H | 1 |
| chr4:100532321 | p.I170V | 1 |
| * Copy number data were extracted from TCGA using R package TCGA-Assembler. The URLs of all public data files on TCGA DCC data server were gathered on Jan-05-2015. Function ProcessCNAData in TCGA-Assembler package was used to obtain gene-level copy number value which is calculated as the average copy number of the genomic region of a gene. |
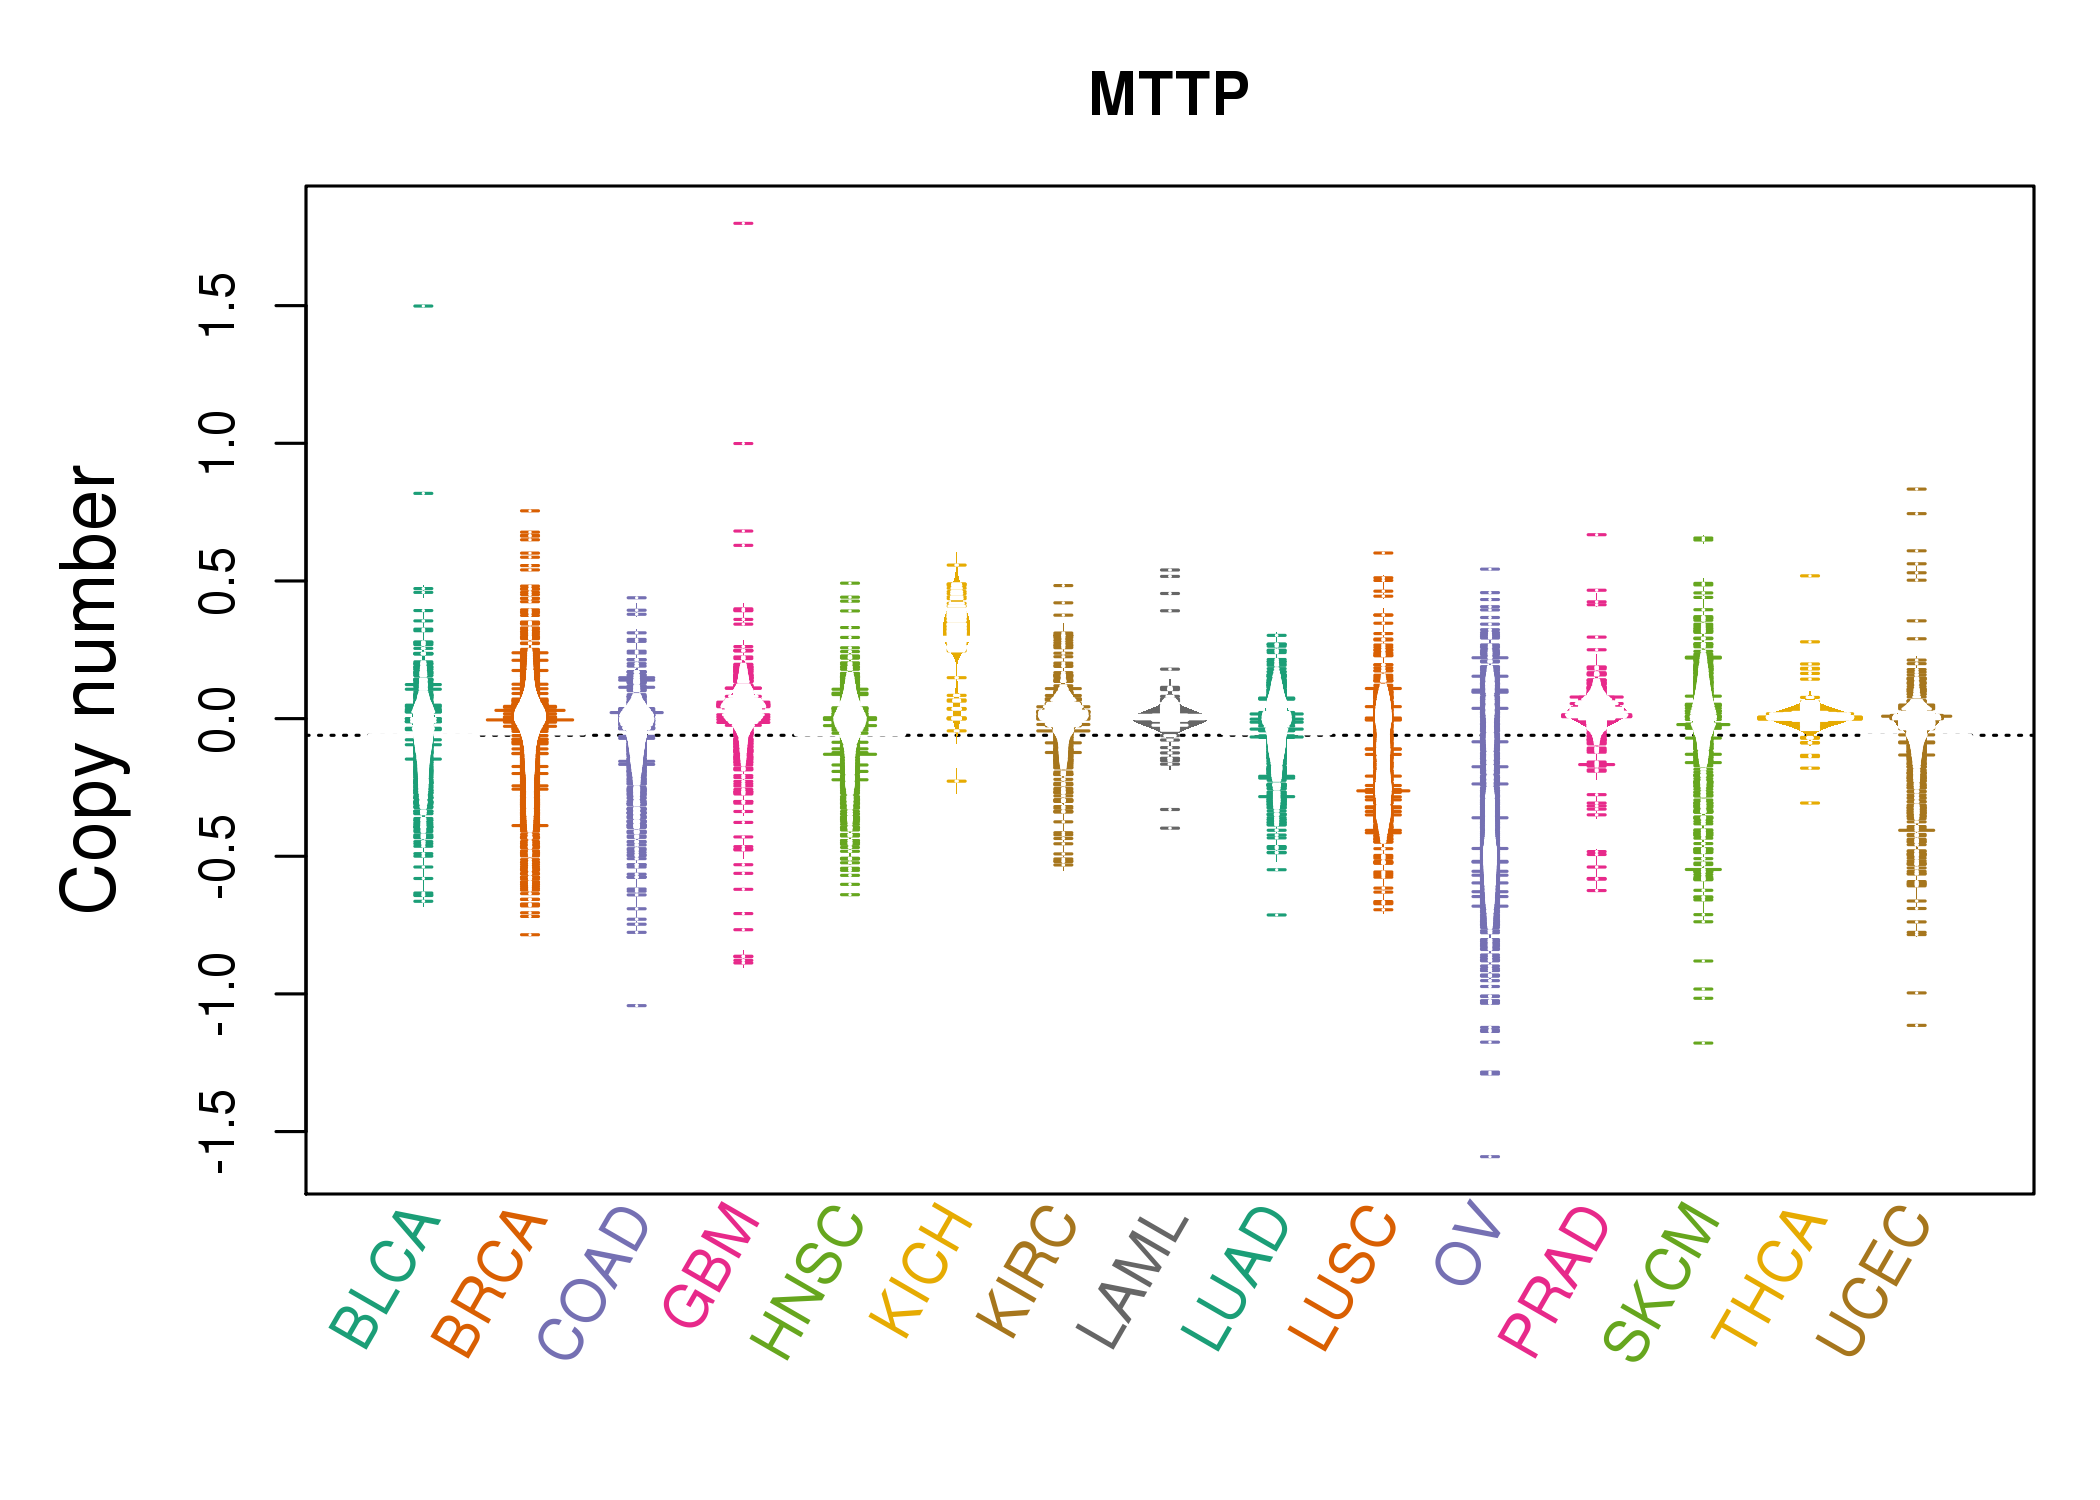 |
| cf) Tissue ID[Tissue type]: BLCA[Bladder Urothelial Carcinoma], BRCA[Breast invasive carcinoma], CESC[Cervical squamous cell carcinoma and endocervical adenocarcinoma], COAD[Colon adenocarcinoma], GBM[Glioblastoma multiforme], Glioma Low Grade, HNSC[Head and Neck squamous cell carcinoma], KICH[Kidney Chromophobe], KIRC[Kidney renal clear cell carcinoma], KIRP[Kidney renal papillary cell carcinoma], LAML[Acute Myeloid Leukemia], LUAD[Lung adenocarcinoma], LUSC[Lung squamous cell carcinoma], OV[Ovarian serous cystadenocarcinoma ], PAAD[Pancreatic adenocarcinoma], PRAD[Prostate adenocarcinoma], SKCM[Skin Cutaneous Melanoma], STAD[Stomach adenocarcinoma], THCA[Thyroid carcinoma], UCEC[Uterine Corpus Endometrial Carcinoma] |
| Top |
| Gene Expression for MTTP |
| * CCLE gene expression data were extracted from CCLE_Expression_Entrez_2012-10-18.res: Gene-centric RMA-normalized mRNA expression data. |
 |
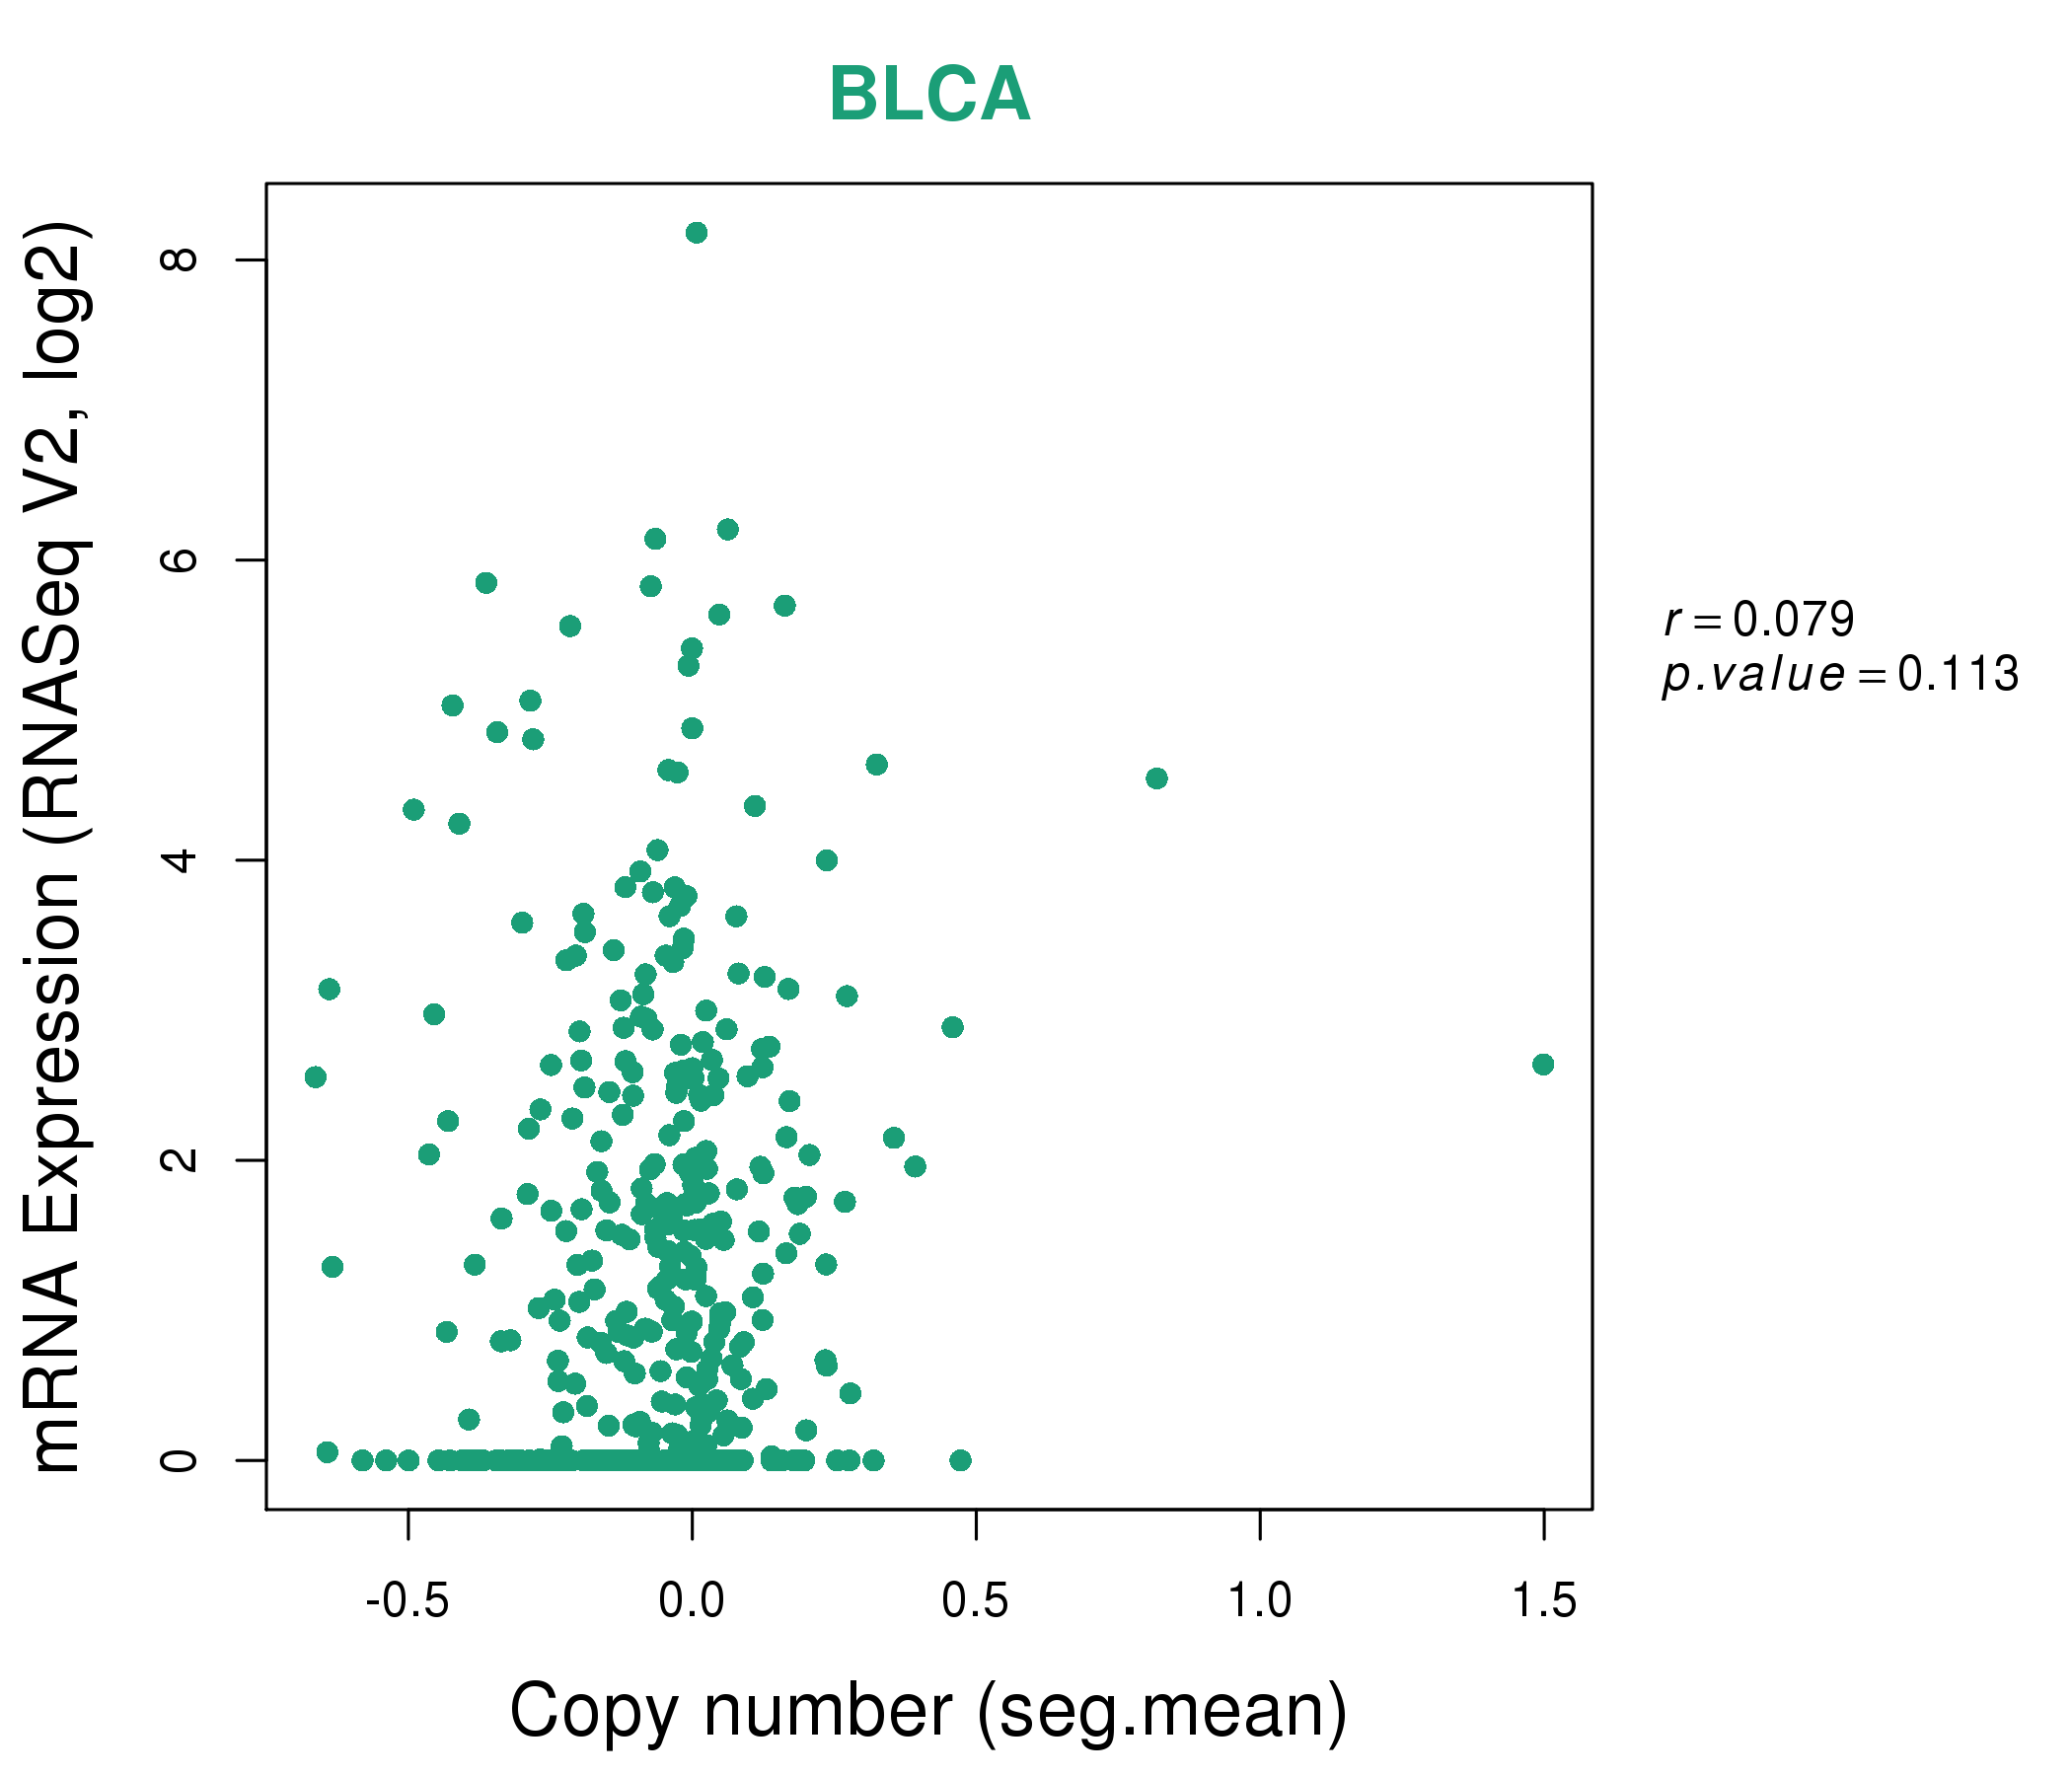
| * Normalized gene expression data of RNASeqV2 was extracted from TCGA using R package TCGA-Assembler. The URLs of all public data files on TCGA DCC data server were gathered at Jan-05-2015. Only eight cancer types have enough normal control samples for differential expression analysis. (t test, adjusted p<0.05 (using Benjamini-Hochberg FDR)) |
 |
| Top |
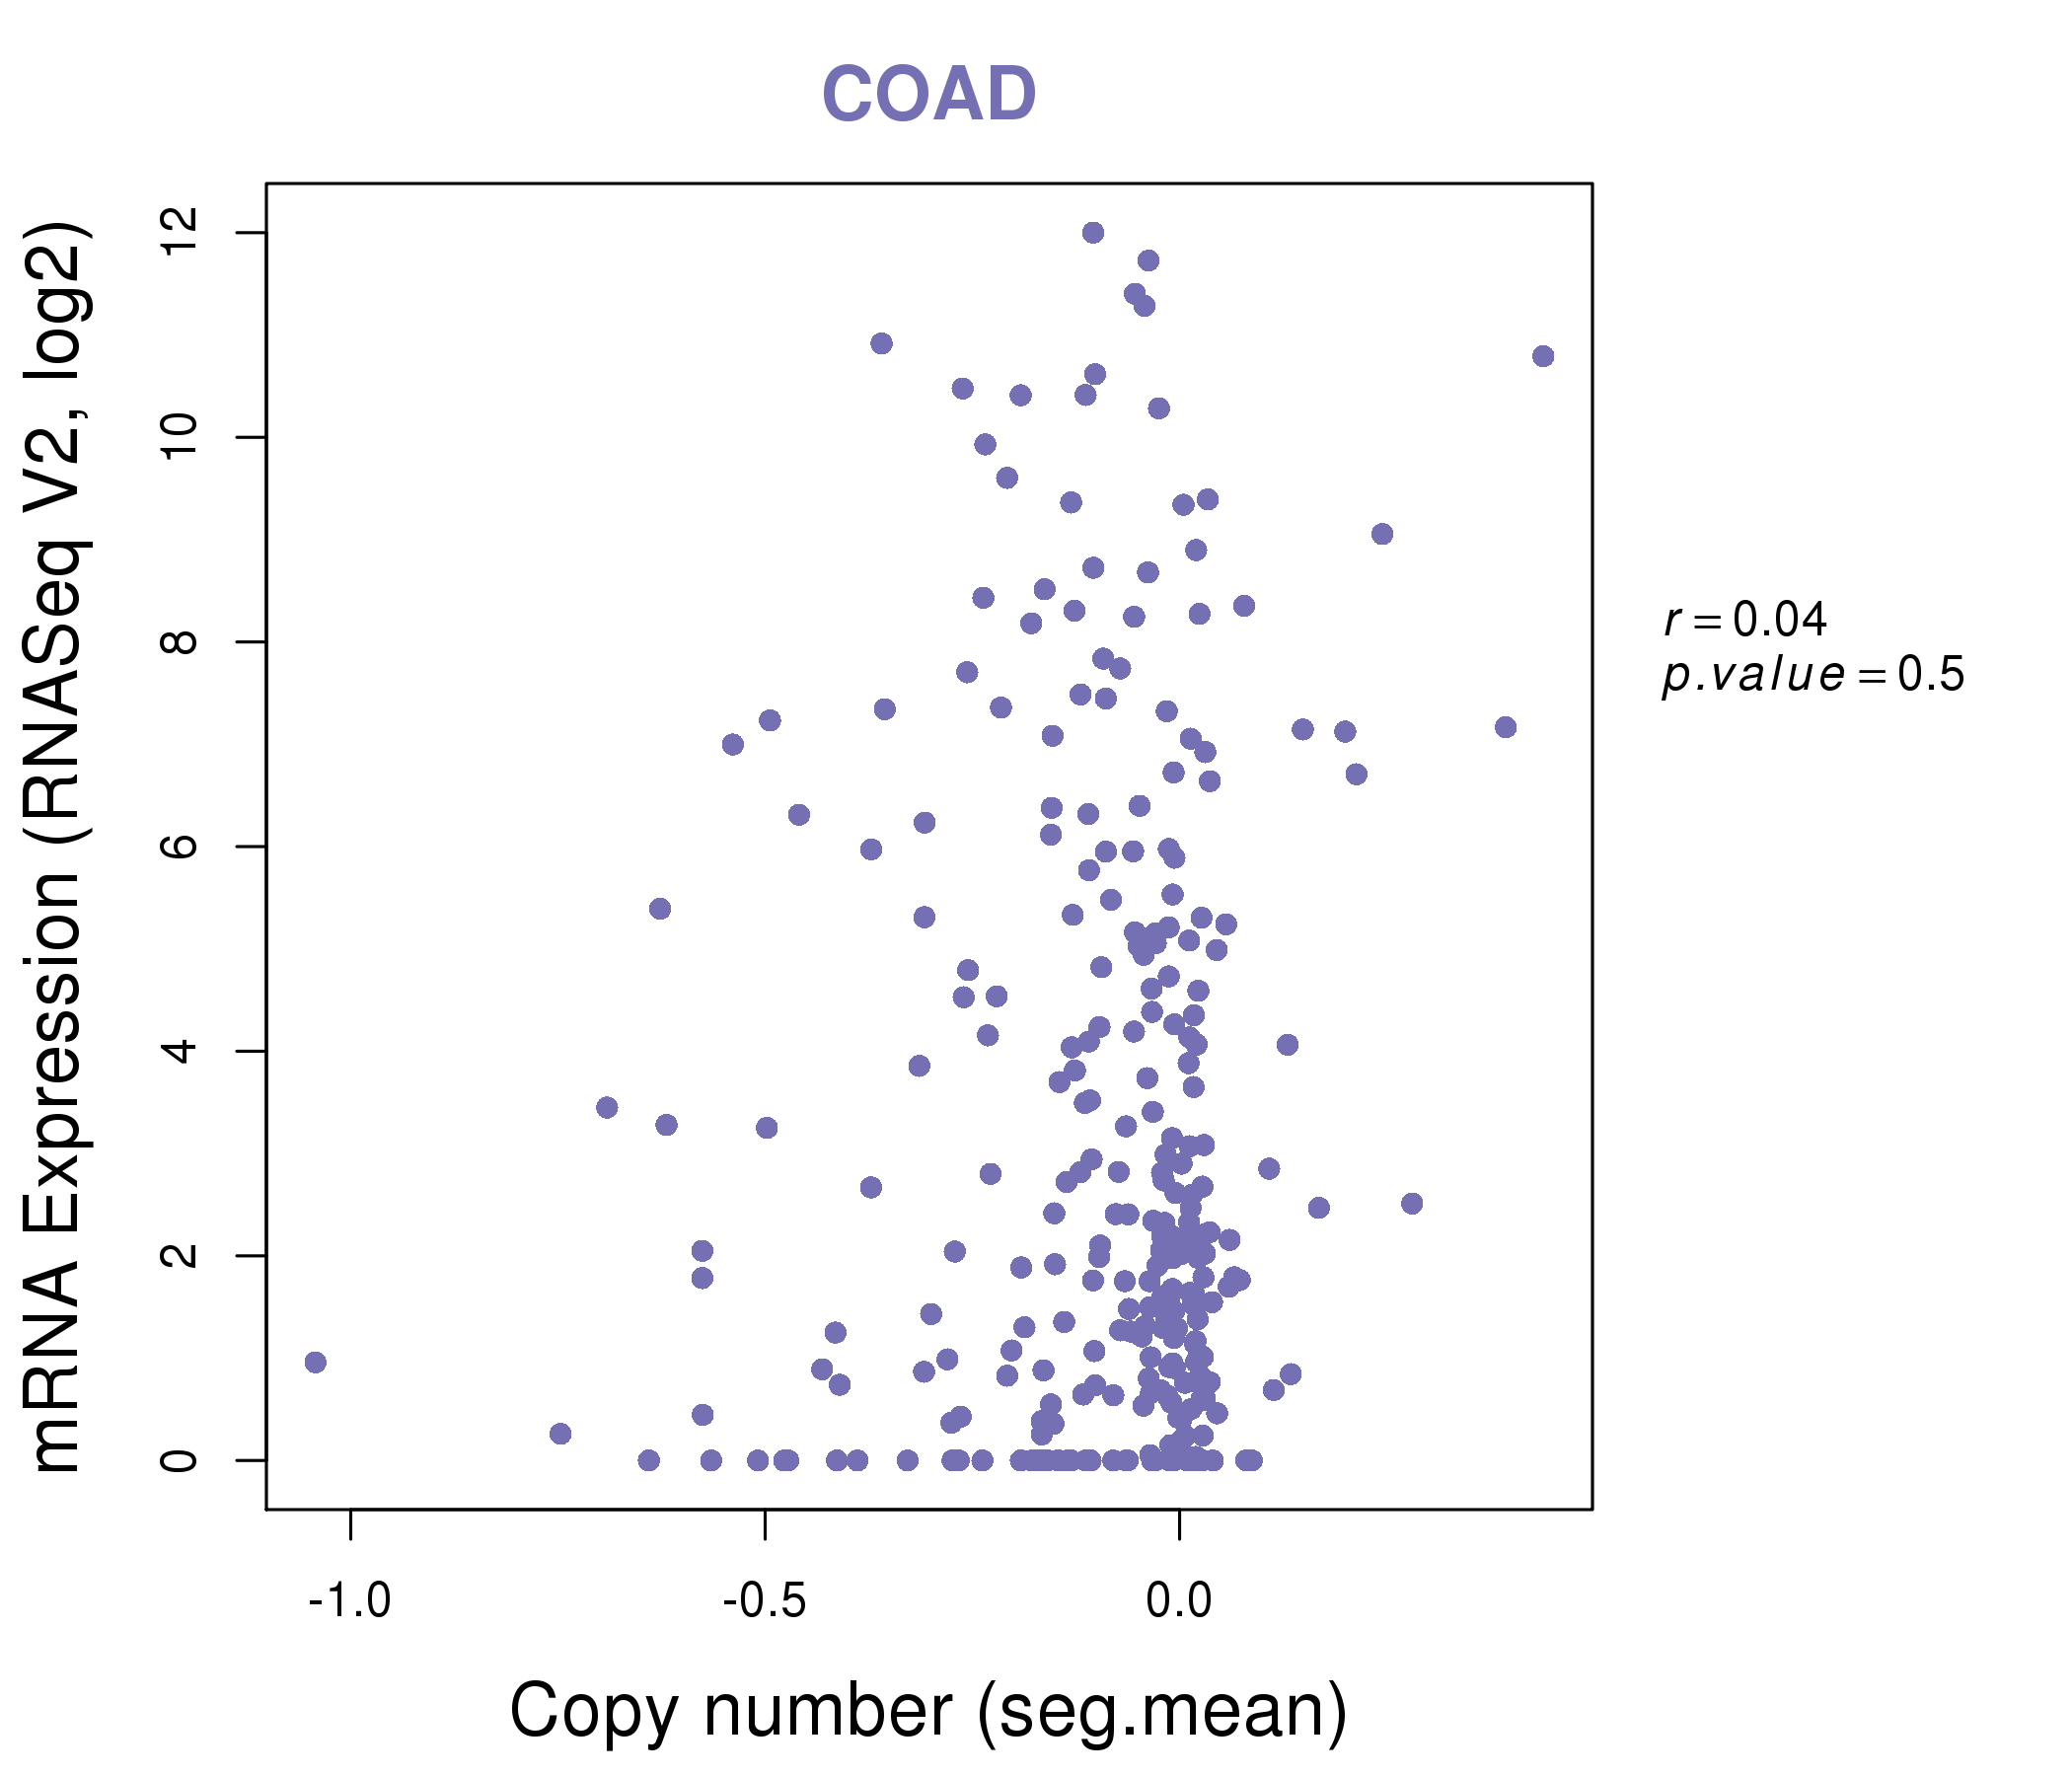
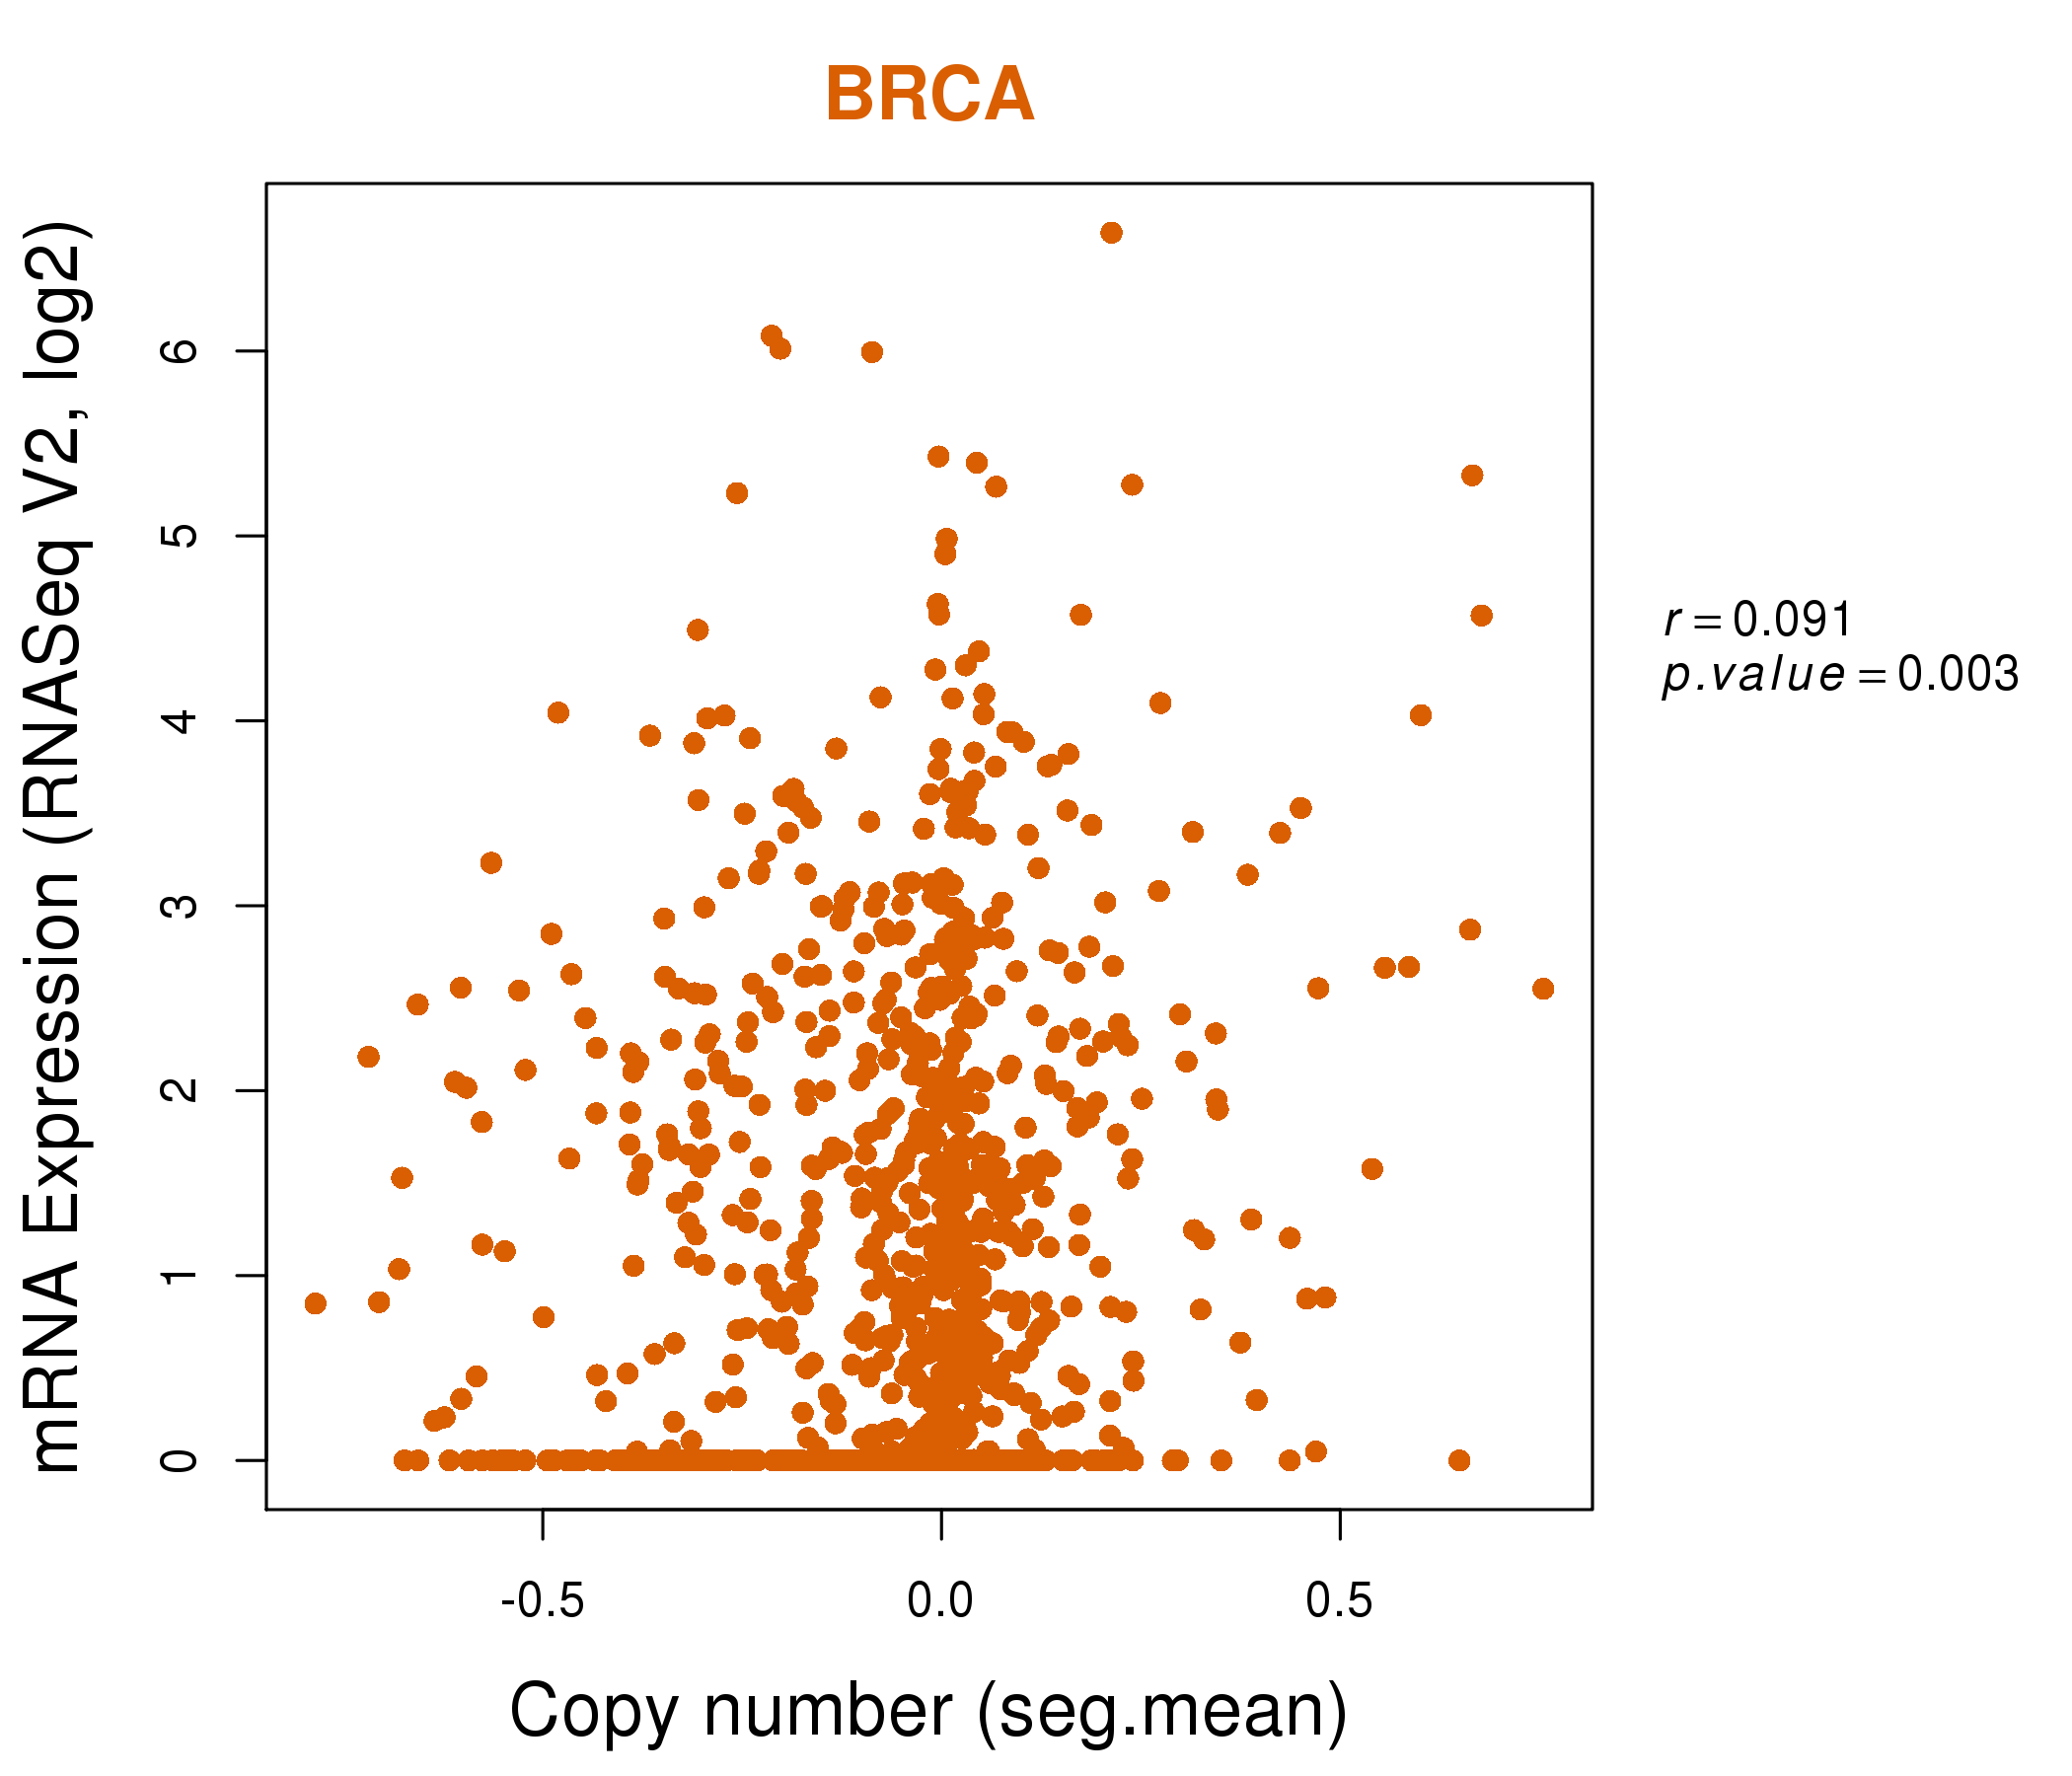
| * This plots show the correlation between CNV and gene expression. |
: Open all plots for all cancer types
 |
|
 |
|

| Top |
| Gene-Gene Network Information |
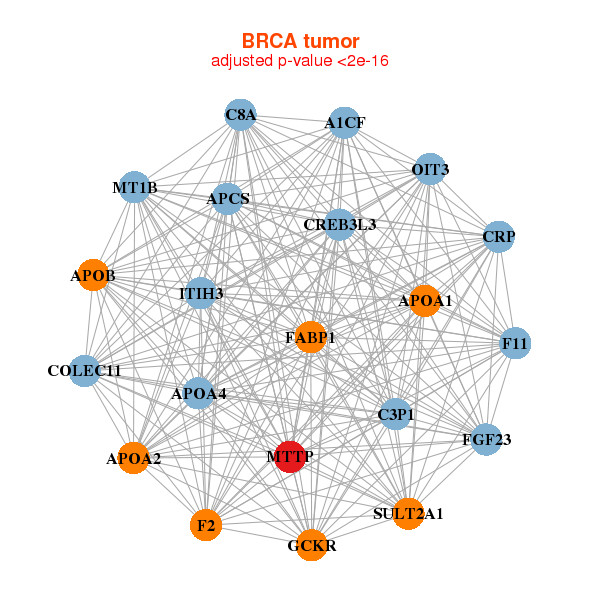
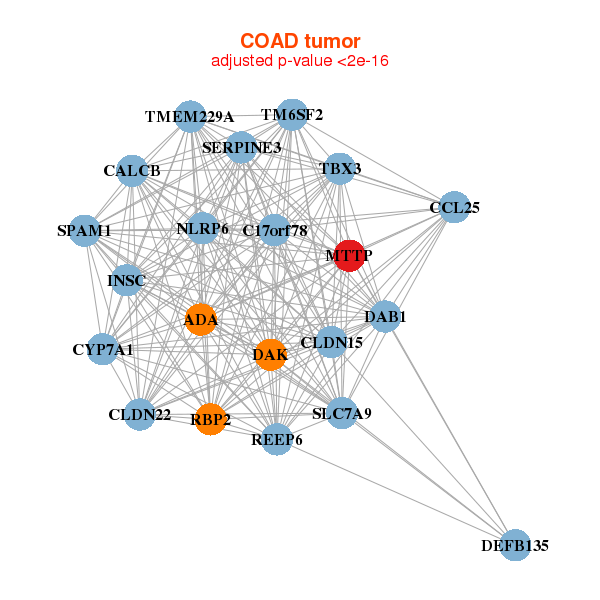
| * Co-Expression network figures were drawn using R package igraph. Only the top 20 genes with the highest correlations were shown. Red circle: input gene, orange circle: cell metabolism gene, sky circle: other gene |
: Open all plots for all cancer types
 |
| ||||
| A1CF,APCS,APOA1,APOA2,APOA4,APOB,C3P1, C8A,COLEC11,CREB3L3,CRP,F11,F2,FABP1, FGF23,GCKR,ITIH3,MT1B,MTTP,OIT3,SULT2A1 | ANKRD40,AP3S2,ARHGEF6,LINC00310,C6orf106,CRYAB,CSDE1, EIF4E3,EPDR1,KAT2B,MTTP,NFE2L1,PPM1L,QKI, RHOQ,SETD3,SETD7,SGCB,TMEM56,YPEL2,YWHAG | ||||
 |
| ||||
| ADA,C17orf78,CALCB,CCL25,CLDN15,CLDN22,CYP7A1, DAB1,DAK,DEFB135,INSC,MTTP,NLRP6,RBP2, REEP6,SERPINE3,SLC7A9,SPAM1,TBX3,TM6SF2,TMEM229A | AADAC,APOB,CPO,CRISP1,CUBN,FAM99A,FAM99B, GSTA5,KCNJ13,LCE3E,LOC388428,MOS,MTTP,ONECUT3, OR10H1,OR10H5,OR4N5,PWAR4___F2RL3___PAWR,SOAT2,SPANXN3,UGT3A1 |
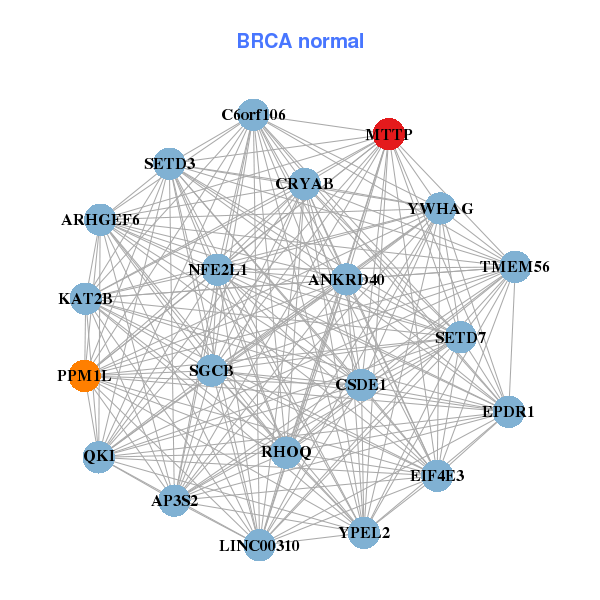

| * Co-Expression network figures were drawn using R package igraph. Only the top 20 genes with the highest correlations were shown. Red circle: input gene, orange circle: cell metabolism gene, sky circle: other gene |
: Open all plots for all cancer types
| Top |
: Open all interacting genes' information including KEGG pathway for all interacting genes from DAVID
| Top |
| Pharmacological Information for MTTP |
| DB Category | DB Name | DB's ID and Url link |
| Chemistry | BindingDB | P55157; -. |
| Chemistry | ChEMBL | CHEMBL2364681; -. |
| Organism-specific databases | PharmGKB | PA164742099; -. |
| Organism-specific databases | CTD | 4547; -. |
| * Gene Centered Interaction Network. |
 |
| * Drug Centered Interaction Network. |
| DrugBank ID | Target Name | Drug Groups | Generic Name | Drug Centered Network | Drug Structure |
| DB01094 | microsomal triglyceride transfer protein | approved | Hesperetin | 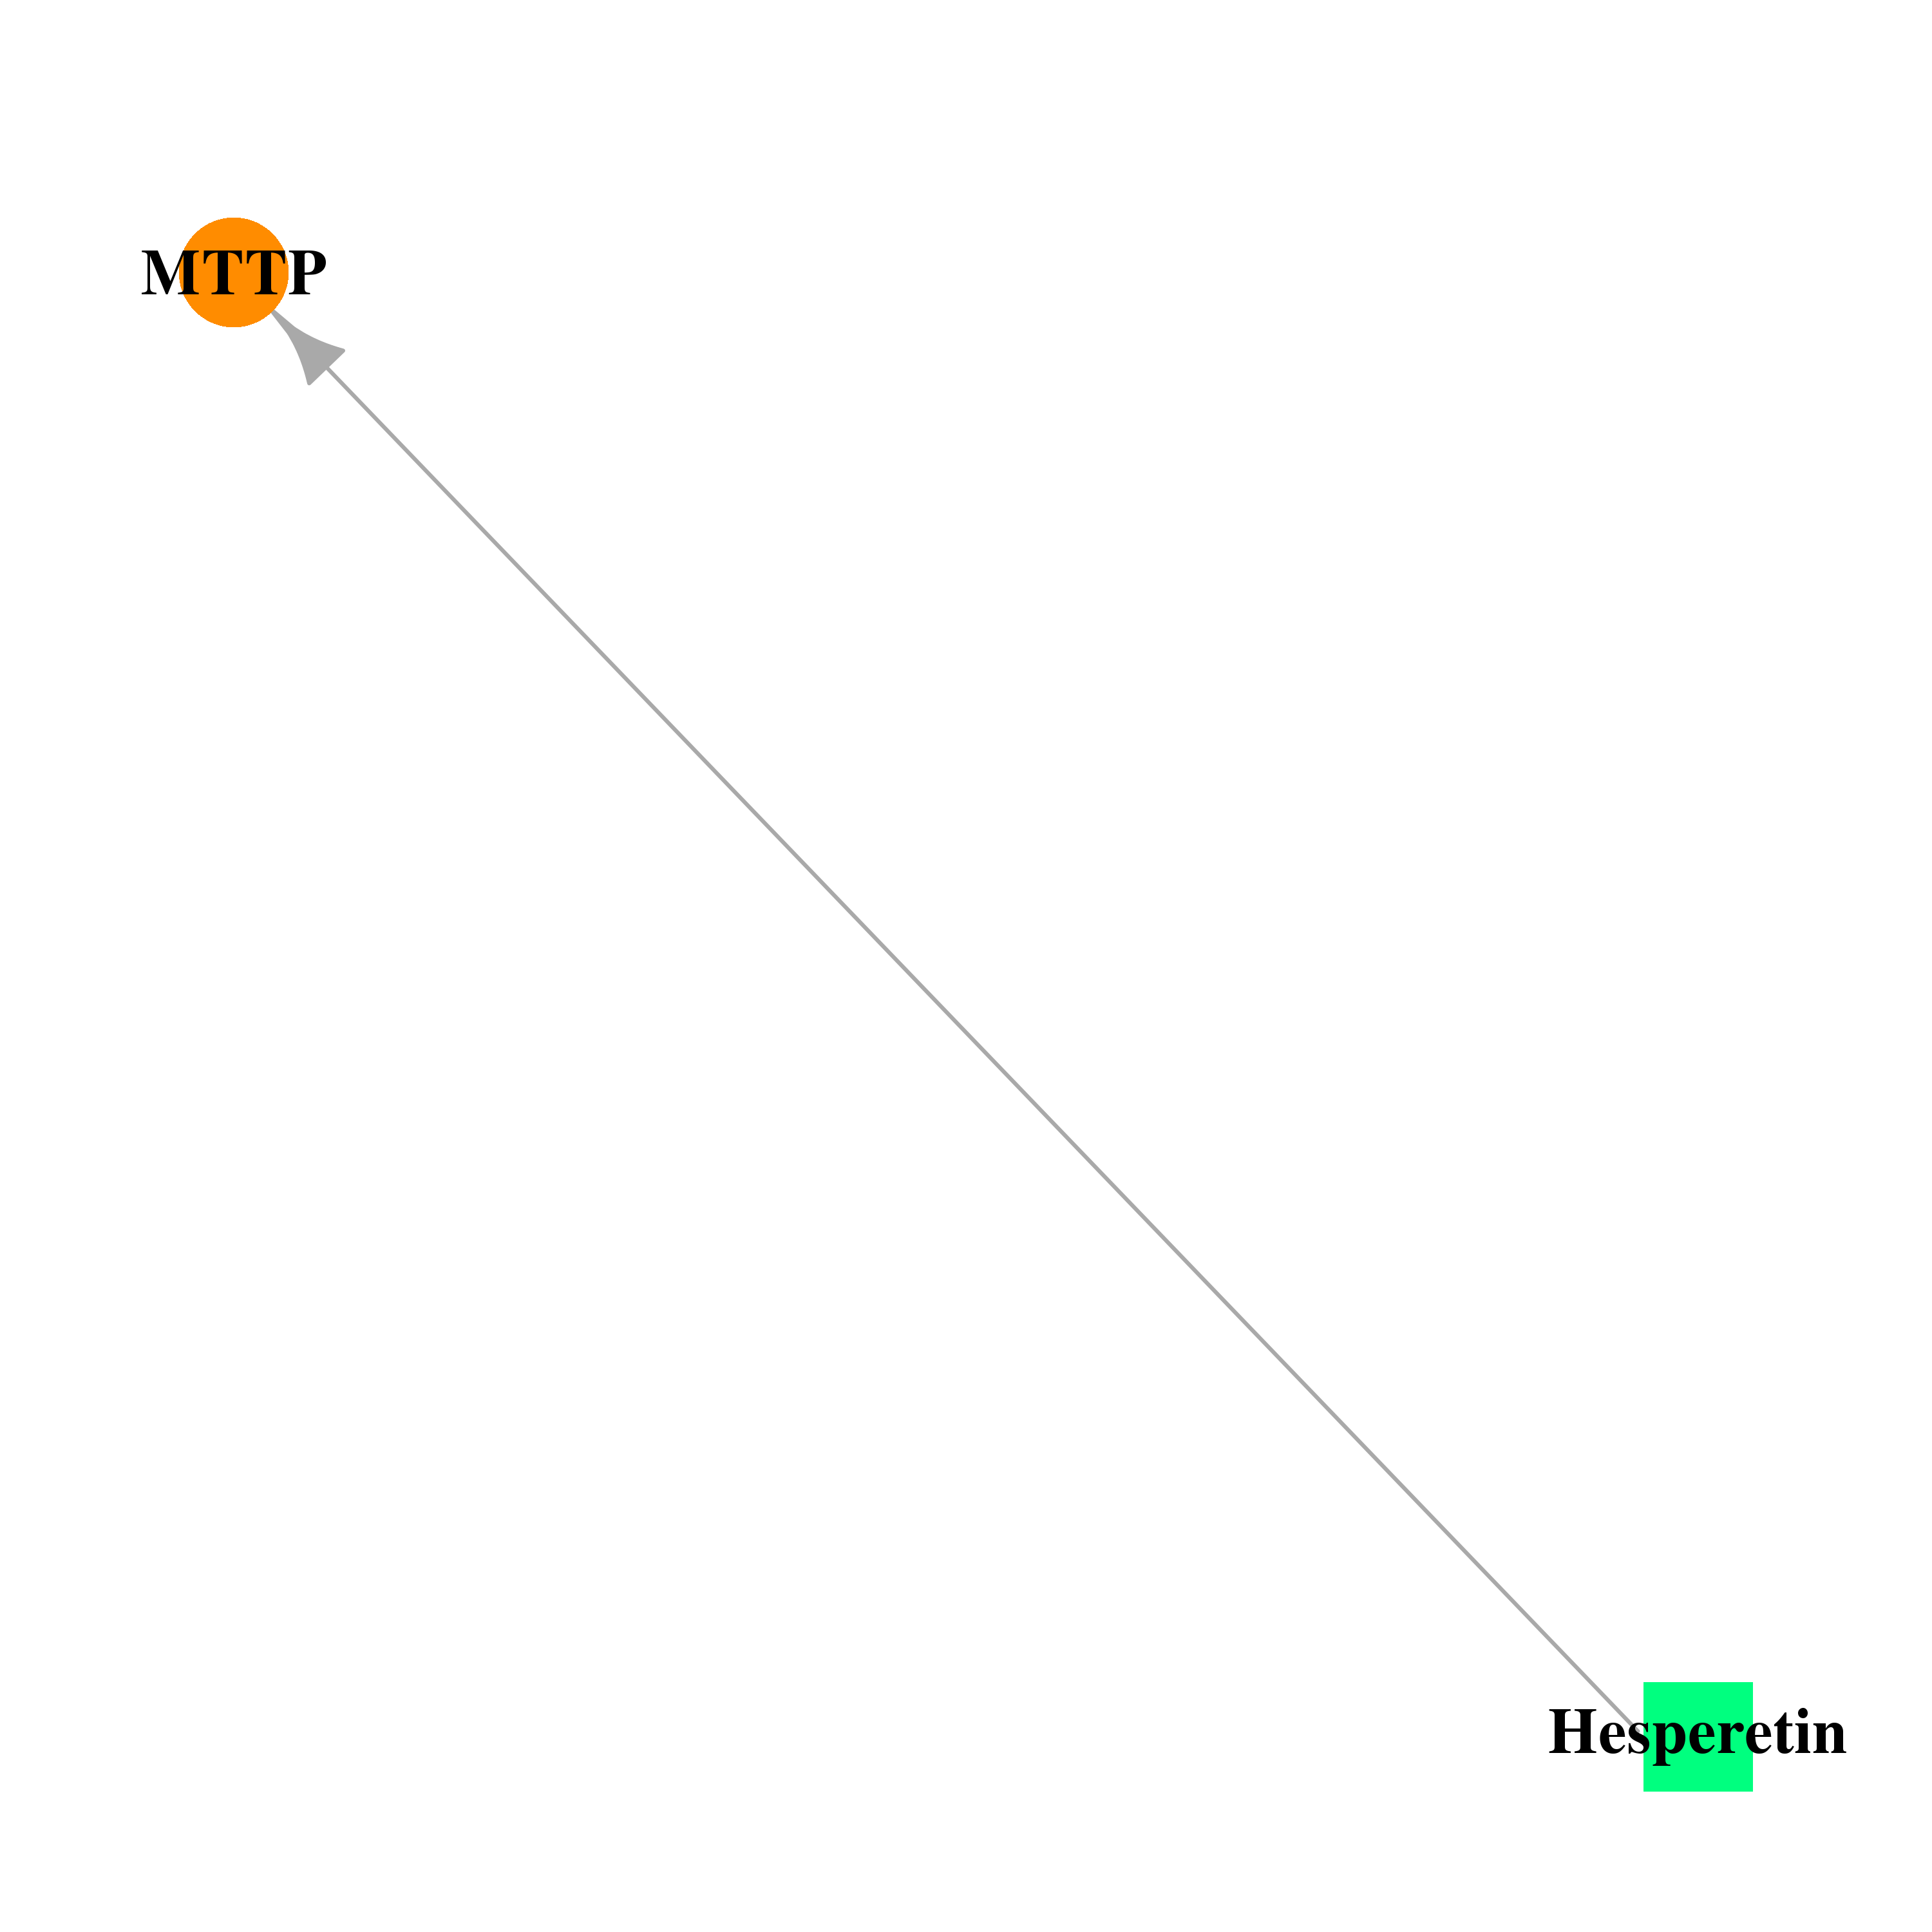 | 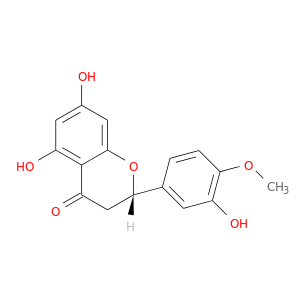 |
| Top |
| Cross referenced IDs for MTTP |
| * We obtained these cross-references from Uniprot database. It covers 150 different DBs, 18 categories. http://www.uniprot.org/help/cross_references_section |
: Open all cross reference information
|
Copyright © 2016-Present - The Univsersity of Texas Health Science Center at Houston @ |