|
||||||||||||||||||||
| |
| Phenotypic Information (metabolism pathway, cancer, disease, phenome) |
| |
| |
| Gene-Gene Network Information: Co-Expression Network, Interacting Genes & KEGG |
| |
|


| Gene Summary for MUT |
| Basic gene info. | Gene symbol | MUT |
| Gene name | methylmalonyl CoA mutase | |
| Synonyms | MCM | |
| Cytomap | UCSC genome browser: 6p12.3 | |
| Genomic location | chr6 :49398072-49431041 | |
| Type of gene | protein-coding | |
| RefGenes | NM_000255.3, | |
| Ensembl id | ENSG00000146085 | |
| Description | methylmalonyl Coenzyme A mutasemethylmalonyl-CoA isomerasemethylmalonyl-CoA mutase, mitochondrial | |
| Modification date | 20141219 | |
| dbXrefs | MIM : 609058 | |
| HGNC : HGNC | ||
| Ensembl : ENSG00000146085 | ||
| HPRD : 02014 | ||
| Vega : OTTHUMG00000014814 | ||
| Protein | UniProt: go to UniProt's Cross Reference DB Table | |
| Expression | CleanEX: HS_MUT | |
| BioGPS: 4594 | ||
| Gene Expression Atlas: ENSG00000146085 | ||
| The Human Protein Atlas: ENSG00000146085 | ||
| Pathway | NCI Pathway Interaction Database: MUT | |
| KEGG: MUT | ||
| REACTOME: MUT | ||
| ConsensusPathDB | ||
| Pathway Commons: MUT | ||
| Metabolism | MetaCyc: MUT | |
| HUMANCyc: MUT | ||
| Regulation | Ensembl's Regulation: ENSG00000146085 | |
| miRBase: chr6 :49,398,072-49,431,041 | ||
| TargetScan: NM_000255 | ||
| cisRED: ENSG00000146085 | ||
| Context | iHOP: MUT | |
| cancer metabolism search in PubMed: MUT | ||
| UCL Cancer Institute: MUT | ||
| Assigned class in ccmGDB | C | |
| Top |
| Phenotypic Information for MUT(metabolism pathway, cancer, disease, phenome) |
| Cancer | CGAP: MUT |
| Familial Cancer Database: MUT | |
| * This gene is included in those cancer gene databases. |
|
|
|
|
|
| . | ||||||||||||||
Oncogene 1 | Significant driver gene in | |||||||||||||||||||
| cf) number; DB name 1 Oncogene; http://nar.oxfordjournals.org/content/35/suppl_1/D721.long, 2 Tumor Suppressor gene; https://bioinfo.uth.edu/TSGene/, 3 Cancer Gene Census; http://www.nature.com/nrc/journal/v4/n3/abs/nrc1299.html, 4 CancerGenes; http://nar.oxfordjournals.org/content/35/suppl_1/D721.long, 5 Network of Cancer Gene; http://ncg.kcl.ac.uk/index.php, 1Therapeutic Vulnerabilities in Cancer; http://cbio.mskcc.org/cancergenomics/statius/ |
| KEGG_PROPANOATE_METABOLISM REACTOME_METABOLISM_OF_LIPIDS_AND_LIPOPROTEINS | |
| OMIM | |
| Orphanet | |
| Disease | KEGG Disease: MUT |
| MedGen: MUT (Human Medical Genetics with Condition) | |
| ClinVar: MUT | |
| Phenotype | MGI: MUT (International Mouse Phenotyping Consortium) |
| PhenomicDB: MUT | |
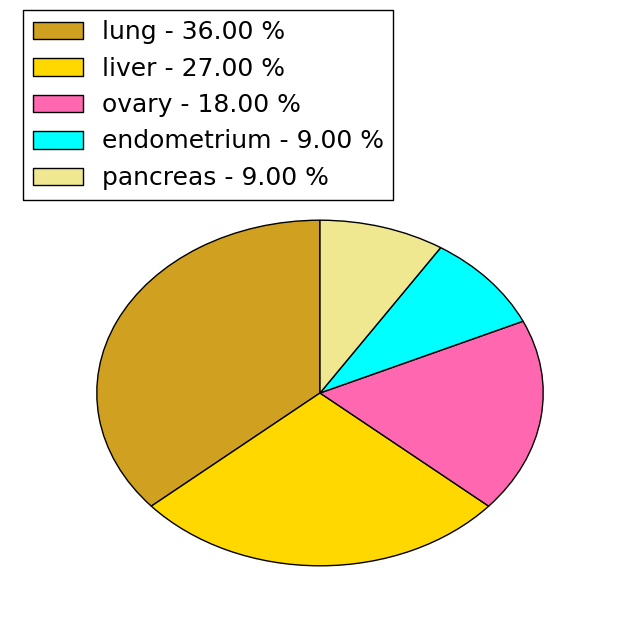
| Mutations for MUT |
| * Under tables are showing count per each tissue to give us broad intuition about tissue specific mutation patterns.You can go to the detailed page for each mutation database's web site. |
| - Statistics for Tissue and Mutation type | Top |
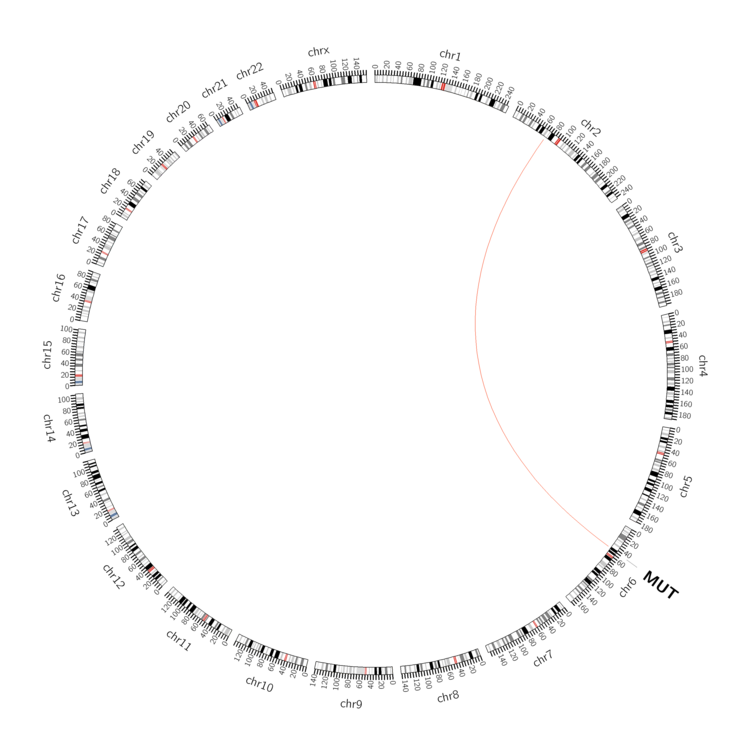 |
| - For Inter-chromosomal Variations |
| * Inter-chromosomal variantions includes 'interchromosomal amplicon to amplicon', 'interchromosomal amplicon to non-amplified dna', 'interchromosomal insertion', 'Interchromosomal unknown type'. |
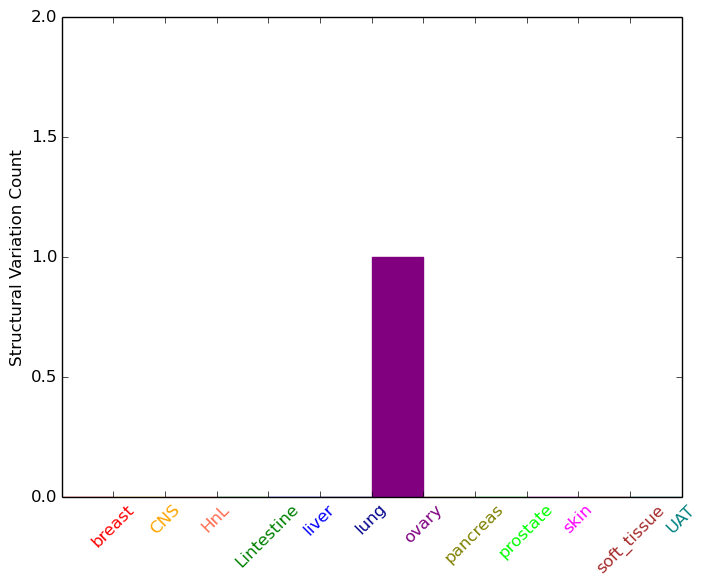 |
| - For Intra-chromosomal Variations |
| There's no intra-chromosomal structural variation. |
| Sample | Symbol_a | Chr_a | Start_a | End_a | Symbol_b | Chr_b | Start_b | End_b |
| cf) Tissue number; Tissue name (1;Breast, 2;Central_nervous_system, 3;Haematopoietic_and_lymphoid_tissue, 4;Large_intestine, 5;Liver, 6;Lung, 7;Ovary, 8;Pancreas, 9;Prostate, 10;Skin, 11;Soft_tissue, 12;Upper_aerodigestive_tract) |
| * From mRNA Sanger sequences, Chitars2.0 arranged chimeric transcripts. This table shows MUT related fusion information. |
| ID | Head Gene | Tail Gene | Accession | Gene_a | qStart_a | qEnd_a | Chromosome_a | tStart_a | tEnd_a | Gene_a | qStart_a | qEnd_a | Chromosome_a | tStart_a | tEnd_a |
| Top |
| There's no copy number variation information in COSMIC data for this gene. |
| Top |
|
 |
| Top |
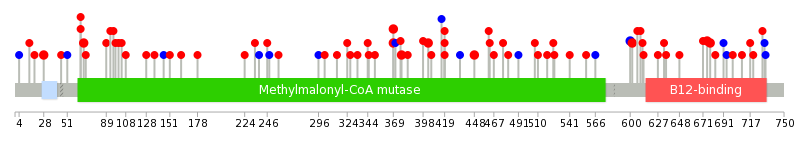
| Stat. for Non-Synonymous SNVs (# total SNVs=70) | (# total SNVs=11) |
 |  |
(# total SNVs=1) | (# total SNVs=1) |
 |  |
| Top |
| * When you move the cursor on each content, you can see more deailed mutation information on the Tooltip. Those are primary_site,primary_histology,mutation(aa),pubmedID. |
| GRCh37 position | Mutation(aa) | Unique sampleID count |
| chr6:49419405-49419405 | p.R369P | 4 |
| chr6:49419381-49419381 | p.A377E | 2 |
| chr6:49427098-49427098 | p.I28V | 2 |
| chr6:49416630-49416630 | p.E448G | 2 |
| chr6:49403260-49403260 | p.H678R | 2 |
| chr6:49409556-49409556 | p.K602R | 2 |
| chr6:49403270-49403270 | p.A675T | 2 |
| chr6:49409561-49409561 | p.A600A | 2 |
| chr6:49419255-49419255 | p.P419L | 2 |
| chr6:49426979-49426979 | p.I67M | 2 |
| Top |
|
 |
| Point Mutation/ Tissue ID | 1 | 2 | 3 | 4 | 5 | 6 | 7 | 8 | 9 | 10 | 11 | 12 | 13 | 14 | 15 | 16 | 17 | 18 | 19 | 20 |
| # sample | 1 | 3 | 4 | 1 | 1 | 1 | 11 | 4 | 2 | 7 | 6 | 10 | ||||||||
| # mutation | 1 | 3 | 4 | 1 | 1 | 1 | 13 | 4 | 2 | 7 | 7 | 10 | ||||||||
| nonsynonymous SNV | 1 | 3 | 4 | 1 | 1 | 1 | 7 | 4 | 6 | 4 | 9 | |||||||||
| synonymous SNV | 6 | 2 | 1 | 3 | 1 |
| cf) Tissue ID; Tissue type (1; BLCA[Bladder Urothelial Carcinoma], 2; BRCA[Breast invasive carcinoma], 3; CESC[Cervical squamous cell carcinoma and endocervical adenocarcinoma], 4; COAD[Colon adenocarcinoma], 5; GBM[Glioblastoma multiforme], 6; Glioma Low Grade, 7; HNSC[Head and Neck squamous cell carcinoma], 8; KICH[Kidney Chromophobe], 9; KIRC[Kidney renal clear cell carcinoma], 10; KIRP[Kidney renal papillary cell carcinoma], 11; LAML[Acute Myeloid Leukemia], 12; LUAD[Lung adenocarcinoma], 13; LUSC[Lung squamous cell carcinoma], 14; OV[Ovarian serous cystadenocarcinoma ], 15; PAAD[Pancreatic adenocarcinoma], 16; PRAD[Prostate adenocarcinoma], 17; SKCM[Skin Cutaneous Melanoma], 18:STAD[Stomach adenocarcinoma], 19:THCA[Thyroid carcinoma], 20:UCEC[Uterine Corpus Endometrial Carcinoma]) |
| Top |
| * We represented just top 10 SNVs. When you move the cursor on each content, you can see more deailed mutation information on the Tooltip. Those are primary_site, primary_histology, mutation(aa), pubmedID. |
| Genomic Position | Mutation(aa) | Unique sampleID count |
| chr6:49419405 | p.R369H | 2 |
| chr6:49419294 | p.R613C | 1 |
| chr6:49403270 | p.R406K | 1 |
| chr6:49425413 | p.K128N | 1 |
| chr6:49412454 | p.T566T | 1 |
| chr6:49427140 | p.R403Q | 1 |
| chr6:49419303 | p.T101A | 1 |
| chr6:49403324 | p.R557R | 1 |
| chr6:49425457 | p.T398A | 1 |
| chr6:49415386 | p.K89T | 1 |
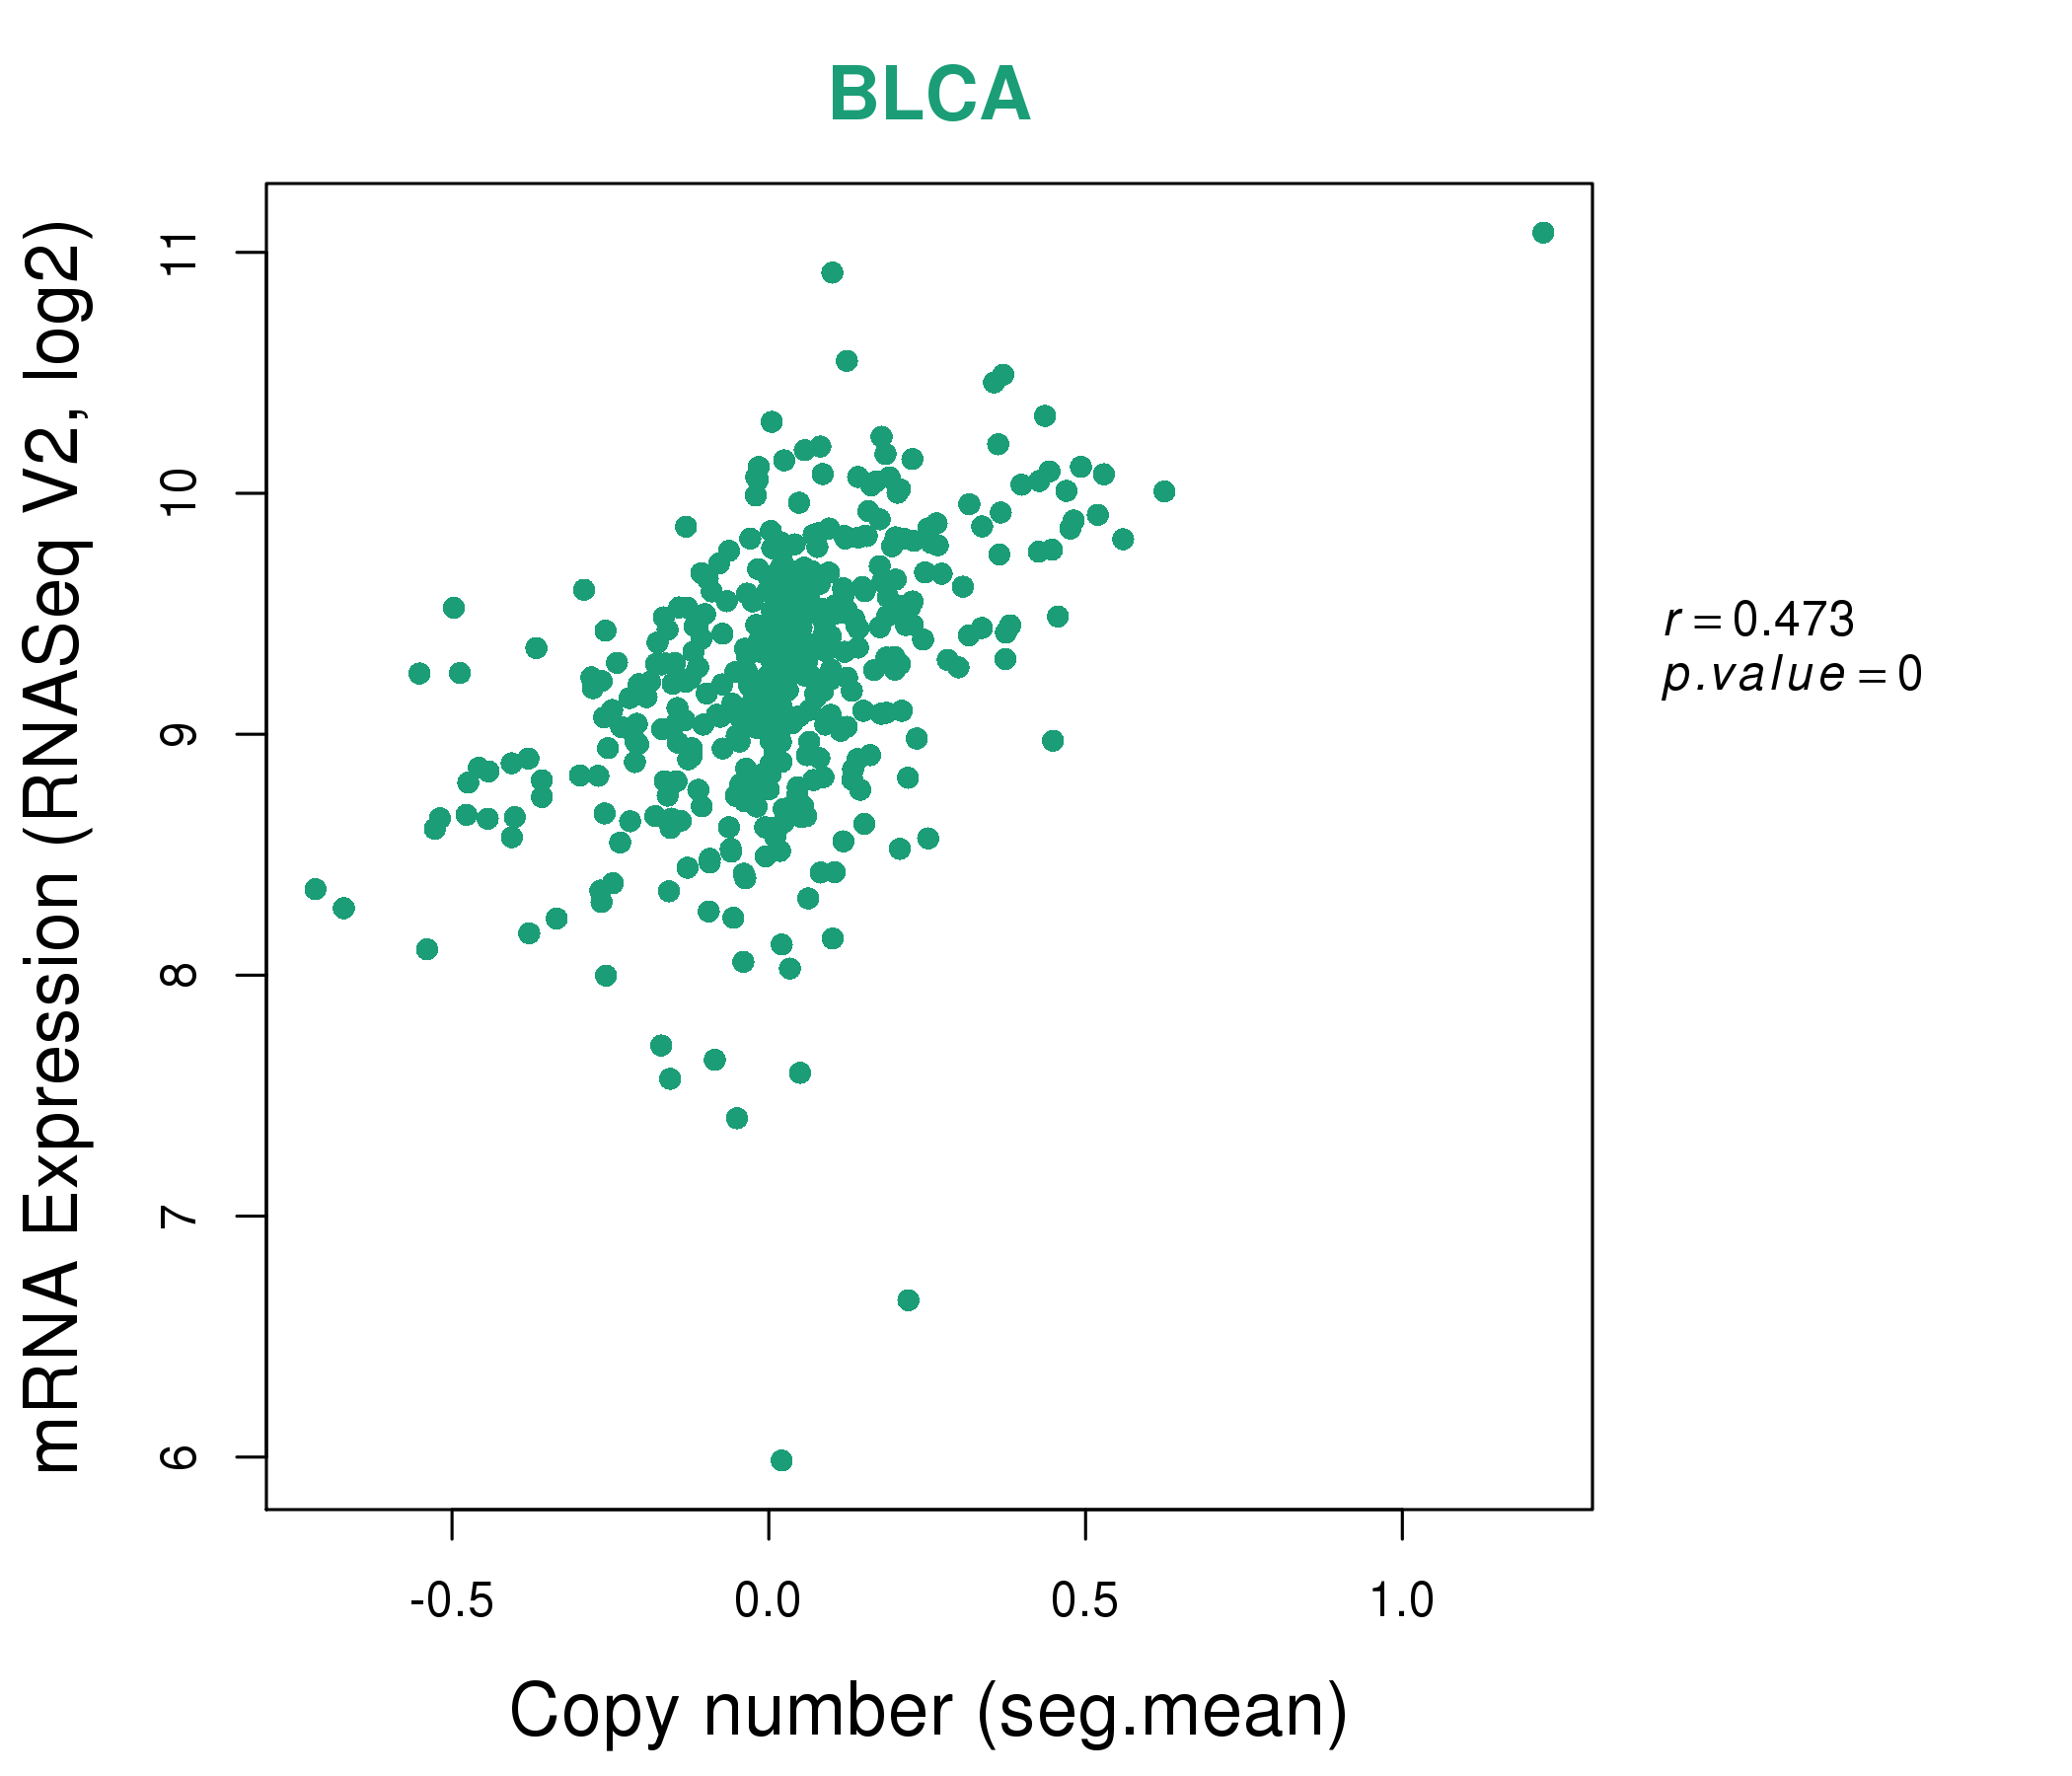
| * Copy number data were extracted from TCGA using R package TCGA-Assembler. The URLs of all public data files on TCGA DCC data server were gathered on Jan-05-2015. Function ProcessCNAData in TCGA-Assembler package was used to obtain gene-level copy number value which is calculated as the average copy number of the genomic region of a gene. |
 |
| cf) Tissue ID[Tissue type]: BLCA[Bladder Urothelial Carcinoma], BRCA[Breast invasive carcinoma], CESC[Cervical squamous cell carcinoma and endocervical adenocarcinoma], COAD[Colon adenocarcinoma], GBM[Glioblastoma multiforme], Glioma Low Grade, HNSC[Head and Neck squamous cell carcinoma], KICH[Kidney Chromophobe], KIRC[Kidney renal clear cell carcinoma], KIRP[Kidney renal papillary cell carcinoma], LAML[Acute Myeloid Leukemia], LUAD[Lung adenocarcinoma], LUSC[Lung squamous cell carcinoma], OV[Ovarian serous cystadenocarcinoma ], PAAD[Pancreatic adenocarcinoma], PRAD[Prostate adenocarcinoma], SKCM[Skin Cutaneous Melanoma], STAD[Stomach adenocarcinoma], THCA[Thyroid carcinoma], UCEC[Uterine Corpus Endometrial Carcinoma] |
| Top |
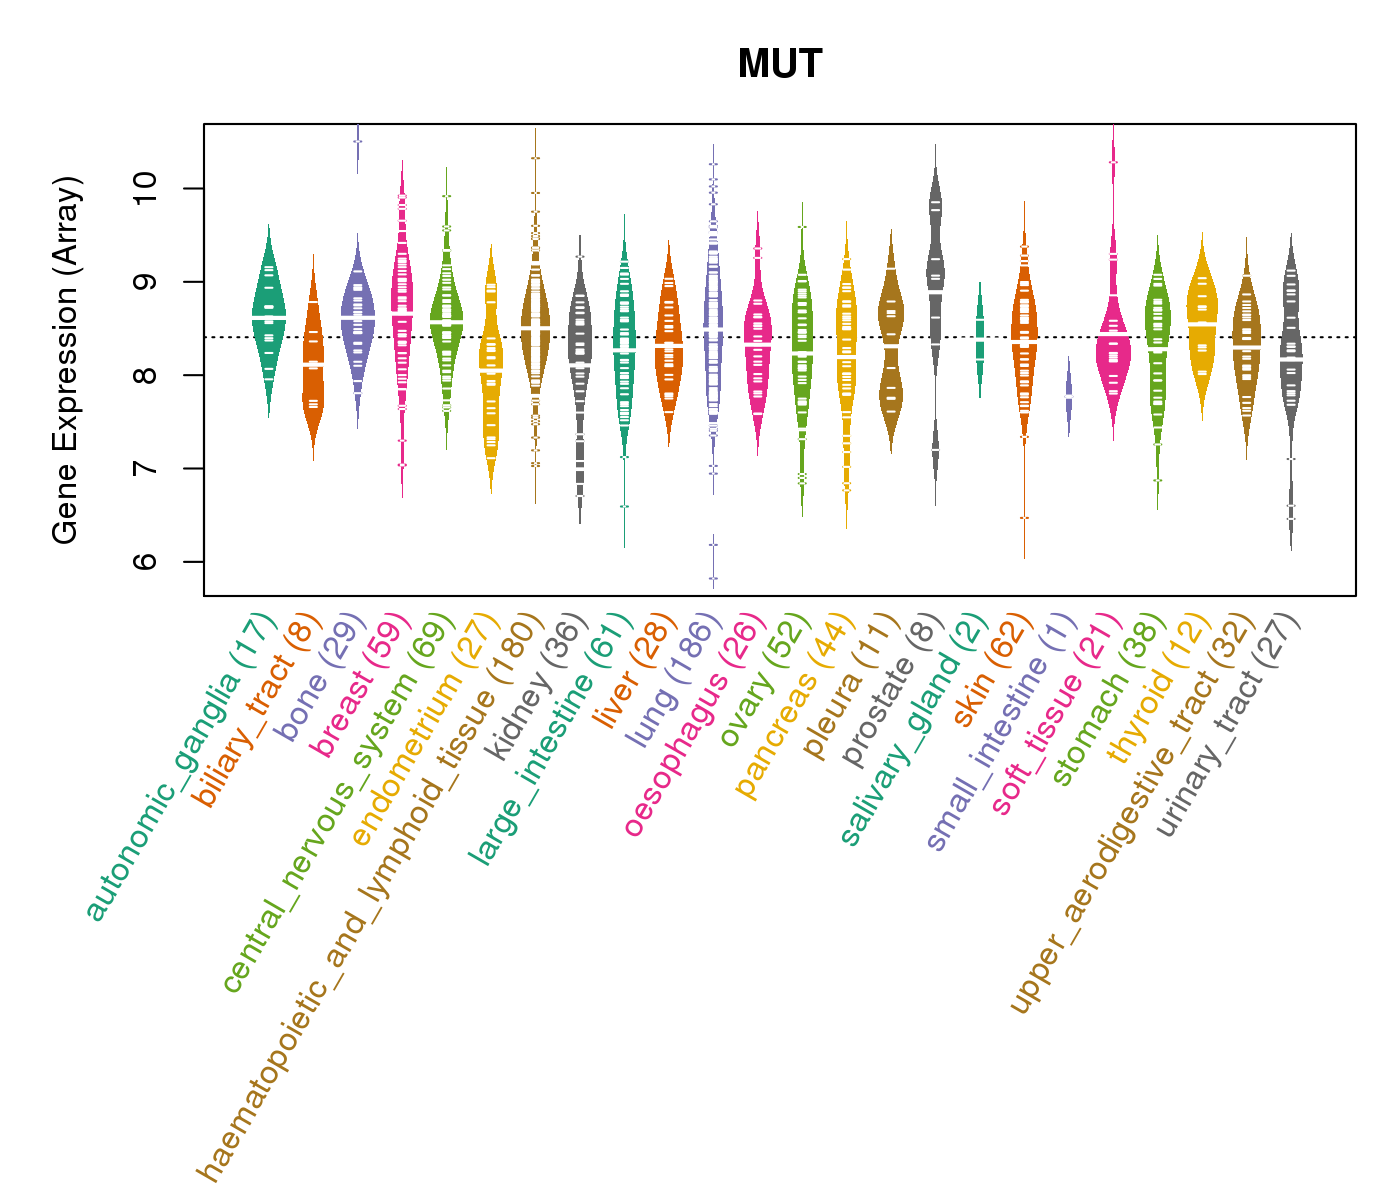
| Gene Expression for MUT |
| * CCLE gene expression data were extracted from CCLE_Expression_Entrez_2012-10-18.res: Gene-centric RMA-normalized mRNA expression data. |
 |
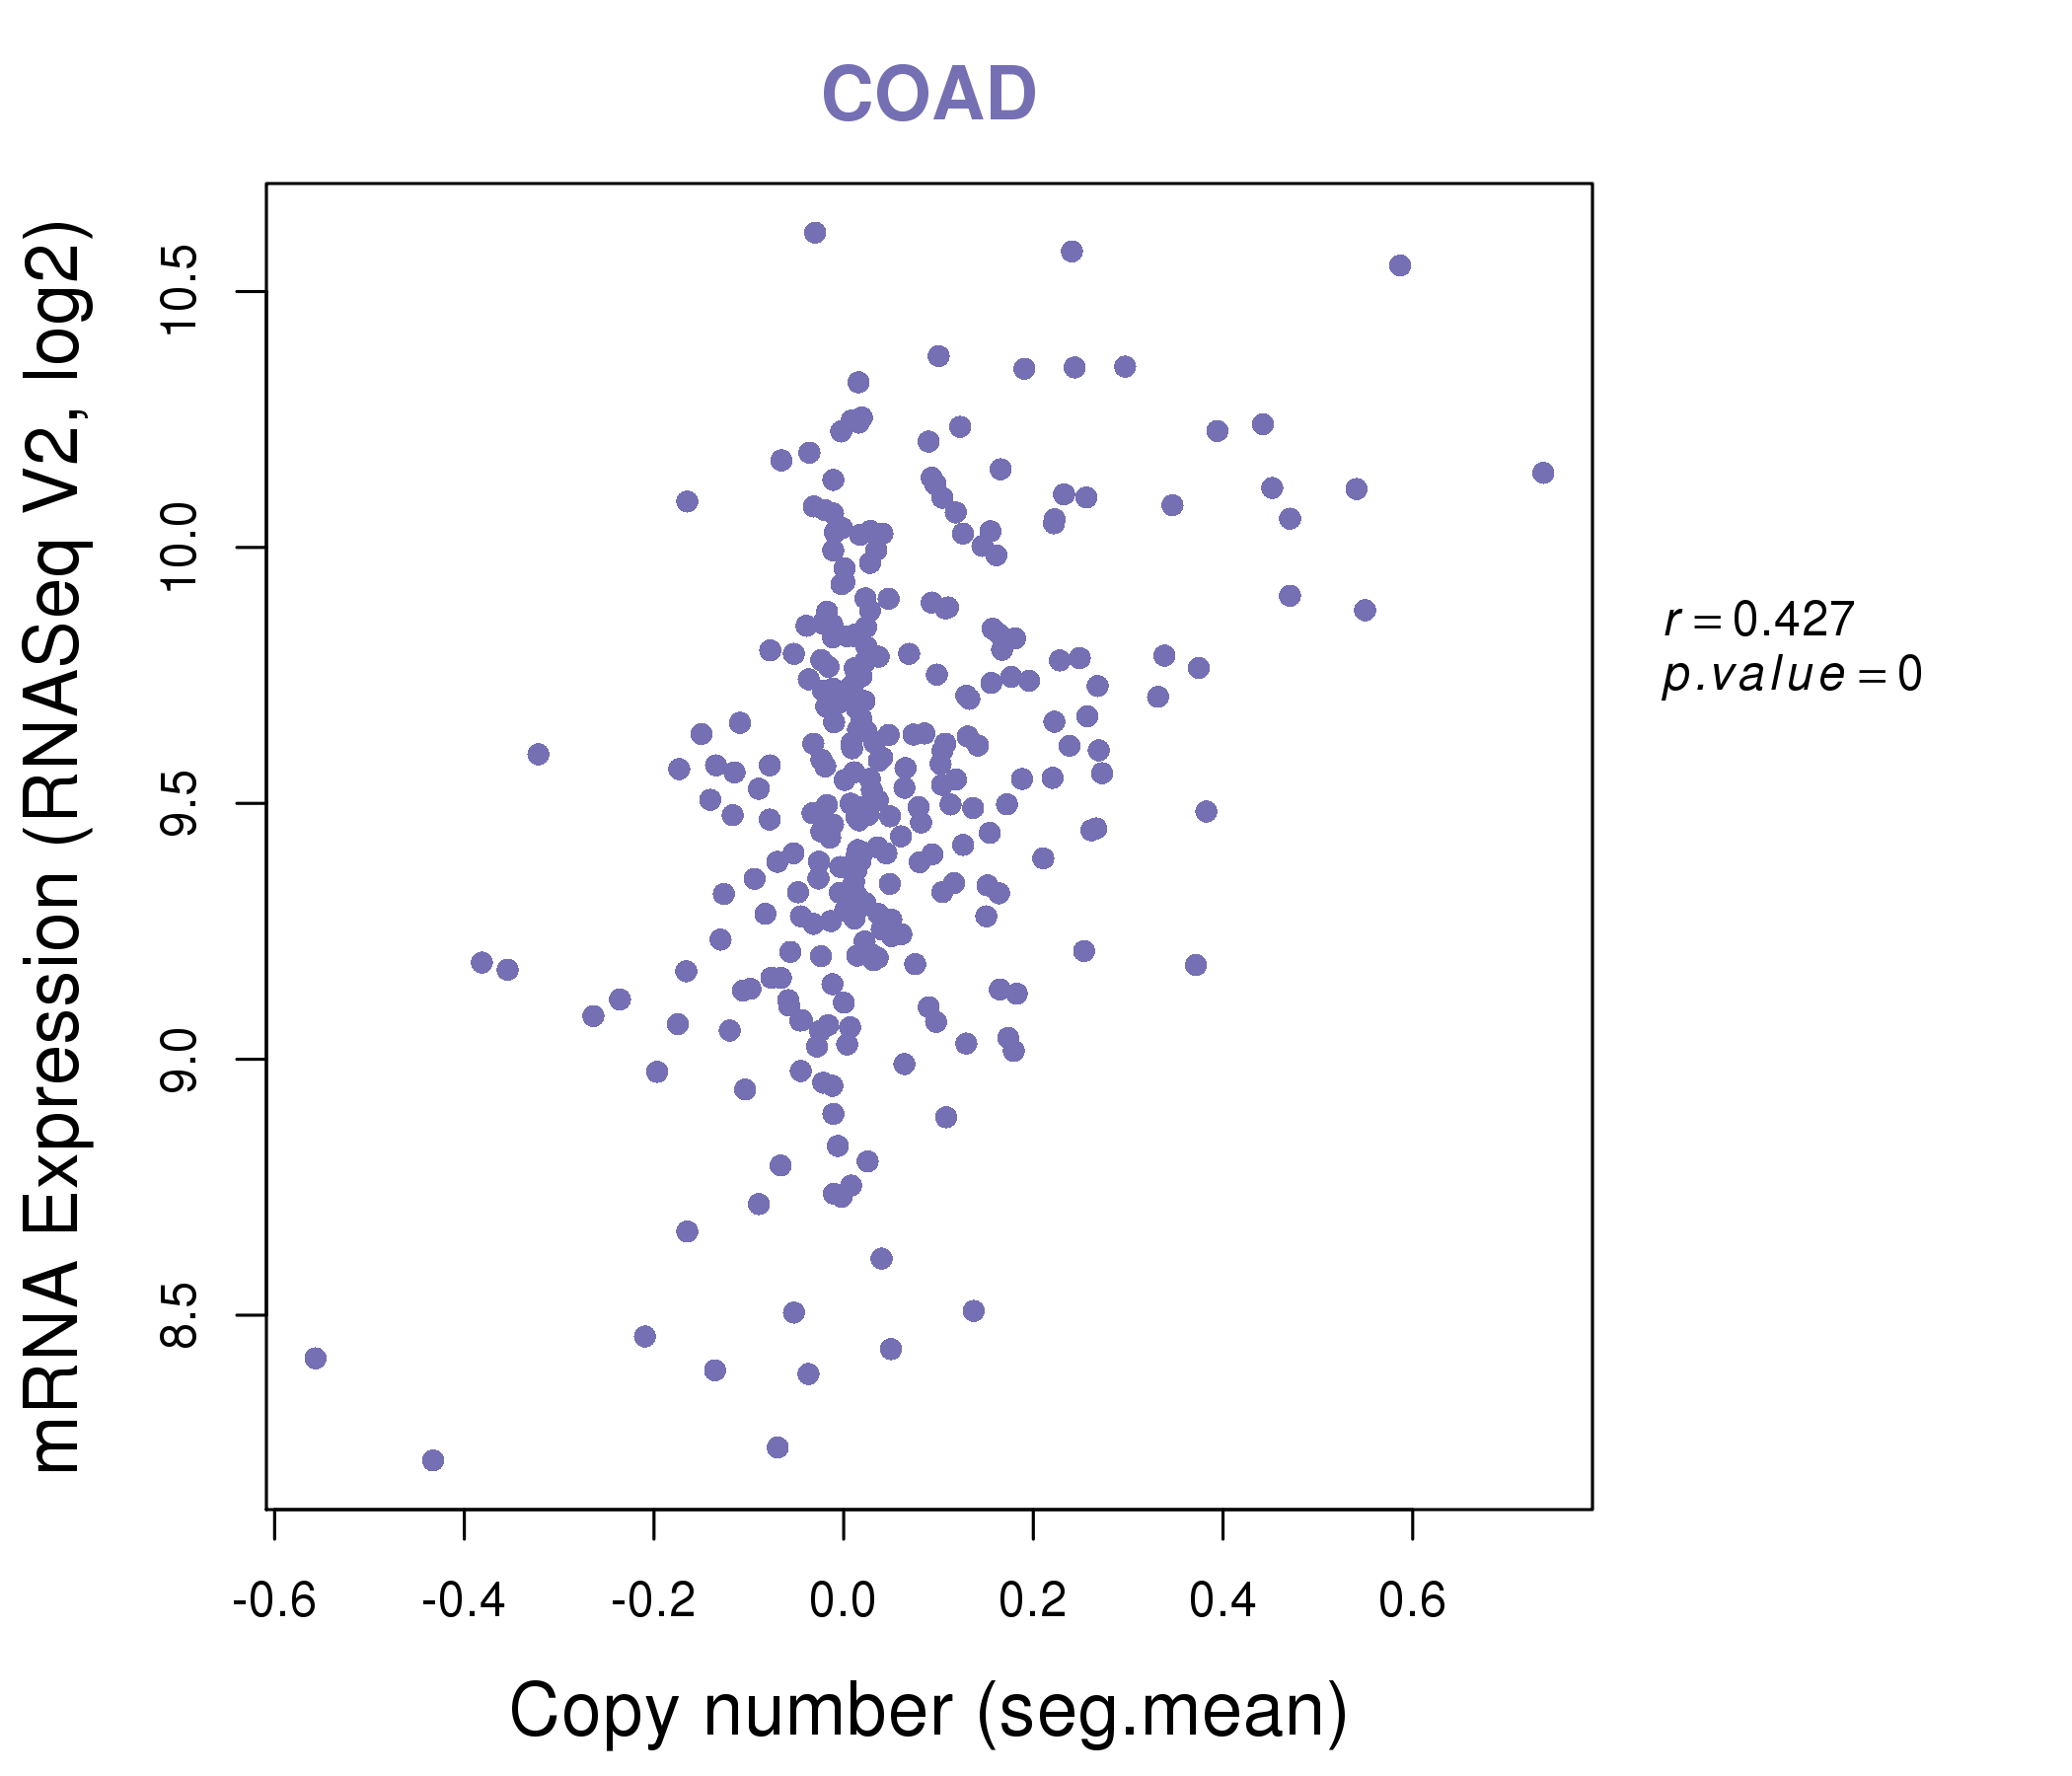
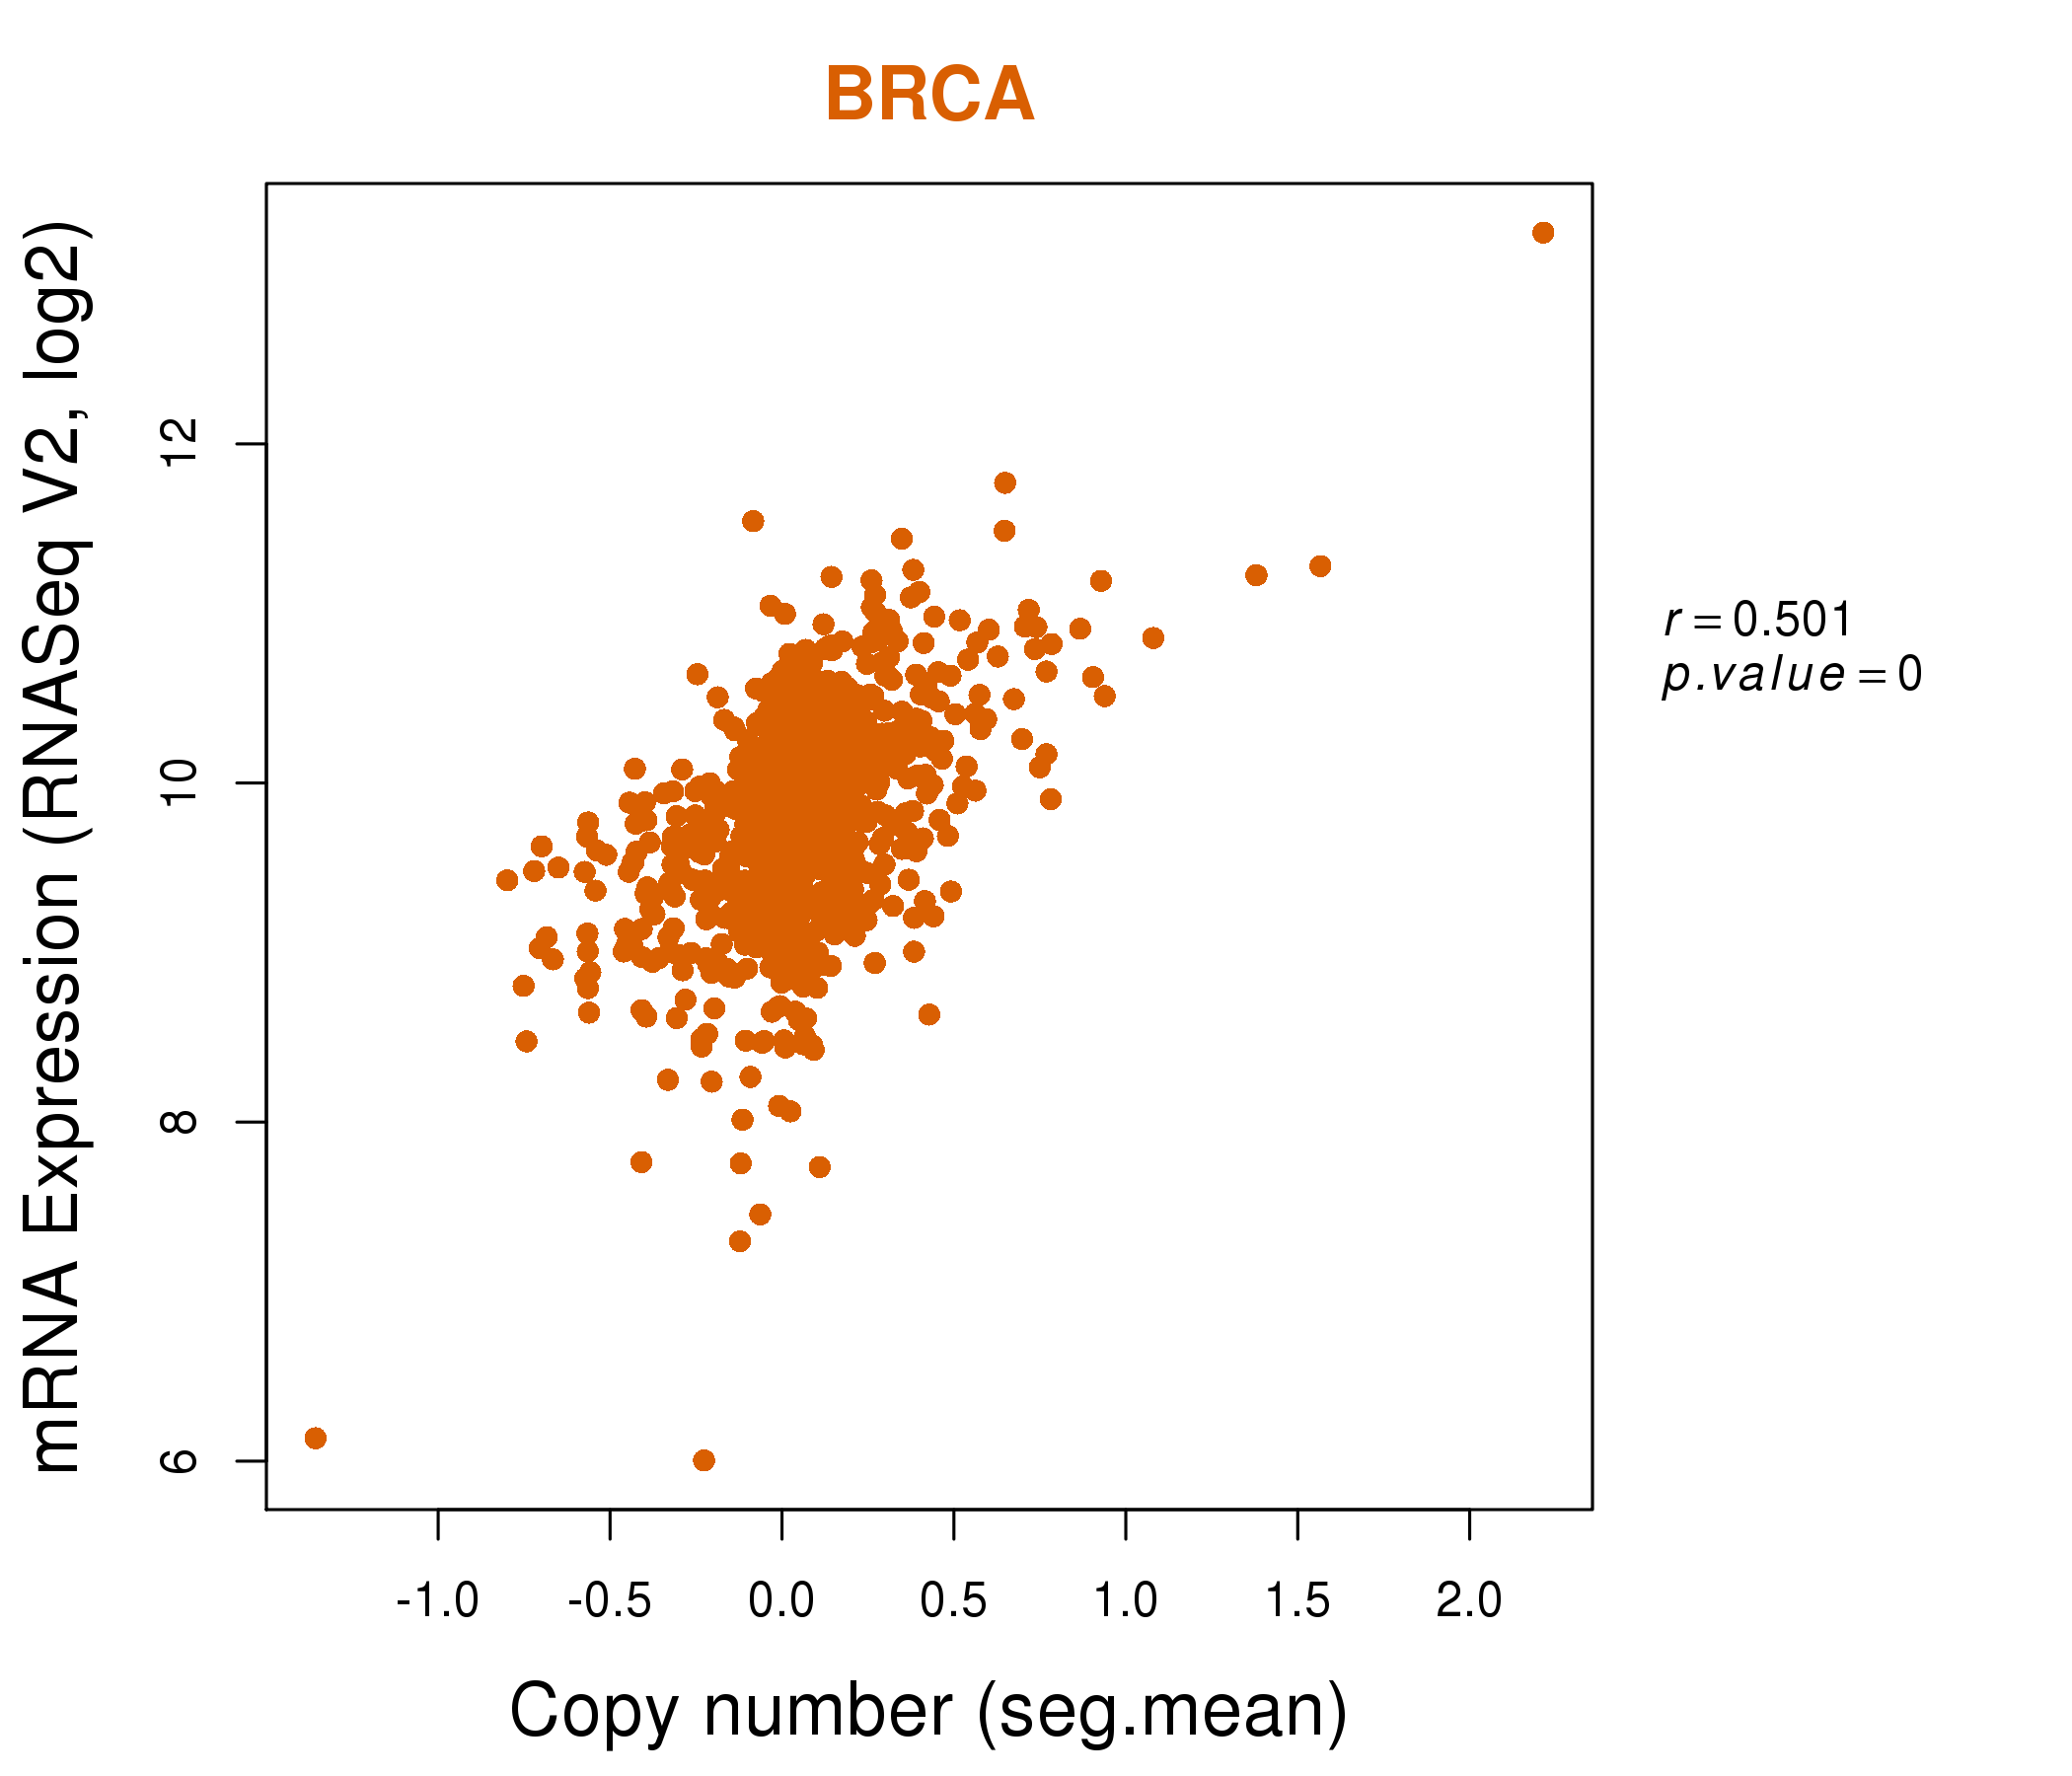
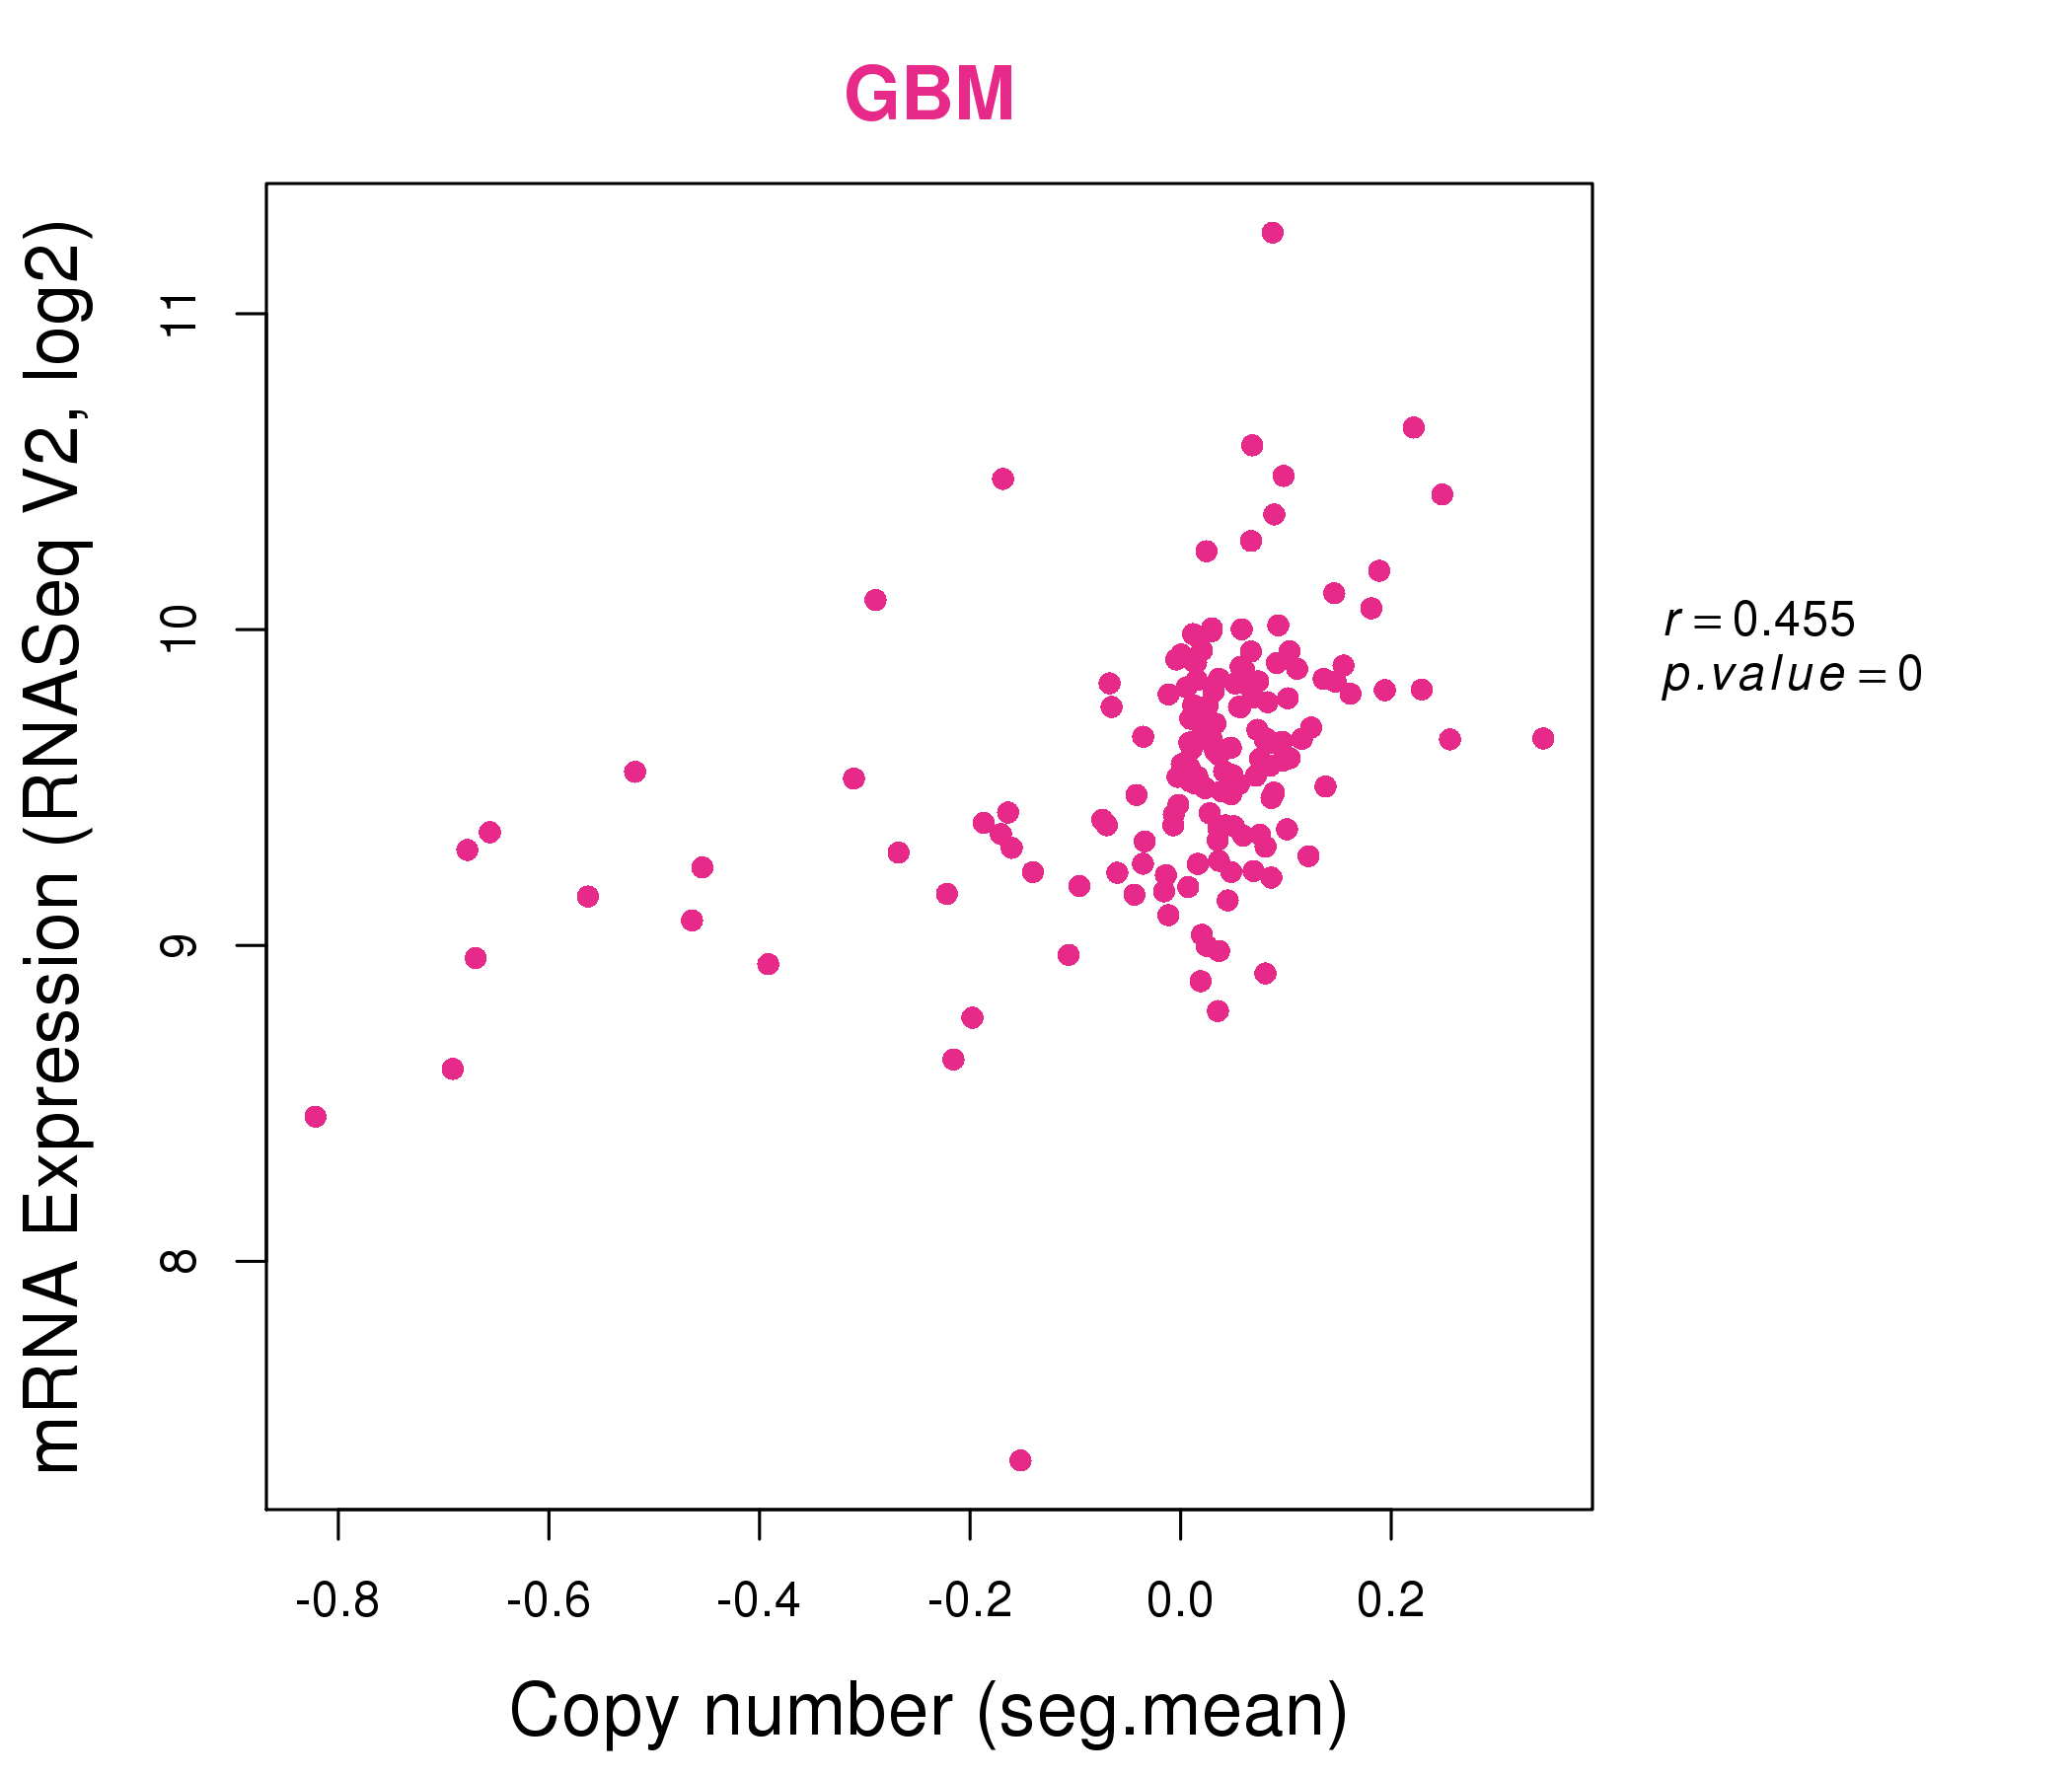
| * Normalized gene expression data of RNASeqV2 was extracted from TCGA using R package TCGA-Assembler. The URLs of all public data files on TCGA DCC data server were gathered at Jan-05-2015. Only eight cancer types have enough normal control samples for differential expression analysis. (t test, adjusted p<0.05 (using Benjamini-Hochberg FDR)) |
 |
| Top |
| * This plots show the correlation between CNV and gene expression. |
: Open all plots for all cancer types
 |
|
 |
|
| Top |
| Gene-Gene Network Information |
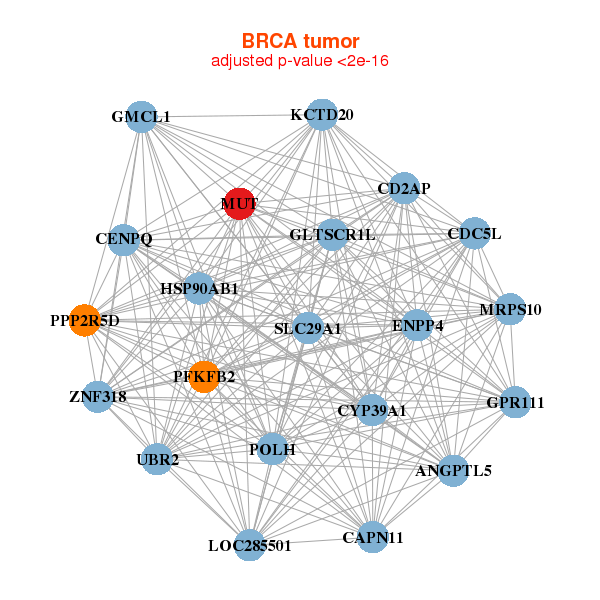
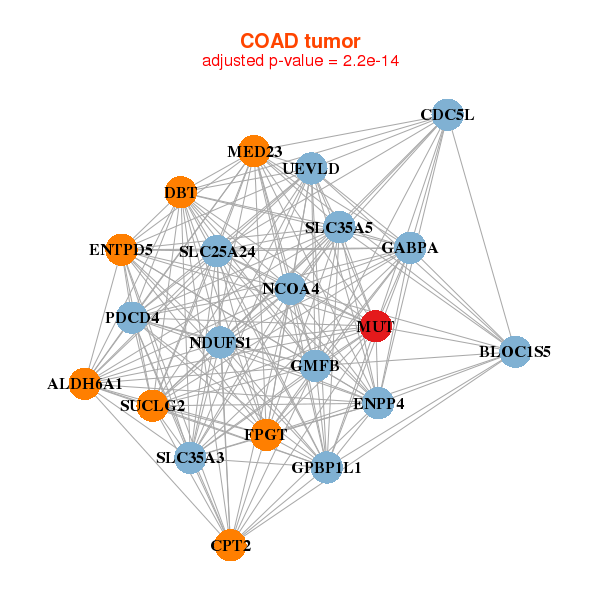
| * Co-Expression network figures were drawn using R package igraph. Only the top 20 genes with the highest correlations were shown. Red circle: input gene, orange circle: cell metabolism gene, sky circle: other gene |
: Open all plots for all cancer types
 |
| ||||
| ANGPTL5,CAPN11,CD2AP,CDC5L,CENPQ,CYP39A1,ENPP4, GMCL1,GPR111,HSP90AB1,KCTD20,GLTSCR1L,LOC285501,MRPS10, MUT,PFKFB2,POLH,PPP2R5D,SLC29A1,UBR2,ZNF318 | ACBD5,ALDH6A1,TMEM245,CS,DBT,DHTKD1,IARS2, KIAA1715,MPDZ,MPHOSPH9,MTMR10,MUT,NR3C1,OSBPL1A, OXCT1,OXR1,PDP2,SUCLG2,TEAD1,TFDP2,TMLHE | ||||
 |
| ||||
| ALDH6A1,CDC5L,CPT2,DBT,ENPP4,ENTPD5,FPGT, GABPA,GMFB,GPBP1L1,MED23,MUT,BLOC1S5,NCOA4, NDUFS1,PDCD4,SLC25A24,SLC35A3,SLC35A5,SUCLG2,UEVLD | AFG3L2,CASK,CCDC47,DTX4,EPB41L4B,GUF1,IMMT, IQGAP2,KIAA1522,LACE1,LOC407835,MFSD9,MUT,MYO1D, NCKAP5,PFKL,PTPRK,SGPP2,SH3RF1,SLC35F2,TMEM164 |
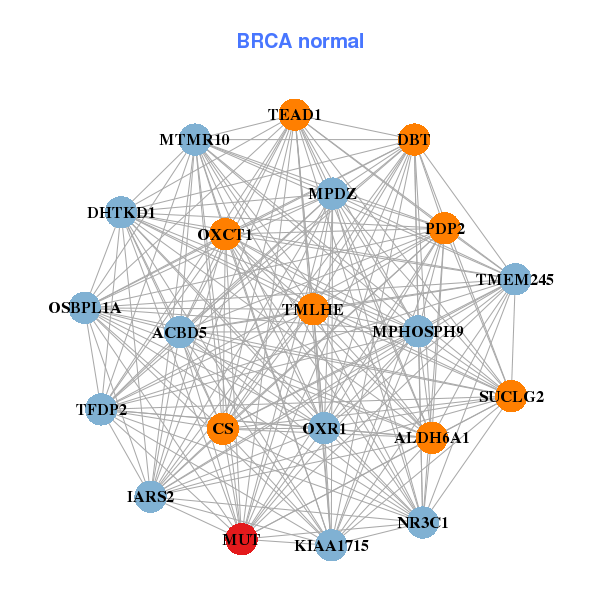

| * Co-Expression network figures were drawn using R package igraph. Only the top 20 genes with the highest correlations were shown. Red circle: input gene, orange circle: cell metabolism gene, sky circle: other gene |
: Open all plots for all cancer types
| Top |
: Open all interacting genes' information including KEGG pathway for all interacting genes from DAVID
| Top |
| Pharmacological Information for MUT |
| DB Category | DB Name | DB's ID and Url link |
| * Gene Centered Interaction Network. |
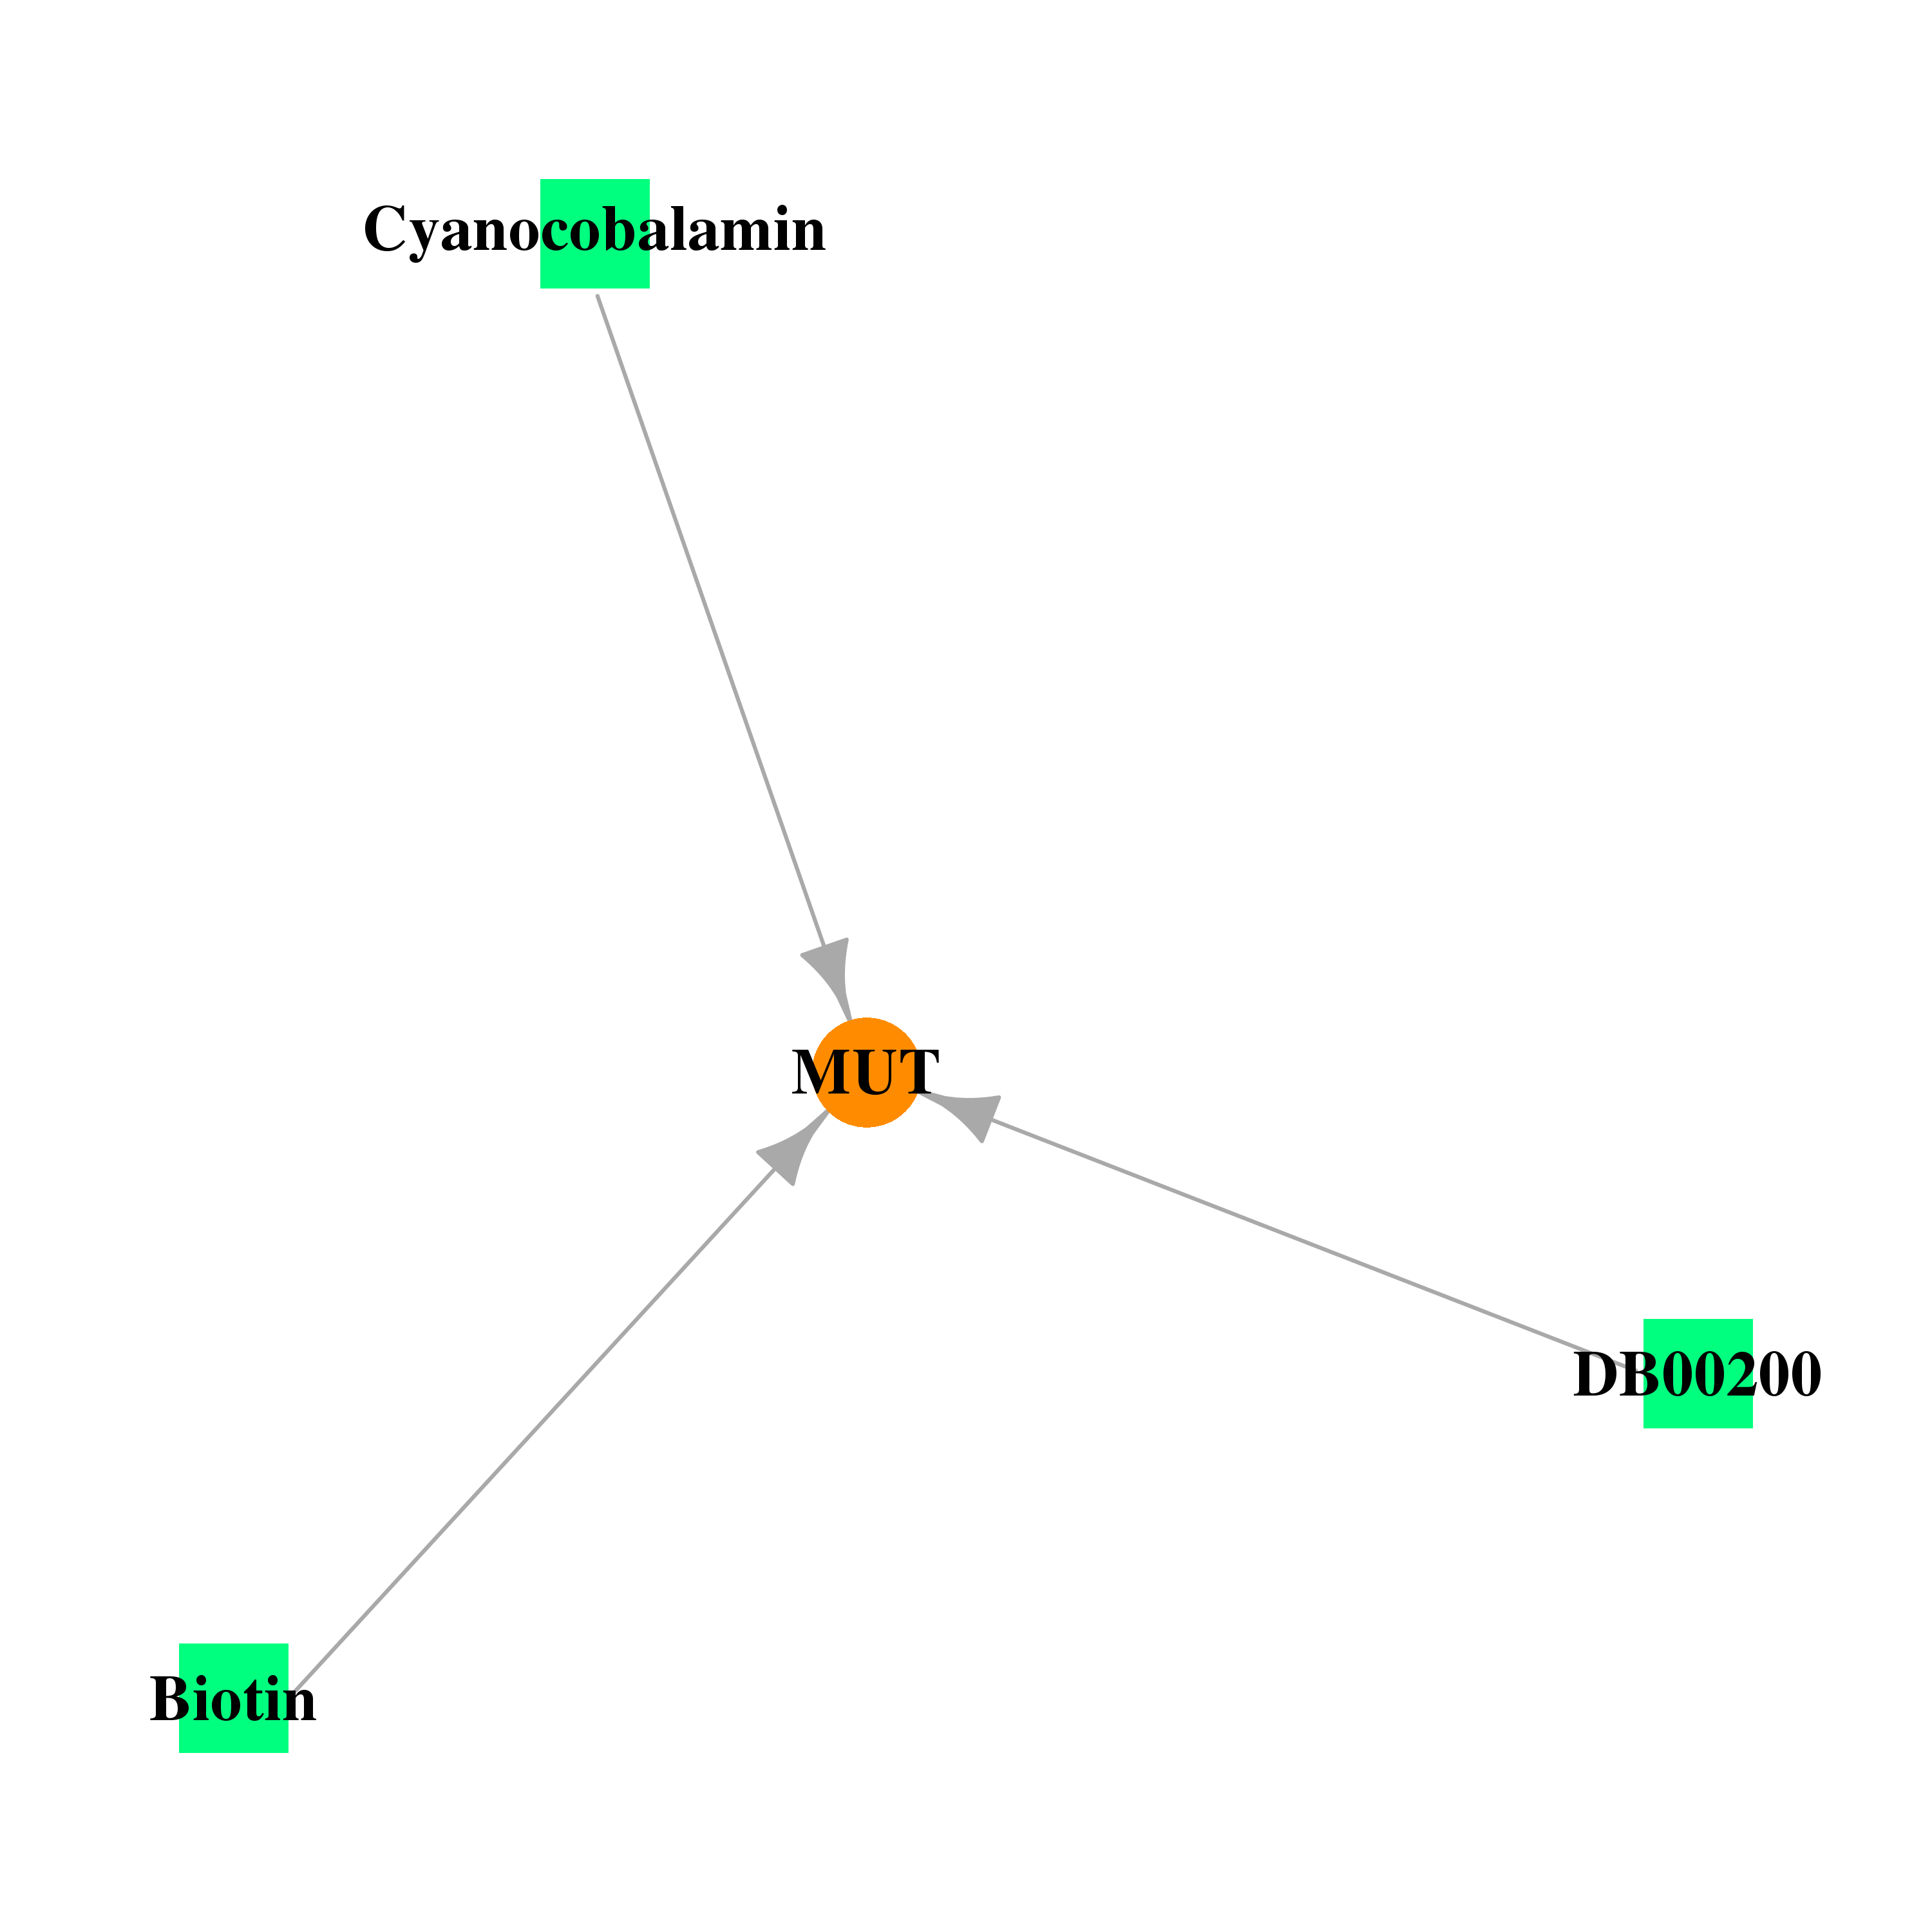 |
| * Drug Centered Interaction Network. |
| DrugBank ID | Target Name | Drug Groups | Generic Name | Drug Centered Network | Drug Structure |
| DB00115 | methylmalonyl CoA mutase | approved; nutraceutical | Cyanocobalamin |  | 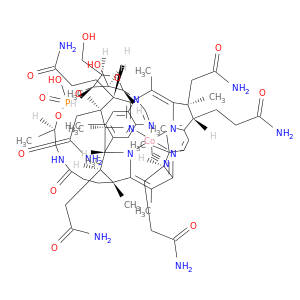 |
| DB00200 | methylmalonyl CoA mutase | approved | Hydroxocobalamin |  |  |
| DB00121 | methylmalonyl CoA mutase | approved; nutraceutical | Biotin | 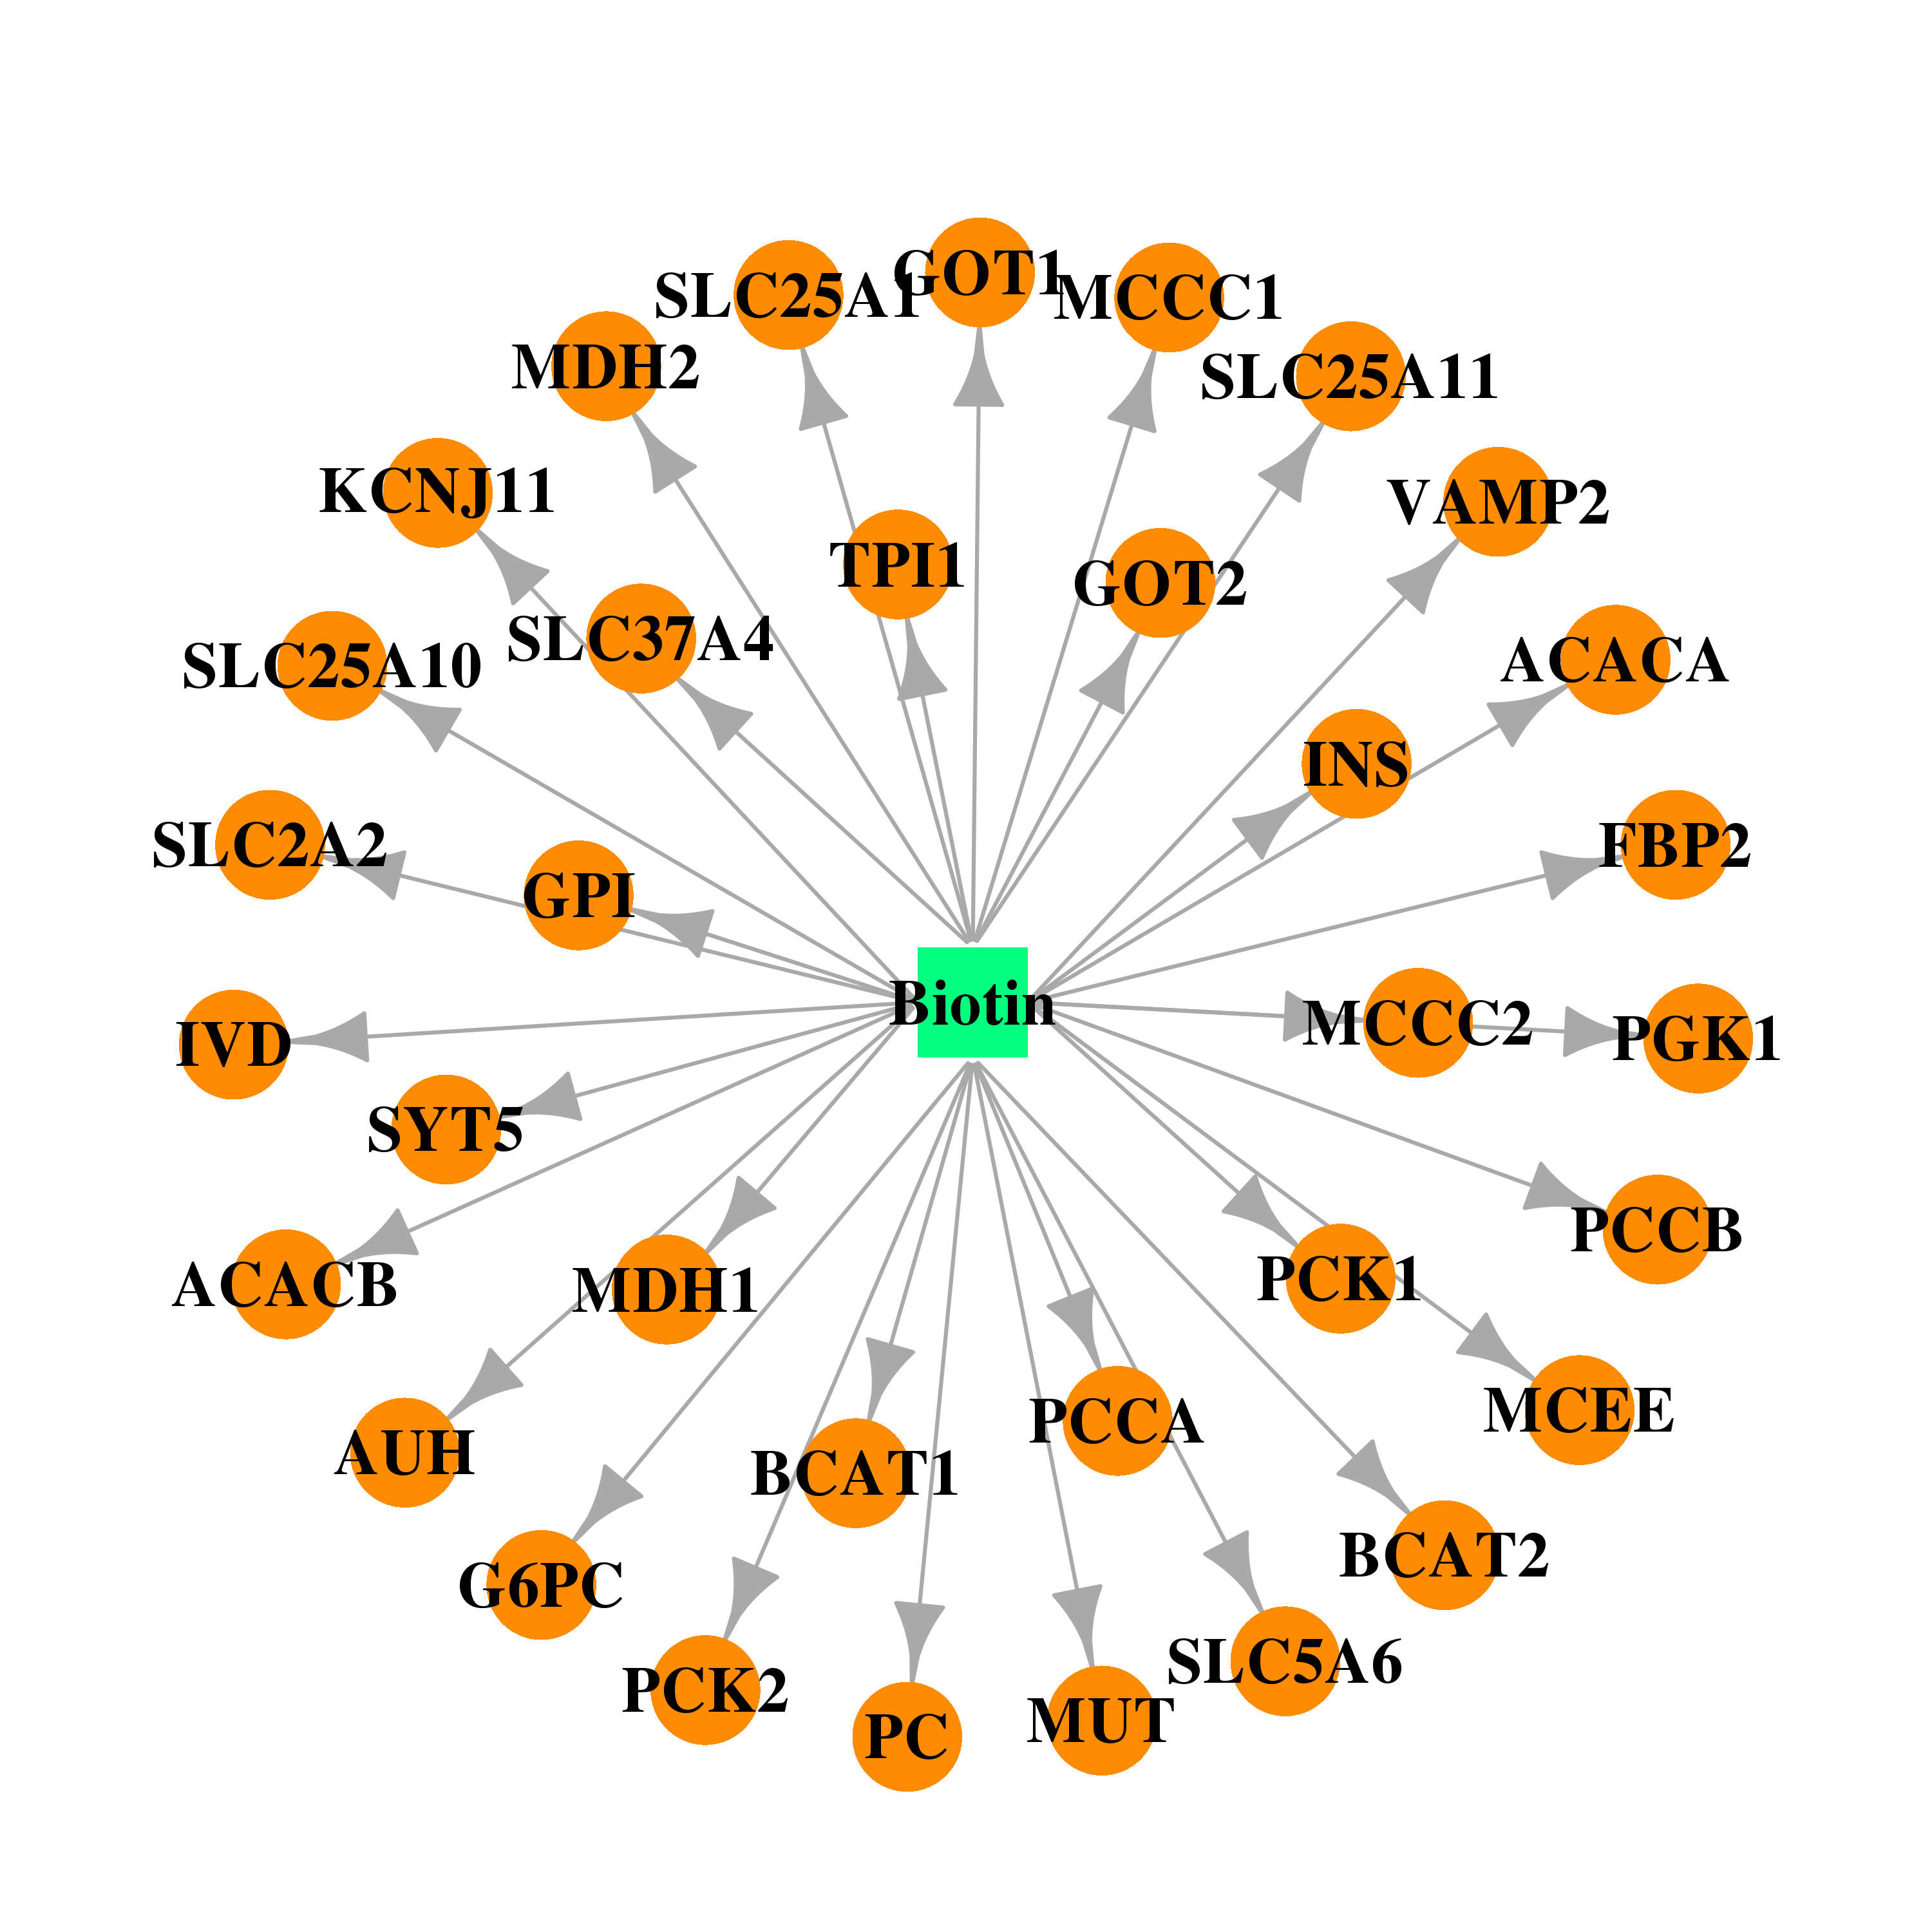 |  |
| Top |
| Cross referenced IDs for MUT |
| * We obtained these cross-references from Uniprot database. It covers 150 different DBs, 18 categories. http://www.uniprot.org/help/cross_references_section |
: Open all cross reference information
|
Copyright © 2016-Present - The Univsersity of Texas Health Science Center at Houston @ |