|
||||||||||||||||||||||||||||||||||||||||||||||||||||||||||||||||||||||||||||||||||||||||||||||||||||||||||||||||||||||||||||||||||||||||||||||||||||||||||||||||||||||||||||||||||||||||||||||||||||||||||||||||||||||||||||||||||||||||||||||||||||||||||||||||||||||||||||||||||||||||||||||||||||||||||||||||||||||||||
| |
| Phenotypic Information (metabolism pathway, cancer, disease, phenome) |
| |
| |
| Gene-Gene Network Information: Co-Expression Network, Interacting Genes & KEGG |
| |
|


| Gene Summary for ACLY |
| Top |
| Phenotypic Information for ACLY(metabolism pathway, cancer, disease, phenome) |
| Cancer | CGAP: ACLY |
| Familial Cancer Database: ACLY | |
| * This gene is included in those cancer gene databases. |
|
|
|
|
|
| . | ||||||||||||||||||||||||||||||||||||||||||||||||||||||||||||||||||||||||||||||||||||||||||||||||||||||||||||||||||||||||||||||||||||||||||||||||||||||||||||||||||||||||||||||||||||||||||||||||||||||||||||||||||||||||||||||||||||||||||||||||||||||||||||||||||||||||||||||||||||||||||||||||||||||||||||||||||||
Oncogene 1 | Significant driver gene in | |||||||||||||||||||||||||||||||||||||||||||||||||||||||||||||||||||||||||||||||||||||||||||||||||||||||||||||||||||||||||||||||||||||||||||||||||||||||||||||||||||||||||||||||||||||||||||||||||||||||||||||||||||||||||||||||||||||||||||||||||||||||||||||||||||||||||||||||||||||||||||||||||||||||||||||||||||||||||
| cf) number; DB name 1 Oncogene; http://nar.oxfordjournals.org/content/35/suppl_1/D721.long, 2 Tumor Suppressor gene; https://bioinfo.uth.edu/TSGene/, 3 Cancer Gene Census; http://www.nature.com/nrc/journal/v4/n3/abs/nrc1299.html, 4 CancerGenes; http://nar.oxfordjournals.org/content/35/suppl_1/D721.long, 5 Network of Cancer Gene; http://ncg.kcl.ac.uk/index.php, 1Therapeutic Vulnerabilities in Cancer; http://cbio.mskcc.org/cancergenomics/statius/ |
| REACTOME_INTEGRATION_OF_ENERGY_METABOLISM REACTOME_METABOLISM_OF_LIPIDS_AND_LIPOPROTEINS | |
| OMIM | |
| Orphanet | |
| Disease | KEGG Disease: ACLY |
| MedGen: ACLY (Human Medical Genetics with Condition) | |
| ClinVar: ACLY | |
| Phenotype | MGI: ACLY (International Mouse Phenotyping Consortium) |
| PhenomicDB: ACLY | |
| Mutations for ACLY |
| * Under tables are showing count per each tissue to give us broad intuition about tissue specific mutation patterns.You can go to the detailed page for each mutation database's web site. |
| - Statistics for Tissue and Mutation type | Top |
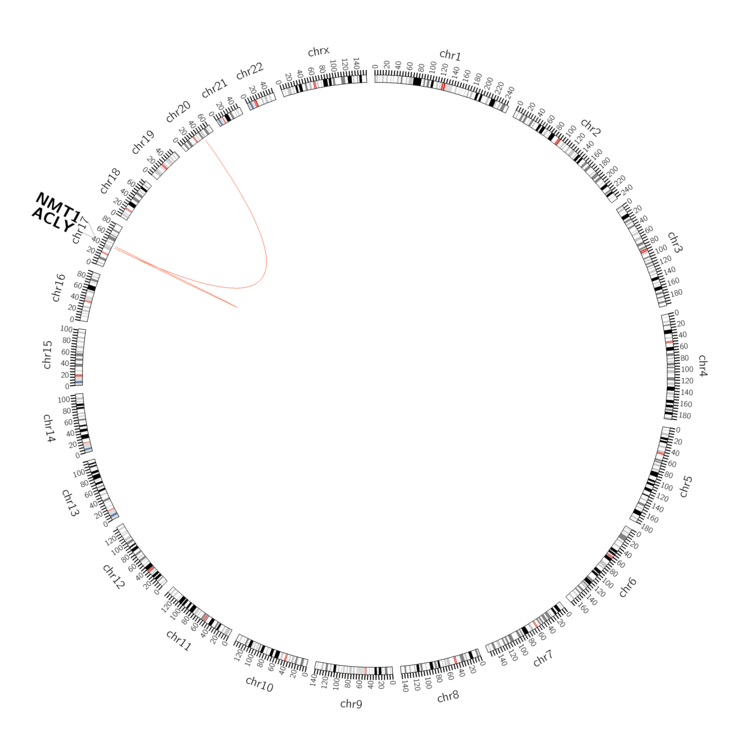 |
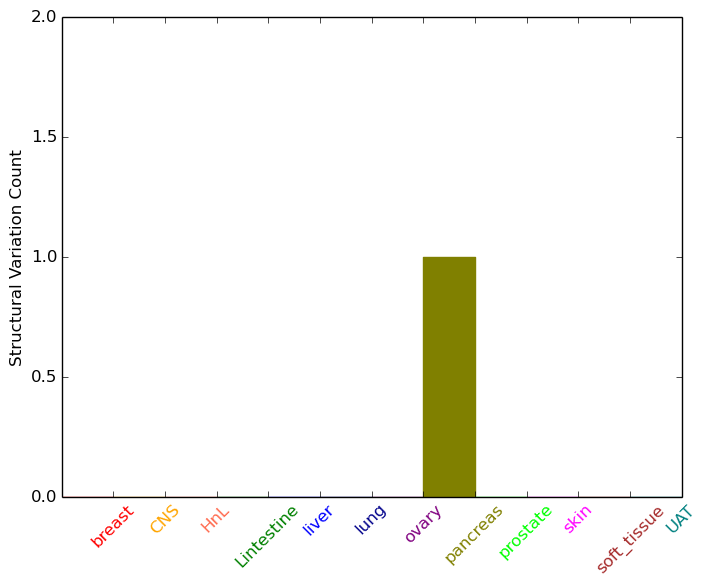
| - For Inter-chromosomal Variations |
| * Inter-chromosomal variantions includes 'interchromosomal amplicon to amplicon', 'interchromosomal amplicon to non-amplified dna', 'interchromosomal insertion', 'Interchromosomal unknown type'. |
 |
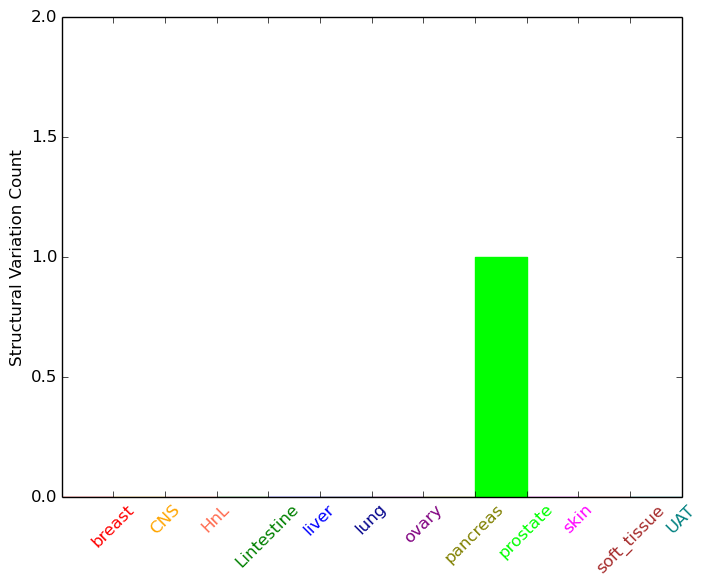
| - For Intra-chromosomal Variations |
| * Intra-chromosomal variantions includes 'intrachromosomal amplicon to amplicon', 'intrachromosomal amplicon to non-amplified dna', 'intrachromosomal deletion', 'intrachromosomal fold-back inversion', 'intrachromosomal inversion', 'intrachromosomal tandem duplication', 'Intrachromosomal unknown type', 'intrachromosomal with inverted orientation', 'intrachromosomal with non-inverted orientation'. |
 |
| Sample | Symbol_a | Chr_a | Start_a | End_a | Symbol_b | Chr_b | Start_b | End_b |
| pancreas | ACLY | chr17 | 40028720 | 40028740 | chr20 | 42016603 | 42016623 | |
| prostate | ACLY | chr17 | 40074266 | 40074266 | NMT1 | chr17 | 43156939 | 43156939 |
| cf) Tissue number; Tissue name (1;Breast, 2;Central_nervous_system, 3;Haematopoietic_and_lymphoid_tissue, 4;Large_intestine, 5;Liver, 6;Lung, 7;Ovary, 8;Pancreas, 9;Prostate, 10;Skin, 11;Soft_tissue, 12;Upper_aerodigestive_tract) |
| * From mRNA Sanger sequences, Chitars2.0 arranged chimeric transcripts. This table shows ACLY related fusion information. |
| ID | Head Gene | Tail Gene | Accession | Gene_a | qStart_a | qEnd_a | Chromosome_a | tStart_a | tEnd_a | Gene_a | qStart_a | qEnd_a | Chromosome_a | tStart_a | tEnd_a |
| BE840542 | ARHGAP8 | 30 | 158 | 22 | 45244867 | 45255667 | ACLY | 154 | 580 | 17 | 40052731 | 40053157 | |
| BE840465 | ARHGAP8 | 30 | 158 | 22 | 45244867 | 45255667 | ACLY | 154 | 580 | 17 | 40052731 | 40053157 | |
| Top |
| Mutation type/ Tissue ID | brca | cns | cerv | endome | haematopo | kidn | Lintest | liver | lung | ns | ovary | pancre | prost | skin | stoma | thyro | urina | |||
| Total # sample | 3 | 1 | 1 | 2 | ||||||||||||||||
| GAIN (# sample) | 3 | 1 | 1 | 2 | ||||||||||||||||
| LOSS (# sample) |
| cf) Tissue ID; Tissue type (1; Breast, 2; Central_nervous_system, 3; Cervix, 4; Endometrium, 5; Haematopoietic_and_lymphoid_tissue, 6; Kidney, 7; Large_intestine, 8; Liver, 9; Lung, 10; NS, 11; Ovary, 12; Pancreas, 13; Prostate, 14; Skin, 15; Stomach, 16; Thyroid, 17; Urinary_tract) |
| Top |
|
 |
| Top |
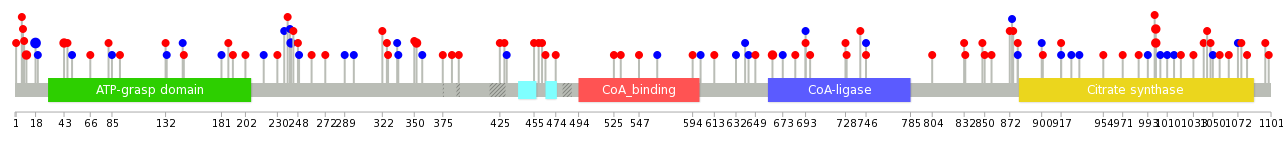
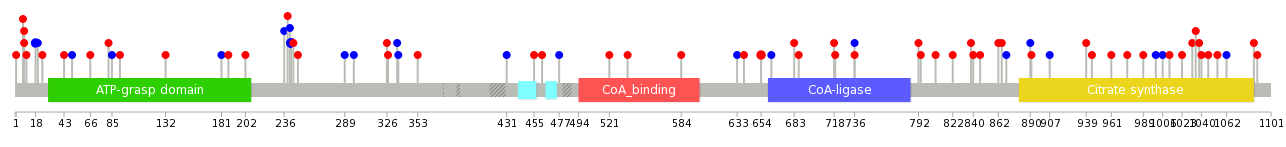
| Stat. for Non-Synonymous SNVs (# total SNVs=66) | (# total SNVs=24) |
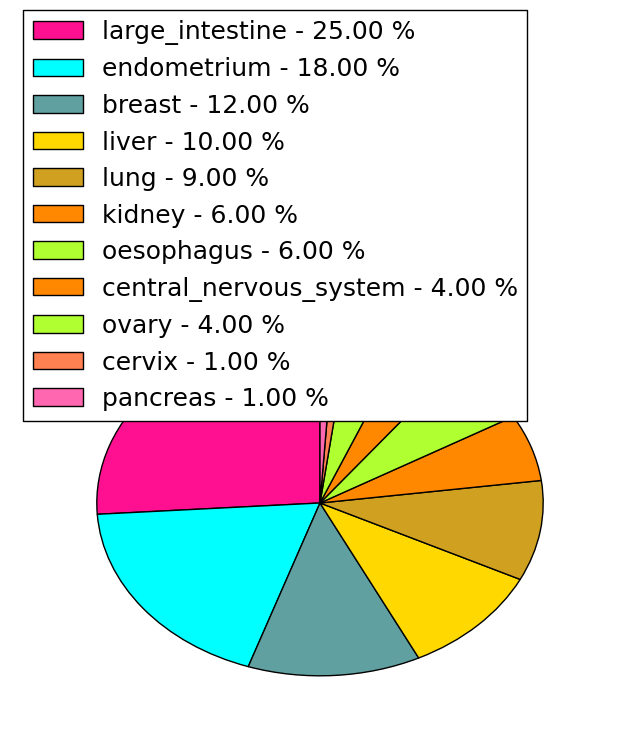 | 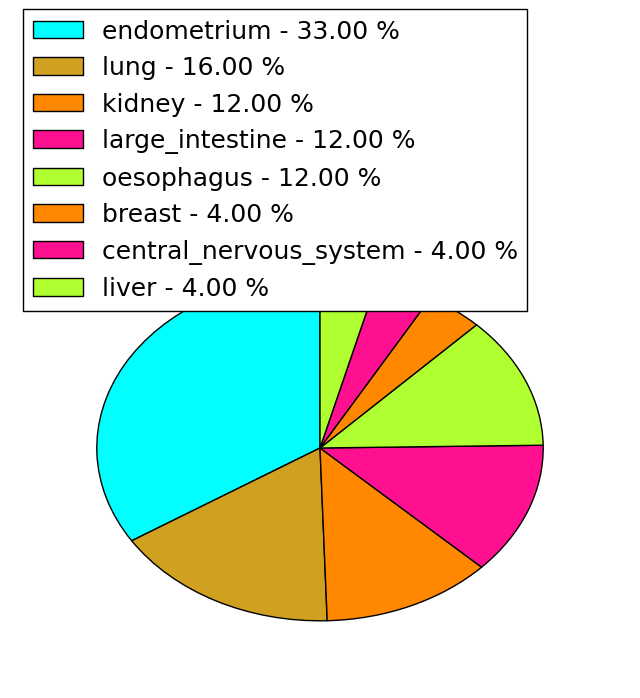 |
(# total SNVs=1) | (# total SNVs=1) |
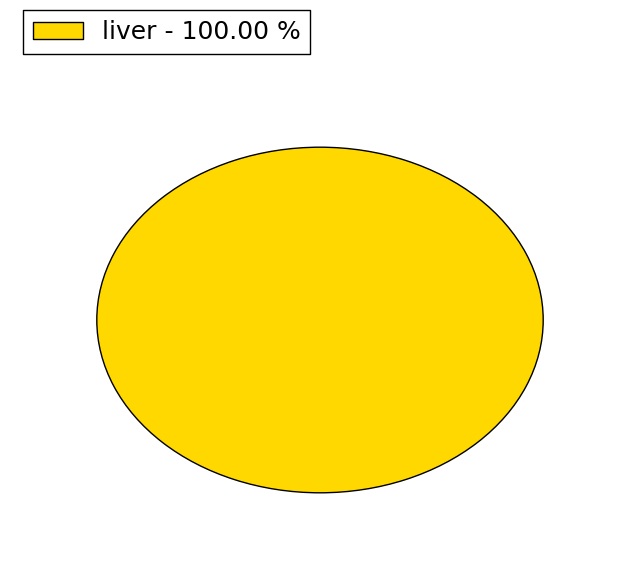 | 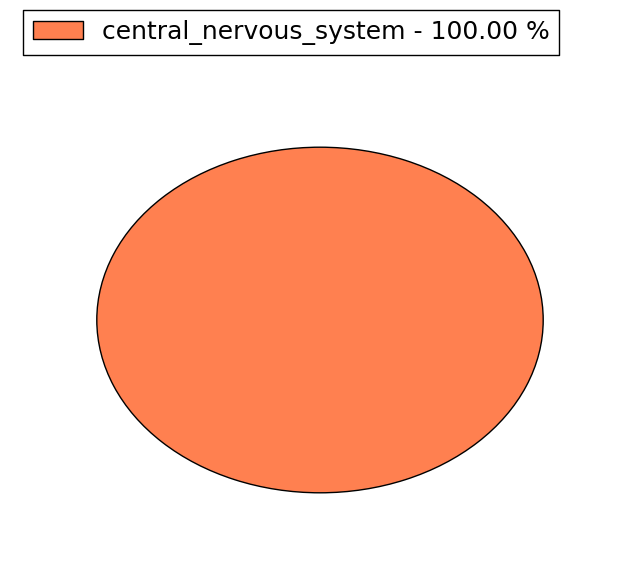 |
| Top |
| * When you move the cursor on each content, you can see more deailed mutation information on the Tooltip. Those are primary_site,primary_histology,mutation(aa),pubmedID. |
| GRCh37 position | Mutation(aa) | Unique sampleID count |
| chr17:40070073-40070073 | p.F18F | 4 |
| chr17:40030069-40030069 | p.Q879H | 2 |
| chr17:40060993-40060993 | p.A352T | 2 |
| chr17:40042447-40042447 | p.G664R | 2 |
| chr17:40055046-40055046 | p.? | 2 |
| chr17:40069998-40069998 | p.L43F | 2 |
| chr17:40063716-40063716 | p.F242F | 2 |
| chr17:40025779-40025779 | p.A1000V | 2 |
| chr17:40025780-40025780 | p.A1000S | 2 |
| chr17:40070098-40070098 | p.T10M | 2 |
| Top |
|
 |
| Point Mutation/ Tissue ID | 1 | 2 | 3 | 4 | 5 | 6 | 7 | 8 | 9 | 10 | 11 | 12 | 13 | 14 | 15 | 16 | 17 | 18 | 19 | 20 |
| # sample | 7 | 4 | 2 | 13 | 1 | 1 | 5 | 2 | 4 | 1 | 3 | 9 | 4 | 1 | 14 | |||||
| # mutation | 8 | 5 | 2 | 12 | 1 | 1 | 5 | 2 | 4 | 1 | 3 | 12 | 5 | 1 | 18 | |||||
| nonsynonymous SNV | 3 | 5 | 2 | 11 | 3 | 2 | 3 | 3 | 8 | 3 | 1 | 10 | ||||||||
| synonymous SNV | 5 | 1 | 1 | 1 | 2 | 1 | 1 | 4 | 2 | 8 |
| cf) Tissue ID; Tissue type (1; BLCA[Bladder Urothelial Carcinoma], 2; BRCA[Breast invasive carcinoma], 3; CESC[Cervical squamous cell carcinoma and endocervical adenocarcinoma], 4; COAD[Colon adenocarcinoma], 5; GBM[Glioblastoma multiforme], 6; Glioma Low Grade, 7; HNSC[Head and Neck squamous cell carcinoma], 8; KICH[Kidney Chromophobe], 9; KIRC[Kidney renal clear cell carcinoma], 10; KIRP[Kidney renal papillary cell carcinoma], 11; LAML[Acute Myeloid Leukemia], 12; LUAD[Lung adenocarcinoma], 13; LUSC[Lung squamous cell carcinoma], 14; OV[Ovarian serous cystadenocarcinoma ], 15; PAAD[Pancreatic adenocarcinoma], 16; PRAD[Prostate adenocarcinoma], 17; SKCM[Skin Cutaneous Melanoma], 18:STAD[Stomach adenocarcinoma], 19:THCA[Thyroid carcinoma], 20:UCEC[Uterine Corpus Endometrial Carcinoma]) |
| Top |
| * We represented just top 10 SNVs. When you move the cursor on each content, you can see more deailed mutation information on the Tooltip. Those are primary_site, primary_histology, mutation(aa), pubmedID. |
| Genomic Position | Mutation(aa) | Unique sampleID count |
| chr17:40063716 | p.F242F,ACLY | 3 |
| chr17:40070105 | p.G654R,ACLY | 2 |
| chr17:40042447 | p.F18F,ACLY | 2 |
| chr17:40070073 | p.E8K,ACLY | 2 |
| chr17:40028378 | p.S7L,ACLY | 1 |
| chr17:40061802 | p.V1000V,ACLY | 1 |
| chr17:40039402 | p.P807S,ACLY | 1 |
| chr17:40065317 | p.G477G,ACLY | 1 |
| chr17:40025364 | p.I236I,ACLY | 1 |
| chr17:40048661 | p.I202F,ACLY | 1 |
| * Copy number data were extracted from TCGA using R package TCGA-Assembler. The URLs of all public data files on TCGA DCC data server were gathered on Jan-05-2015. Function ProcessCNAData in TCGA-Assembler package was used to obtain gene-level copy number value which is calculated as the average copy number of the genomic region of a gene. |
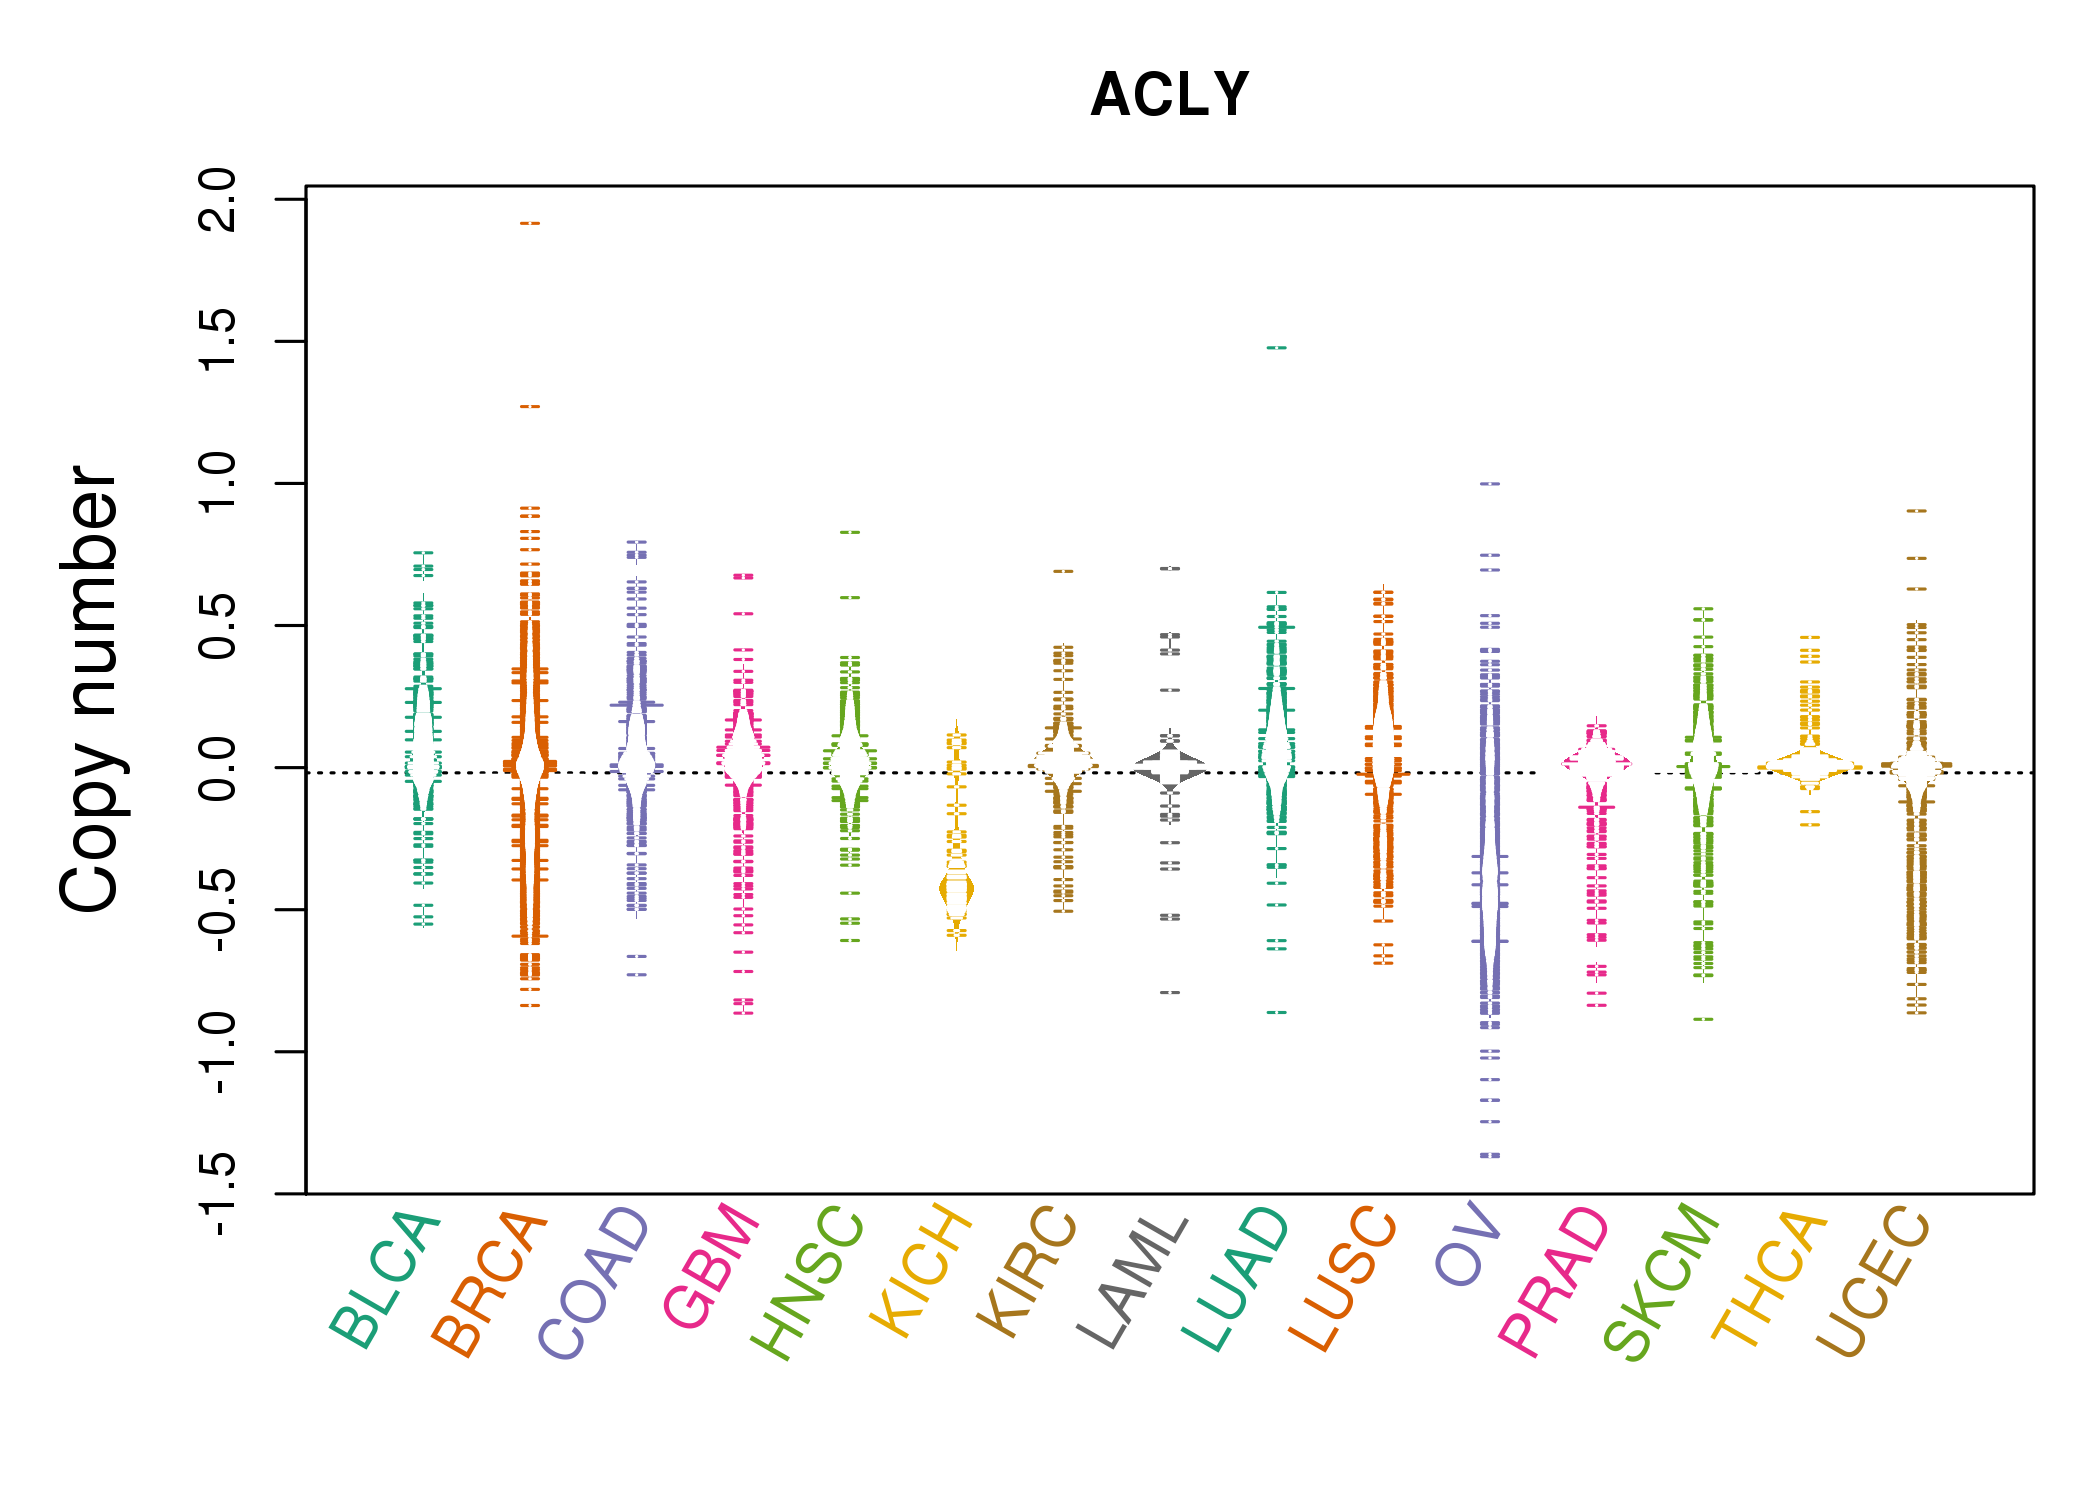 |
| cf) Tissue ID[Tissue type]: BLCA[Bladder Urothelial Carcinoma], BRCA[Breast invasive carcinoma], CESC[Cervical squamous cell carcinoma and endocervical adenocarcinoma], COAD[Colon adenocarcinoma], GBM[Glioblastoma multiforme], Glioma Low Grade, HNSC[Head and Neck squamous cell carcinoma], KICH[Kidney Chromophobe], KIRC[Kidney renal clear cell carcinoma], KIRP[Kidney renal papillary cell carcinoma], LAML[Acute Myeloid Leukemia], LUAD[Lung adenocarcinoma], LUSC[Lung squamous cell carcinoma], OV[Ovarian serous cystadenocarcinoma ], PAAD[Pancreatic adenocarcinoma], PRAD[Prostate adenocarcinoma], SKCM[Skin Cutaneous Melanoma], STAD[Stomach adenocarcinoma], THCA[Thyroid carcinoma], UCEC[Uterine Corpus Endometrial Carcinoma] |
| Top |
| Gene Expression for ACLY |
| * CCLE gene expression data were extracted from CCLE_Expression_Entrez_2012-10-18.res: Gene-centric RMA-normalized mRNA expression data. |
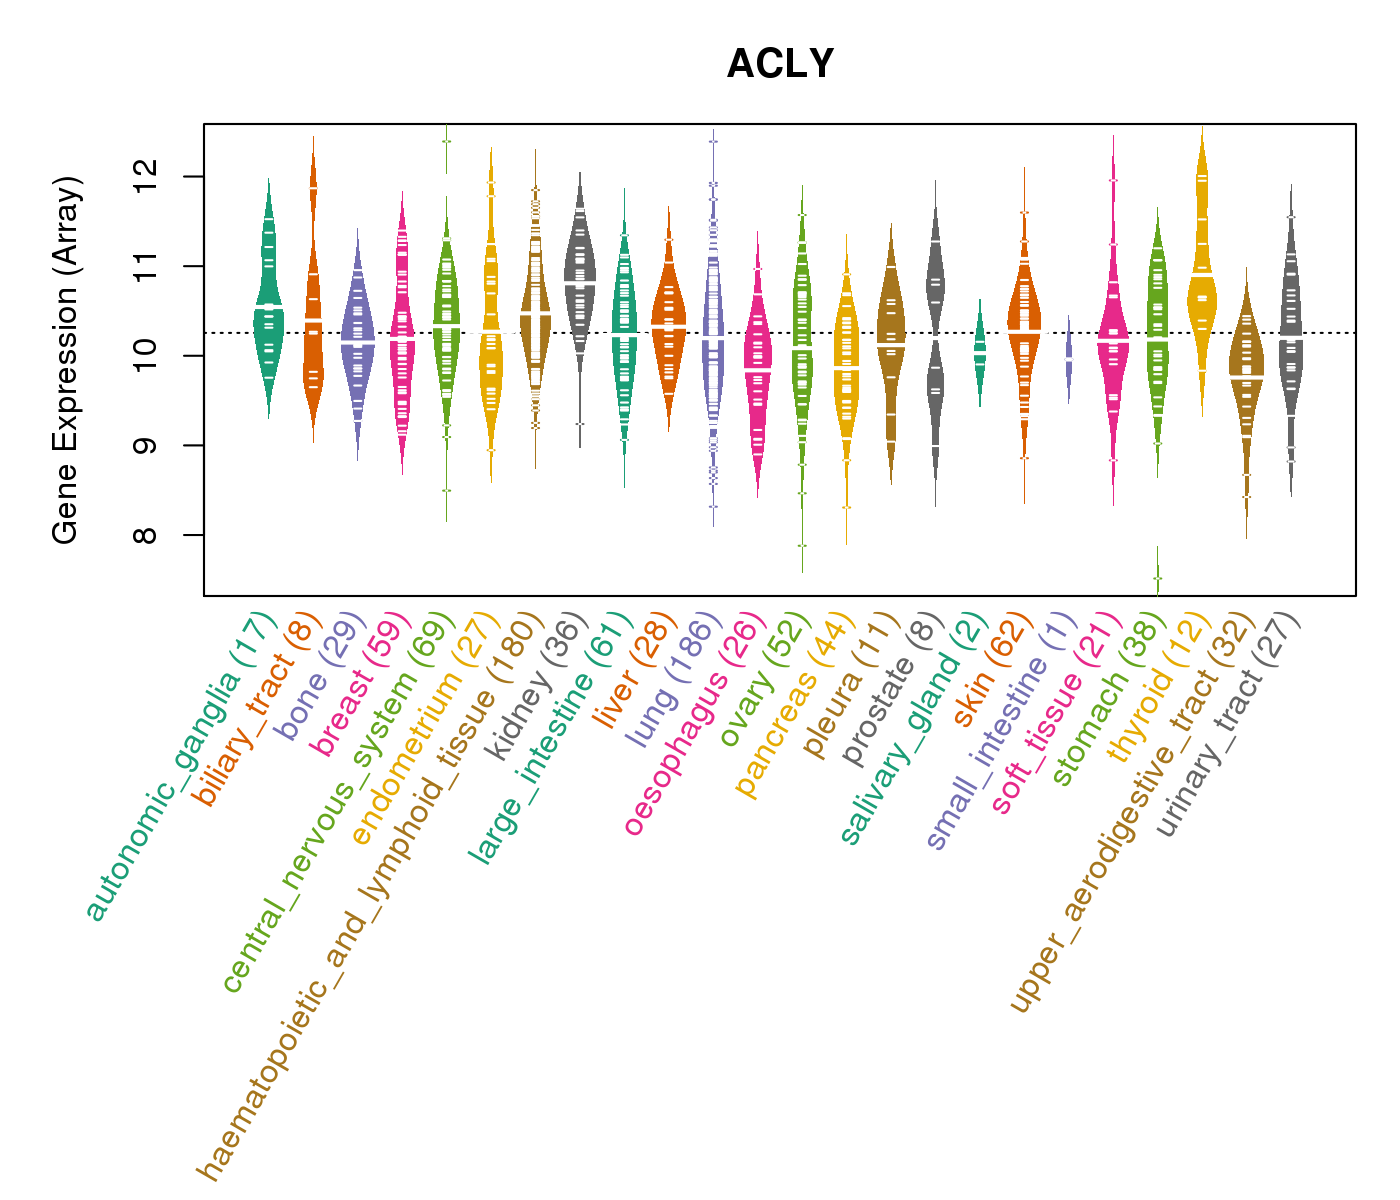 |
| * Normalized gene expression data of RNASeqV2 was extracted from TCGA using R package TCGA-Assembler. The URLs of all public data files on TCGA DCC data server were gathered at Jan-05-2015. Only eight cancer types have enough normal control samples for differential expression analysis. (t test, adjusted p<0.05 (using Benjamini-Hochberg FDR)) |
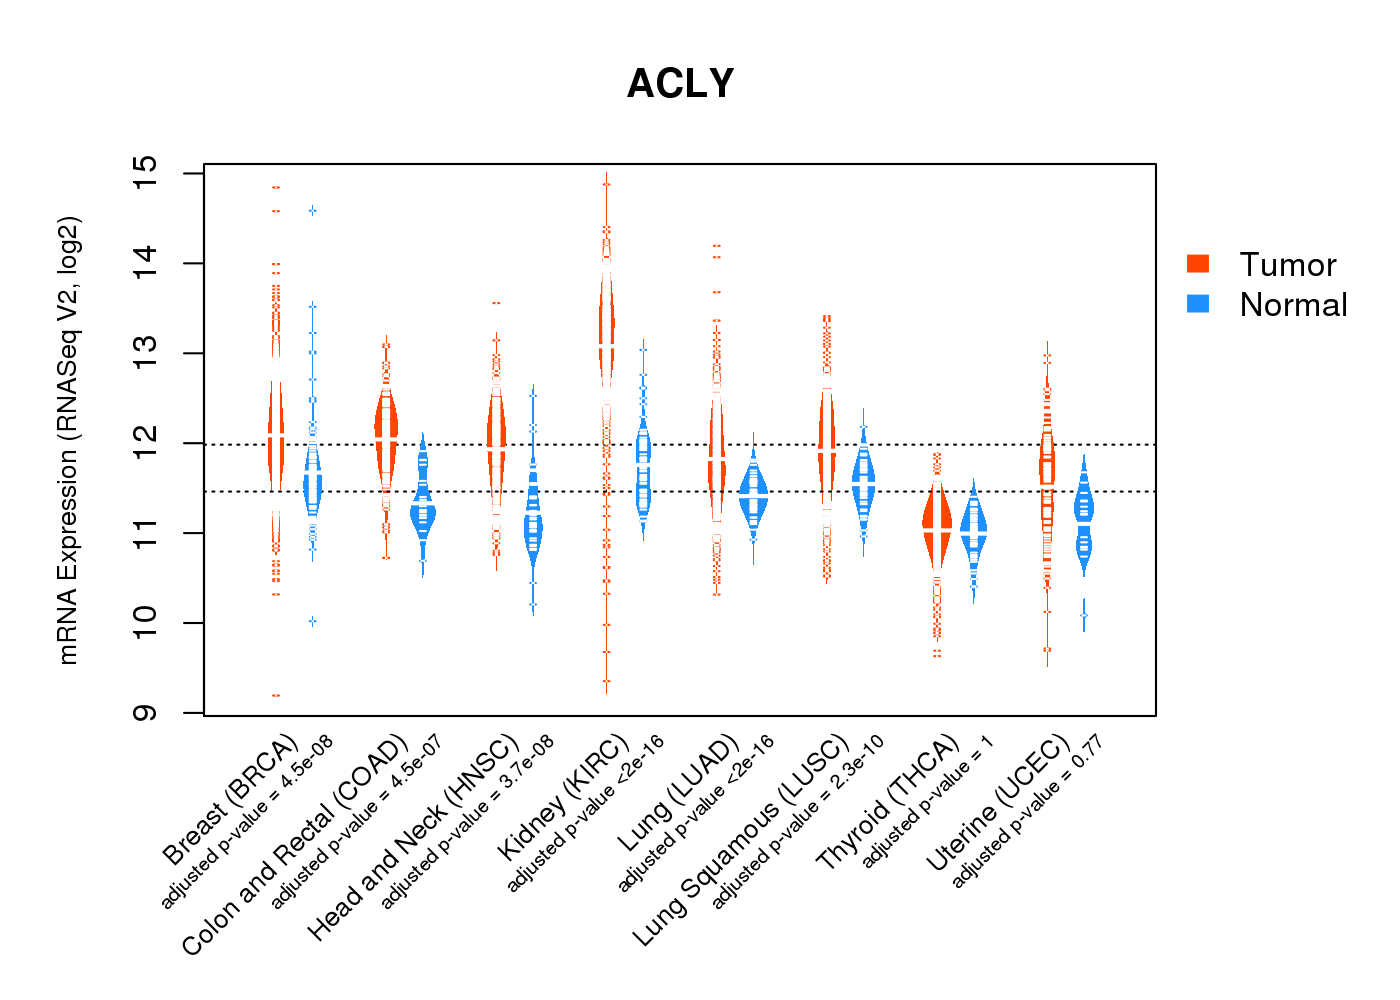 |
| Top |
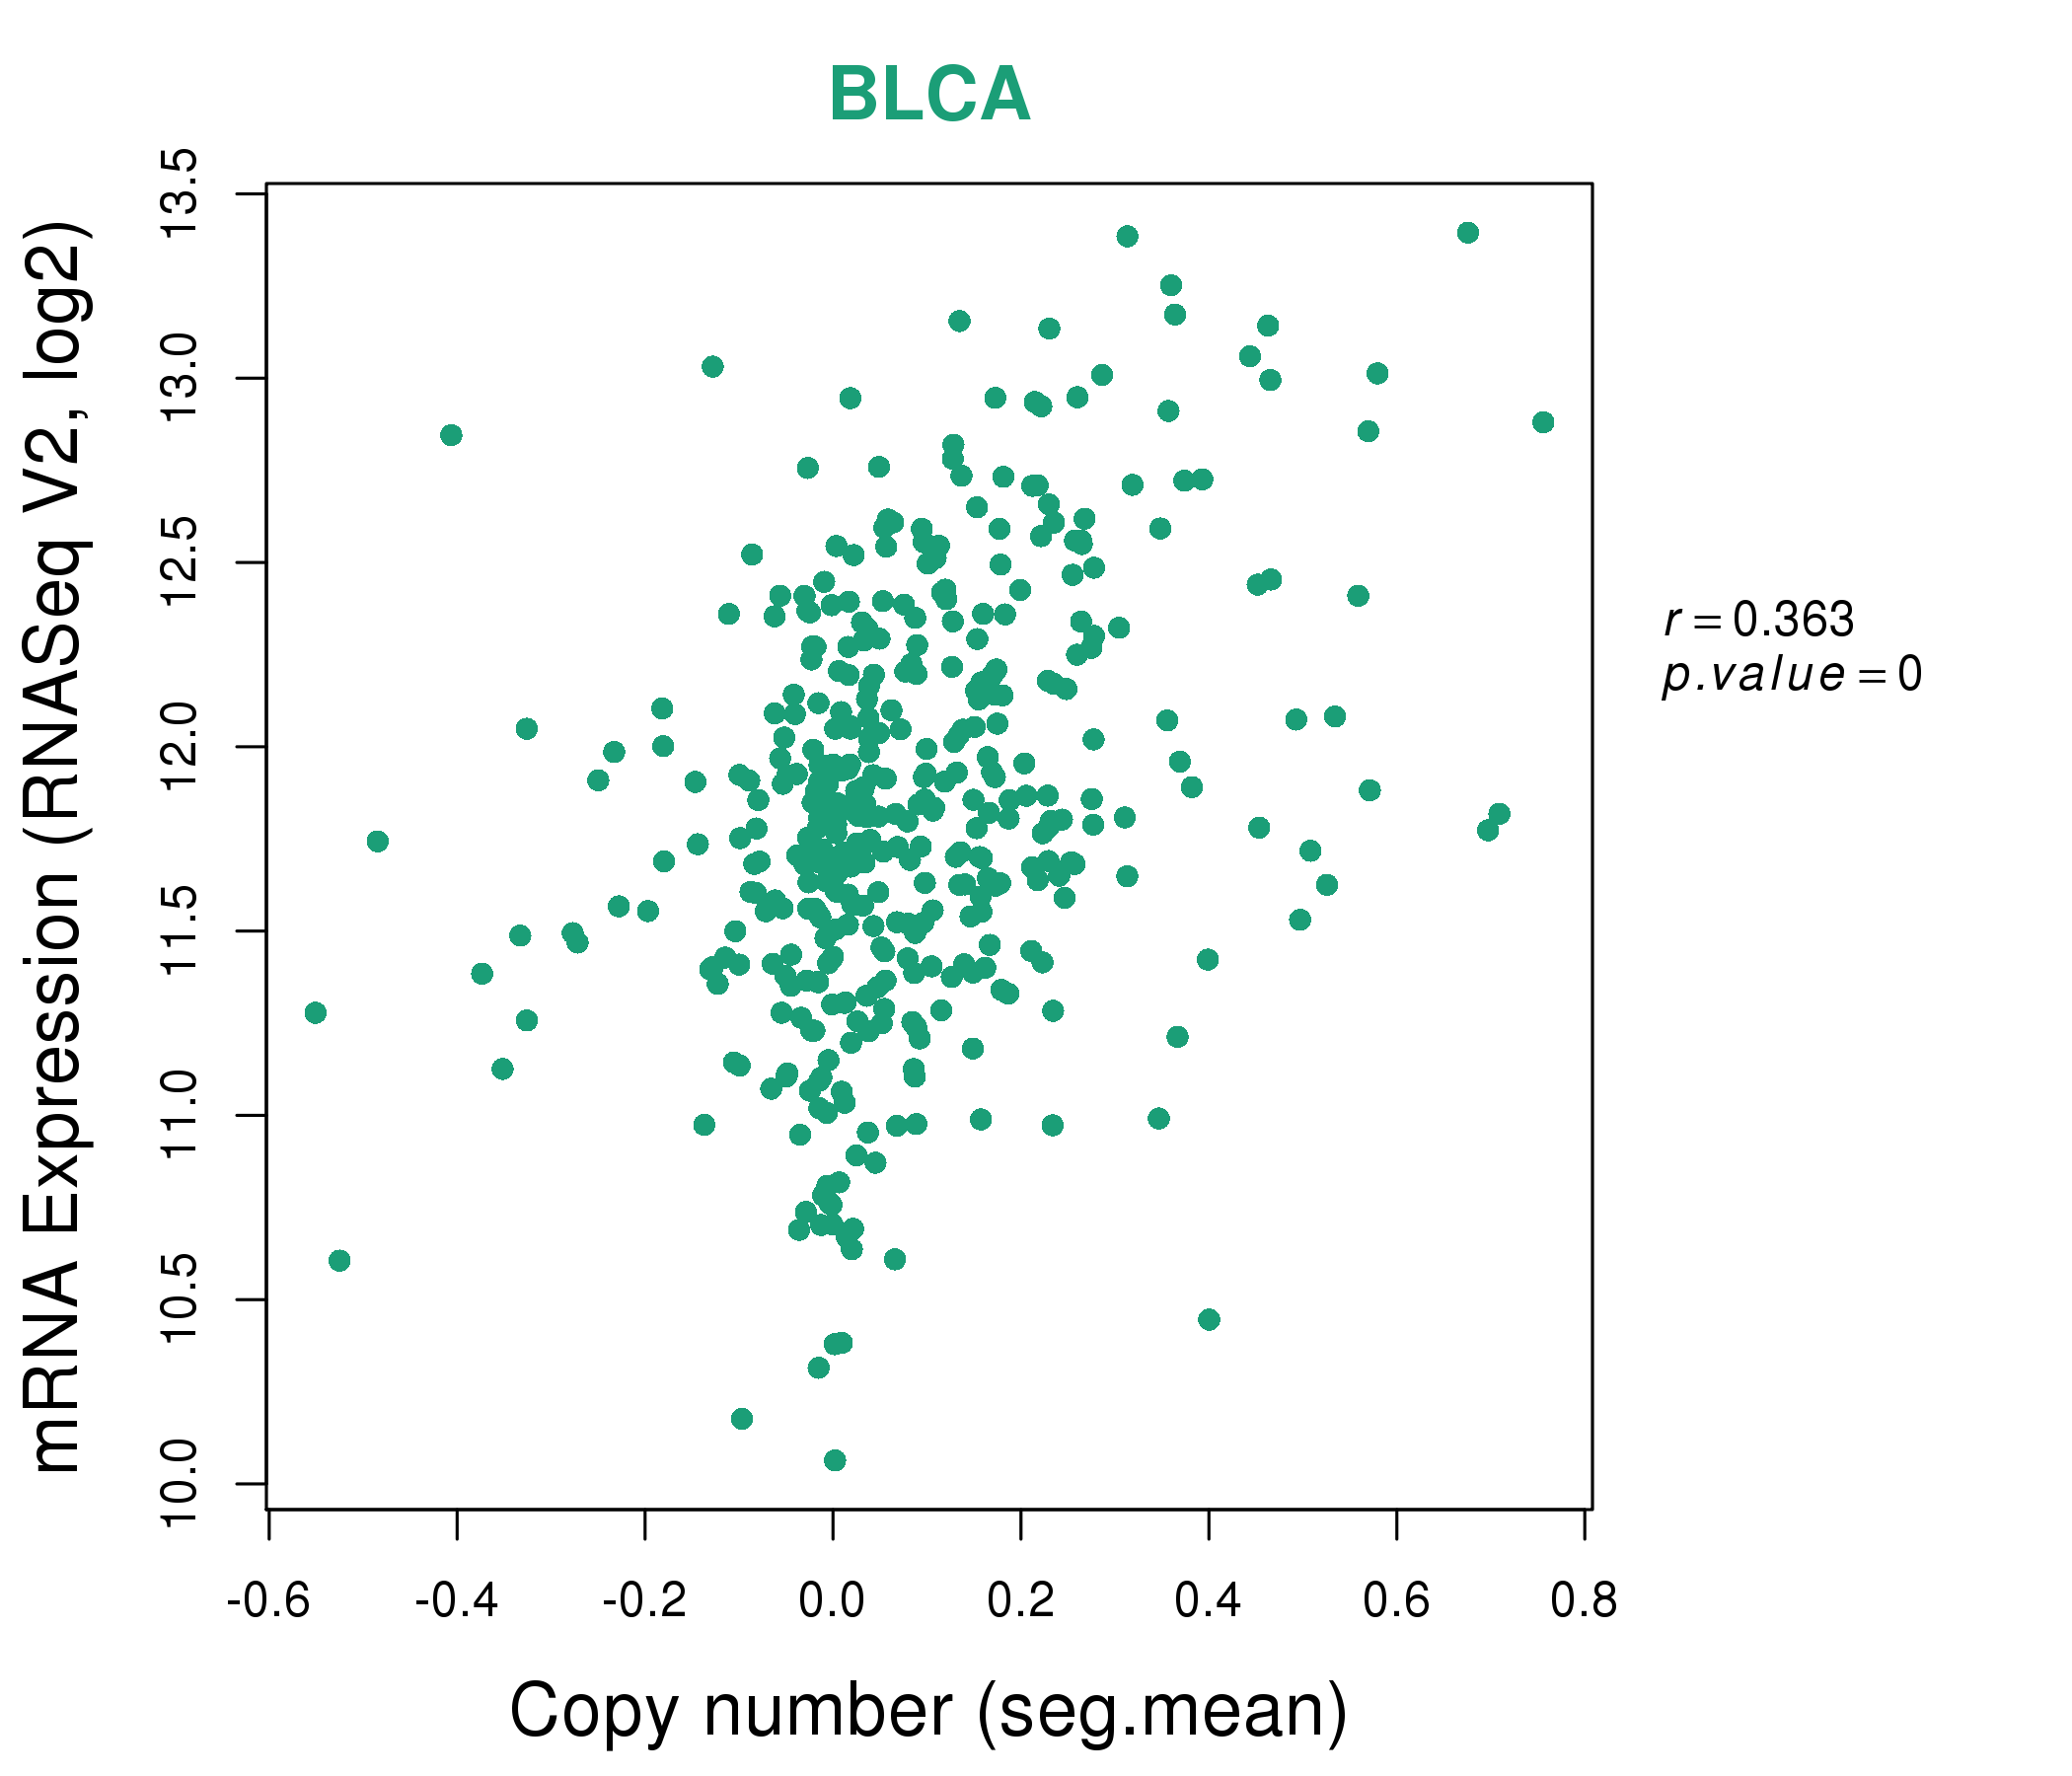
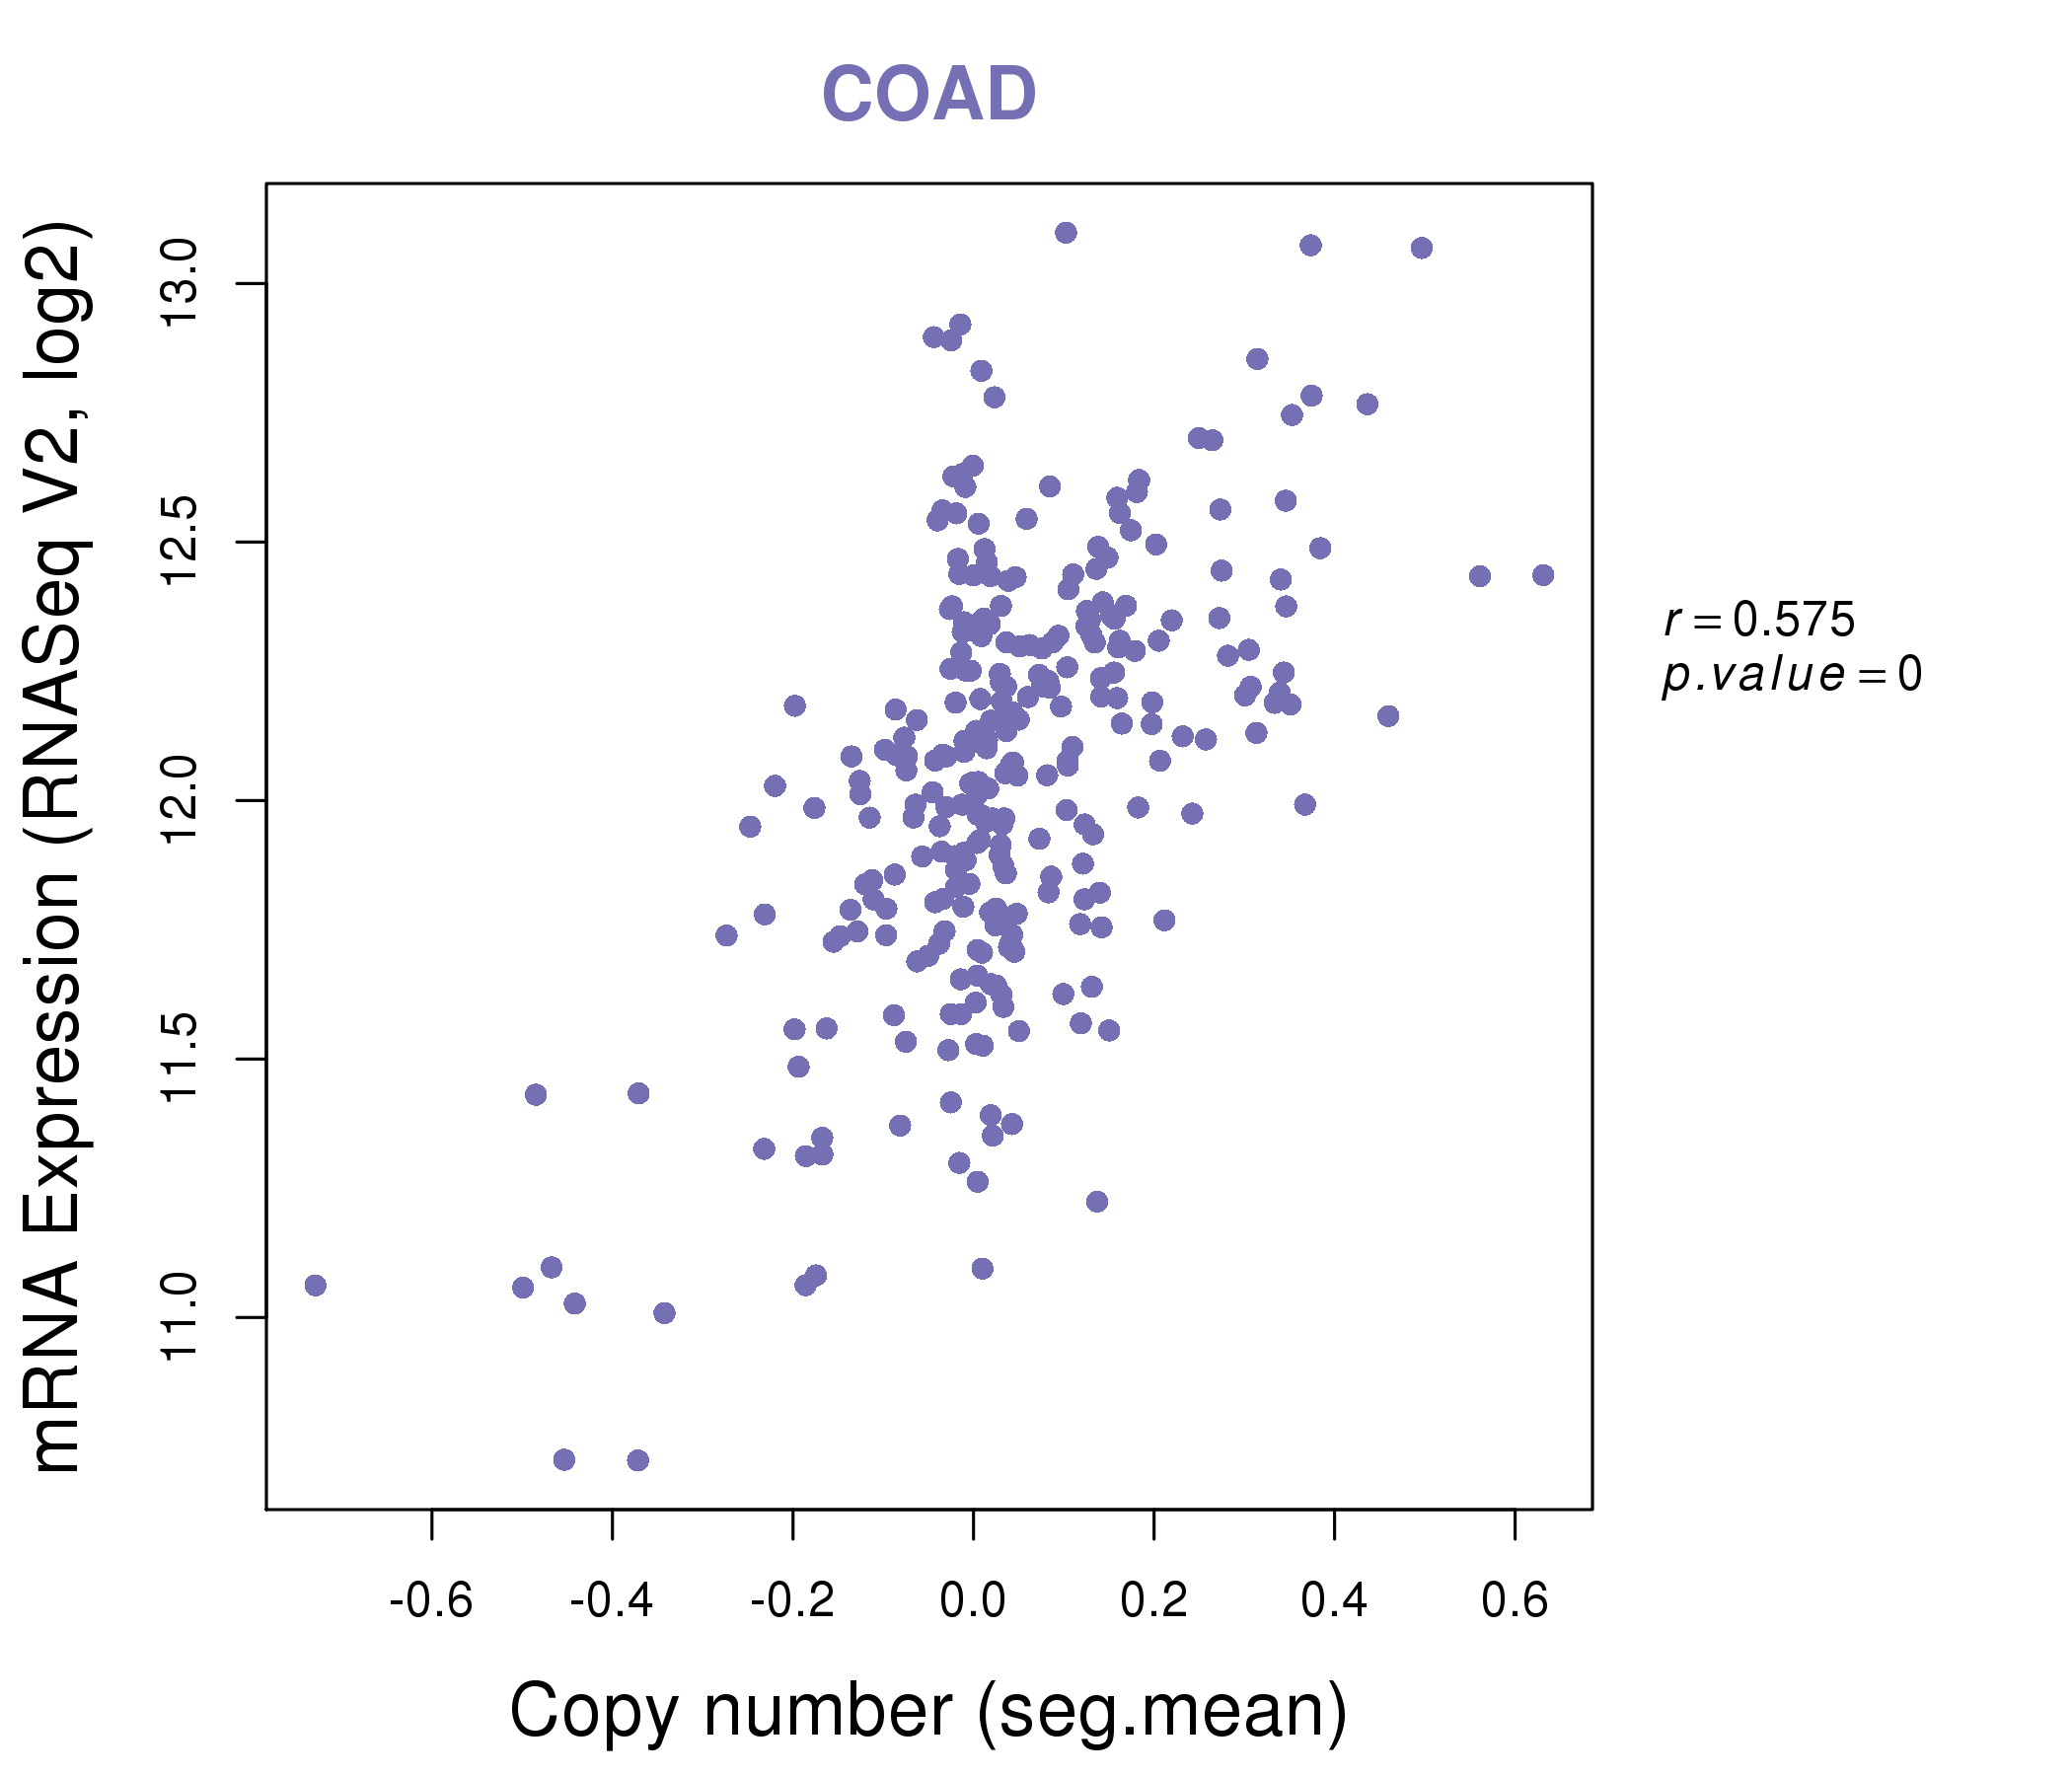
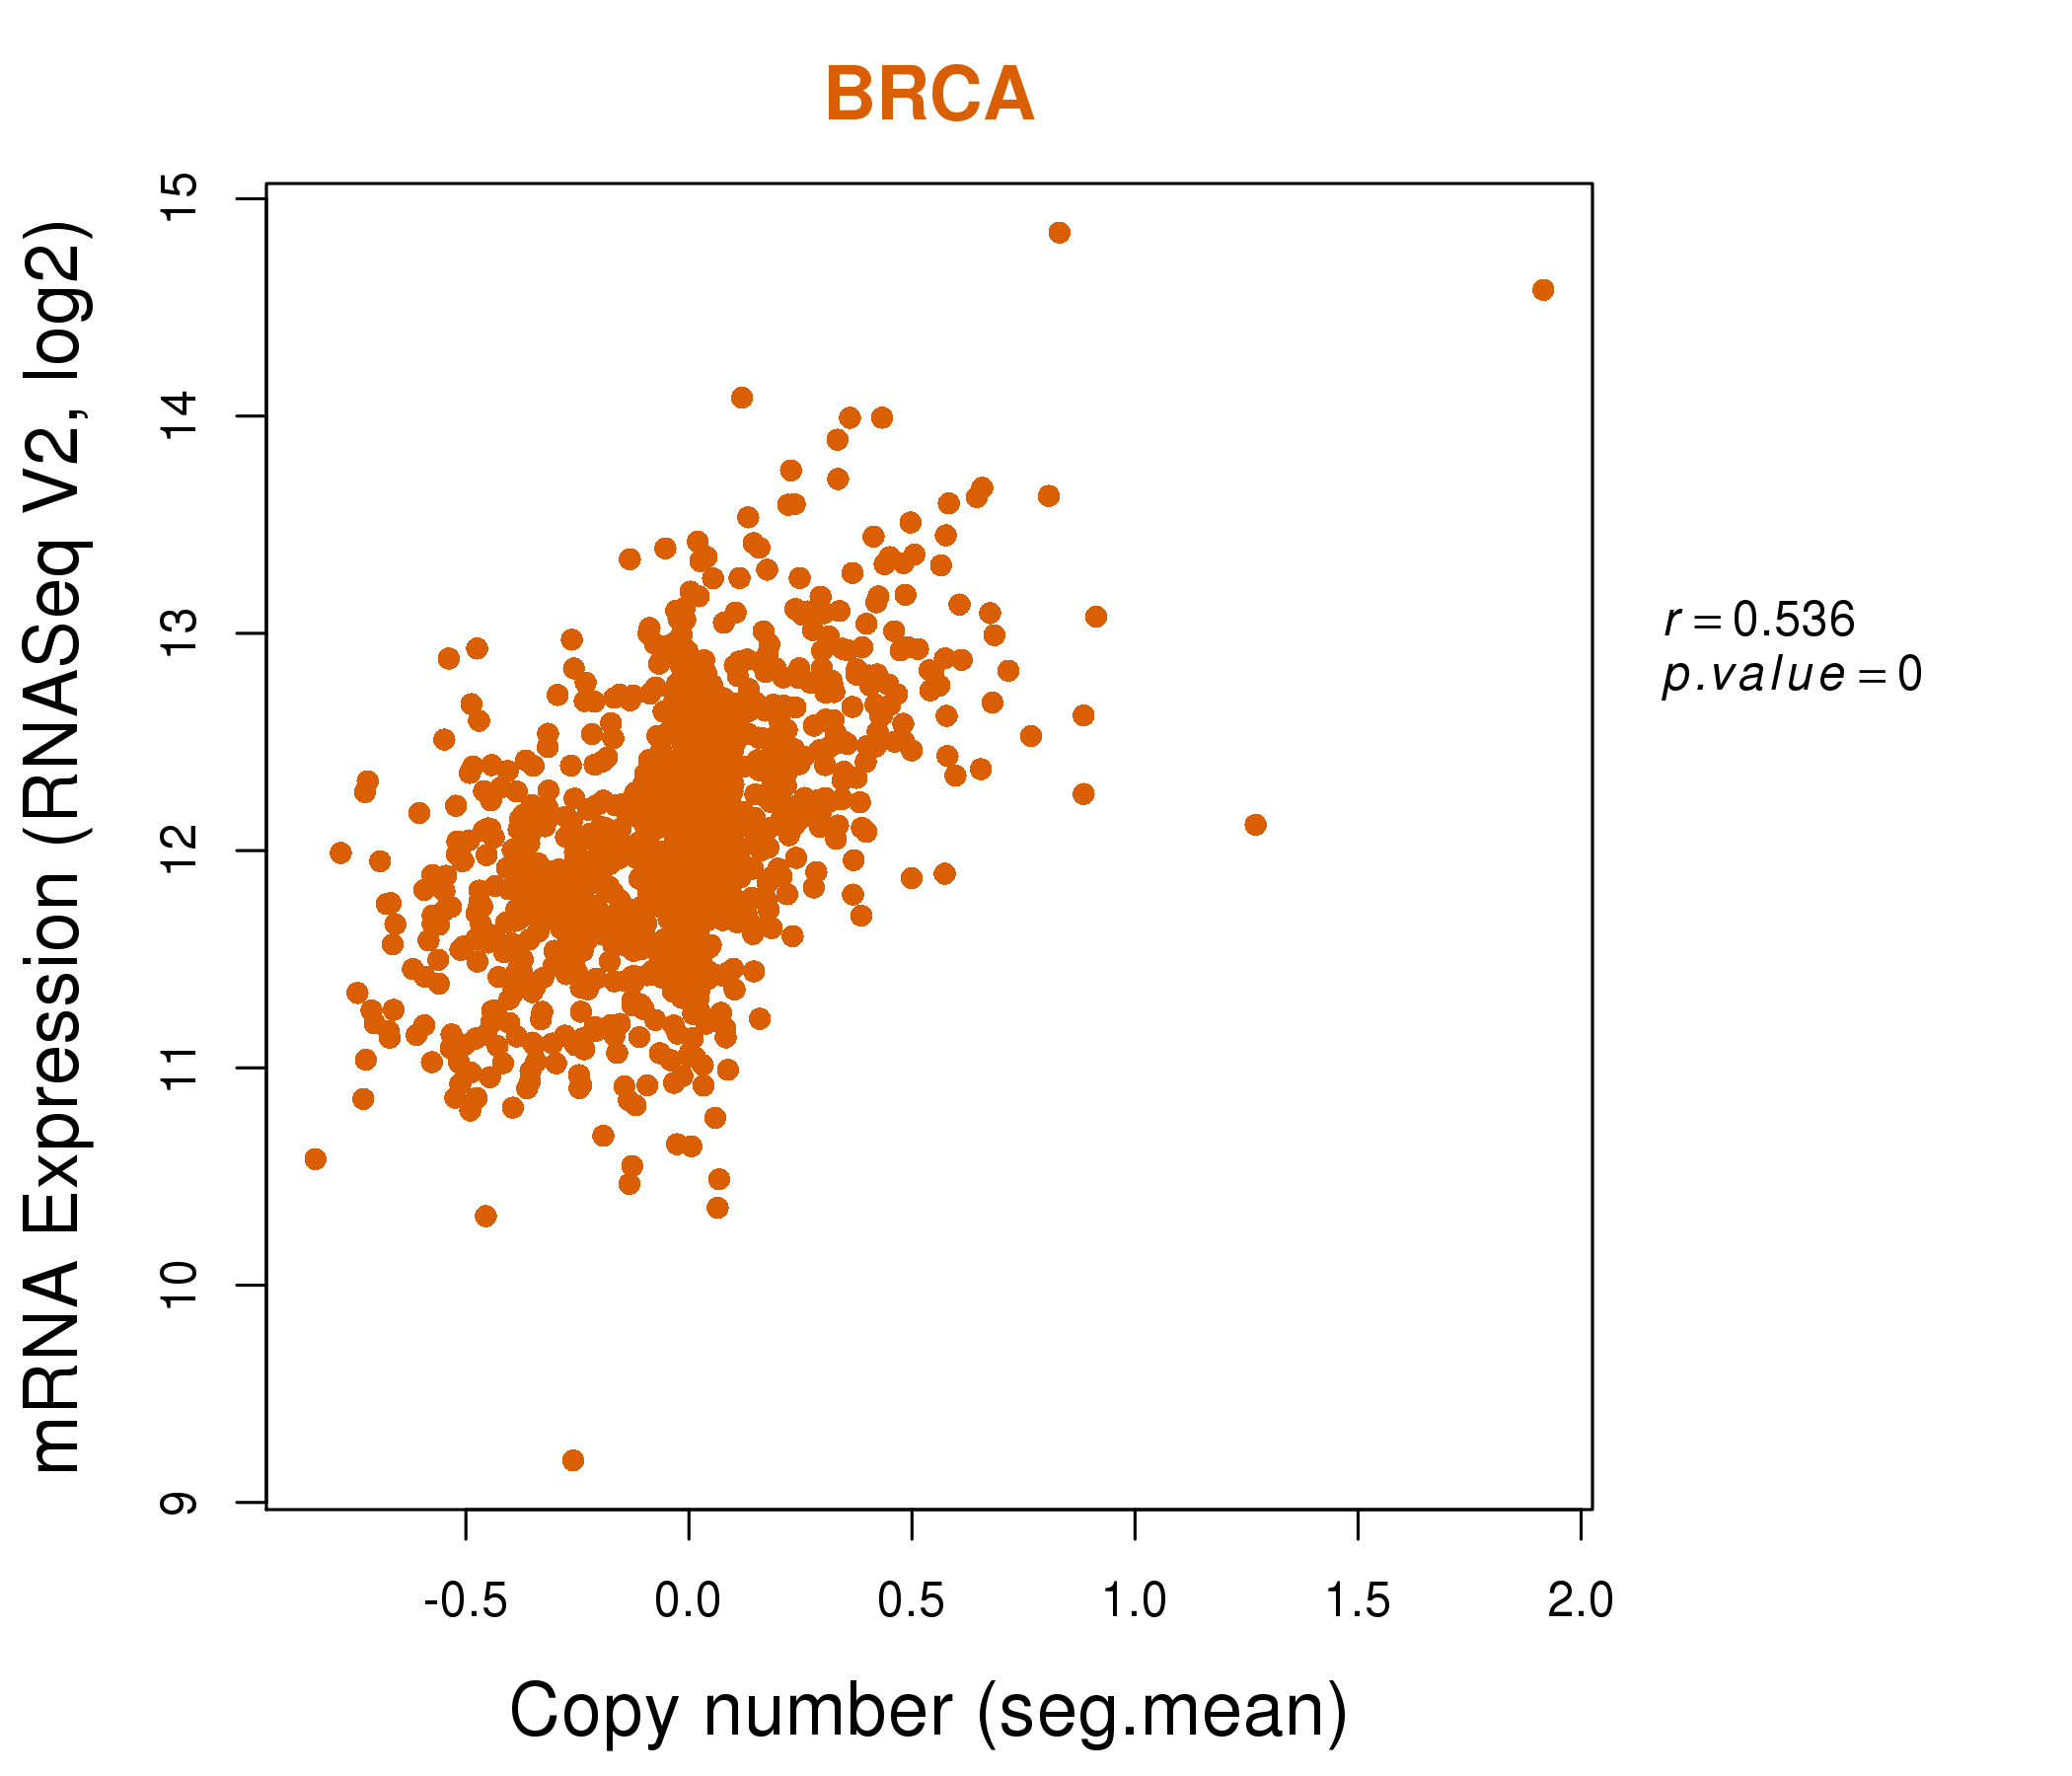
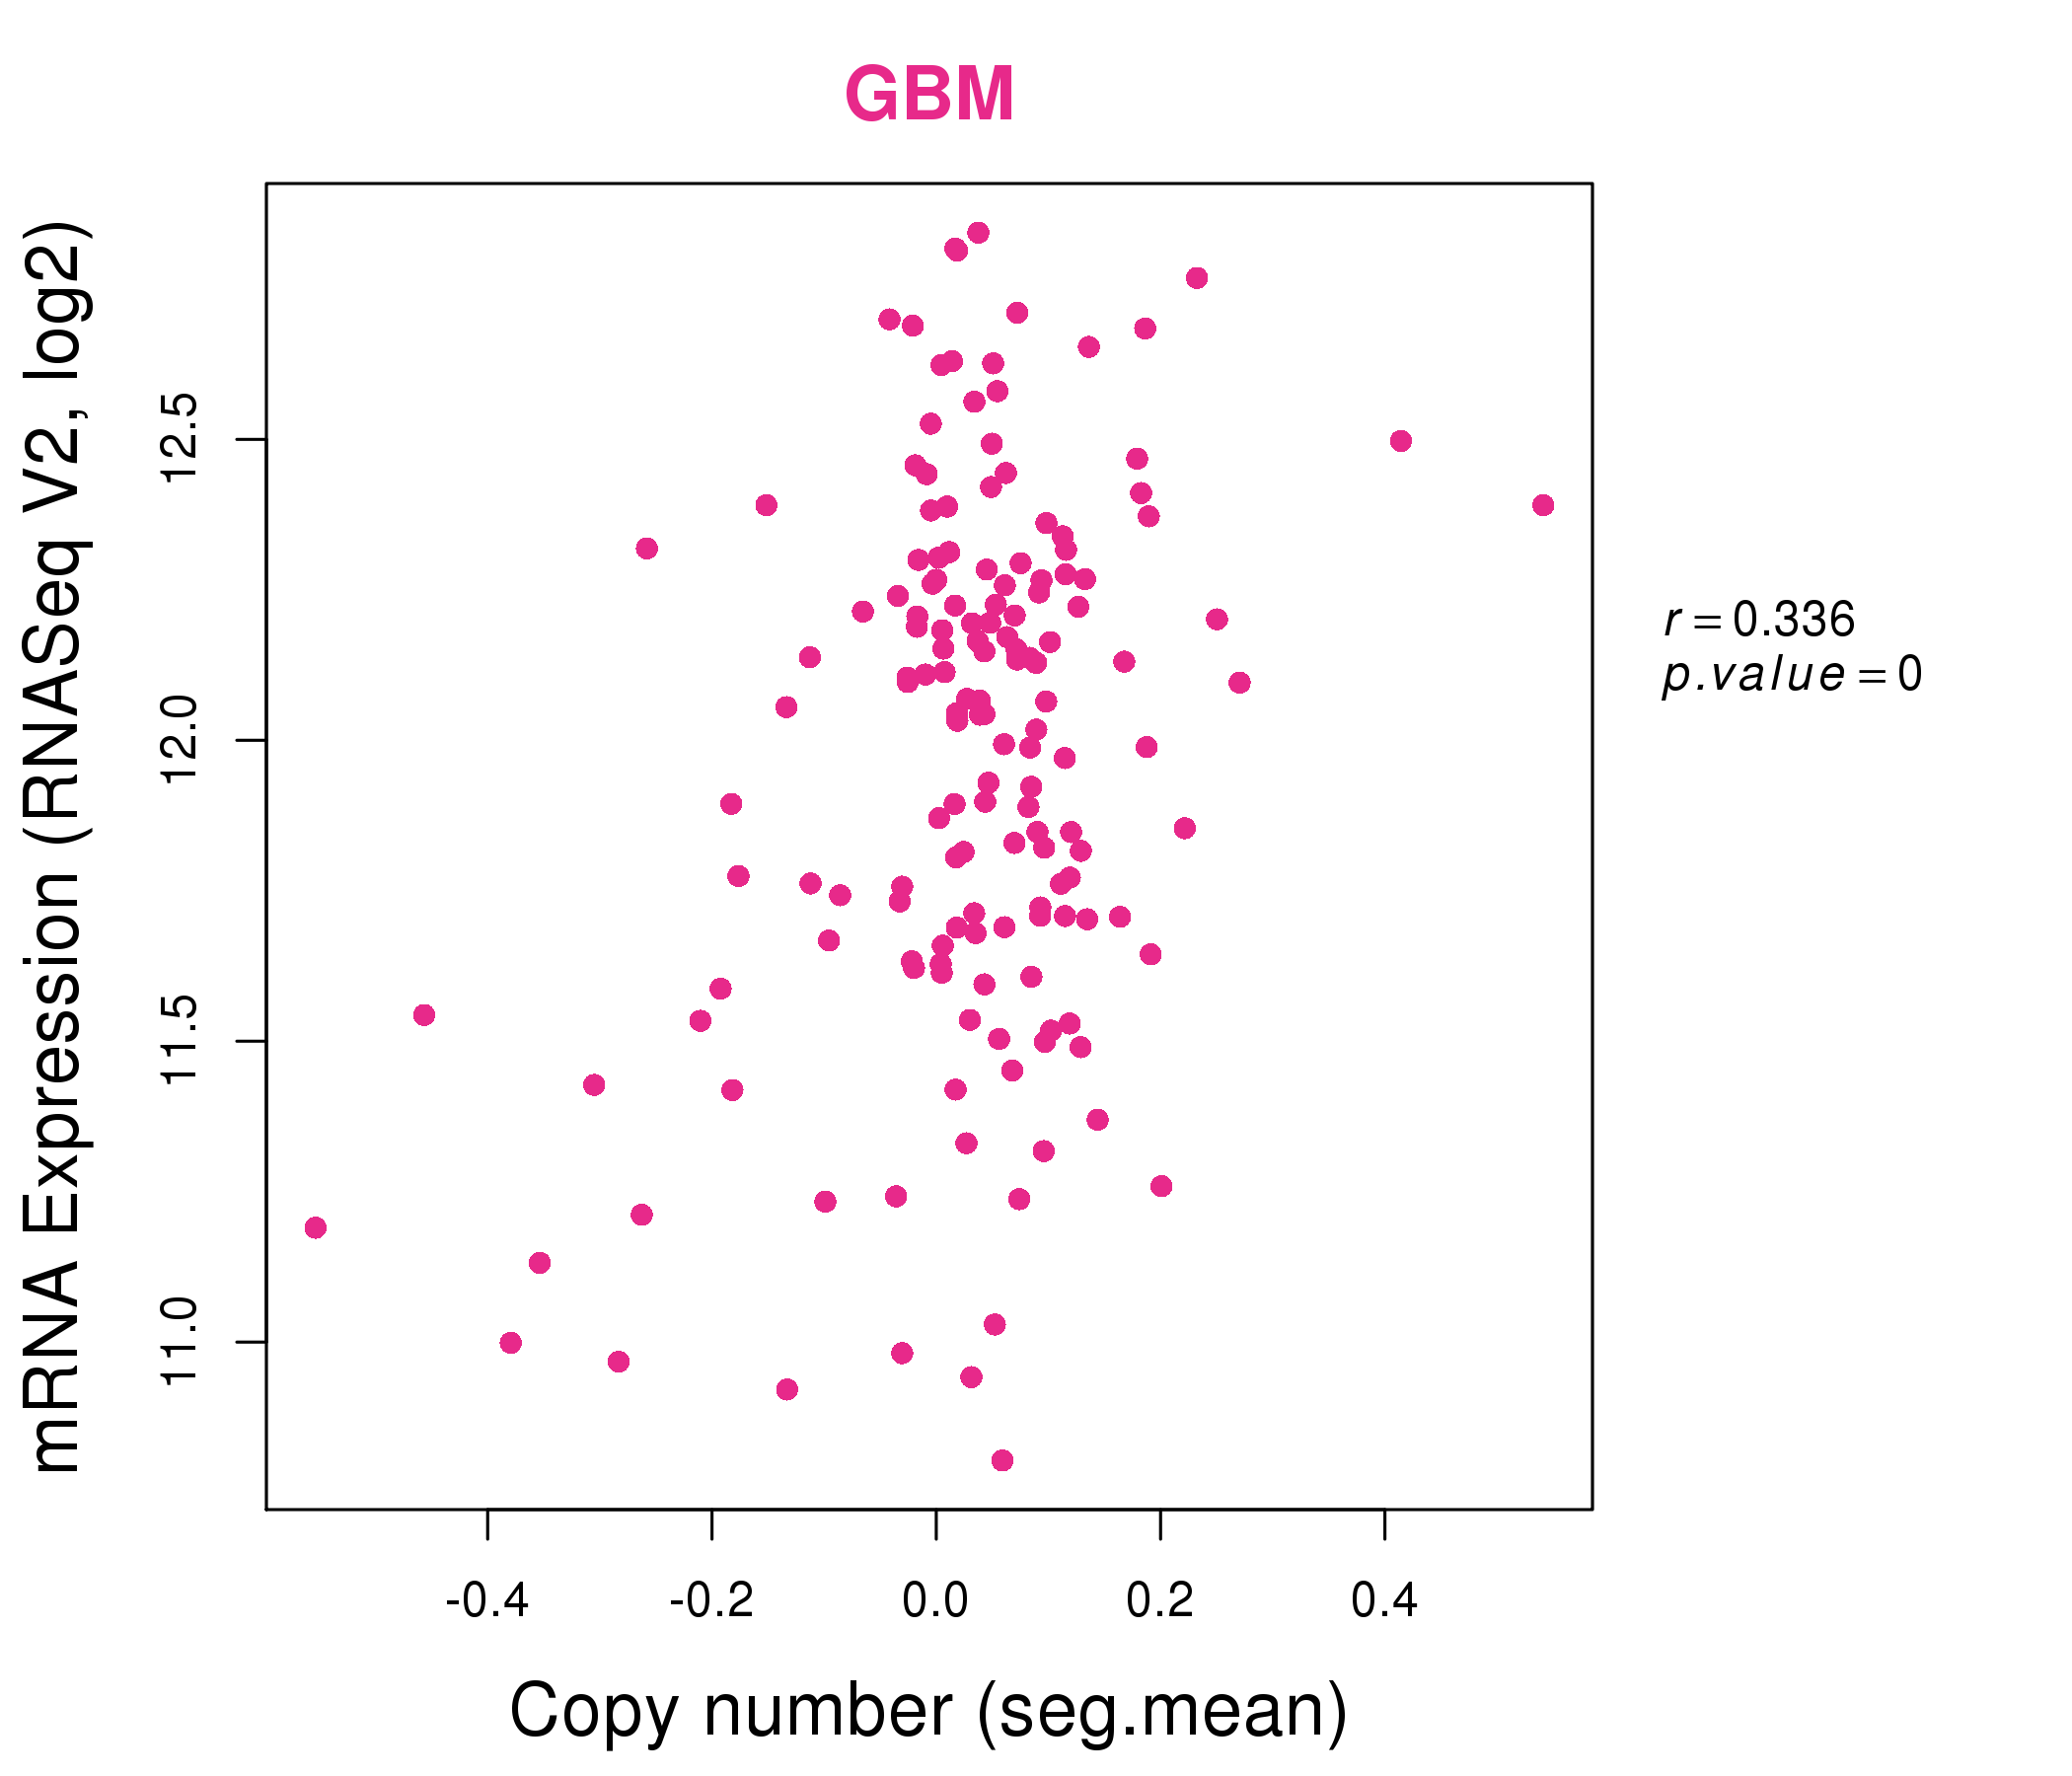
| * This plots show the correlation between CNV and gene expression. |
: Open all plots for all cancer types
 |
|
 |
|
| Top |
| Gene-Gene Network Information |
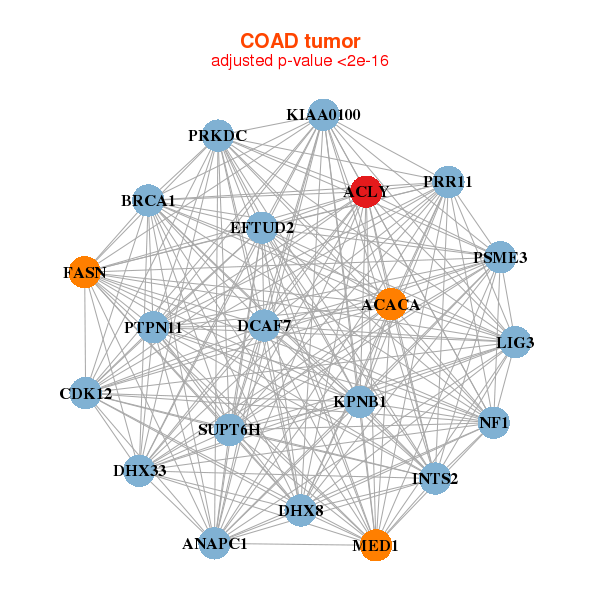
| * Co-Expression network figures were drawn using R package igraph. Only the top 20 genes with the highest correlations were shown. Red circle: input gene, orange circle: cell metabolism gene, sky circle: other gene |
: Open all plots for all cancer types
 |
|
| ACACA,ACLY,ADAT1,ATP6V0A1,BECN1,BRCA1,CCDC43, CLCN3,DHX8,KLHL11,KPNB1,LARP4,LIG3,LMBRD2, MLX,NBR1,NSF,PSME3,RAB5C,RUNDC1,STT3B | ACACA,ACLY,C8orf34,CPA2,ELOVL6,FADS1,RMDN3, GPR50,LOC285370,LSS,ME1,MMP17,NKX2-4,OLFM2, PNPLA3,SCD,SEL1L2,SHPK,SLC7A4,SPZ1,TMEM132B |
 |
|
| ACACA,ACLY,ANAPC1,BRCA1,CDK12,DCAF7,DHX33, DHX8,EFTUD2,FASN,INTS2,KIAA0100,KPNB1,LIG3, MED1,NF1,PRKDC,PRR11,PSME3,PTPN11,SUPT6H | ACLY,ATP11A,BRWD3,NRDE2,CDYL2,CLCN5,COPA, CREB3L2,DDB1,ENTPD7,EPT1,GALNT10,GANAB,MPP6, NBAS,NIPA1,REG4,SEC31A,SERPINB5,SMC1A,ZNF697 |
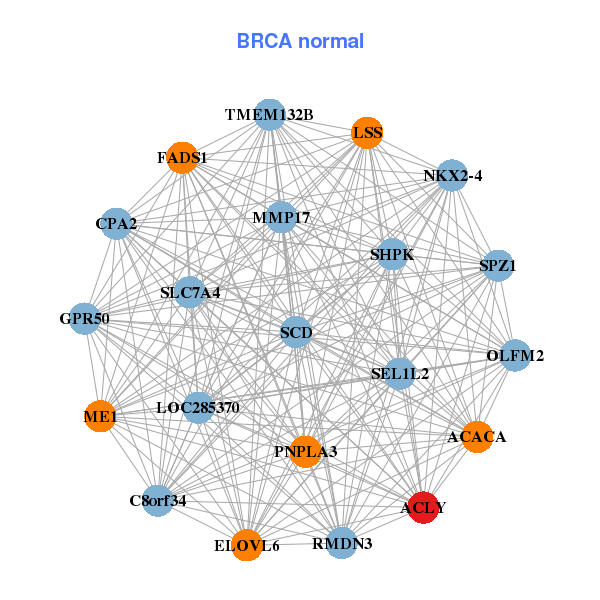

| * Co-Expression network figures were drawn using R package igraph. Only the top 20 genes with the highest correlations were shown. Red circle: input gene, orange circle: cell metabolism gene, sky circle: other gene |
: Open all plots for all cancer types
| Top |
: Open all interacting genes' information including KEGG pathway for all interacting genes from DAVID
| Top |
| Pharmacological Information for ACLY |
| There's no related Drug. |
| Top |
| Cross referenced IDs for ACLY |
| * We obtained these cross-references from Uniprot database. It covers 150 different DBs, 18 categories. http://www.uniprot.org/help/cross_references_section |
: Open all cross reference information
|
Copyright © 2016-Present - The Univsersity of Texas Health Science Center at Houston @ |