|
||||||||||||||||||||
| |
| Phenotypic Information (metabolism pathway, cancer, disease, phenome) |
| |
| |
| Gene-Gene Network Information: Co-Expression Network, Interacting Genes & KEGG |
| |
|


| Gene Summary for NEU1 |
| Top |
| Phenotypic Information for NEU1(metabolism pathway, cancer, disease, phenome) |
| Cancer | CGAP: NEU1 |
| Familial Cancer Database: NEU1 | |
| * This gene is included in those cancer gene databases. |
|
|
|
|
|
|
| ||||||||||||||
Oncogene 1 | Significant driver gene in | |||||||||||||||||||
| cf) number; DB name 1 Oncogene; http://nar.oxfordjournals.org/content/35/suppl_1/D721.long, 2 Tumor Suppressor gene; https://bioinfo.uth.edu/TSGene/, 3 Cancer Gene Census; http://www.nature.com/nrc/journal/v4/n3/abs/nrc1299.html, 4 CancerGenes; http://nar.oxfordjournals.org/content/35/suppl_1/D721.long, 5 Network of Cancer Gene; http://ncg.kcl.ac.uk/index.php, 1Therapeutic Vulnerabilities in Cancer; http://cbio.mskcc.org/cancergenomics/statius/ |
| KEGG_SPHINGOLIPID_METABOLISM REACTOME_GLYCOSPHINGOLIPID_METABOLISM REACTOME_PHOSPHOLIPID_METABOLISM REACTOME_SPHINGOLIPID_METABOLISM REACTOME_METABOLISM_OF_LIPIDS_AND_LIPOPROTEINS | |
| OMIM | |
| Orphanet | |
| Disease | KEGG Disease: NEU1 |
| MedGen: NEU1 (Human Medical Genetics with Condition) | |
| ClinVar: NEU1 | |
| Phenotype | MGI: NEU1 (International Mouse Phenotyping Consortium) |
| PhenomicDB: NEU1 | |
| Mutations for NEU1 |
| * Under tables are showing count per each tissue to give us broad intuition about tissue specific mutation patterns.You can go to the detailed page for each mutation database's web site. |
| There's no structural variation information in COSMIC data for this gene. |
| * From mRNA Sanger sequences, Chitars2.0 arranged chimeric transcripts. This table shows NEU1 related fusion information. |
| ID | Head Gene | Tail Gene | Accession | Gene_a | qStart_a | qEnd_a | Chromosome_a | tStart_a | tEnd_a | Gene_a | qStart_a | qEnd_a | Chromosome_a | tStart_a | tEnd_a |
| AA345305 | FGA | 1 | 87 | 4 | 155507732 | 155507818 | NEU1 | 87 | 215 | 6 | 3159999 | 3160127 | |
| AI368907 | NEU1 | 29 | 95 | 6 | 3160129 | 3160195 | NEU1 | 93 | 362 | 6 | 3159826 | 3160095 | |
| BQ301319 | NEU1 | 9 | 109 | 6 | 3160581 | 3160681 | NEU1 | 106 | 273 | 6 | 3160664 | 3161005 | |
| Top |
| There's no copy number variation information in COSMIC data for this gene. |
| Top |
|
 |
| Top |
| Stat. for Non-Synonymous SNVs (# total SNVs=20) | (# total SNVs=6) |
 |  |
(# total SNVs=0) | (# total SNVs=0) |
| Top |
| * When you move the cursor on each content, you can see more deailed mutation information on the Tooltip. Those are primary_site,primary_histology,mutation(aa),pubmedID. |
| GRCh37 position | Mutation(aa) | Unique sampleID count |
| chr6:31829855-31829855 | p.L91L | 2 |
| chr6:31827959-31827959 | p.R294H | 2 |
| chr6:31829050-31829050 | p.D177G | 2 |
| chr6:31829871-31829871 | p.P86L | 1 |
| chr6:31827960-31827960 | p.R294C | 1 |
| chr6:31829063-31829063 | p.W173R | 1 |
| chr6:31829888-31829888 | p.P80P | 1 |
| chr6:31828001-31828001 | p.R280Q | 1 |
| chr6:31829067-31829067 | p.L171F | 1 |
| chr6:31827543-31827543 | p.T401S | 1 |
| Top |
|
 |
| Point Mutation/ Tissue ID | 1 | 2 | 3 | 4 | 5 | 6 | 7 | 8 | 9 | 10 | 11 | 12 | 13 | 14 | 15 | 16 | 17 | 18 | 19 | 20 |
| # sample | 10 | 2 | 3 | 1 | 1 | 4 | 1 | 6 | 3 | |||||||||||
| # mutation | 10 | 2 | 3 | 1 | 1 | 4 | 1 | 6 | 4 | |||||||||||
| nonsynonymous SNV | 7 | 1 | 1 | 1 | 1 | 3 | 1 | 4 | 2 | |||||||||||
| synonymous SNV | 3 | 1 | 2 | 1 | 2 | 2 |
| cf) Tissue ID; Tissue type (1; BLCA[Bladder Urothelial Carcinoma], 2; BRCA[Breast invasive carcinoma], 3; CESC[Cervical squamous cell carcinoma and endocervical adenocarcinoma], 4; COAD[Colon adenocarcinoma], 5; GBM[Glioblastoma multiforme], 6; Glioma Low Grade, 7; HNSC[Head and Neck squamous cell carcinoma], 8; KICH[Kidney Chromophobe], 9; KIRC[Kidney renal clear cell carcinoma], 10; KIRP[Kidney renal papillary cell carcinoma], 11; LAML[Acute Myeloid Leukemia], 12; LUAD[Lung adenocarcinoma], 13; LUSC[Lung squamous cell carcinoma], 14; OV[Ovarian serous cystadenocarcinoma ], 15; PAAD[Pancreatic adenocarcinoma], 16; PRAD[Prostate adenocarcinoma], 17; SKCM[Skin Cutaneous Melanoma], 18:STAD[Stomach adenocarcinoma], 19:THCA[Thyroid carcinoma], 20:UCEC[Uterine Corpus Endometrial Carcinoma]) |
| Top |
| * We represented just top 10 SNVs. When you move the cursor on each content, you can see more deailed mutation information on the Tooltip. Those are primary_site, primary_histology, mutation(aa), pubmedID. |
| Genomic Position | Mutation(aa) | Unique sampleID count |
| chr6:31829855 | p.R294H | 2 |
| chr6:31827959 | p.L91L | 2 |
| chr6:31830546 | p.R208L | 1 |
| chr6:31828219 | p.G3V | 1 |
| chr6:31829147 | p.Q205K | 1 |
| chr6:31828261 | p.T401S | 1 |
| chr6:31829148 | p.D177G | 1 |
| chr6:31827543 | p.Y390Y | 1 |
| chr6:31828353 | p.W173C | 1 |
| chr6:31829215 | p.R357W | 1 |
| * Copy number data were extracted from TCGA using R package TCGA-Assembler. The URLs of all public data files on TCGA DCC data server were gathered on Jan-05-2015. Function ProcessCNAData in TCGA-Assembler package was used to obtain gene-level copy number value which is calculated as the average copy number of the genomic region of a gene. |
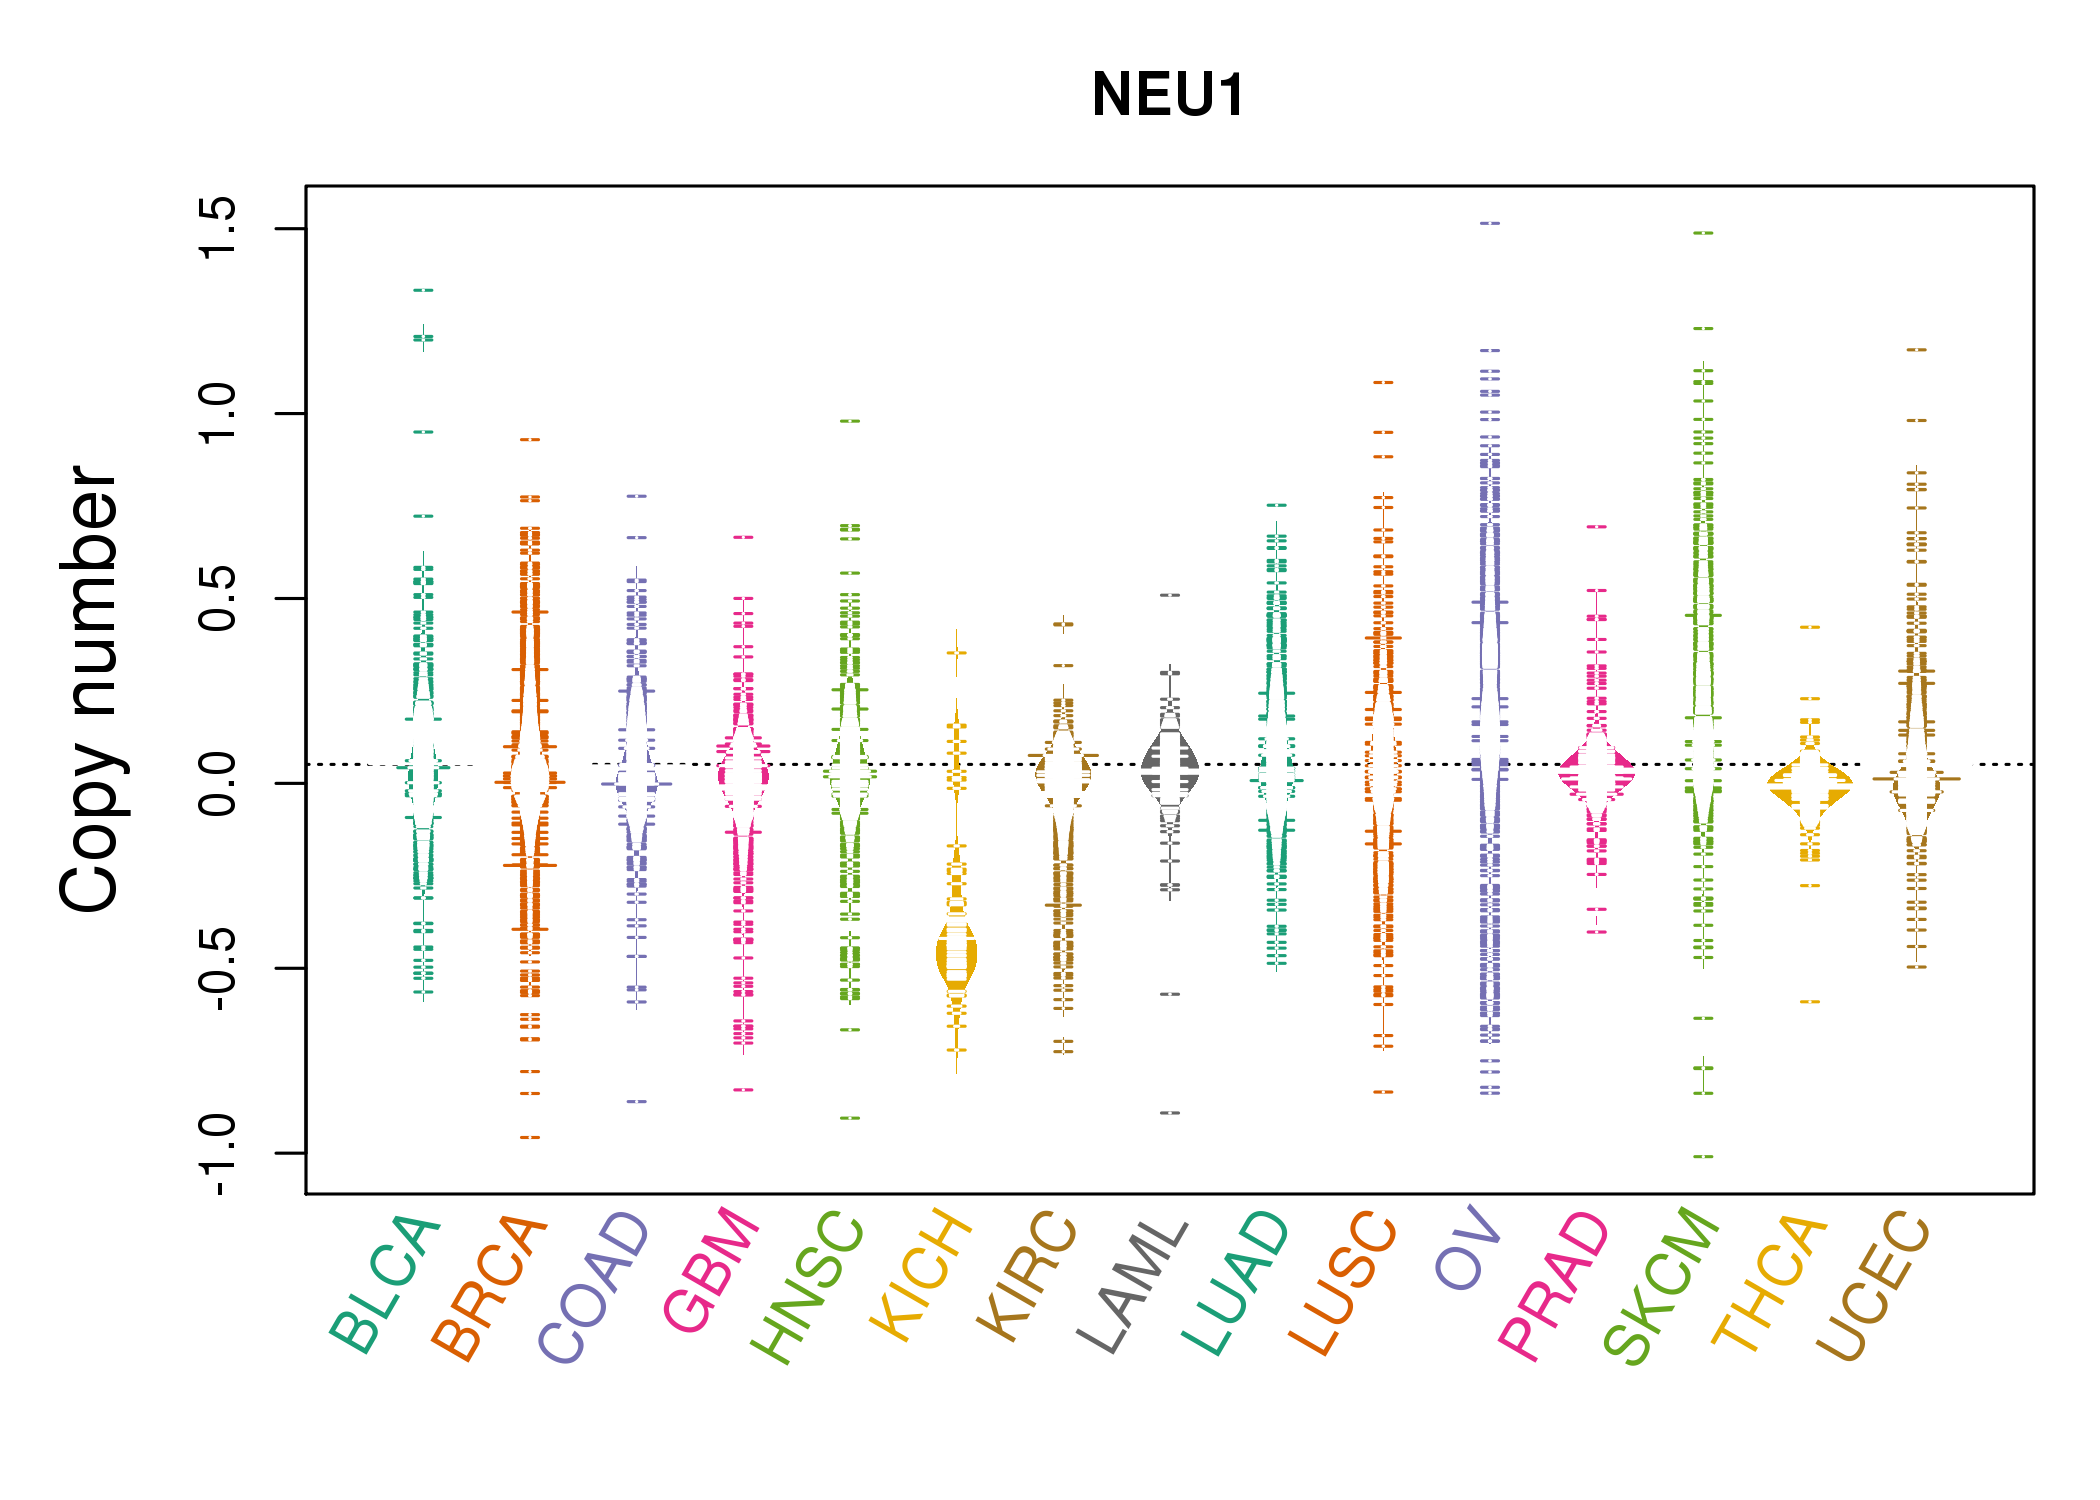 |
| cf) Tissue ID[Tissue type]: BLCA[Bladder Urothelial Carcinoma], BRCA[Breast invasive carcinoma], CESC[Cervical squamous cell carcinoma and endocervical adenocarcinoma], COAD[Colon adenocarcinoma], GBM[Glioblastoma multiforme], Glioma Low Grade, HNSC[Head and Neck squamous cell carcinoma], KICH[Kidney Chromophobe], KIRC[Kidney renal clear cell carcinoma], KIRP[Kidney renal papillary cell carcinoma], LAML[Acute Myeloid Leukemia], LUAD[Lung adenocarcinoma], LUSC[Lung squamous cell carcinoma], OV[Ovarian serous cystadenocarcinoma ], PAAD[Pancreatic adenocarcinoma], PRAD[Prostate adenocarcinoma], SKCM[Skin Cutaneous Melanoma], STAD[Stomach adenocarcinoma], THCA[Thyroid carcinoma], UCEC[Uterine Corpus Endometrial Carcinoma] |
| Top |
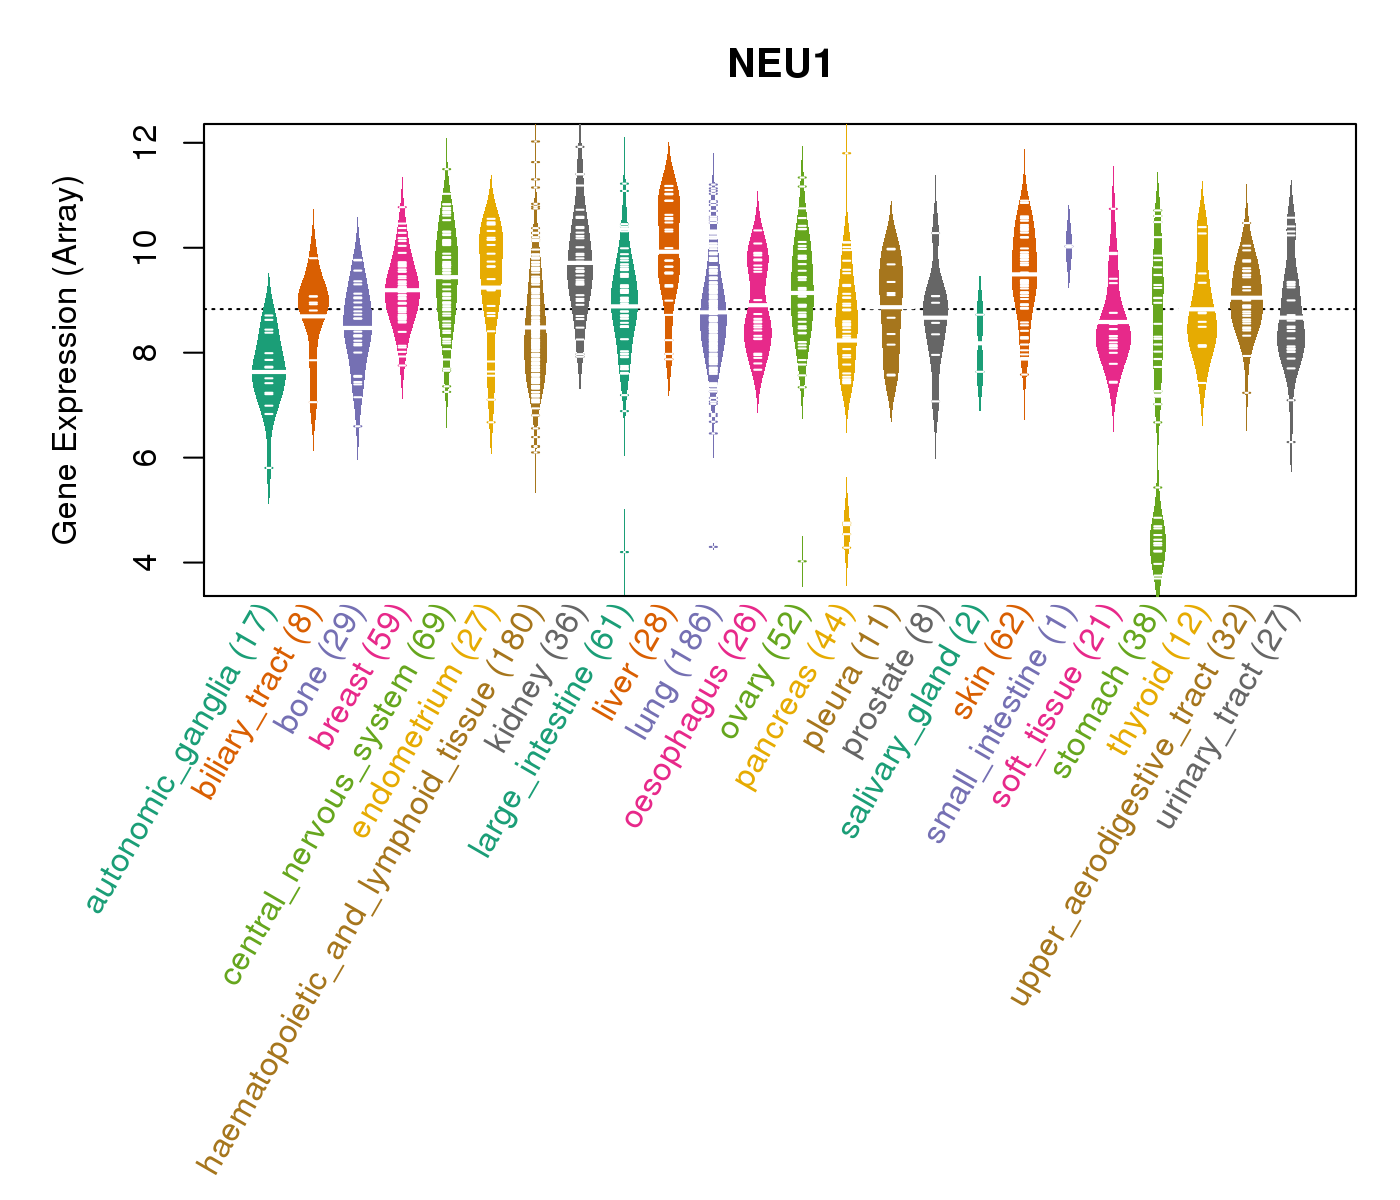
| Gene Expression for NEU1 |
| * CCLE gene expression data were extracted from CCLE_Expression_Entrez_2012-10-18.res: Gene-centric RMA-normalized mRNA expression data. |
 |
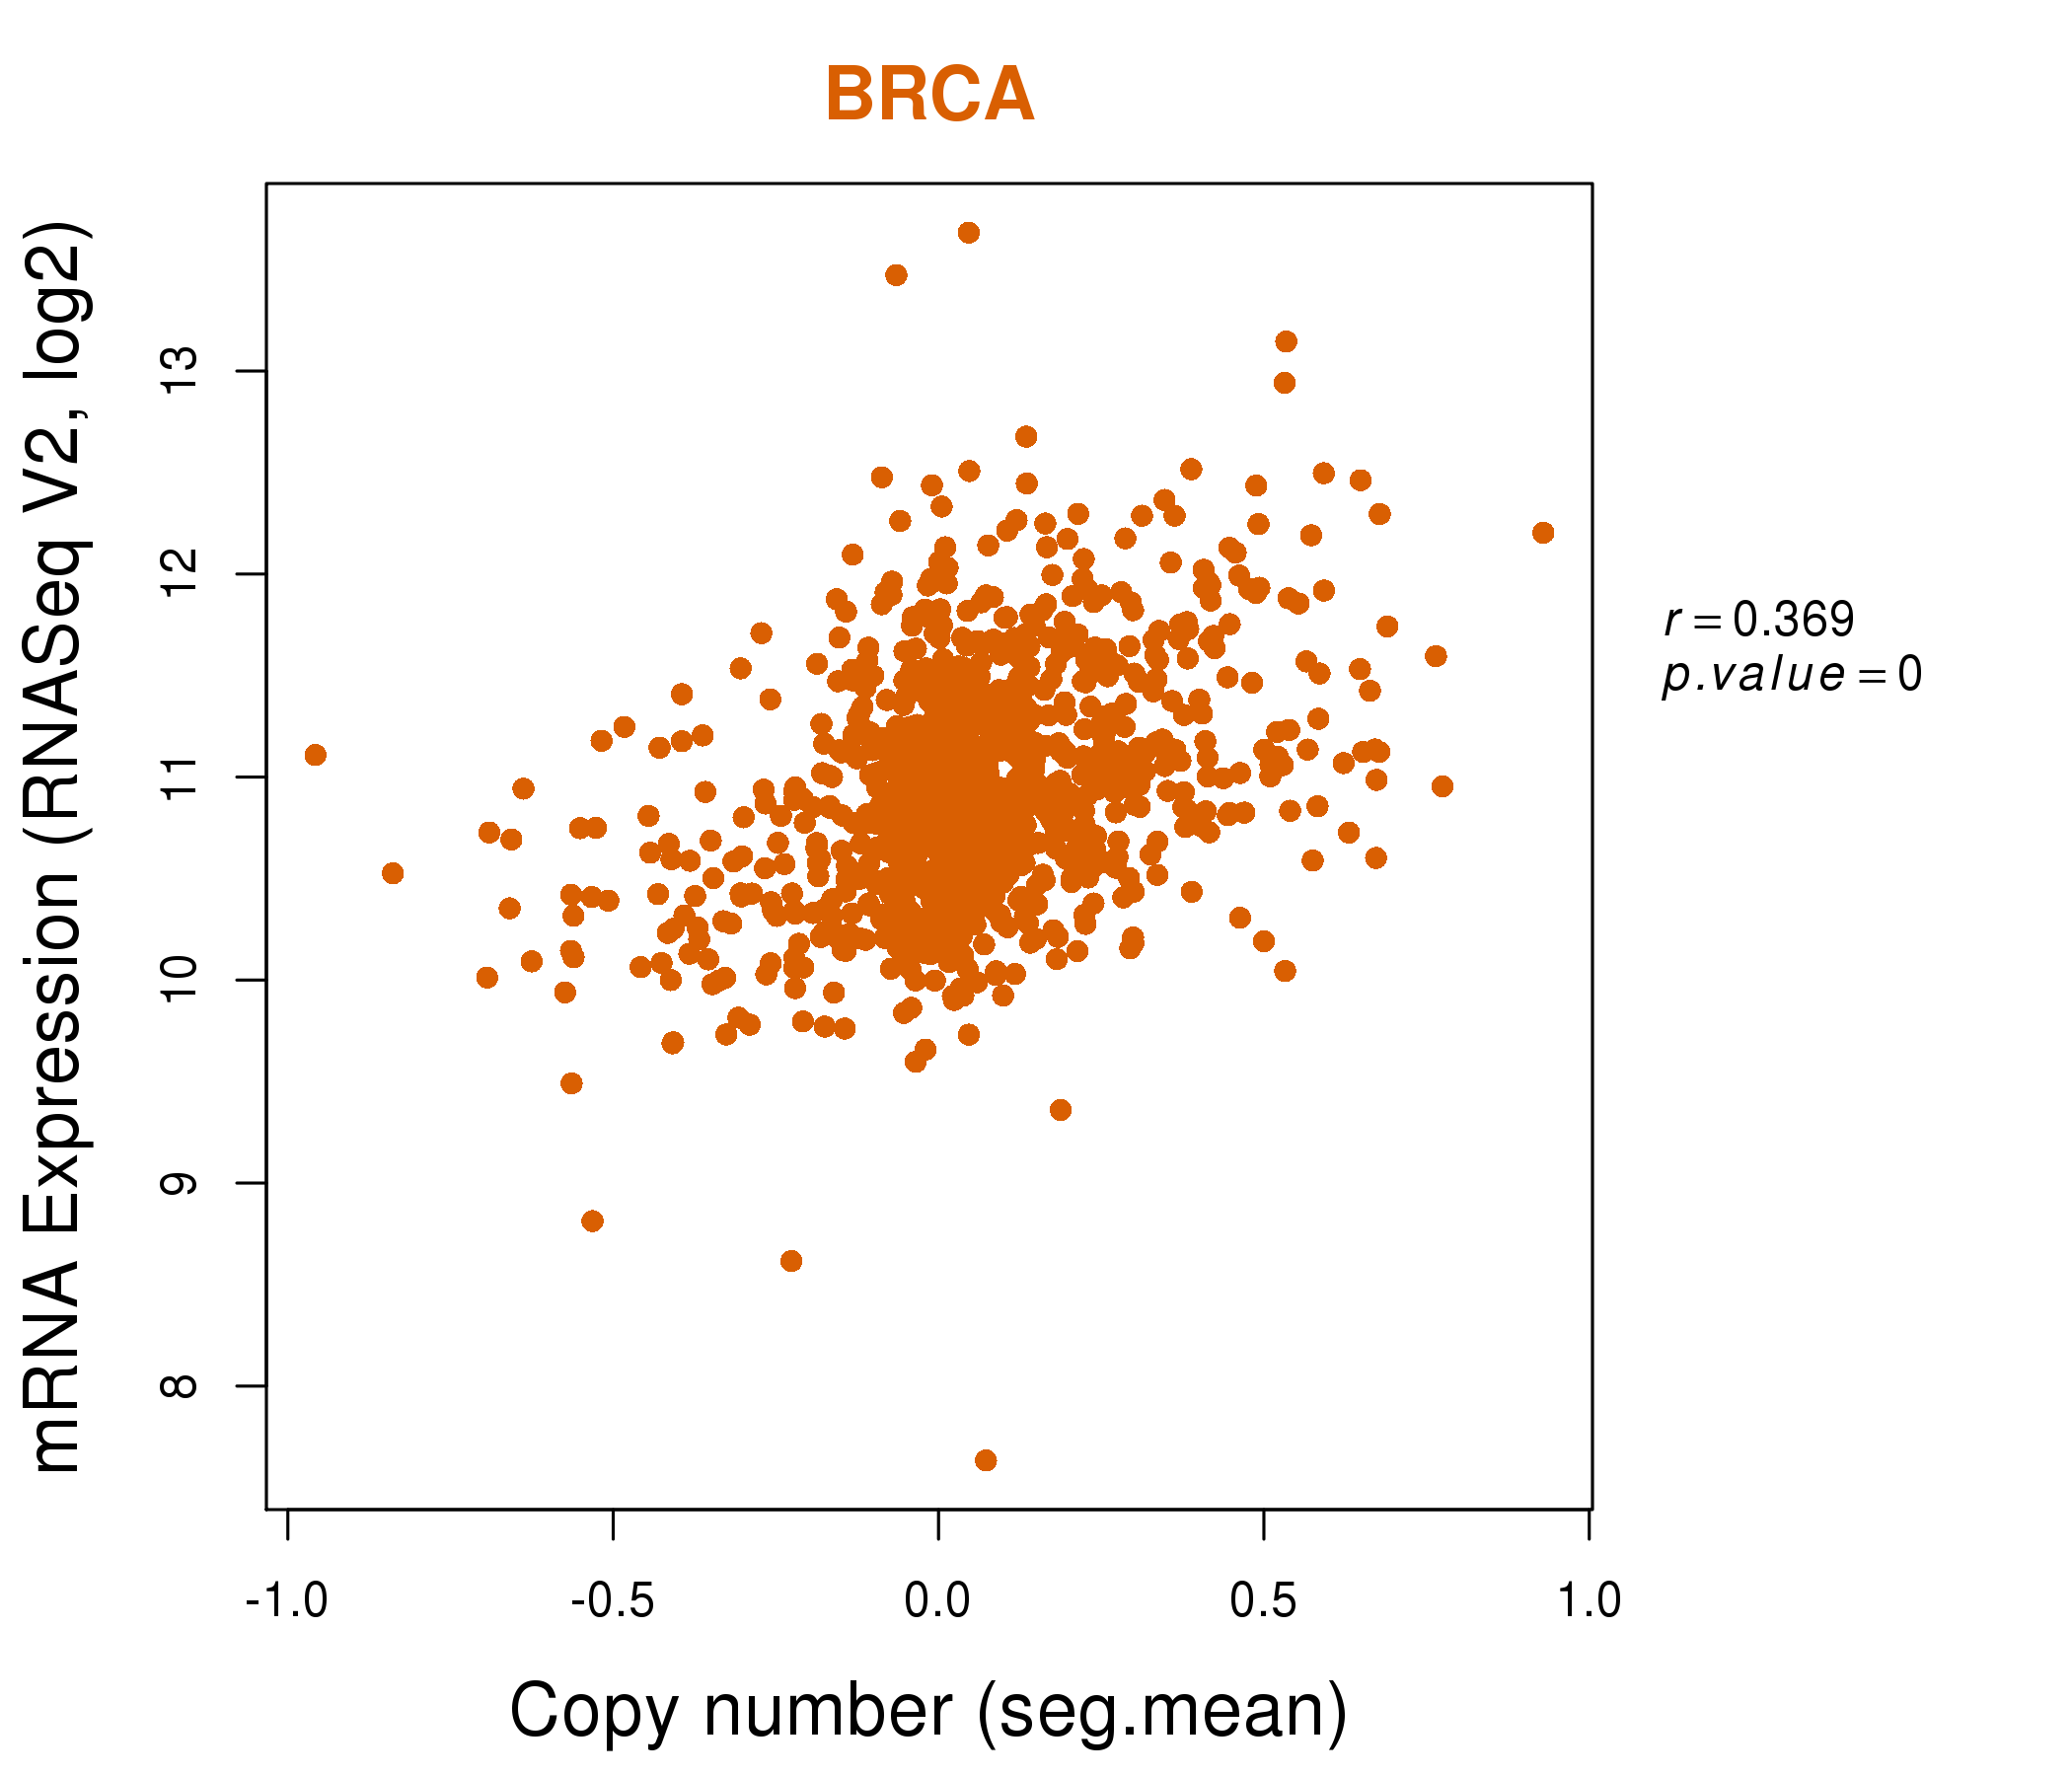
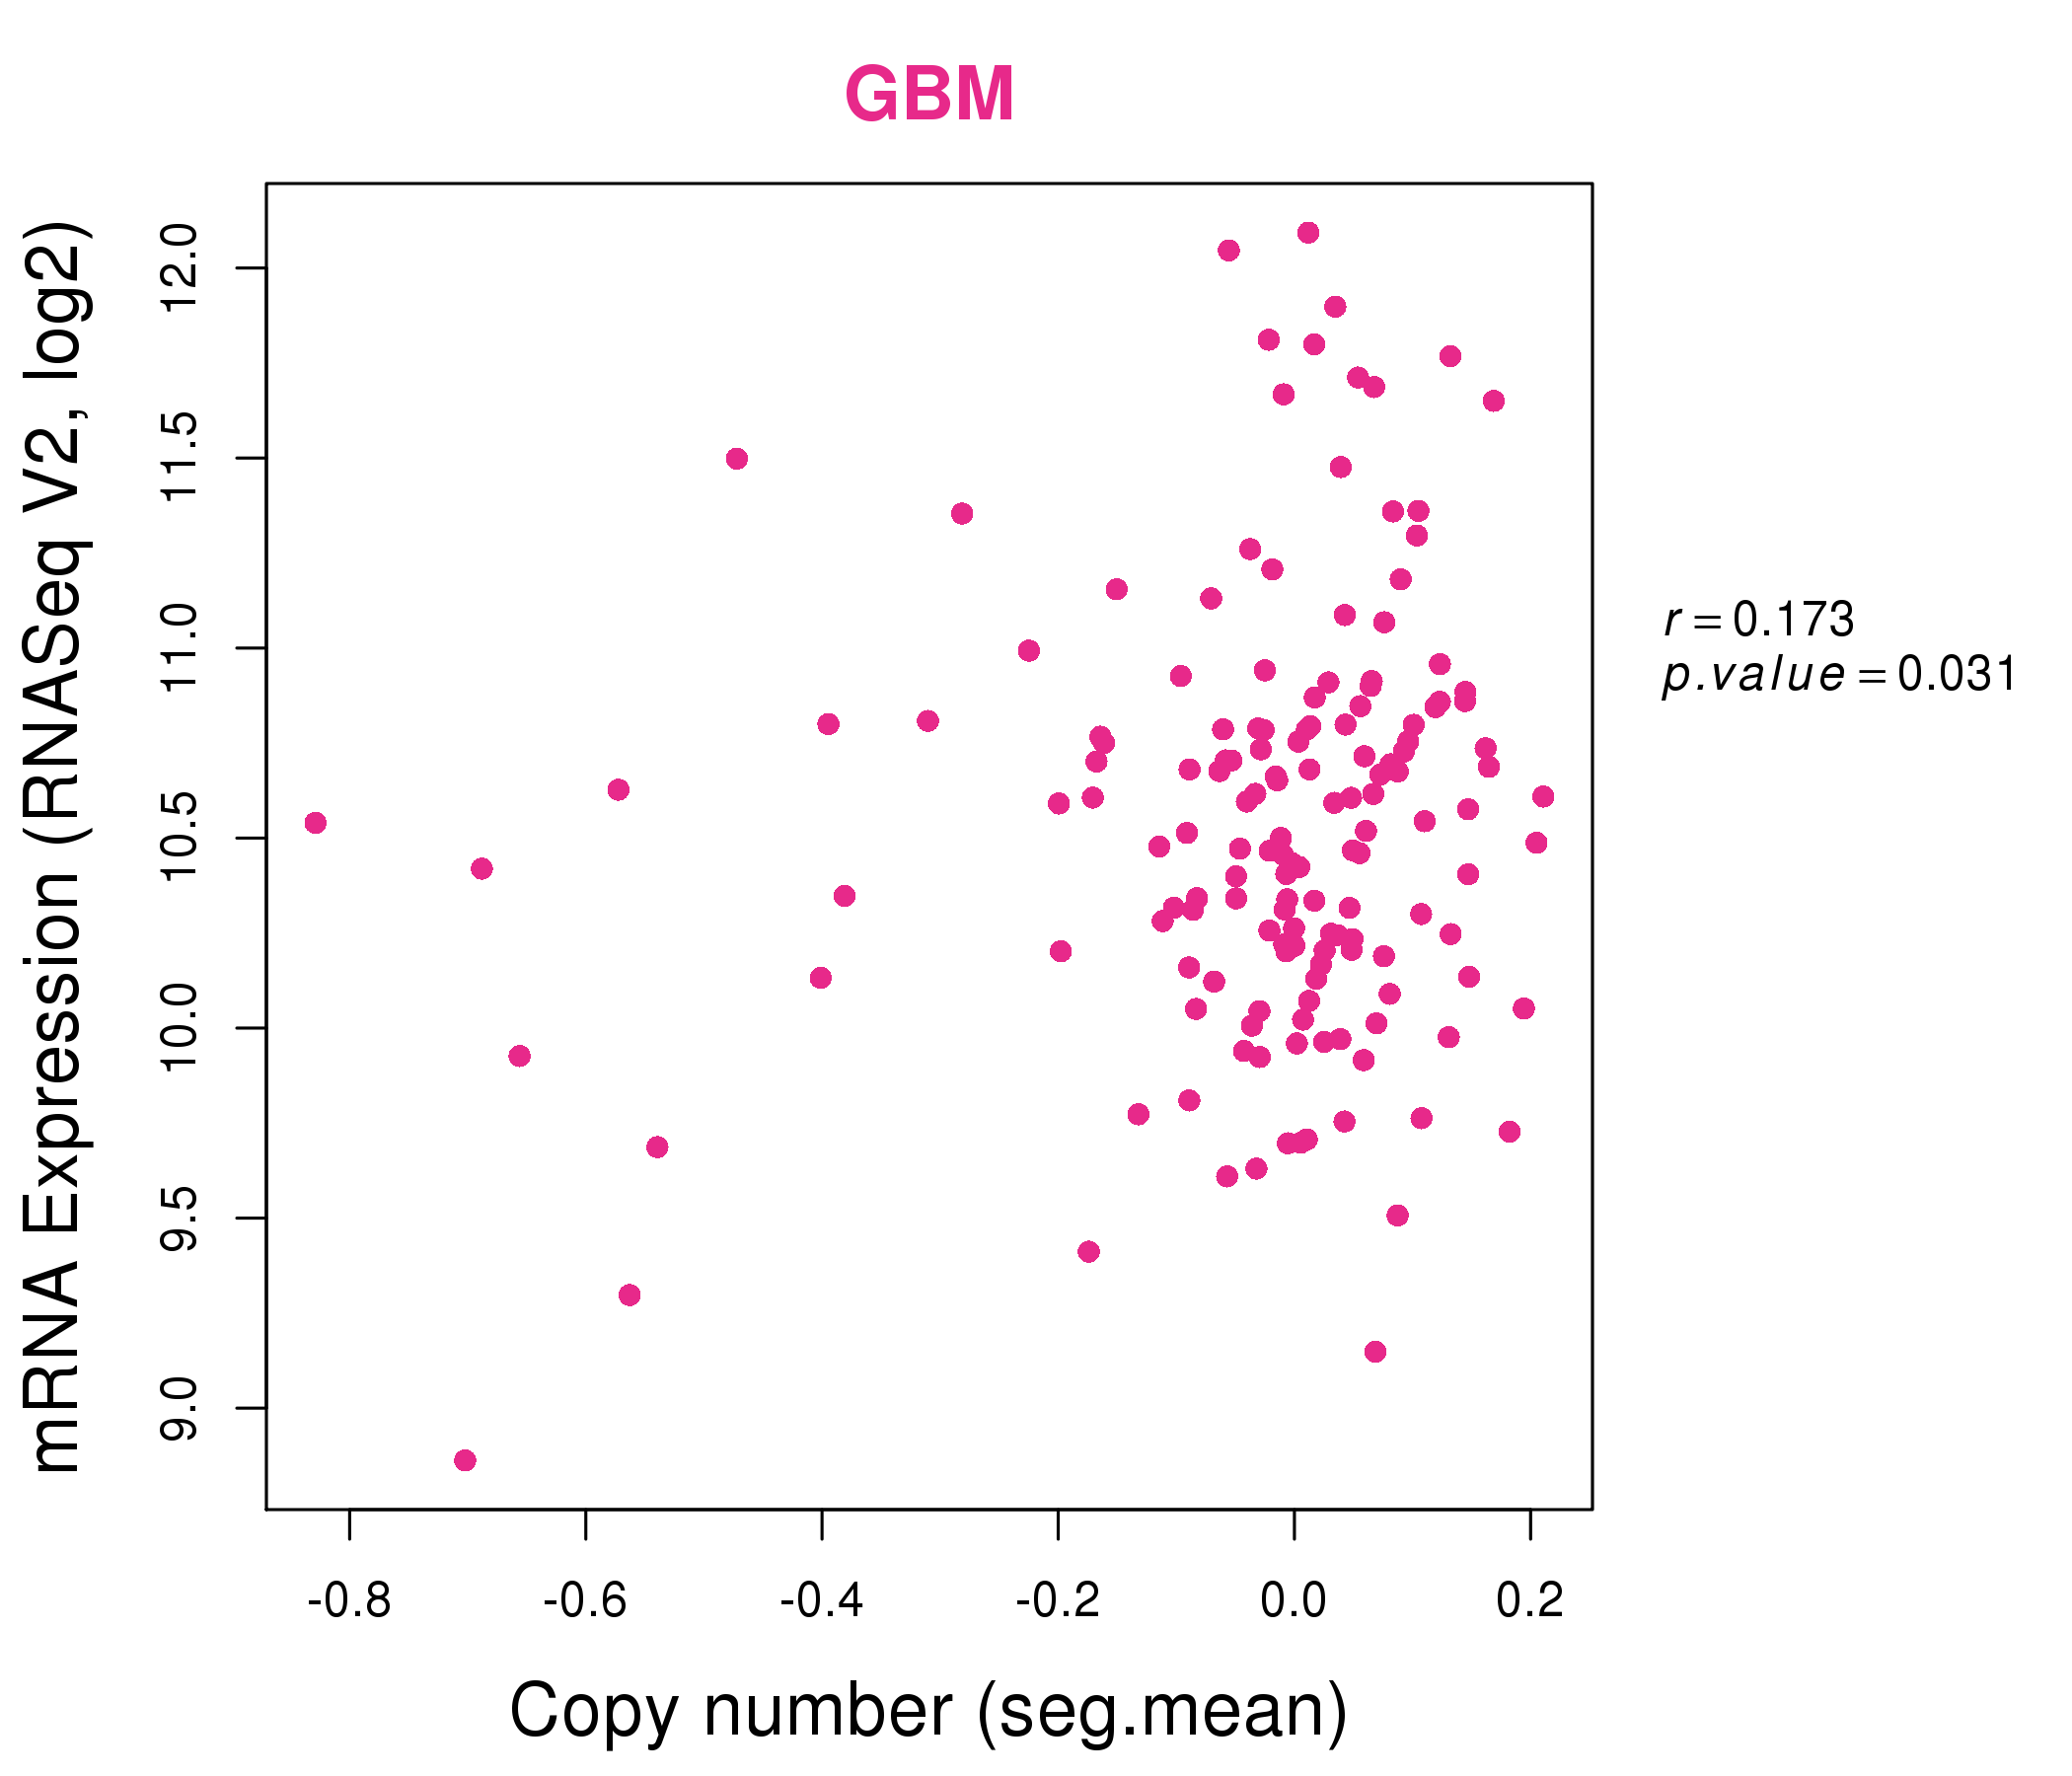
| * Normalized gene expression data of RNASeqV2 was extracted from TCGA using R package TCGA-Assembler. The URLs of all public data files on TCGA DCC data server were gathered at Jan-05-2015. Only eight cancer types have enough normal control samples for differential expression analysis. (t test, adjusted p<0.05 (using Benjamini-Hochberg FDR)) |
 |
| Top |
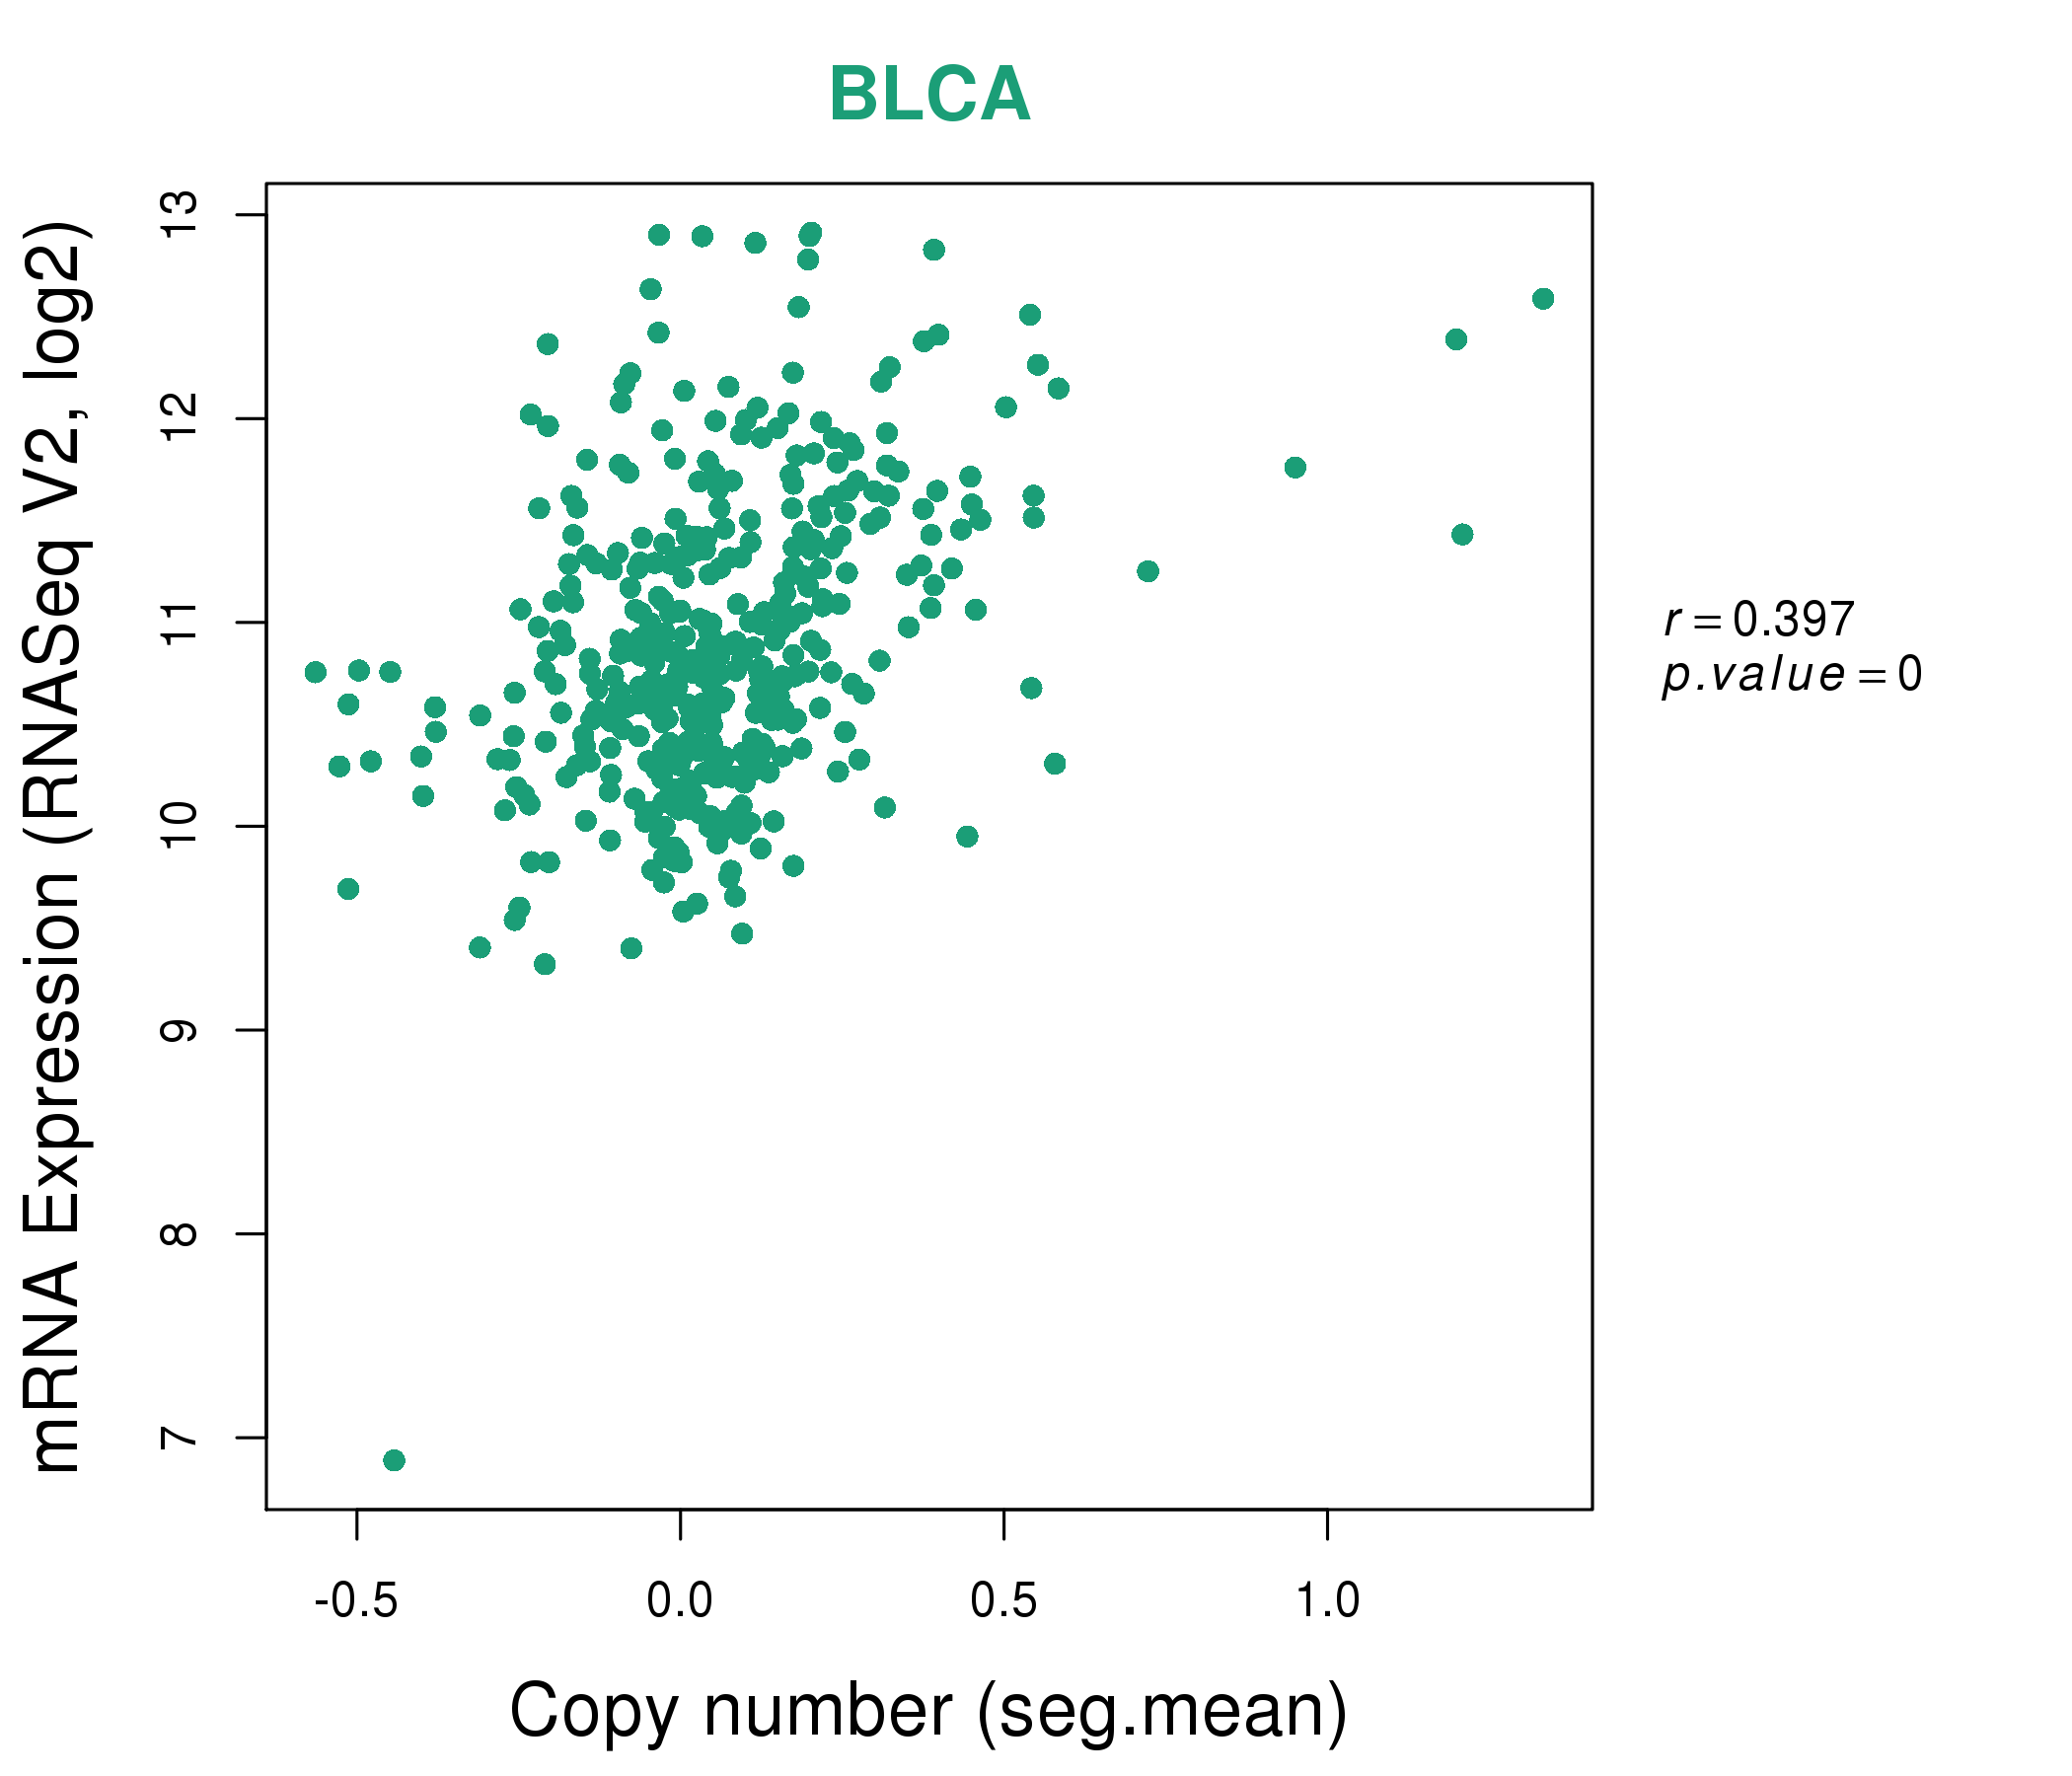
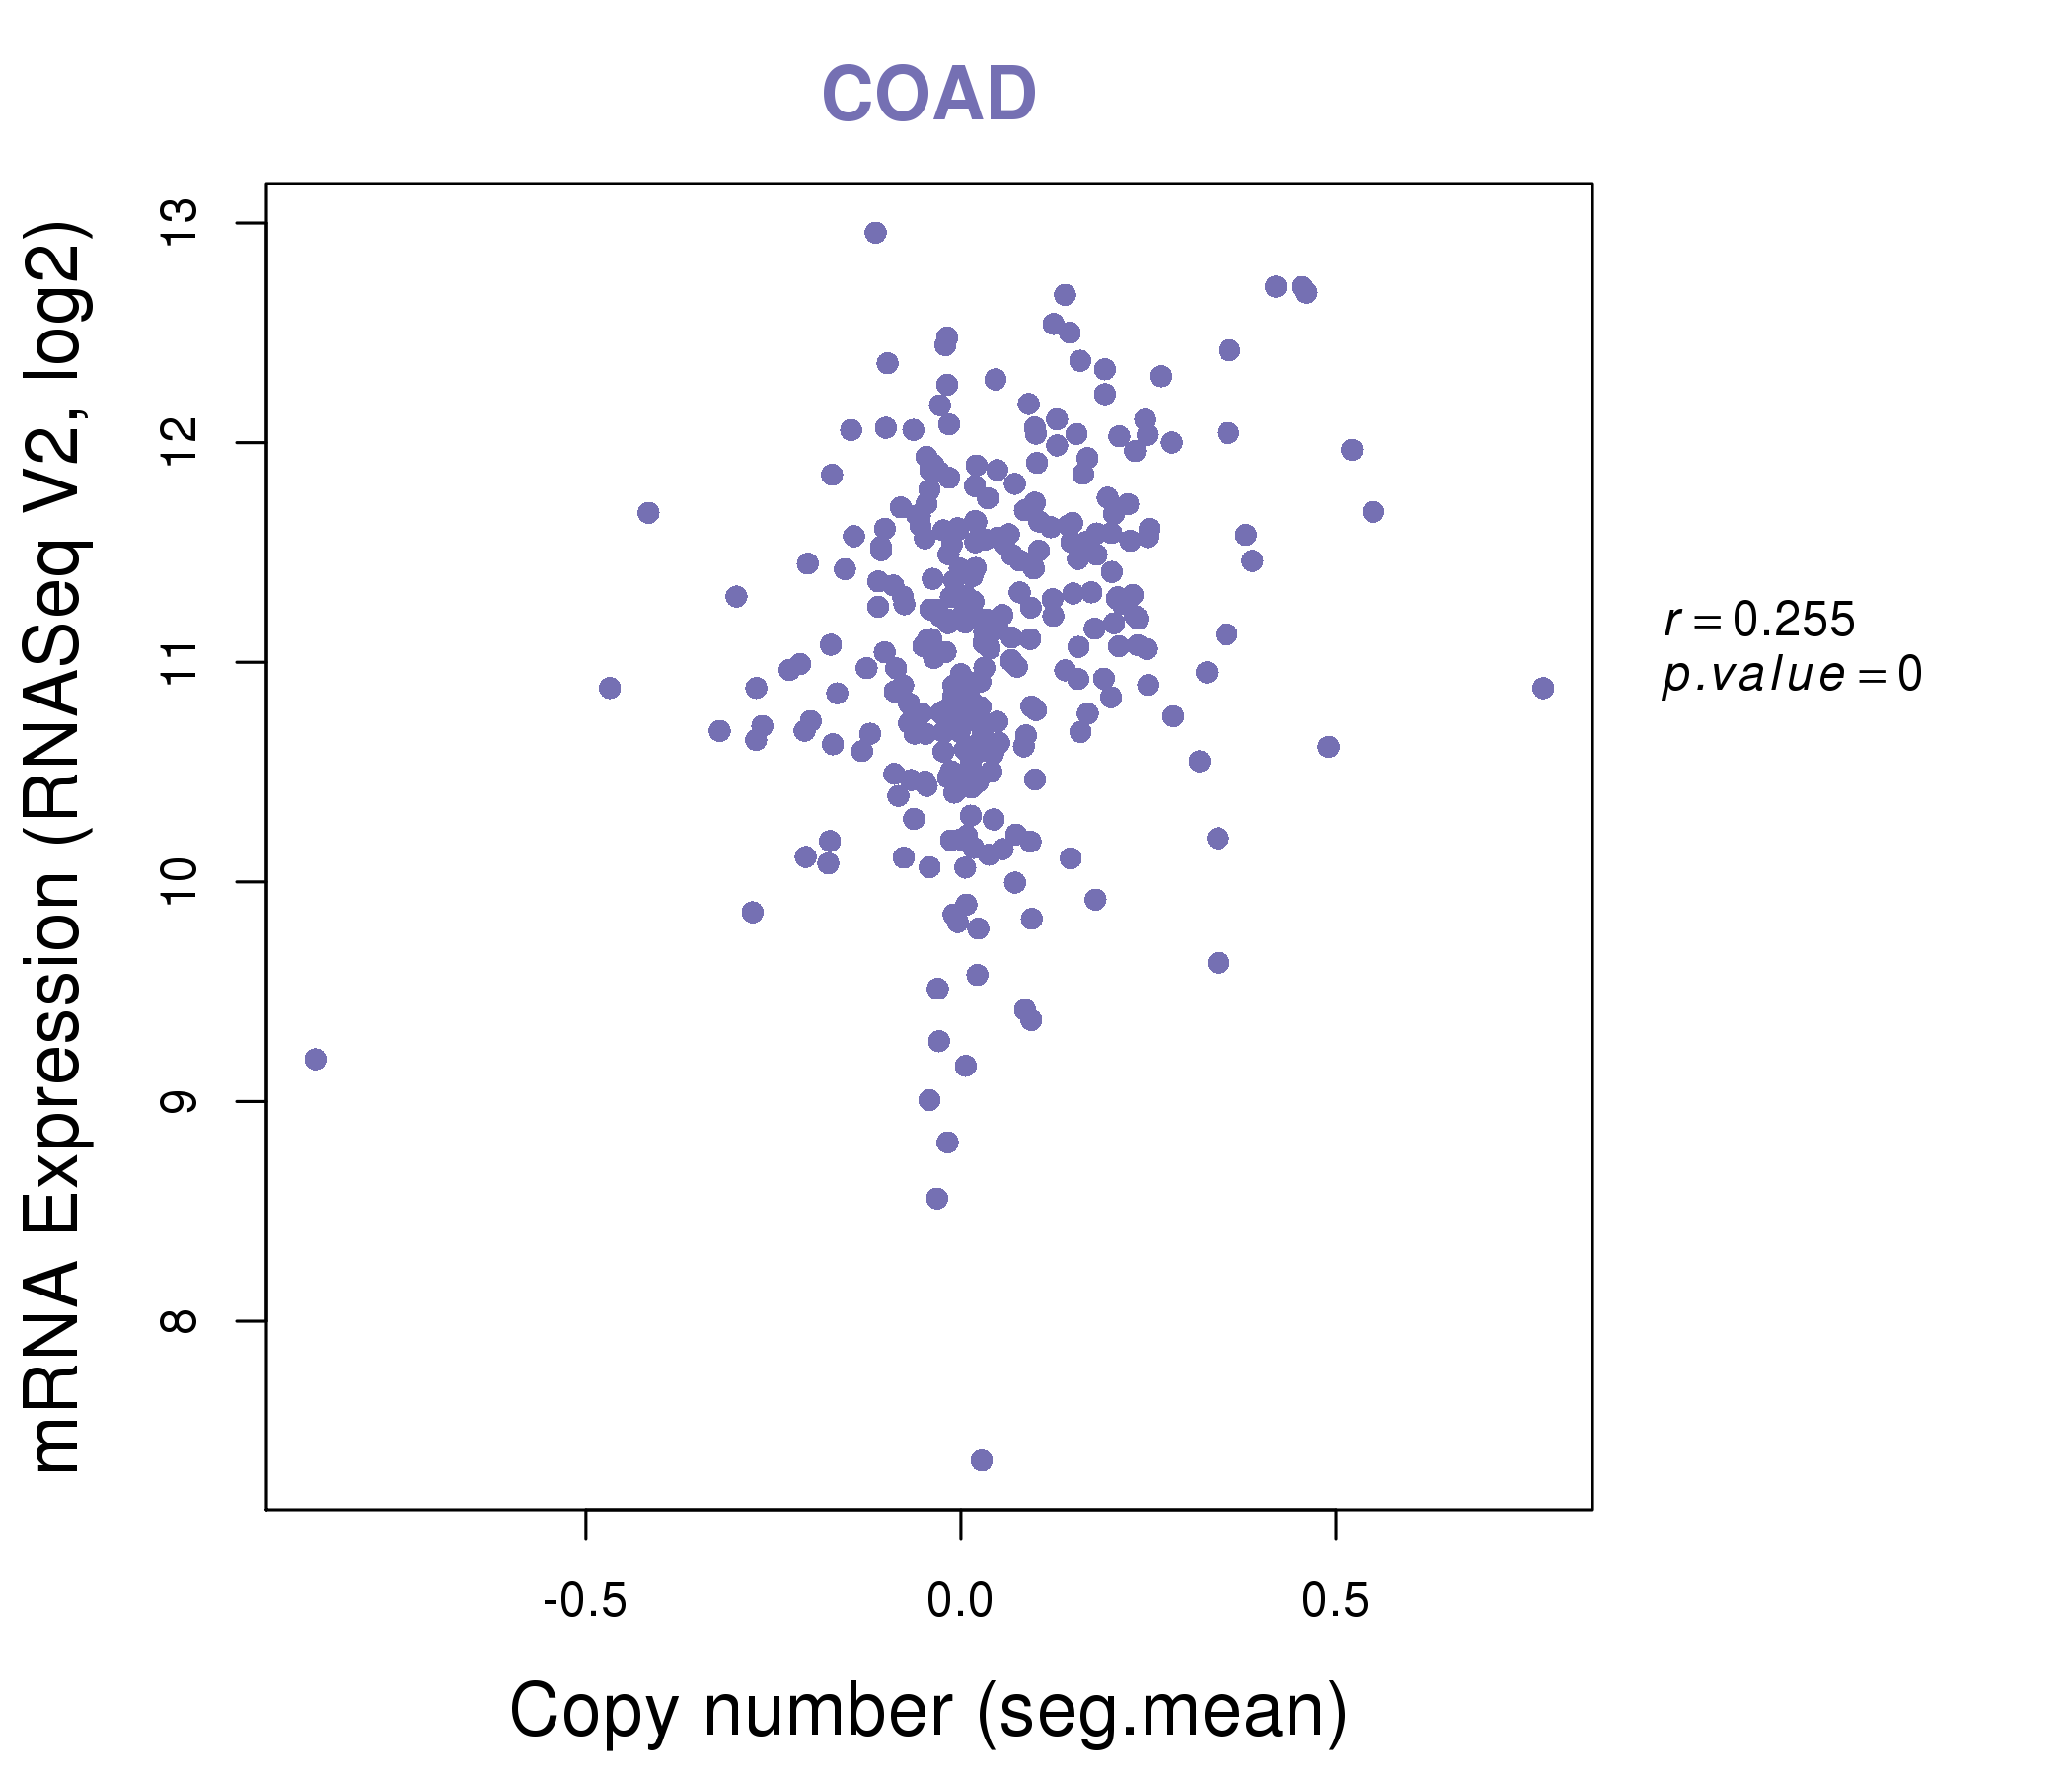
| * This plots show the correlation between CNV and gene expression. |
: Open all plots for all cancer types
 |
|
 |
|
| Top |
| Gene-Gene Network Information |
| * Co-Expression network figures were drawn using R package igraph. Only the top 20 genes with the highest correlations were shown. Red circle: input gene, orange circle: cell metabolism gene, sky circle: other gene |
: Open all plots for all cancer types
 |
| ||||
| B3GALT4,BAG6,GPANK1,ABHD16A,C6orf1,C6orf47,COA3, CUTA,FLOT1,HSD17B8,MRPS18B,NEU1,PPP1R11,NELFE, RNF5,RNF5P1,SKIV2L,SLC39A7,VPS52,YIPF3,ZNF165 | ATP6AP1,ATP6V0B,ATG101,CDK5,CLN3,COMMD5,LMAN2, NEU1,NMRAL1,PHF23,PPP4C,SDF2,SIGIRR,SLC25A39, SYNGR2,TEX264,TMEM141,TMEM205,TMEM54,VAMP8,VPS25 | ||||
 |
| ||||
| ACOT8,GID8,AAR2,RTFDC1,C6orf1,CHMP4B,CPNE1, DYNLRB1,EDEM2,EIF6,ERGIC3,GSS,HM13,LY6G6D, NEU1,PIGU,POFUT1,PSMA7,RALY,TP53RK,TRPC4AP | ACAA1,AMFR,APPL2,ASB13,B3GNT8,CHMP1A,FMO4, FTH1,GPR108,IFNGR2,IL10RB,LMBRD1,MARVELD3,NAAA, NEU1,P2RX4,PAFAH2,PNPLA1,SFXN1,SLC35D2,TPRG1L |
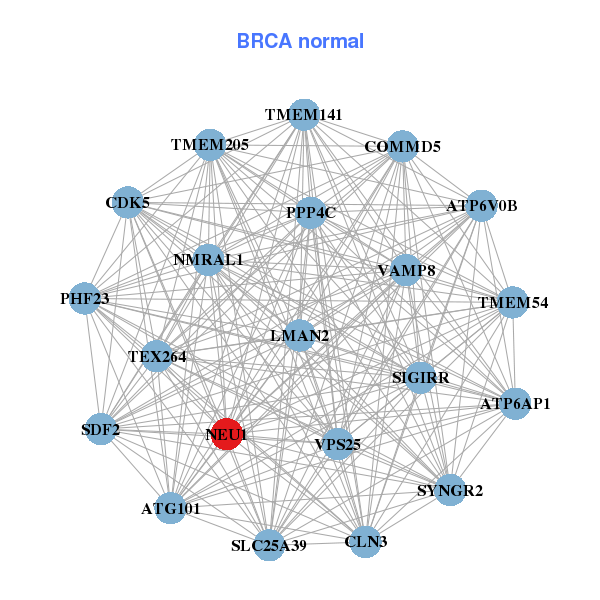

| * Co-Expression network figures were drawn using R package igraph. Only the top 20 genes with the highest correlations were shown. Red circle: input gene, orange circle: cell metabolism gene, sky circle: other gene |
: Open all plots for all cancer types
| Top |
: Open all interacting genes' information including KEGG pathway for all interacting genes from DAVID
| Top |
| Pharmacological Information for NEU1 |
| DB Category | DB Name | DB's ID and Url link |
| * Gene Centered Interaction Network. |
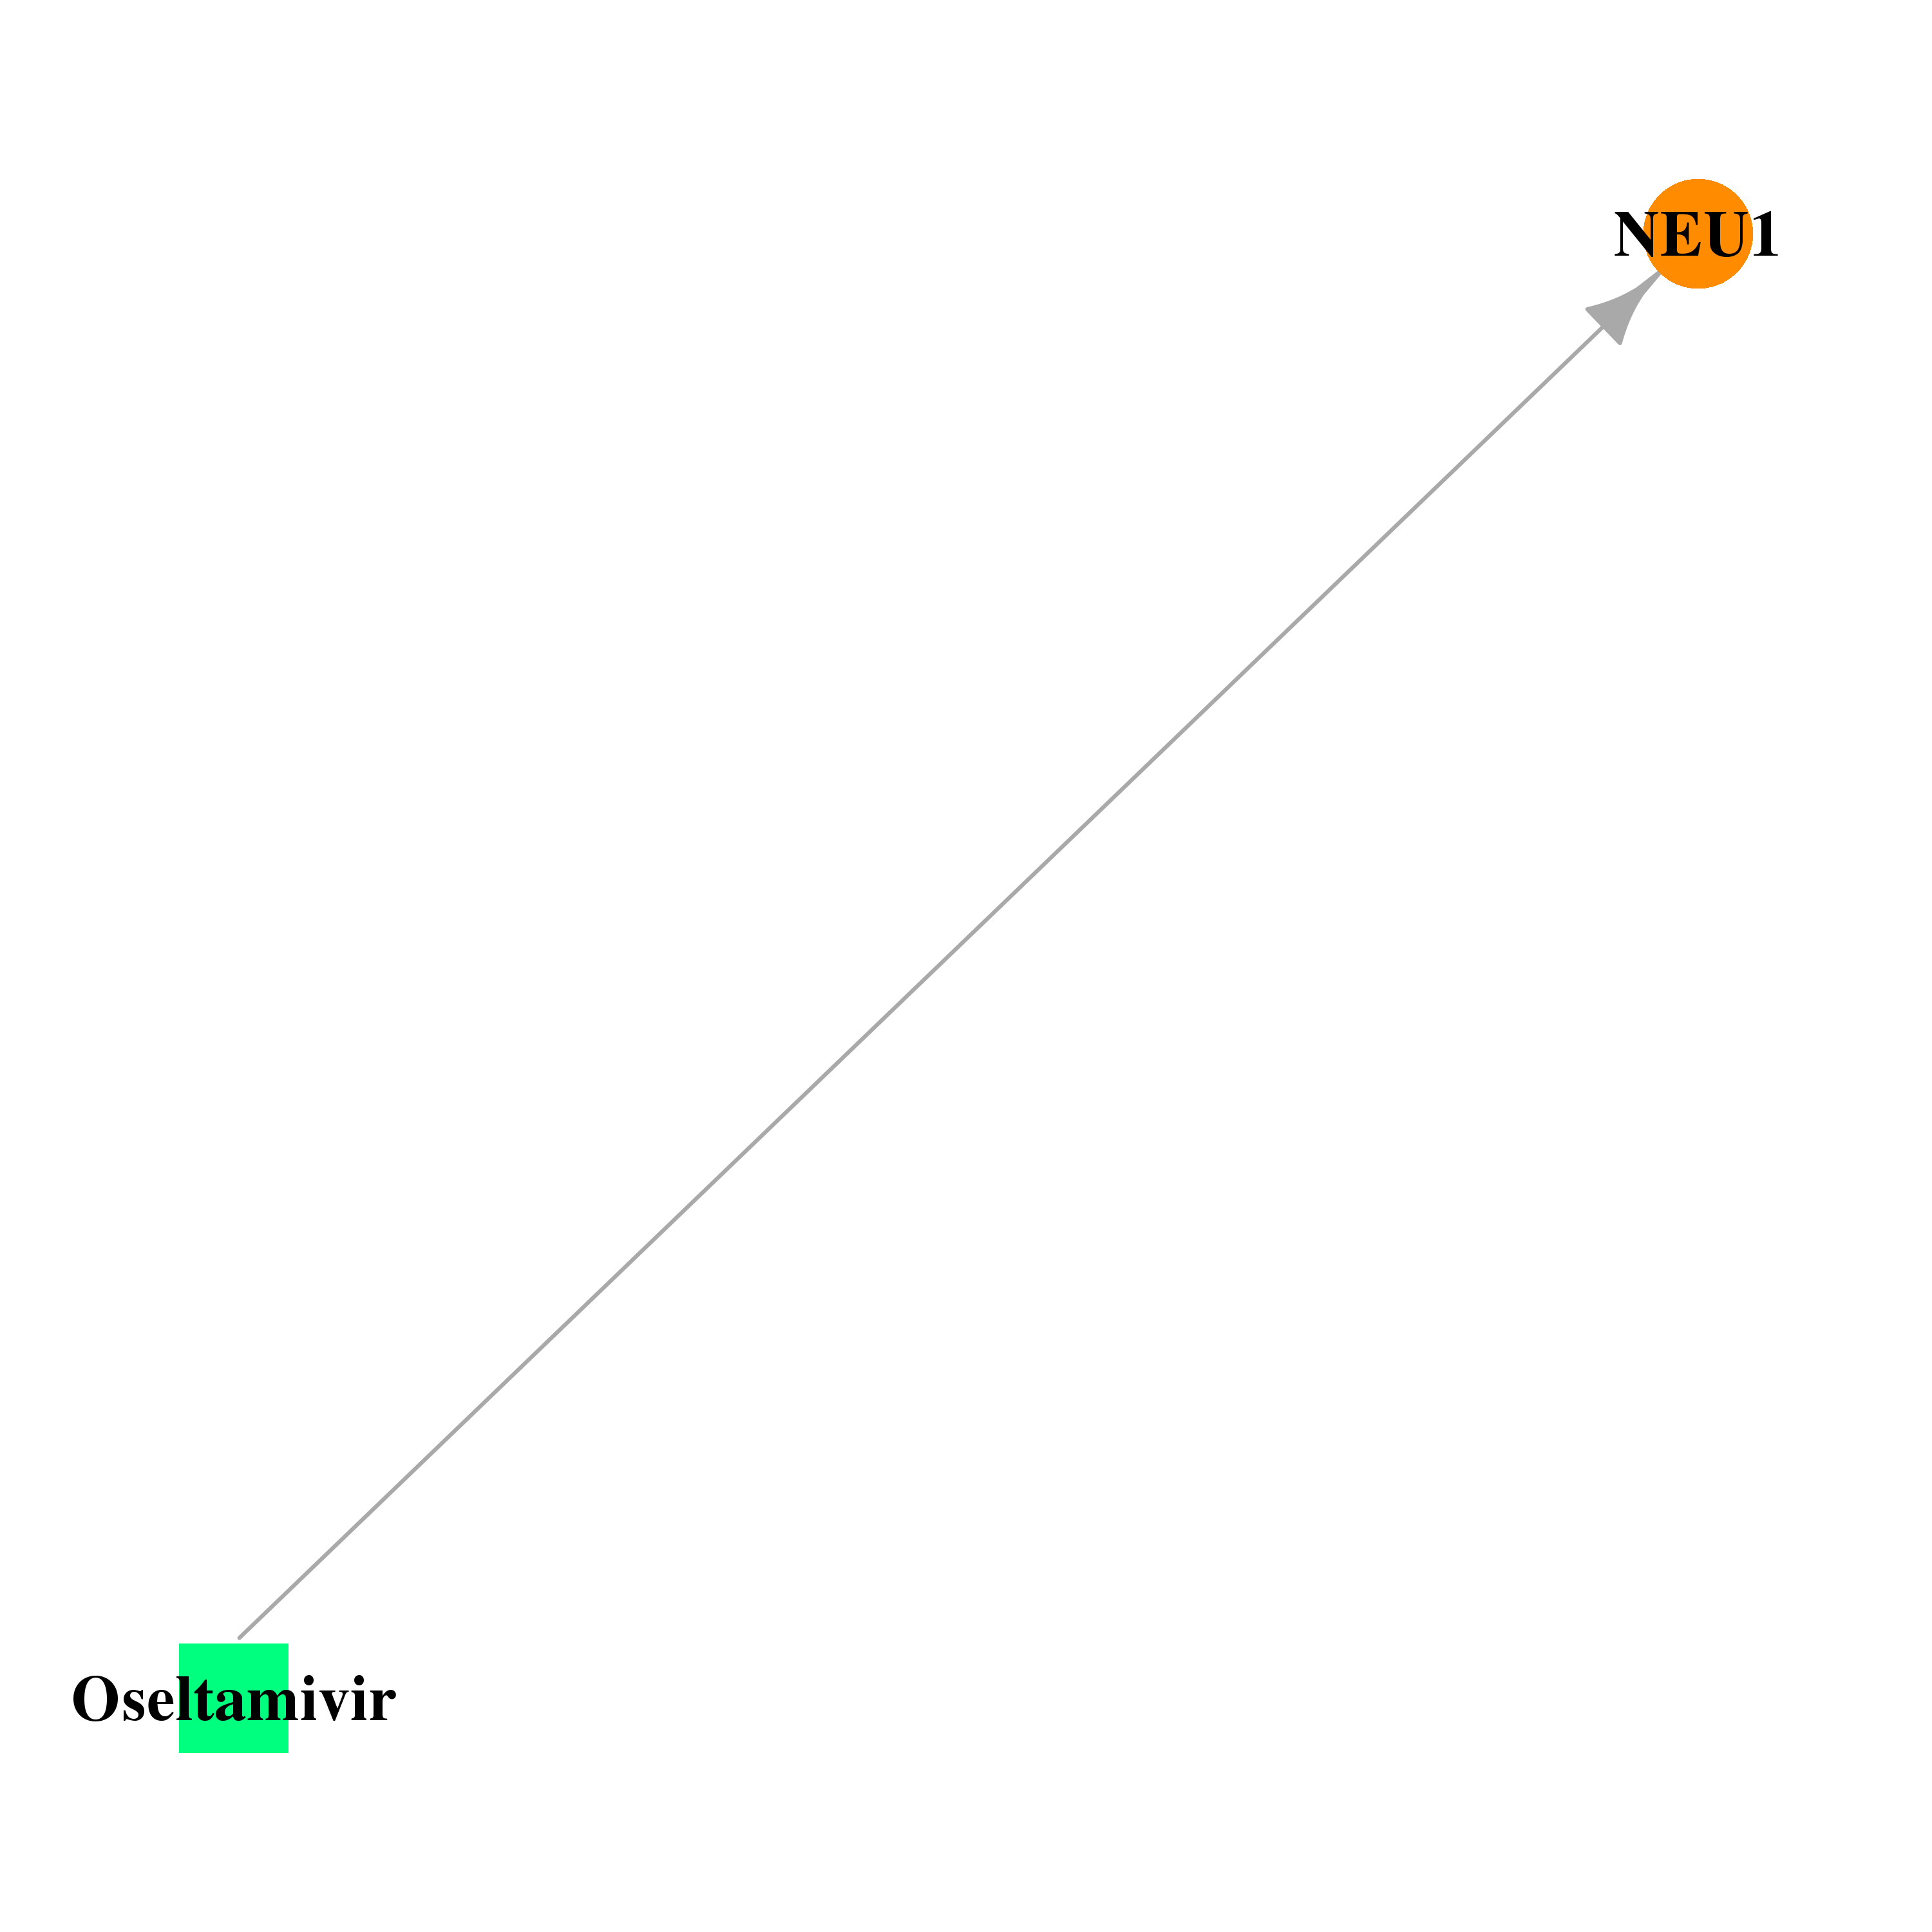 |
| * Drug Centered Interaction Network. |
| DrugBank ID | Target Name | Drug Groups | Generic Name | Drug Centered Network | Drug Structure |
| DB00198 | sialidase 1 (lysosomal sialidase) | approved | Oseltamivir | 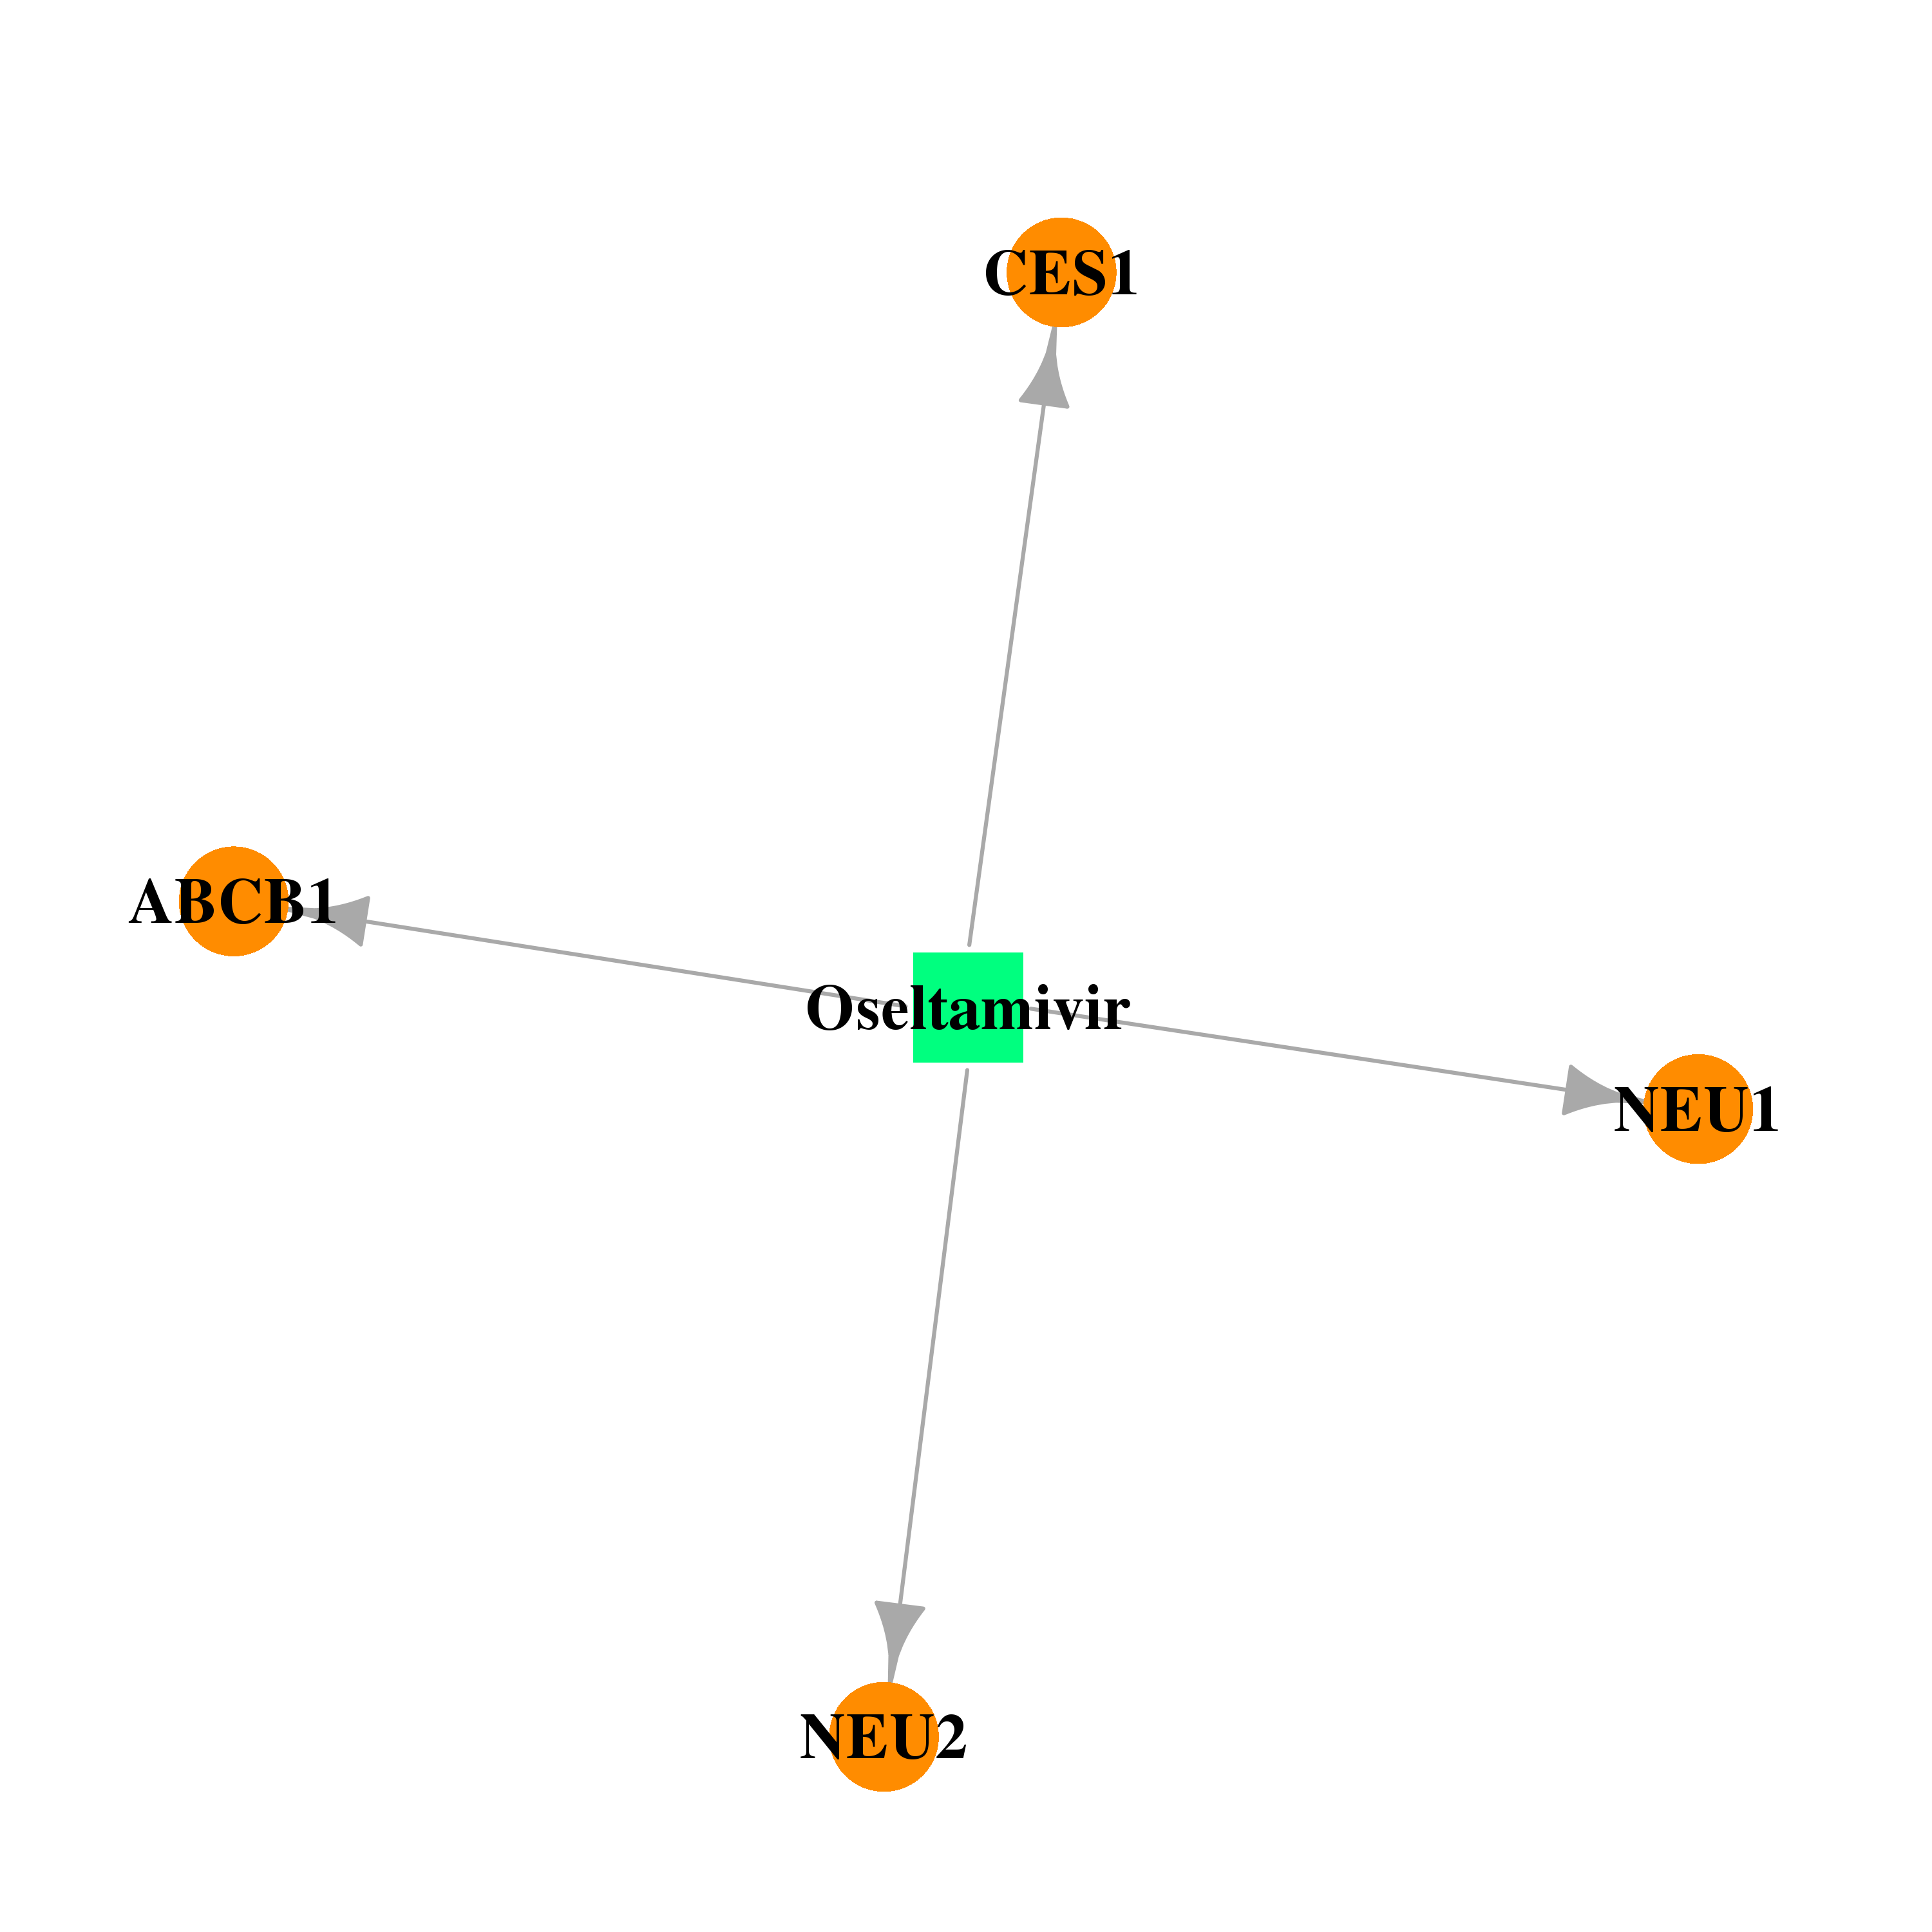 | 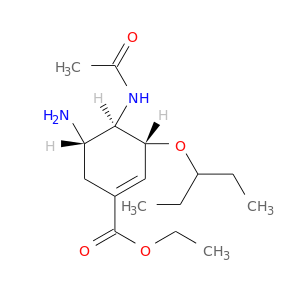 |
| Top |
| Cross referenced IDs for NEU1 |
| * We obtained these cross-references from Uniprot database. It covers 150 different DBs, 18 categories. http://www.uniprot.org/help/cross_references_section |
: Open all cross reference information
|
Copyright © 2016-Present - The Univsersity of Texas Health Science Center at Houston @ |