|
||||||||||||||||||||||||||||||||||||||||||||||||||||||||||||||||||||||||||||||||||||||||||||||||||||||||||||||||||||||||||||||||||||||||||||||||||||||||||||||||||||||||||||||||||||||||||||||||||||||||||||||||||||||||||||||||||||||||||||||||||||||||||||||||||||||||||||||||||||||||||||||||||||||||||||||||||||||||||
| |
| Phenotypic Information (metabolism pathway, cancer, disease, phenome) |
| |
| |
| Gene-Gene Network Information: Co-Expression Network, Interacting Genes & KEGG |
| |
|


| Gene Summary for ACO1 |
| Basic gene info. | Gene symbol | ACO1 |
| Gene name | aconitase 1, soluble | |
| Synonyms | ACONS|HEL60|IREB1|IREBP|IREBP1|IRP1 | |
| Cytomap | UCSC genome browser: 9p21.1 | |
| Genomic location | chr9 :32384600-32450832 | |
| Type of gene | protein-coding | |
| RefGenes | NM_001278352.1, NM_002197.2, | |
| Ensembl id | ENSG00000122729 | |
| Description | IRE-BP 1aconitate hydratase, cytoplasmiccitrate hydro-lyasecytoplasmic aconitate hydrataseepididymis luminal protein 60ferritin repressor proteiniron regulatory protein 1iron-responsive element binding protein 1iron-responsive element-binding prot | |
| Modification date | 20141207 | |
| dbXrefs | MIM : 100880 | |
| HGNC : HGNC | ||
| Ensembl : ENSG00000122729 | ||
| HPRD : 00013 | ||
| Vega : OTTHUMG00000019740 | ||
| Protein | UniProt: P21399 go to UniProt's Cross Reference DB Table | |
| Expression | CleanEX: HS_ACO1 | |
| BioGPS: 48 | ||
| Gene Expression Atlas: ENSG00000122729 | ||
| The Human Protein Atlas: ENSG00000122729 | ||
| Pathway | NCI Pathway Interaction Database: ACO1 | |
| KEGG: ACO1 | ||
| REACTOME: ACO1 | ||
| ConsensusPathDB | ||
| Pathway Commons: ACO1 | ||
| Metabolism | MetaCyc: ACO1 | |
| HUMANCyc: ACO1 | ||
| Regulation | Ensembl's Regulation: ENSG00000122729 | |
| miRBase: chr9 :32,384,600-32,450,832 | ||
| TargetScan: NM_001278352 | ||
| cisRED: ENSG00000122729 | ||
| Context | iHOP: ACO1 | |
| cancer metabolism search in PubMed: ACO1 | ||
| UCL Cancer Institute: ACO1 | ||
| Assigned class in ccmGDB | A - This gene has a literature evidence and it belongs to cancer gene. | |
| References showing role of ACO1 in cancer cell metabolism | 1. Wang W, Deng Z, Hatcher H, Miller LD, Di X, et al. (2014) IRP2 regulates breast tumor growth. Cancer Res 74: 497-507. doi: 10.1158/0008-5472.CAN-13-1224. pmid: 3989290. go to article 2. Chen G, Fillebeen C, Wang J, Pantopoulos K (2007) Overexpression of iron regulatory protein 1 suppresses growth of tumor xenografts. Carcinogenesis 28: 785-791. doi: 10.1093/carcin/bgl210. pmid: 2925110. go to article 3. Haro KJ, Sheth A, Scheinberg DA (2012) Dysregulation of IRP1-mediated iron metabolism causes gamma ray-specific radioresistance in leukemia cells. PLoS One 7: e48841. doi: 10.1371/journal.pone.0048841. pmid: 3498264. go to article 4. Jeong SM, Lee J, Finley LW, Schmidt PJ, Fleming MD, et al. (2015) SIRT3 regulates cellular iron metabolism and cancer growth by repressing iron regulatory protein 1. Oncogene 34: 2115-2124. doi: 10.1038/onc.2014.124. go to article 5. Tong WH, Sourbier C, Kovtunovych G, Jeong SY, Vira M, et al. (2011) The glycolytic shift in fumarate-hydratase-deficient kidney cancer lowers AMPK levels, increases anabolic propensities and lowers cellular iron levels. Cancer Cell 20: 315-327. doi: 10.1016/j.ccr.2011.07.018. pmid: 3174047 go to article | |
| Top |
| Phenotypic Information for ACO1(metabolism pathway, cancer, disease, phenome) |
| Cancer | CGAP: ACO1 |
| Familial Cancer Database: ACO1 | |
| * This gene is included in those cancer gene databases. |
|
|
|
|
|
|
| ||||||||||||||||||||||||||||||||||||||||||||||||||||||||||||||||||||||||||||||||||||||||||||||||||||||||||||||||||||||||||||||||||||||||||||||||||||||||||||||||||||||||||||||||||||||||||||||||||||||||||||||||||||||||||||||||||||||||||||||||||||||||||||||||||||||||||||||||||||||||||||||||||||||||||||||||||||
Oncogene 1 | Significant driver gene in MEL 6, | |||||||||||||||||||||||||||||||||||||||||||||||||||||||||||||||||||||||||||||||||||||||||||||||||||||||||||||||||||||||||||||||||||||||||||||||||||||||||||||||||||||||||||||||||||||||||||||||||||||||||||||||||||||||||||||||||||||||||||||||||||||||||||||||||||||||||||||||||||||||||||||||||||||||||||||||||||||||||
| cf) number; DB name 1 Oncogene; http://nar.oxfordjournals.org/content/35/suppl_1/D721.long, 2 Tumor Suppressor gene; https://bioinfo.uth.edu/TSGene/, 3 Cancer Gene Census; http://www.nature.com/nrc/journal/v4/n3/abs/nrc1299.html, 4 CancerGenes; http://nar.oxfordjournals.org/content/35/suppl_1/D721.long, 5 Network of Cancer Gene; http://ncg.kcl.ac.uk/index.php, 6 http://www.nature.com/nature/journal/v505/n7484/full/nature12912.html, 7Therapeutic Vulnerabilities in Cancer; http://cbio.mskcc.org/cancergenomics/statius/ |
| KEGG_GLYOXYLATE_AND_DICARBOXYLATE_METABOLISM | |
| OMIM | 100880; gene. |
| Orphanet | |
| Disease | KEGG Disease: ACO1 |
| MedGen: ACO1 (Human Medical Genetics with Condition) | |
| ClinVar: ACO1 | |
| Phenotype | MGI: ACO1 (International Mouse Phenotyping Consortium) |
| PhenomicDB: ACO1 | |
| Mutations for ACO1 |
| * Under tables are showing count per each tissue to give us broad intuition about tissue specific mutation patterns.You can go to the detailed page for each mutation database's web site. |
| There's no structural variation information in COSMIC data for this gene. |
| * From mRNA Sanger sequences, Chitars2.0 arranged chimeric transcripts. This table shows ACO1 related fusion information. |
| ID | Head Gene | Tail Gene | Accession | Gene_a | qStart_a | qEnd_a | Chromosome_a | tStart_a | tEnd_a | Gene_a | qStart_a | qEnd_a | Chromosome_a | tStart_a | tEnd_a |
| AA572951 | ACO1 | 7 | 97 | 9 | 32416358 | 32416448 | ACO1 | 93 | 605 | 9 | 32416441 | 32416953 | |
| BQ350502 | ACO1 | 12 | 158 | 9 | 32420969 | 32423408 | ACO1 | 154 | 679 | 9 | 32418128 | 32420990 | |
| Top |
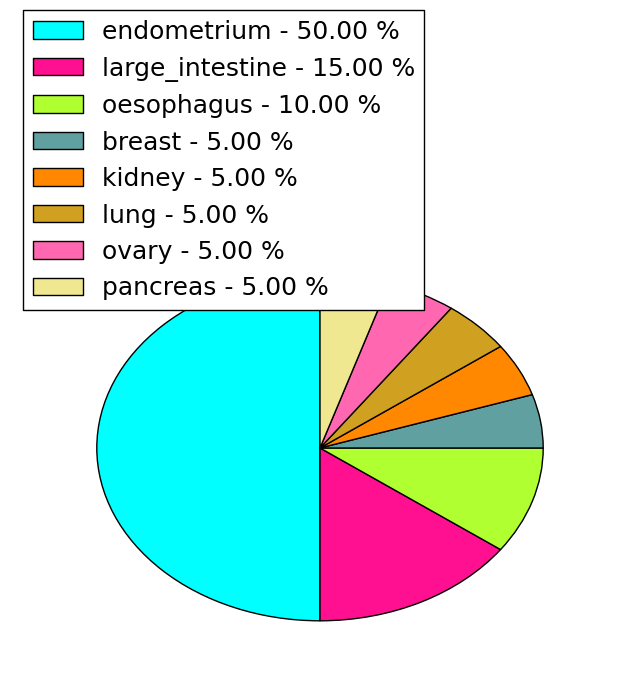
| Mutation type/ Tissue ID | brca | cns | cerv | endome | haematopo | kidn | Lintest | liver | lung | ns | ovary | pancre | prost | skin | stoma | thyro | urina | |||
| Total # sample | 3 | 1 | 1 | |||||||||||||||||
| GAIN (# sample) | 1 | |||||||||||||||||||
| LOSS (# sample) | 3 | 1 | 1 |
| cf) Tissue ID; Tissue type (1; Breast, 2; Central_nervous_system, 3; Cervix, 4; Endometrium, 5; Haematopoietic_and_lymphoid_tissue, 6; Kidney, 7; Large_intestine, 8; Liver, 9; Lung, 10; NS, 11; Ovary, 12; Pancreas, 13; Prostate, 14; Skin, 15; Stomach, 16; Thyroid, 17; Urinary_tract) |
| Top |
|
 |
| Top |
| Stat. for Non-Synonymous SNVs (# total SNVs=61) | (# total SNVs=20) |
 |  |
(# total SNVs=2) | (# total SNVs=2) |
 |  |
| Top |
| * When you move the cursor on each content, you can see more deailed mutation information on the Tooltip. Those are primary_site,primary_histology,mutation(aa),pubmedID. |
| GRCh37 position | Mutation(aa) | Unique sampleID count |
| chr9:32418371-32418371 | p.S174T | 3 |
| chr9:32450052-32450052 | p.L871L | 3 |
| chr9:32407360-32407360 | p.N67D | 2 |
| chr9:32407428-32407428 | p.? | 2 |
| chr9:32427421-32427421 | p.L491L | 2 |
| chr9:32424622-32424622 | p.S383A | 2 |
| chr9:32418455-32418455 | p.V202M | 2 |
| chr9:32405519-32405519 | p.F5F | 2 |
| chr9:32425910-32425910 | p.E421E | 2 |
| chr9:32419040-32419040 | p.V221V | 2 |
| Top |
|
 |
| Point Mutation/ Tissue ID | 1 | 2 | 3 | 4 | 5 | 6 | 7 | 8 | 9 | 10 | 11 | 12 | 13 | 14 | 15 | 16 | 17 | 18 | 19 | 20 |
| # sample | 2 | 3 | 2 | 9 | 1 | 5 | 6 | 1 | 6 | 2 | 1 | 1 | 5 | 7 | 21 | |||||
| # mutation | 2 | 3 | 2 | 11 | 1 | 6 | 6 | 1 | 6 | 2 | 1 | 1 | 4 | 8 | 25 | |||||
| nonsynonymous SNV | 1 | 2 | 2 | 9 | 1 | 6 | 5 | 1 | 4 | 2 | 1 | 1 | 2 | 7 | 15 | |||||
| synonymous SNV | 1 | 1 | 2 | 1 | 2 | 2 | 1 | 10 |
| cf) Tissue ID; Tissue type (1; BLCA[Bladder Urothelial Carcinoma], 2; BRCA[Breast invasive carcinoma], 3; CESC[Cervical squamous cell carcinoma and endocervical adenocarcinoma], 4; COAD[Colon adenocarcinoma], 5; GBM[Glioblastoma multiforme], 6; Glioma Low Grade, 7; HNSC[Head and Neck squamous cell carcinoma], 8; KICH[Kidney Chromophobe], 9; KIRC[Kidney renal clear cell carcinoma], 10; KIRP[Kidney renal papillary cell carcinoma], 11; LAML[Acute Myeloid Leukemia], 12; LUAD[Lung adenocarcinoma], 13; LUSC[Lung squamous cell carcinoma], 14; OV[Ovarian serous cystadenocarcinoma ], 15; PAAD[Pancreatic adenocarcinoma], 16; PRAD[Prostate adenocarcinoma], 17; SKCM[Skin Cutaneous Melanoma], 18:STAD[Stomach adenocarcinoma], 19:THCA[Thyroid carcinoma], 20:UCEC[Uterine Corpus Endometrial Carcinoma]) |
| Top |
| * We represented just top 10 SNVs. When you move the cursor on each content, you can see more deailed mutation information on the Tooltip. Those are primary_site, primary_histology, mutation(aa), pubmedID. |
| Genomic Position | Mutation(aa) | Unique sampleID count |
| chr9:32424622 | p.S38L,ACO1 | 2 |
| chr9:32405519 | p.G448R,ACO1 | 2 |
| chr9:32418455 | p.V202M,ACO1 | 2 |
| chr9:32407274 | p.V221V,ACO1 | 2 |
| chr9:32419040 | p.S383P,ACO1 | 2 |
| chr9:32425989 | p.F5F,ACO1 | 2 |
| chr9:32423377 | p.D292N,ACO1 | 1 |
| chr9:32436254 | p.T420T,ACO1 | 1 |
| chr9:32408522 | p.L633Q,ACO1 | 1 |
| chr9:32427336 | p.V752E,ACO1 | 1 |
| * Copy number data were extracted from TCGA using R package TCGA-Assembler. The URLs of all public data files on TCGA DCC data server were gathered on Jan-05-2015. Function ProcessCNAData in TCGA-Assembler package was used to obtain gene-level copy number value which is calculated as the average copy number of the genomic region of a gene. |
 |
| cf) Tissue ID[Tissue type]: BLCA[Bladder Urothelial Carcinoma], BRCA[Breast invasive carcinoma], CESC[Cervical squamous cell carcinoma and endocervical adenocarcinoma], COAD[Colon adenocarcinoma], GBM[Glioblastoma multiforme], Glioma Low Grade, HNSC[Head and Neck squamous cell carcinoma], KICH[Kidney Chromophobe], KIRC[Kidney renal clear cell carcinoma], KIRP[Kidney renal papillary cell carcinoma], LAML[Acute Myeloid Leukemia], LUAD[Lung adenocarcinoma], LUSC[Lung squamous cell carcinoma], OV[Ovarian serous cystadenocarcinoma ], PAAD[Pancreatic adenocarcinoma], PRAD[Prostate adenocarcinoma], SKCM[Skin Cutaneous Melanoma], STAD[Stomach adenocarcinoma], THCA[Thyroid carcinoma], UCEC[Uterine Corpus Endometrial Carcinoma] |
| Top |
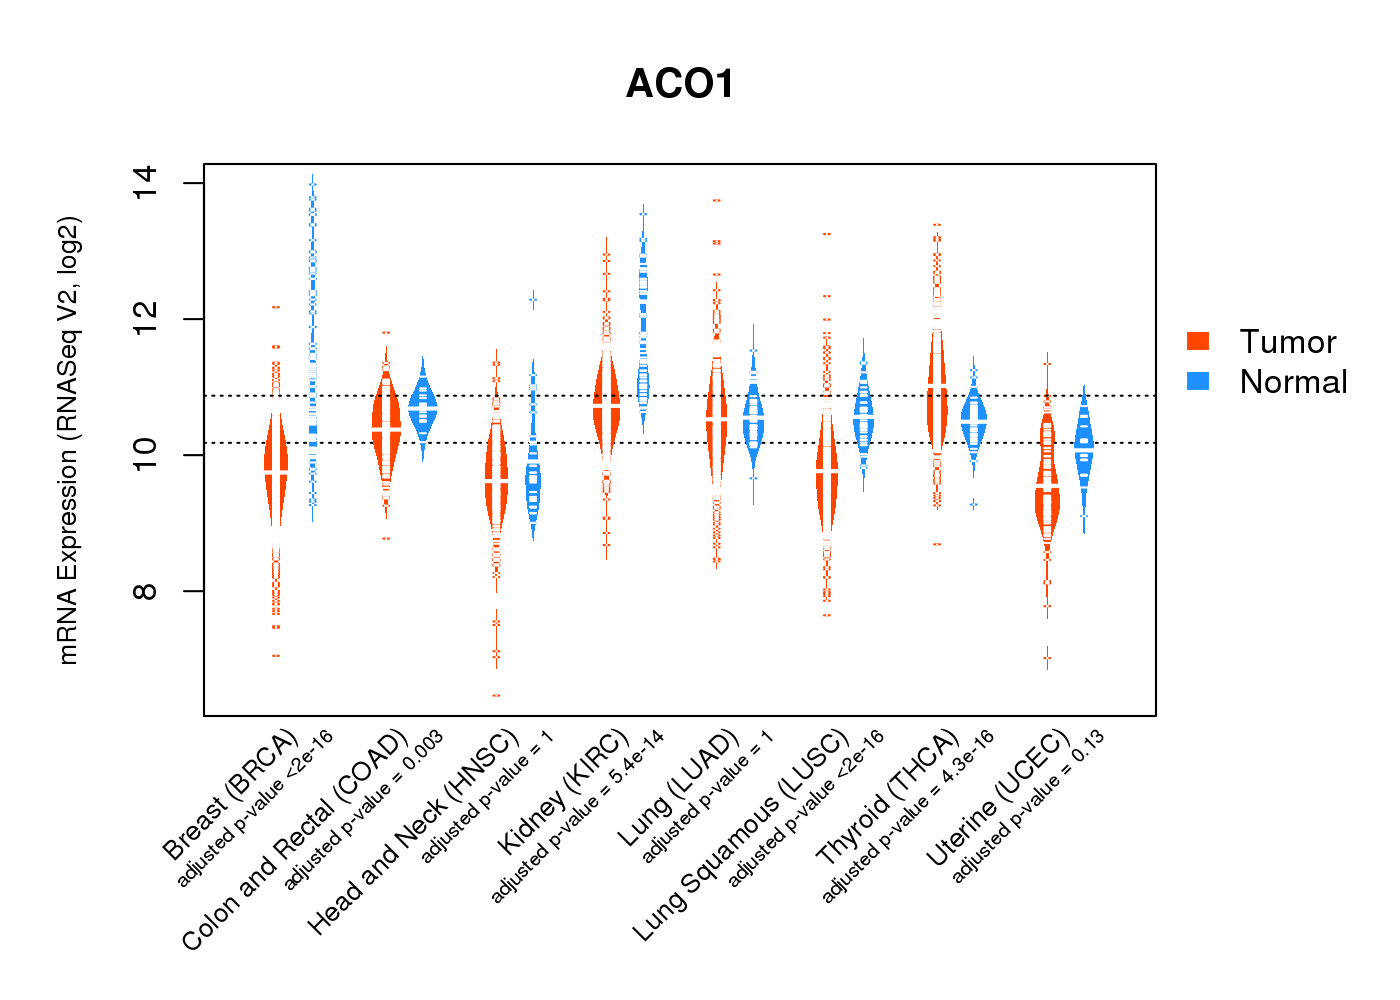
| Gene Expression for ACO1 |
| * CCLE gene expression data were extracted from CCLE_Expression_Entrez_2012-10-18.res: Gene-centric RMA-normalized mRNA expression data. |
 |
| * Normalized gene expression data of RNASeqV2 was extracted from TCGA using R package TCGA-Assembler. The URLs of all public data files on TCGA DCC data server were gathered at Jan-05-2015. Only eight cancer types have enough normal control samples for differential expression analysis. (t test, adjusted p<0.05 (using Benjamini-Hochberg FDR)) |
 |
| Top |
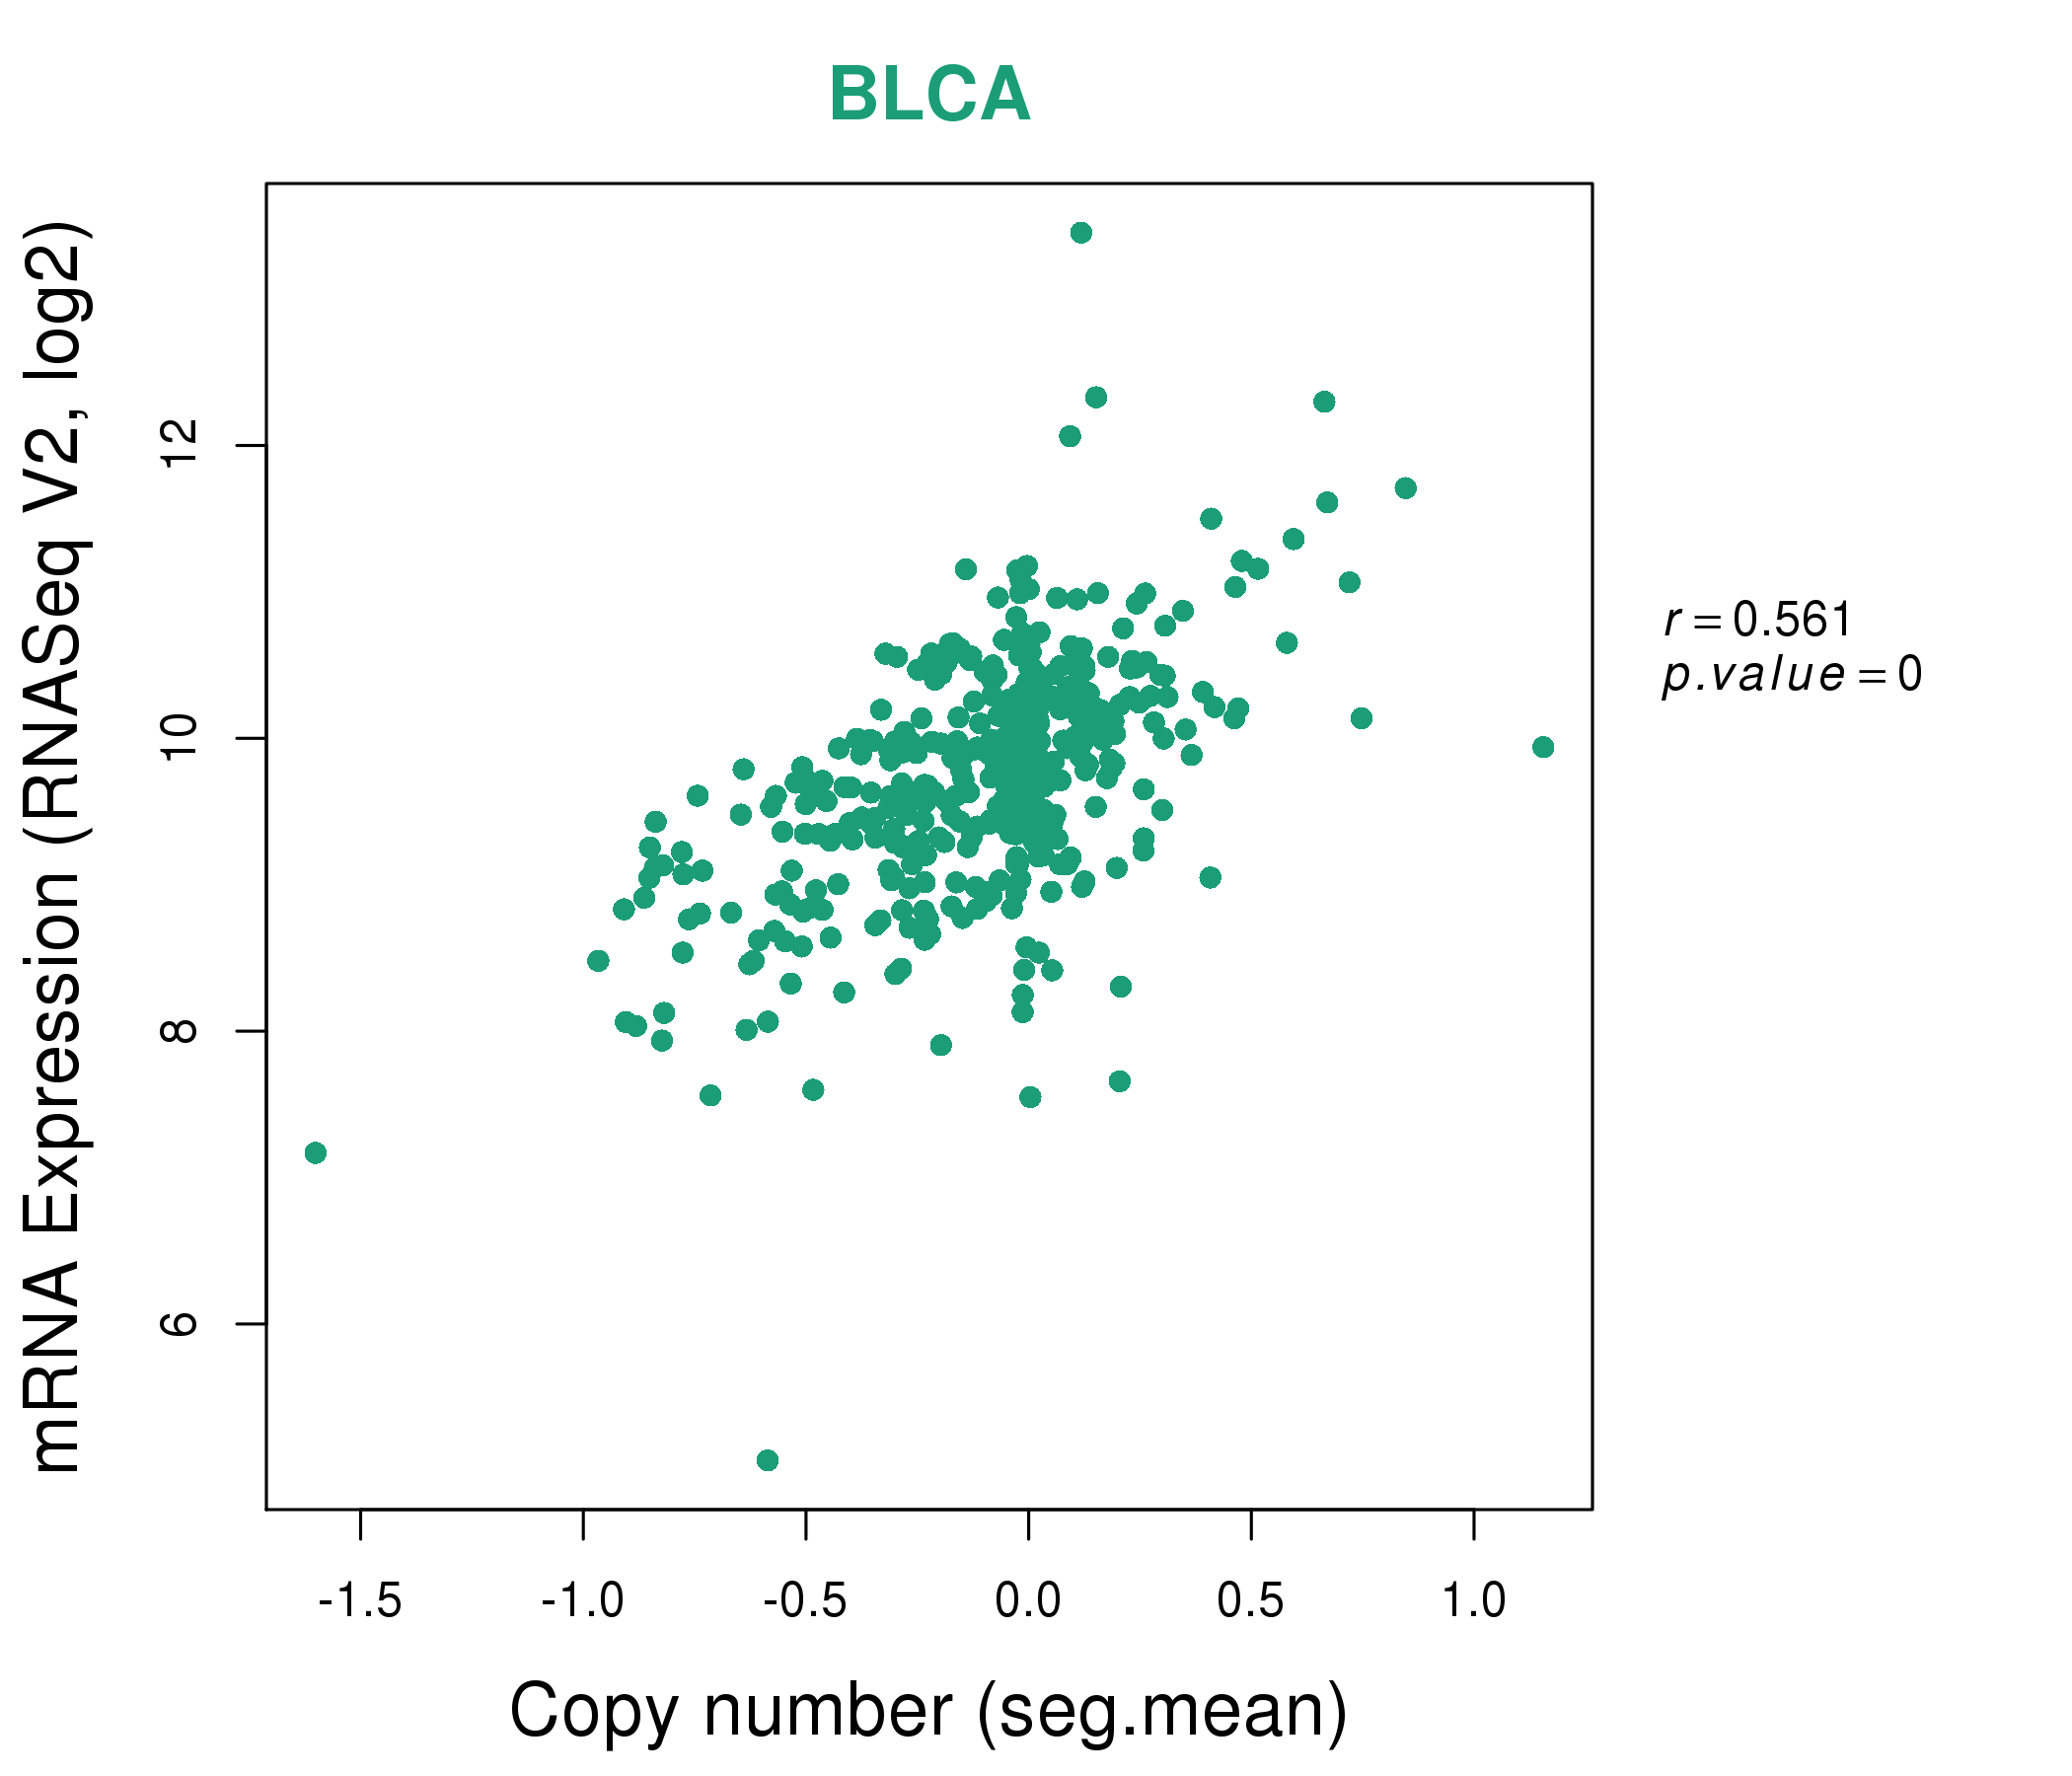
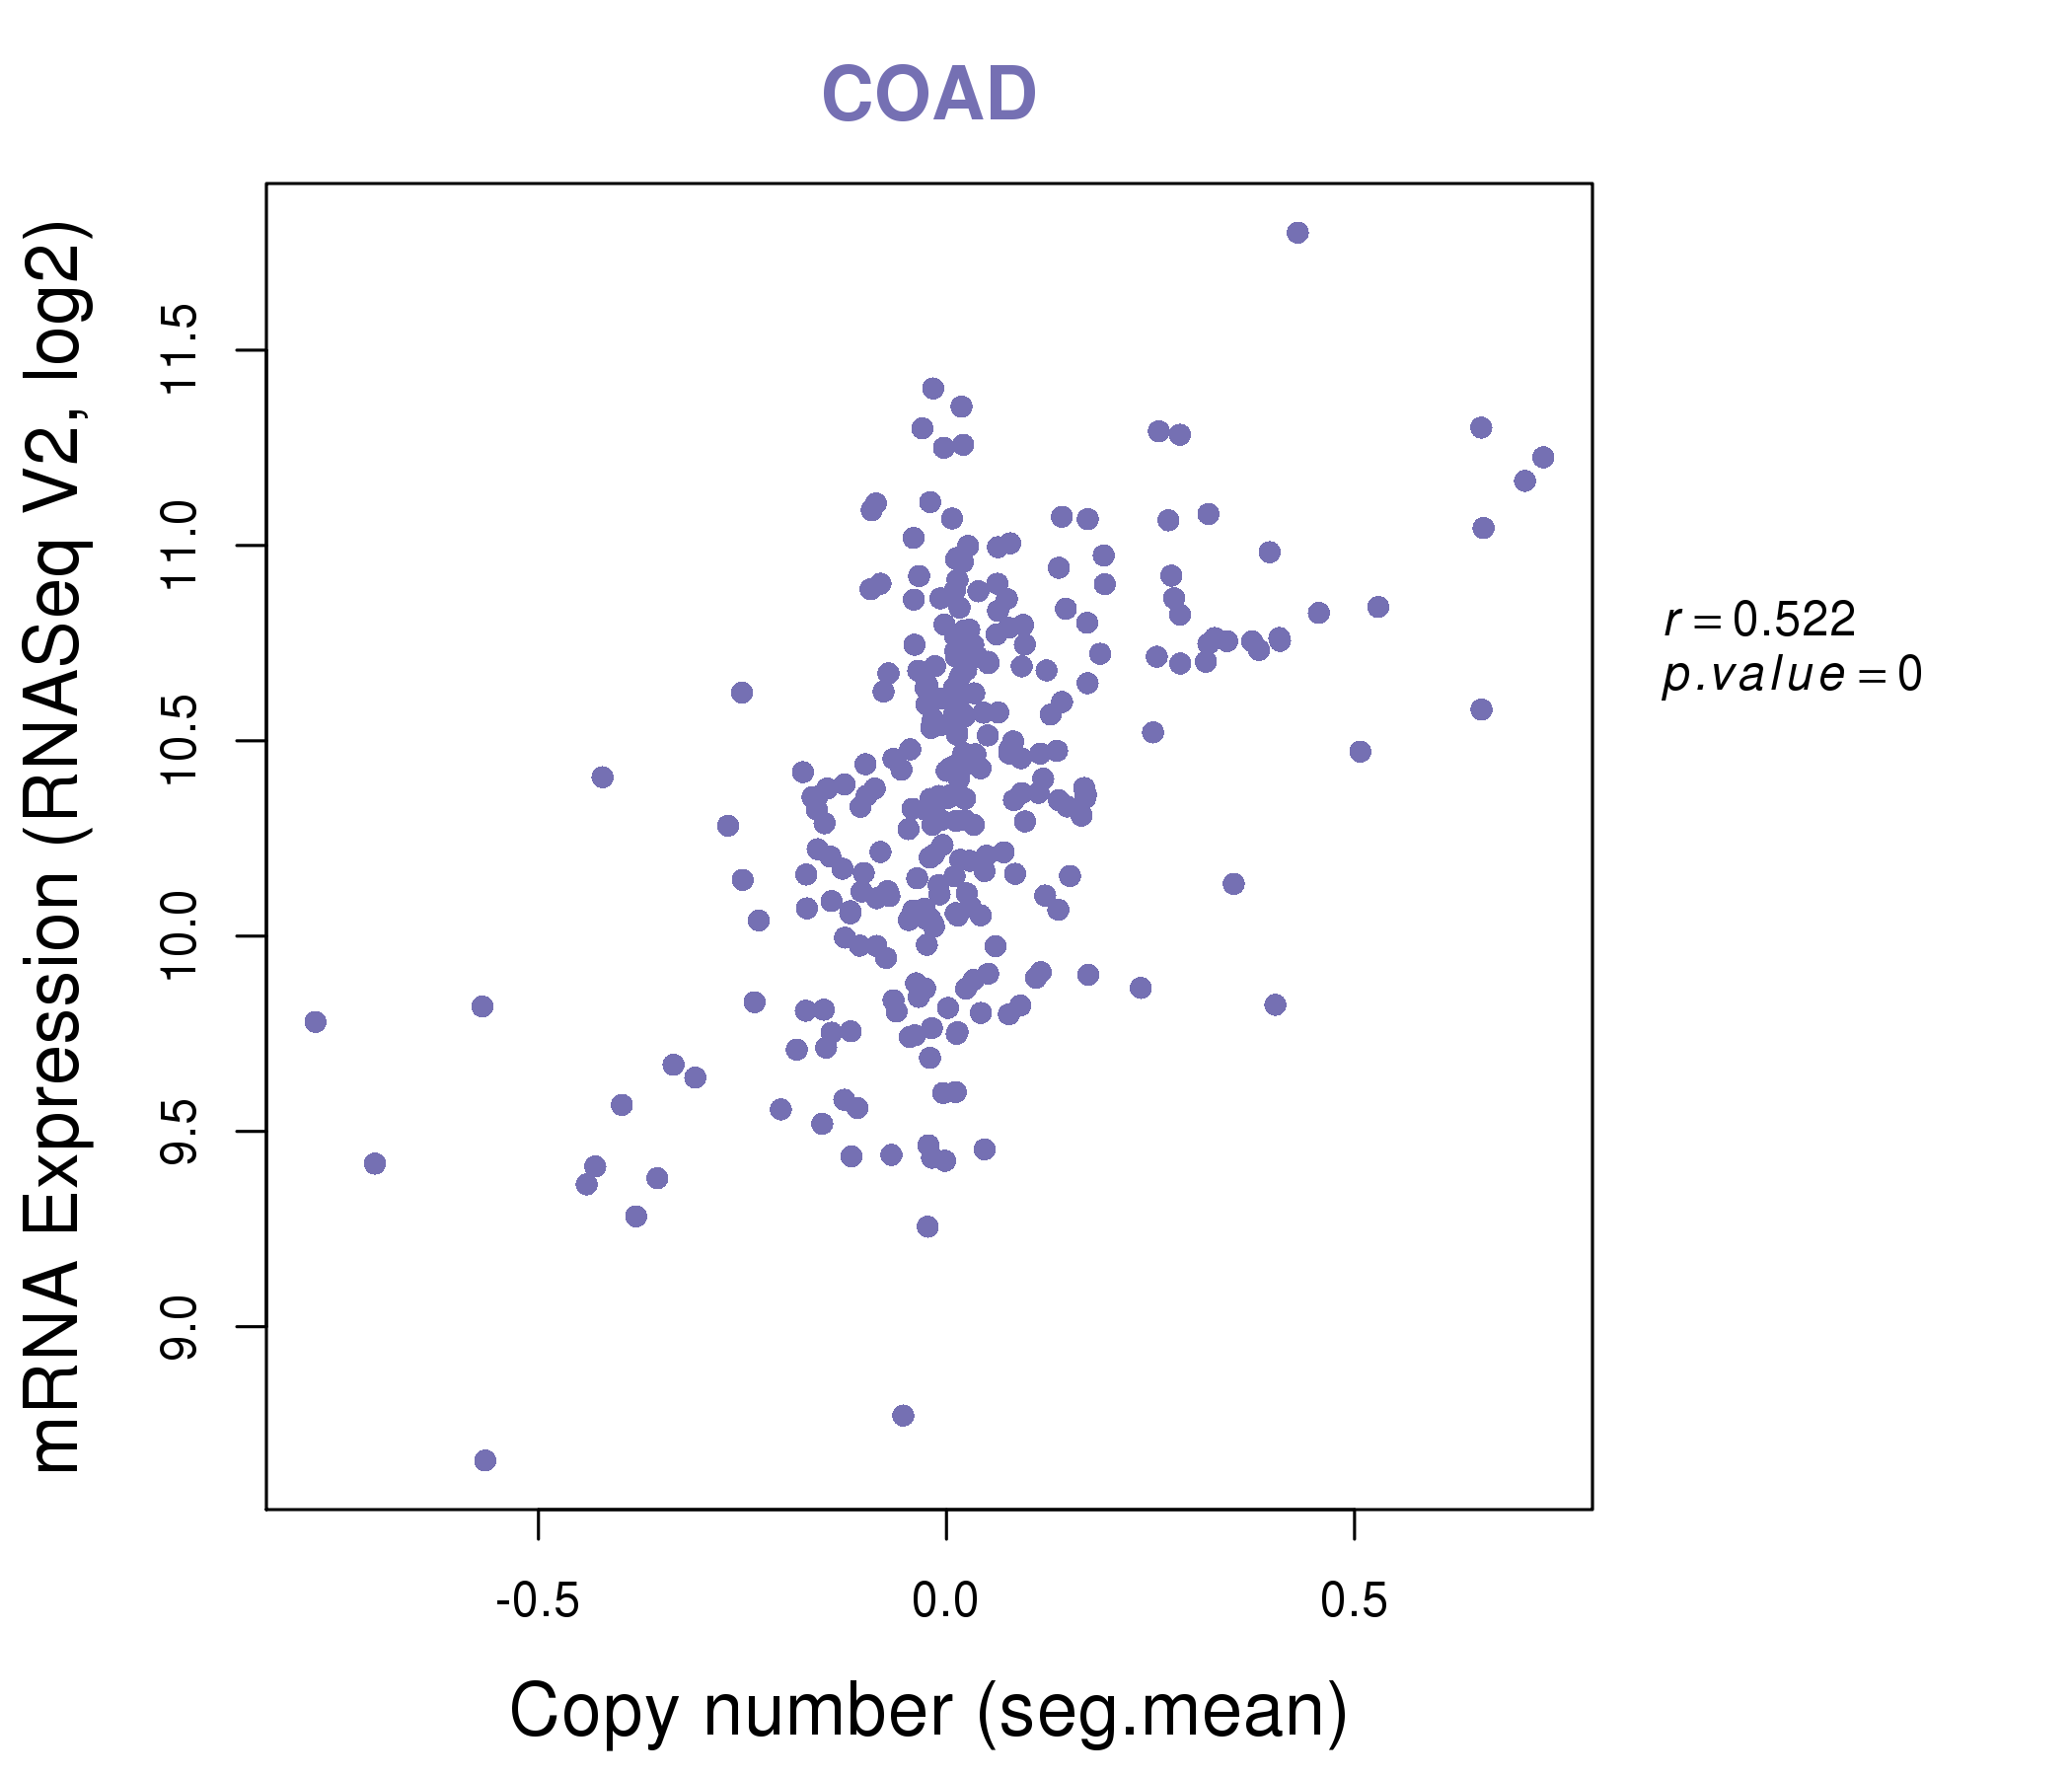
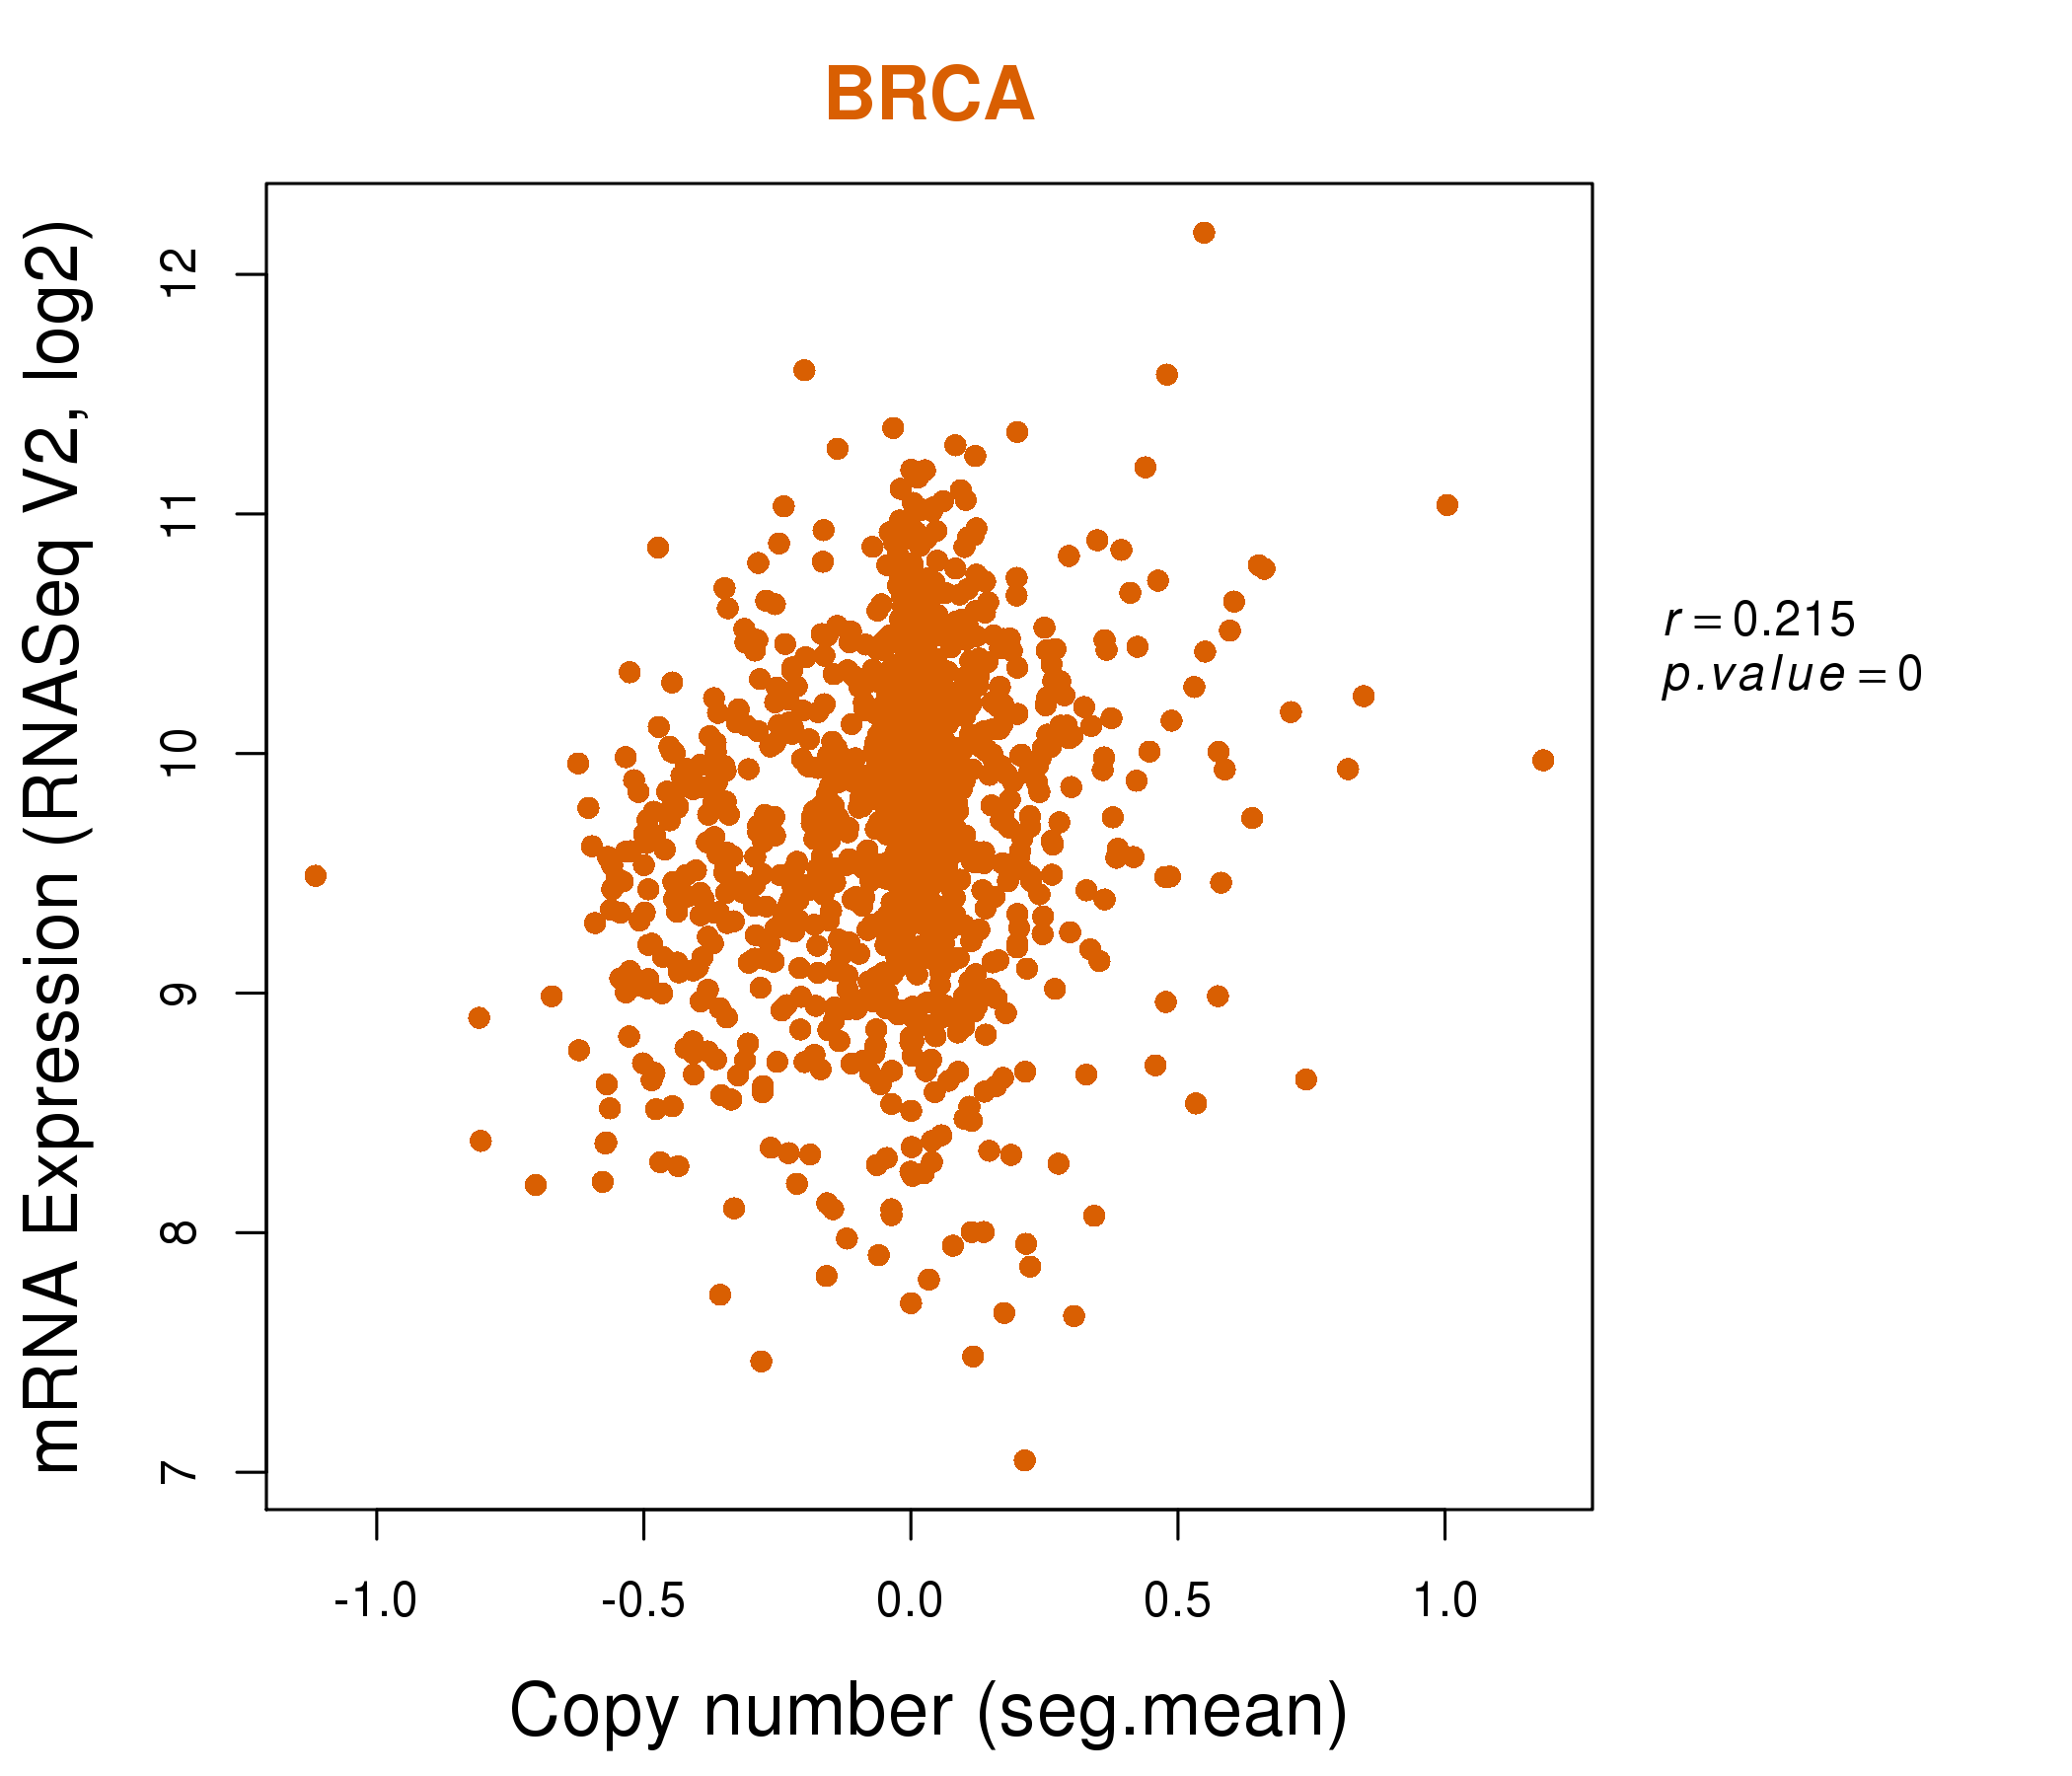
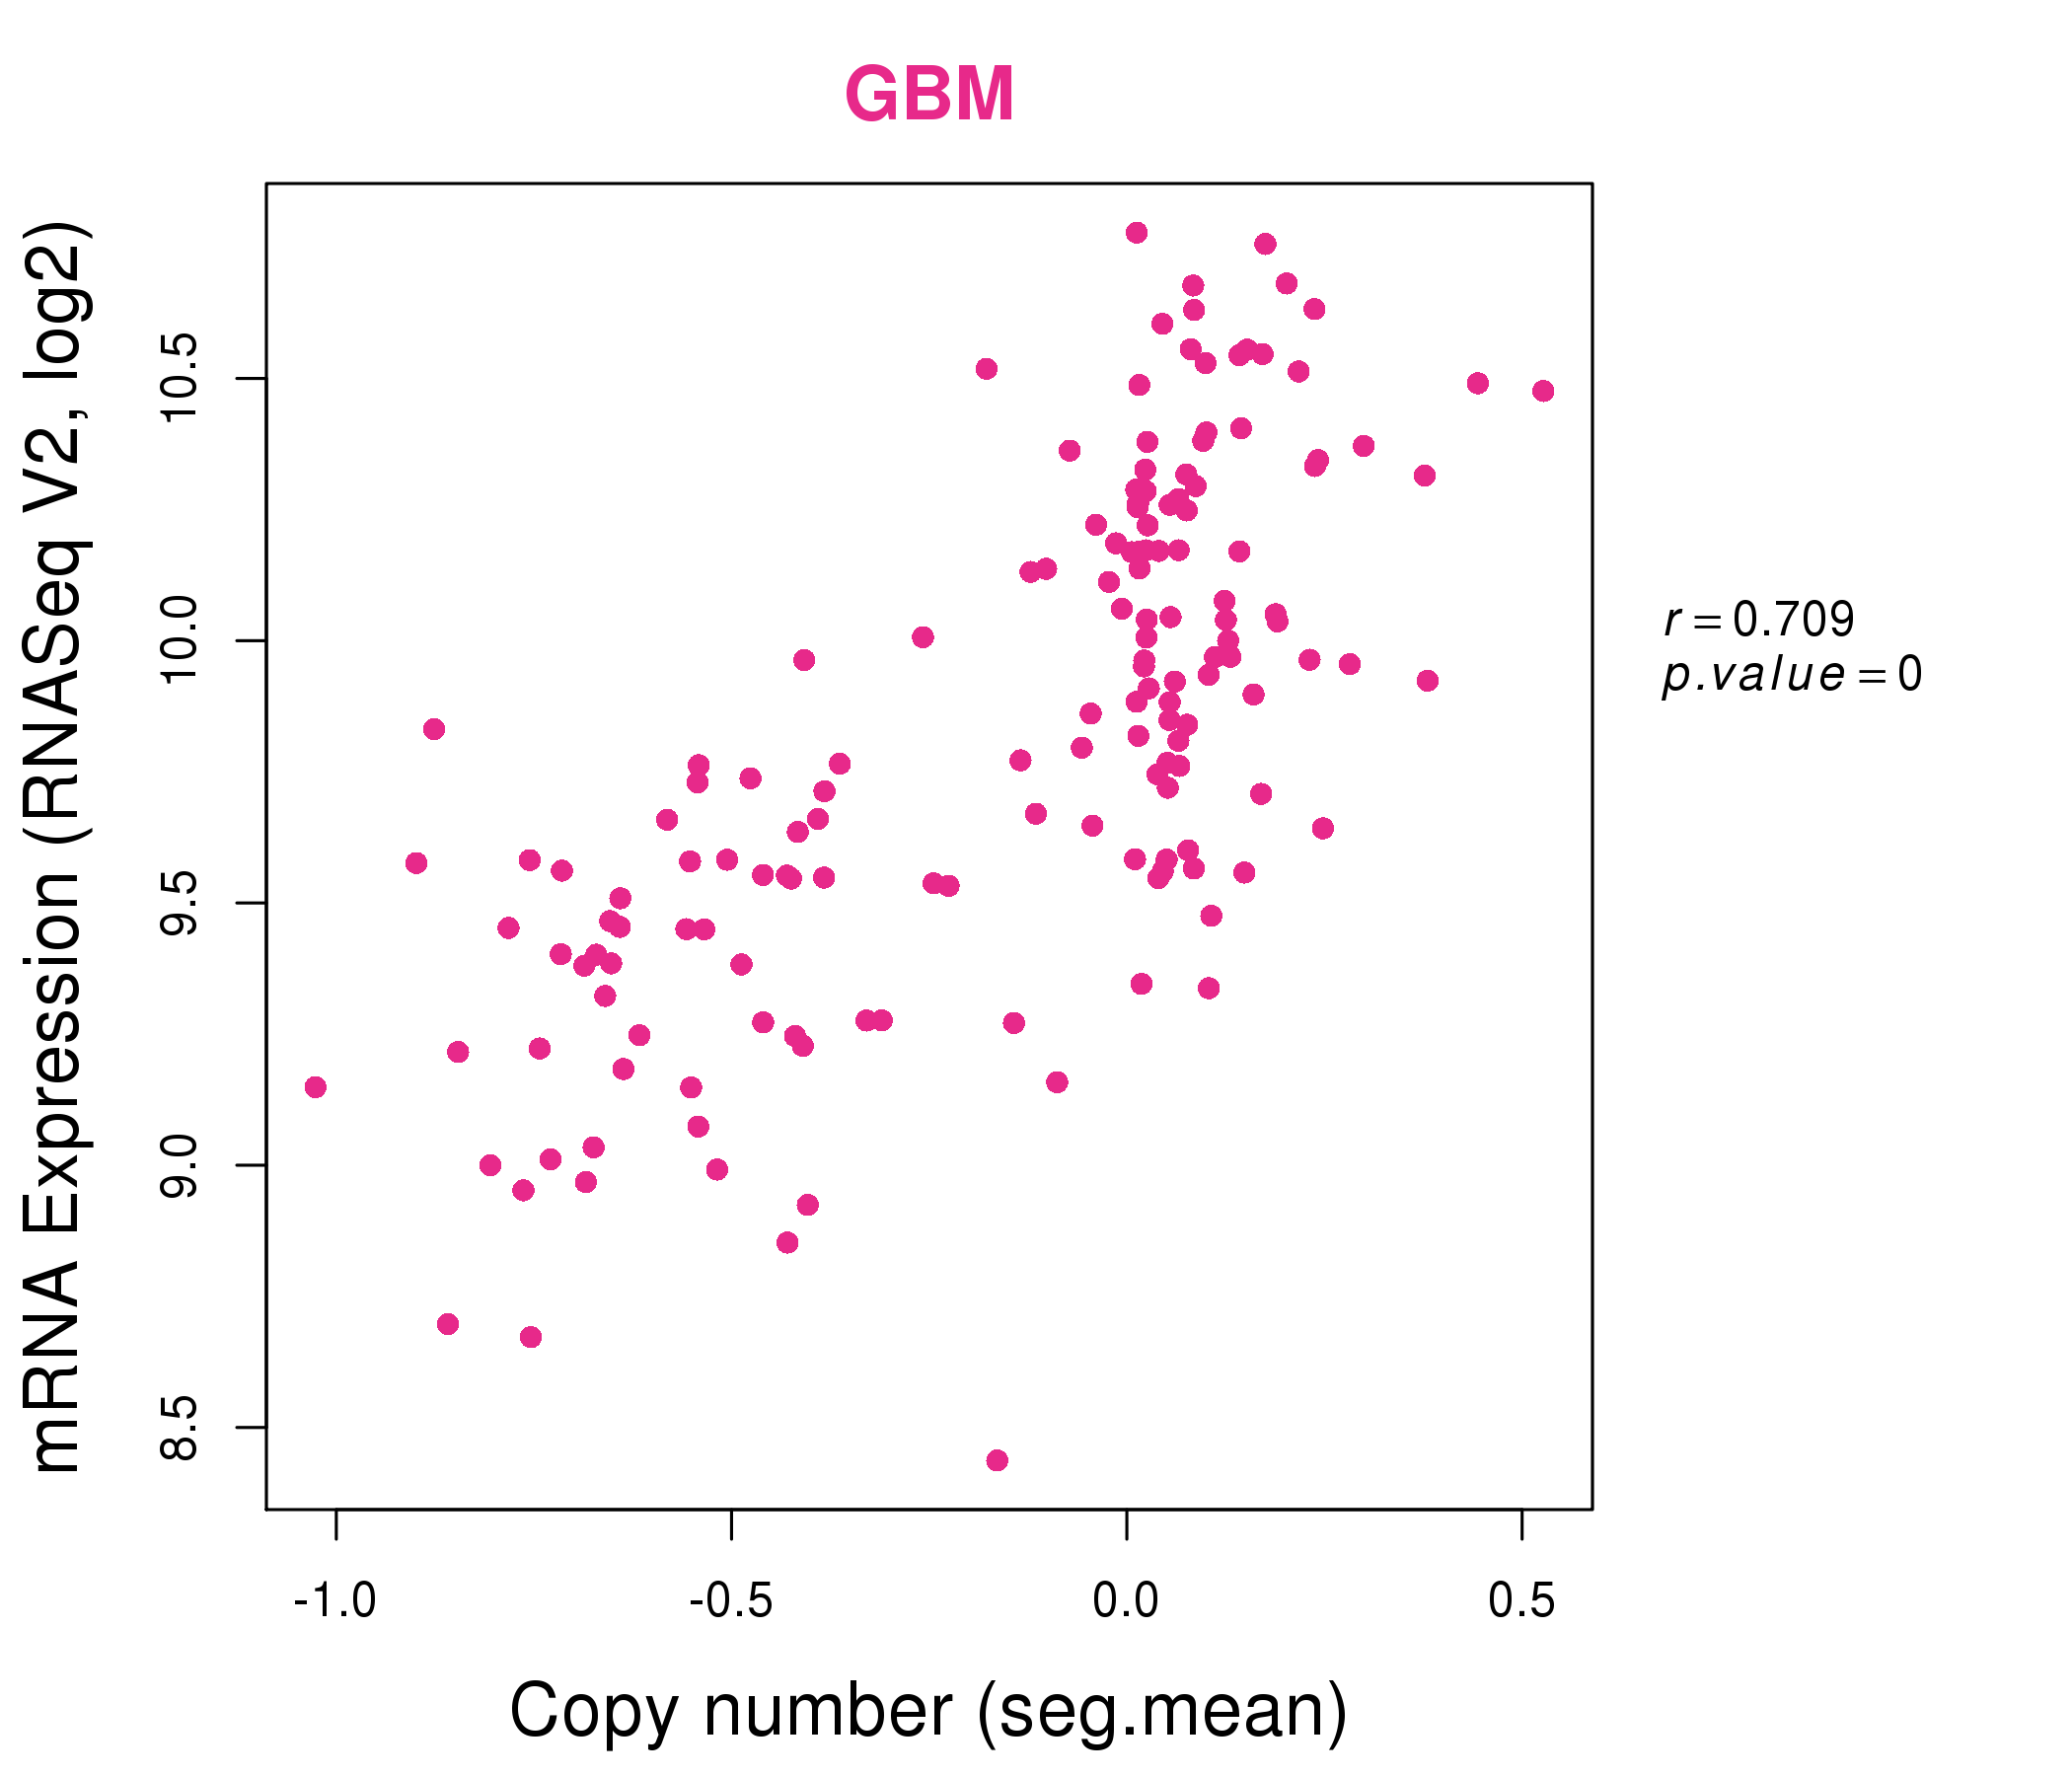
| * This plots show the correlation between CNV and gene expression. |
: Open all plots for all cancer types
 |
|
 |
|
| Top |
| Gene-Gene Network Information |
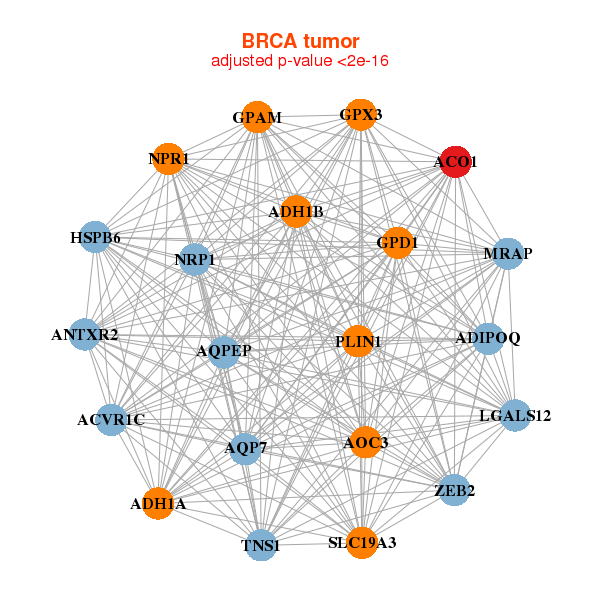
| * Co-Expression network figures were drawn using R package igraph. Only the top 20 genes with the highest correlations were shown. Red circle: input gene, orange circle: cell metabolism gene, sky circle: other gene |
: Open all plots for all cancer types
 |
|
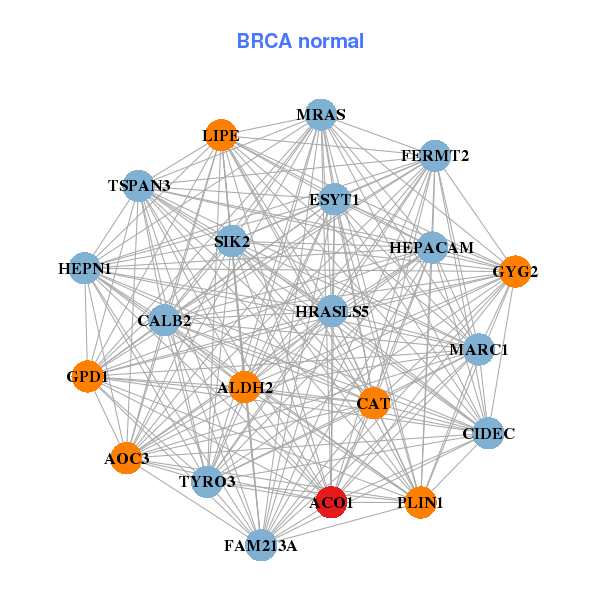
| ACO1,ACVR1C,ADH1A,ADH1B,ADIPOQ,ANTXR2,AOC3, AQP7,AQPEP,GPAM,GPD1,GPX3,HSPB6,LGALS12, MRAP,NPR1,NRP1,PLIN1,SLC19A3,TNS1,ZEB2 | ACO1,ALDH2,AOC3,FAM213A,CALB2,CAT,CIDEC, ESYT1,FERMT2,GPD1,GYG2,HEPACAM,HEPN1,HRASLS5, LIPE,MARC1,MRAS,PLIN1,SIK2,TSPAN3,TYRO3 |
 |
|
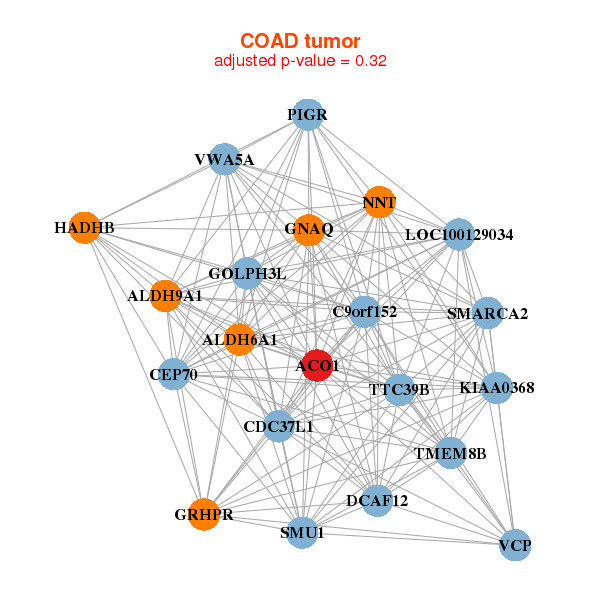
| ACO1,ALDH6A1,ALDH9A1,C9orf152,CDC37L1,CEP70,DCAF12, GNAQ,GOLPH3L,GRHPR,HADHB,KIAA0368,LOC100129034,NNT, PIGR,SMARCA2,SMU1,TMEM8B,TTC39B,VCP,VWA5A | ACO1,AHCYL1,LINC01555,CPPED1,CREB3L2,EXOC6B,GNS, GPI,HOXC5,HOXC6,HSD3B7,ICMT,LONP2,MEGF9, NBAS,NFIB,REG3G,SMC3,TGM2,PRSS58,VPS35 |
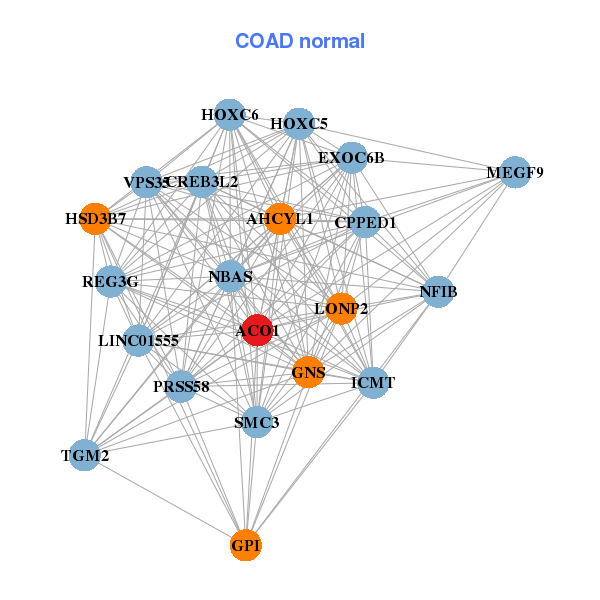
| * Co-Expression network figures were drawn using R package igraph. Only the top 20 genes with the highest correlations were shown. Red circle: input gene, orange circle: cell metabolism gene, sky circle: other gene |
: Open all plots for all cancer types
| Top |
: Open all interacting genes' information including KEGG pathway for all interacting genes from DAVID
| Top |
| Pharmacological Information for ACO1 |
| There's no related Drug. |
| Top |
| Cross referenced IDs for ACO1 |
| * We obtained these cross-references from Uniprot database. It covers 150 different DBs, 18 categories. http://www.uniprot.org/help/cross_references_section |
: Open all cross reference information
|
Copyright © 2016-Present - The Univsersity of Texas Health Science Center at Houston @ |