|
||||||||||||||||||||||||||||||||||||||||||||||||||||||||||||||||||||||||||||||||||||||||||||||||||||||||||||||||||||||||||||||||||||||||||||||||||||||||||||||||||||||||||||||||||||||||||||||||||||||||||||||||||||||||||||||||||||||||||||||||||||||||||||||||||||||||||||||||||||||||||||||||||||||||||||||||||||||||||
| |
| Phenotypic Information (metabolism pathway, cancer, disease, phenome) |
| |
| |
| Gene-Gene Network Information: Co-Expression Network, Interacting Genes & KEGG |
| |
|


| Gene Summary for NFYA |
| Basic gene info. | Gene symbol | NFYA |
| Gene name | nuclear transcription factor Y, alpha | |
| Synonyms | CBF-A|CBF-B|HAP2|NF-YA | |
| Cytomap | UCSC genome browser: 6p21.3 | |
| Genomic location | chr6 :41040706-41070146 | |
| Type of gene | protein-coding | |
| RefGenes | NM_002505.4, NM_021705.3, | |
| Ensembl id | ENSG00000001167 | |
| Description | CAAT box DNA-binding protein subunit ACAAT-box DNA binding protein subunit ACCAAT-binding transcription factor subunit BHAP2 CCAAT-binding proteinTranscription factor NF-Y, A subunitnuclear transcription factor Y subunit Anuclear transcription facto | |
| Modification date | 20141207 | |
| dbXrefs | MIM : 189903 | |
| HGNC : HGNC | ||
| HPRD : 01793 | ||
| Protein | UniProt: P23511 go to UniProt's Cross Reference DB Table | |
| Expression | CleanEX: HS_NFYA | |
| BioGPS: 4800 | ||
| Gene Expression Atlas: ENSG00000001167 | ||
| The Human Protein Atlas: ENSG00000001167 | ||
| Pathway | NCI Pathway Interaction Database: NFYA | |
| KEGG: NFYA | ||
| REACTOME: NFYA | ||
| ConsensusPathDB | ||
| Pathway Commons: NFYA | ||
| Metabolism | MetaCyc: NFYA | |
| HUMANCyc: NFYA | ||
| Regulation | Ensembl's Regulation: ENSG00000001167 | |
| miRBase: chr6 :41,040,706-41,070,146 | ||
| TargetScan: NM_002505 | ||
| cisRED: ENSG00000001167 | ||
| Context | iHOP: NFYA | |
| cancer metabolism search in PubMed: NFYA | ||
| UCL Cancer Institute: NFYA | ||
| Assigned class in ccmGDB | B - This gene belongs to cancer gene. | |
| Top |
| Phenotypic Information for NFYA(metabolism pathway, cancer, disease, phenome) |
| Cancer | CGAP: NFYA |
| Familial Cancer Database: NFYA | |
| * This gene is included in those cancer gene databases. |
|
|
|
|
|
| . | ||||||||||||||||||||||||||||||||||||||||||||||||||||||||||||||||||||||||||||||||||||||||||||||||||||||||||||||||||||||||||||||||||||||||||||||||||||||||||||||||||||||||||||||||||||||||||||||||||||||||||||||||||||||||||||||||||||||||||||||||||||||||||||||||||||||||||||||||||||||||||||||||||||||||||||||||||||
Oncogene 1 | Significant driver gene in | |||||||||||||||||||||||||||||||||||||||||||||||||||||||||||||||||||||||||||||||||||||||||||||||||||||||||||||||||||||||||||||||||||||||||||||||||||||||||||||||||||||||||||||||||||||||||||||||||||||||||||||||||||||||||||||||||||||||||||||||||||||||||||||||||||||||||||||||||||||||||||||||||||||||||||||||||||||||||
| cf) number; DB name 1 Oncogene; http://nar.oxfordjournals.org/content/35/suppl_1/D721.long, 2 Tumor Suppressor gene; https://bioinfo.uth.edu/TSGene/, 3 Cancer Gene Census; http://www.nature.com/nrc/journal/v4/n3/abs/nrc1299.html, 4 CancerGenes; http://nar.oxfordjournals.org/content/35/suppl_1/D721.long, 5 Network of Cancer Gene; http://ncg.kcl.ac.uk/index.php, 1Therapeutic Vulnerabilities in Cancer; http://cbio.mskcc.org/cancergenomics/statius/ |
| REACTOME_METABOLISM_OF_LIPIDS_AND_LIPOPROTEINS | |
| OMIM | 189903; gene. |
| Orphanet | |
| Disease | KEGG Disease: NFYA |
| MedGen: NFYA (Human Medical Genetics with Condition) | |
| ClinVar: NFYA | |
| Phenotype | MGI: NFYA (International Mouse Phenotyping Consortium) |
| PhenomicDB: NFYA | |
| Mutations for NFYA |
| * Under tables are showing count per each tissue to give us broad intuition about tissue specific mutation patterns.You can go to the detailed page for each mutation database's web site. |
| - Statistics for Tissue and Mutation type | Top |
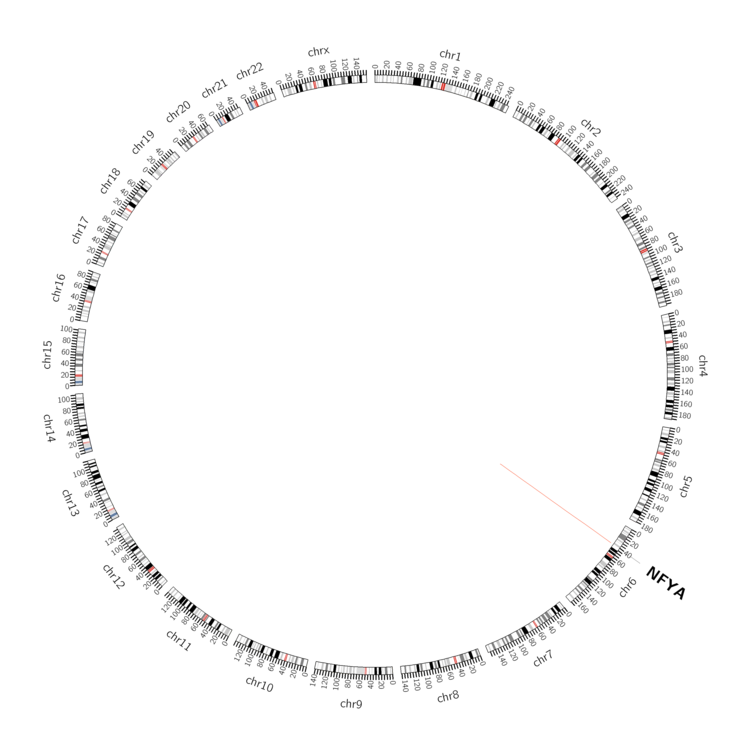 |
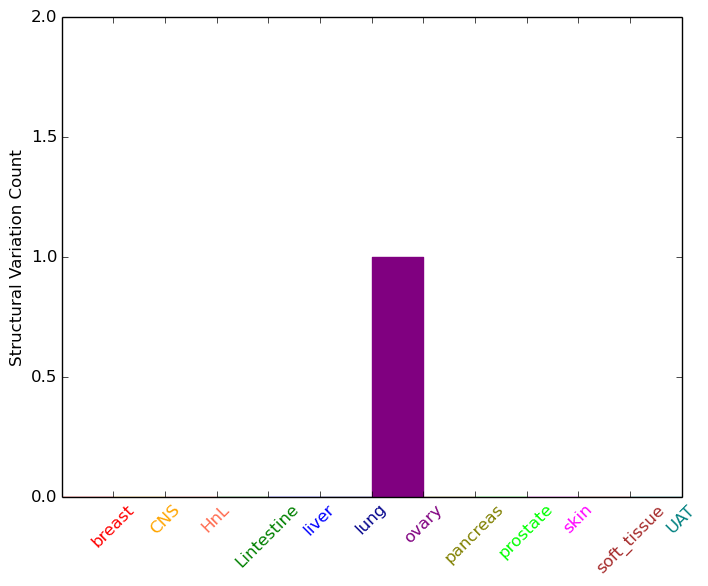
| - For Inter-chromosomal Variations |
| There's no inter-chromosomal structural variation. |
| - For Intra-chromosomal Variations |
| * Intra-chromosomal variantions includes 'intrachromosomal amplicon to amplicon', 'intrachromosomal amplicon to non-amplified dna', 'intrachromosomal deletion', 'intrachromosomal fold-back inversion', 'intrachromosomal inversion', 'intrachromosomal tandem duplication', 'Intrachromosomal unknown type', 'intrachromosomal with inverted orientation', 'intrachromosomal with non-inverted orientation'. |
 |
| Sample | Symbol_a | Chr_a | Start_a | End_a | Symbol_b | Chr_b | Start_b | End_b |
| ovary | NFYA | chr6 | 41050047 | 41050067 | NFYA | chr6 | 41052433 | 41052453 |
| cf) Tissue number; Tissue name (1;Breast, 2;Central_nervous_system, 3;Haematopoietic_and_lymphoid_tissue, 4;Large_intestine, 5;Liver, 6;Lung, 7;Ovary, 8;Pancreas, 9;Prostate, 10;Skin, 11;Soft_tissue, 12;Upper_aerodigestive_tract) |
| * From mRNA Sanger sequences, Chitars2.0 arranged chimeric transcripts. This table shows NFYA related fusion information. |
| ID | Head Gene | Tail Gene | Accession | Gene_a | qStart_a | qEnd_a | Chromosome_a | tStart_a | tEnd_a | Gene_a | qStart_a | qEnd_a | Chromosome_a | tStart_a | tEnd_a |
| BM728873 | NFYA | 1 | 77 | 6 | 41040723 | 41040799 | ZFP36L2 | 66 | 413 | 2 | 43451713 | 43452140 | |
| AW949743 | CSH1 | 1 | 276 | 17 | 61972841 | 61973209 | NFYA | 275 | 625 | 6 | 41040751 | 41051926 | |
| Top |
| Mutation type/ Tissue ID | brca | cns | cerv | endome | haematopo | kidn | Lintest | liver | lung | ns | ovary | pancre | prost | skin | stoma | thyro | urina | |||
| Total # sample | 1 | |||||||||||||||||||
| GAIN (# sample) | 1 | |||||||||||||||||||
| LOSS (# sample) |
| cf) Tissue ID; Tissue type (1; Breast, 2; Central_nervous_system, 3; Cervix, 4; Endometrium, 5; Haematopoietic_and_lymphoid_tissue, 6; Kidney, 7; Large_intestine, 8; Liver, 9; Lung, 10; NS, 11; Ovary, 12; Pancreas, 13; Prostate, 14; Skin, 15; Stomach, 16; Thyroid, 17; Urinary_tract) |
| Top |
|
 |
| Top |
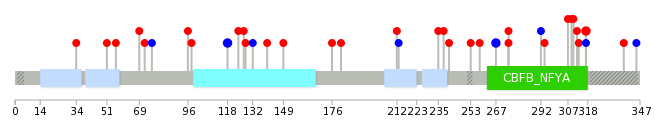
| Stat. for Non-Synonymous SNVs (# total SNVs=27) | (# total SNVs=6) |
 |  |
(# total SNVs=1) | (# total SNVs=0) |
 |
| Top |
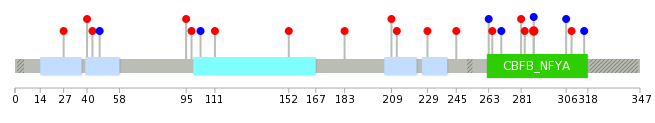
| * When you move the cursor on each content, you can see more deailed mutation information on the Tooltip. Those are primary_site,primary_histology,mutation(aa),pubmedID. |
| GRCh37 position | Mutation(aa) | Unique sampleID count |
| chr6:41060798-41060798 | p.E288* | 2 |
| chr6:41057362-41057362 | p.Q118Q | 2 |
| chr6:41060737-41060737 | p.V267V | 2 |
| chr6:41062196-41062196 | p.R317Q | 2 |
| chr6:41059354-41059354 | p.T212R | 1 |
| chr6:41051914-41051914 | p.T98A | 1 |
| chr6:41065119-41065119 | p.E338D | 1 |
| chr6:41059358-41059358 | p.T213T | 1 |
| chr6:41060812-41060812 | p.P292P | 1 |
| chr6:41065138-41065138 | p.R345R | 1 |
| Top |
|
 |
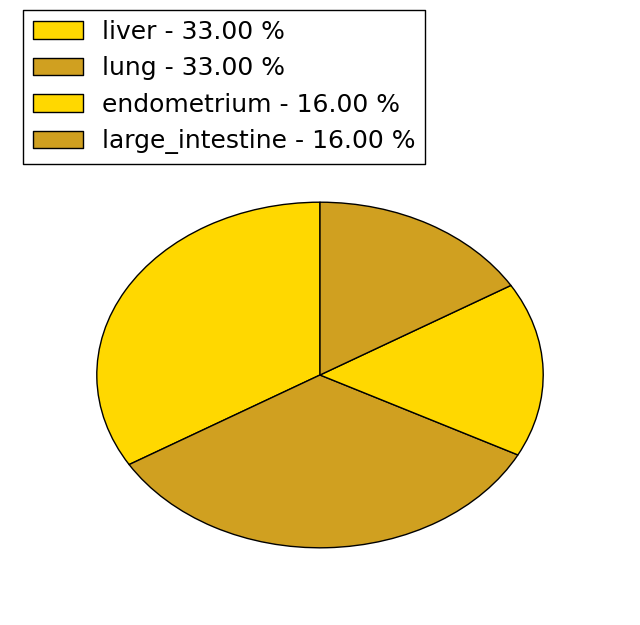
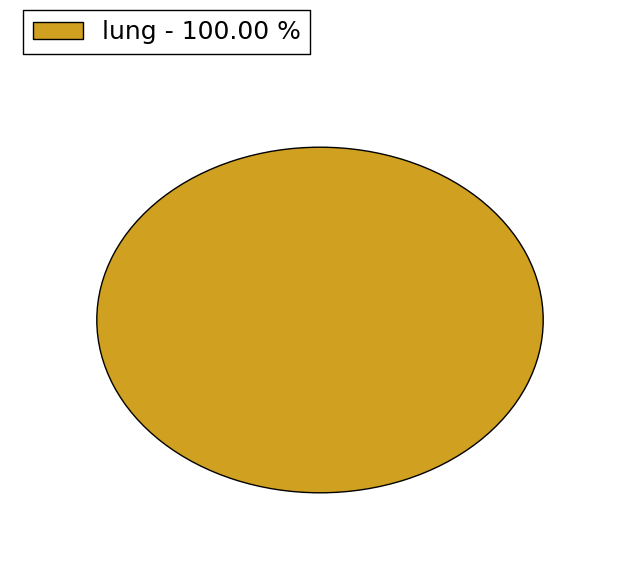
| Point Mutation/ Tissue ID | 1 | 2 | 3 | 4 | 5 | 6 | 7 | 8 | 9 | 10 | 11 | 12 | 13 | 14 | 15 | 16 | 17 | 18 | 19 | 20 |
| # sample | 3 | 1 | 6 | 1 | 3 | 1 | 2 | 5 | ||||||||||||
| # mutation | 3 | 1 | 6 | 1 | 3 | 1 | 2 | 7 | ||||||||||||
| nonsynonymous SNV | 1 | 1 | 5 | 1 | 1 | 2 | 6 | |||||||||||||
| synonymous SNV | 2 | 1 | 1 | 2 | 1 |
| cf) Tissue ID; Tissue type (1; BLCA[Bladder Urothelial Carcinoma], 2; BRCA[Breast invasive carcinoma], 3; CESC[Cervical squamous cell carcinoma and endocervical adenocarcinoma], 4; COAD[Colon adenocarcinoma], 5; GBM[Glioblastoma multiforme], 6; Glioma Low Grade, 7; HNSC[Head and Neck squamous cell carcinoma], 8; KICH[Kidney Chromophobe], 9; KIRC[Kidney renal clear cell carcinoma], 10; KIRP[Kidney renal papillary cell carcinoma], 11; LAML[Acute Myeloid Leukemia], 12; LUAD[Lung adenocarcinoma], 13; LUSC[Lung squamous cell carcinoma], 14; OV[Ovarian serous cystadenocarcinoma ], 15; PAAD[Pancreatic adenocarcinoma], 16; PRAD[Prostate adenocarcinoma], 17; SKCM[Skin Cutaneous Melanoma], 18:STAD[Stomach adenocarcinoma], 19:THCA[Thyroid carcinoma], 20:UCEC[Uterine Corpus Endometrial Carcinoma]) |
| Top |
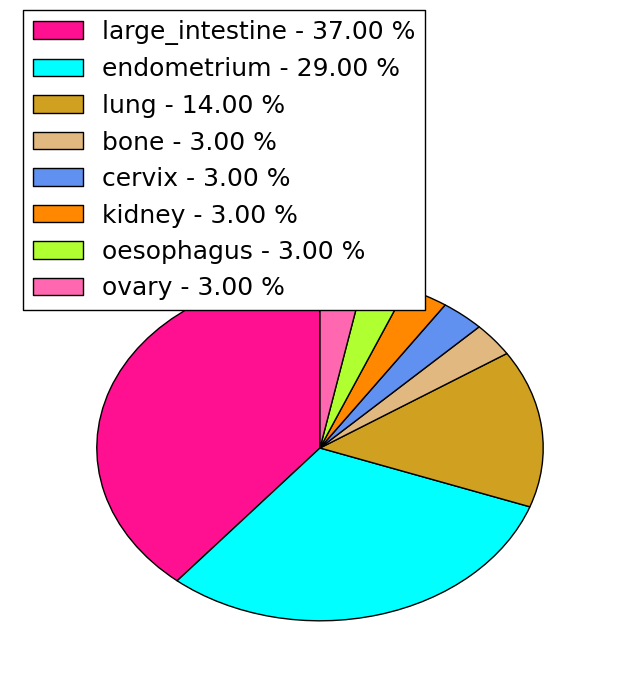
| * We represented just top 10 SNVs. When you move the cursor on each content, you can see more deailed mutation information on the Tooltip. Those are primary_site, primary_histology, mutation(aa), pubmedID. |
| Genomic Position | Mutation(aa) | Unique sampleID count |
| chr6:41062196 | p.R288Q,NFYA | 2 |
| chr6:41062180 | p.P212H,NFYA | 1 |
| chr6:41058044 | p.E229K,NFYA | 1 |
| chr6:41059354 | p.R245H,NFYA | 1 |
| chr6:41062197 | p.P263P,NFYA | 1 |
| chr6:41059431 | p.E265D,NFYA | 1 |
| chr6:41065110 | p.Q27L,NFYA | 1 |
| chr6:41051789 | p.L270L,NFYA | 1 |
| chr6:41060658 | p.L40I,NFYA | 1 |
| chr6:41065119 | p.R281W,NFYA | 1 |
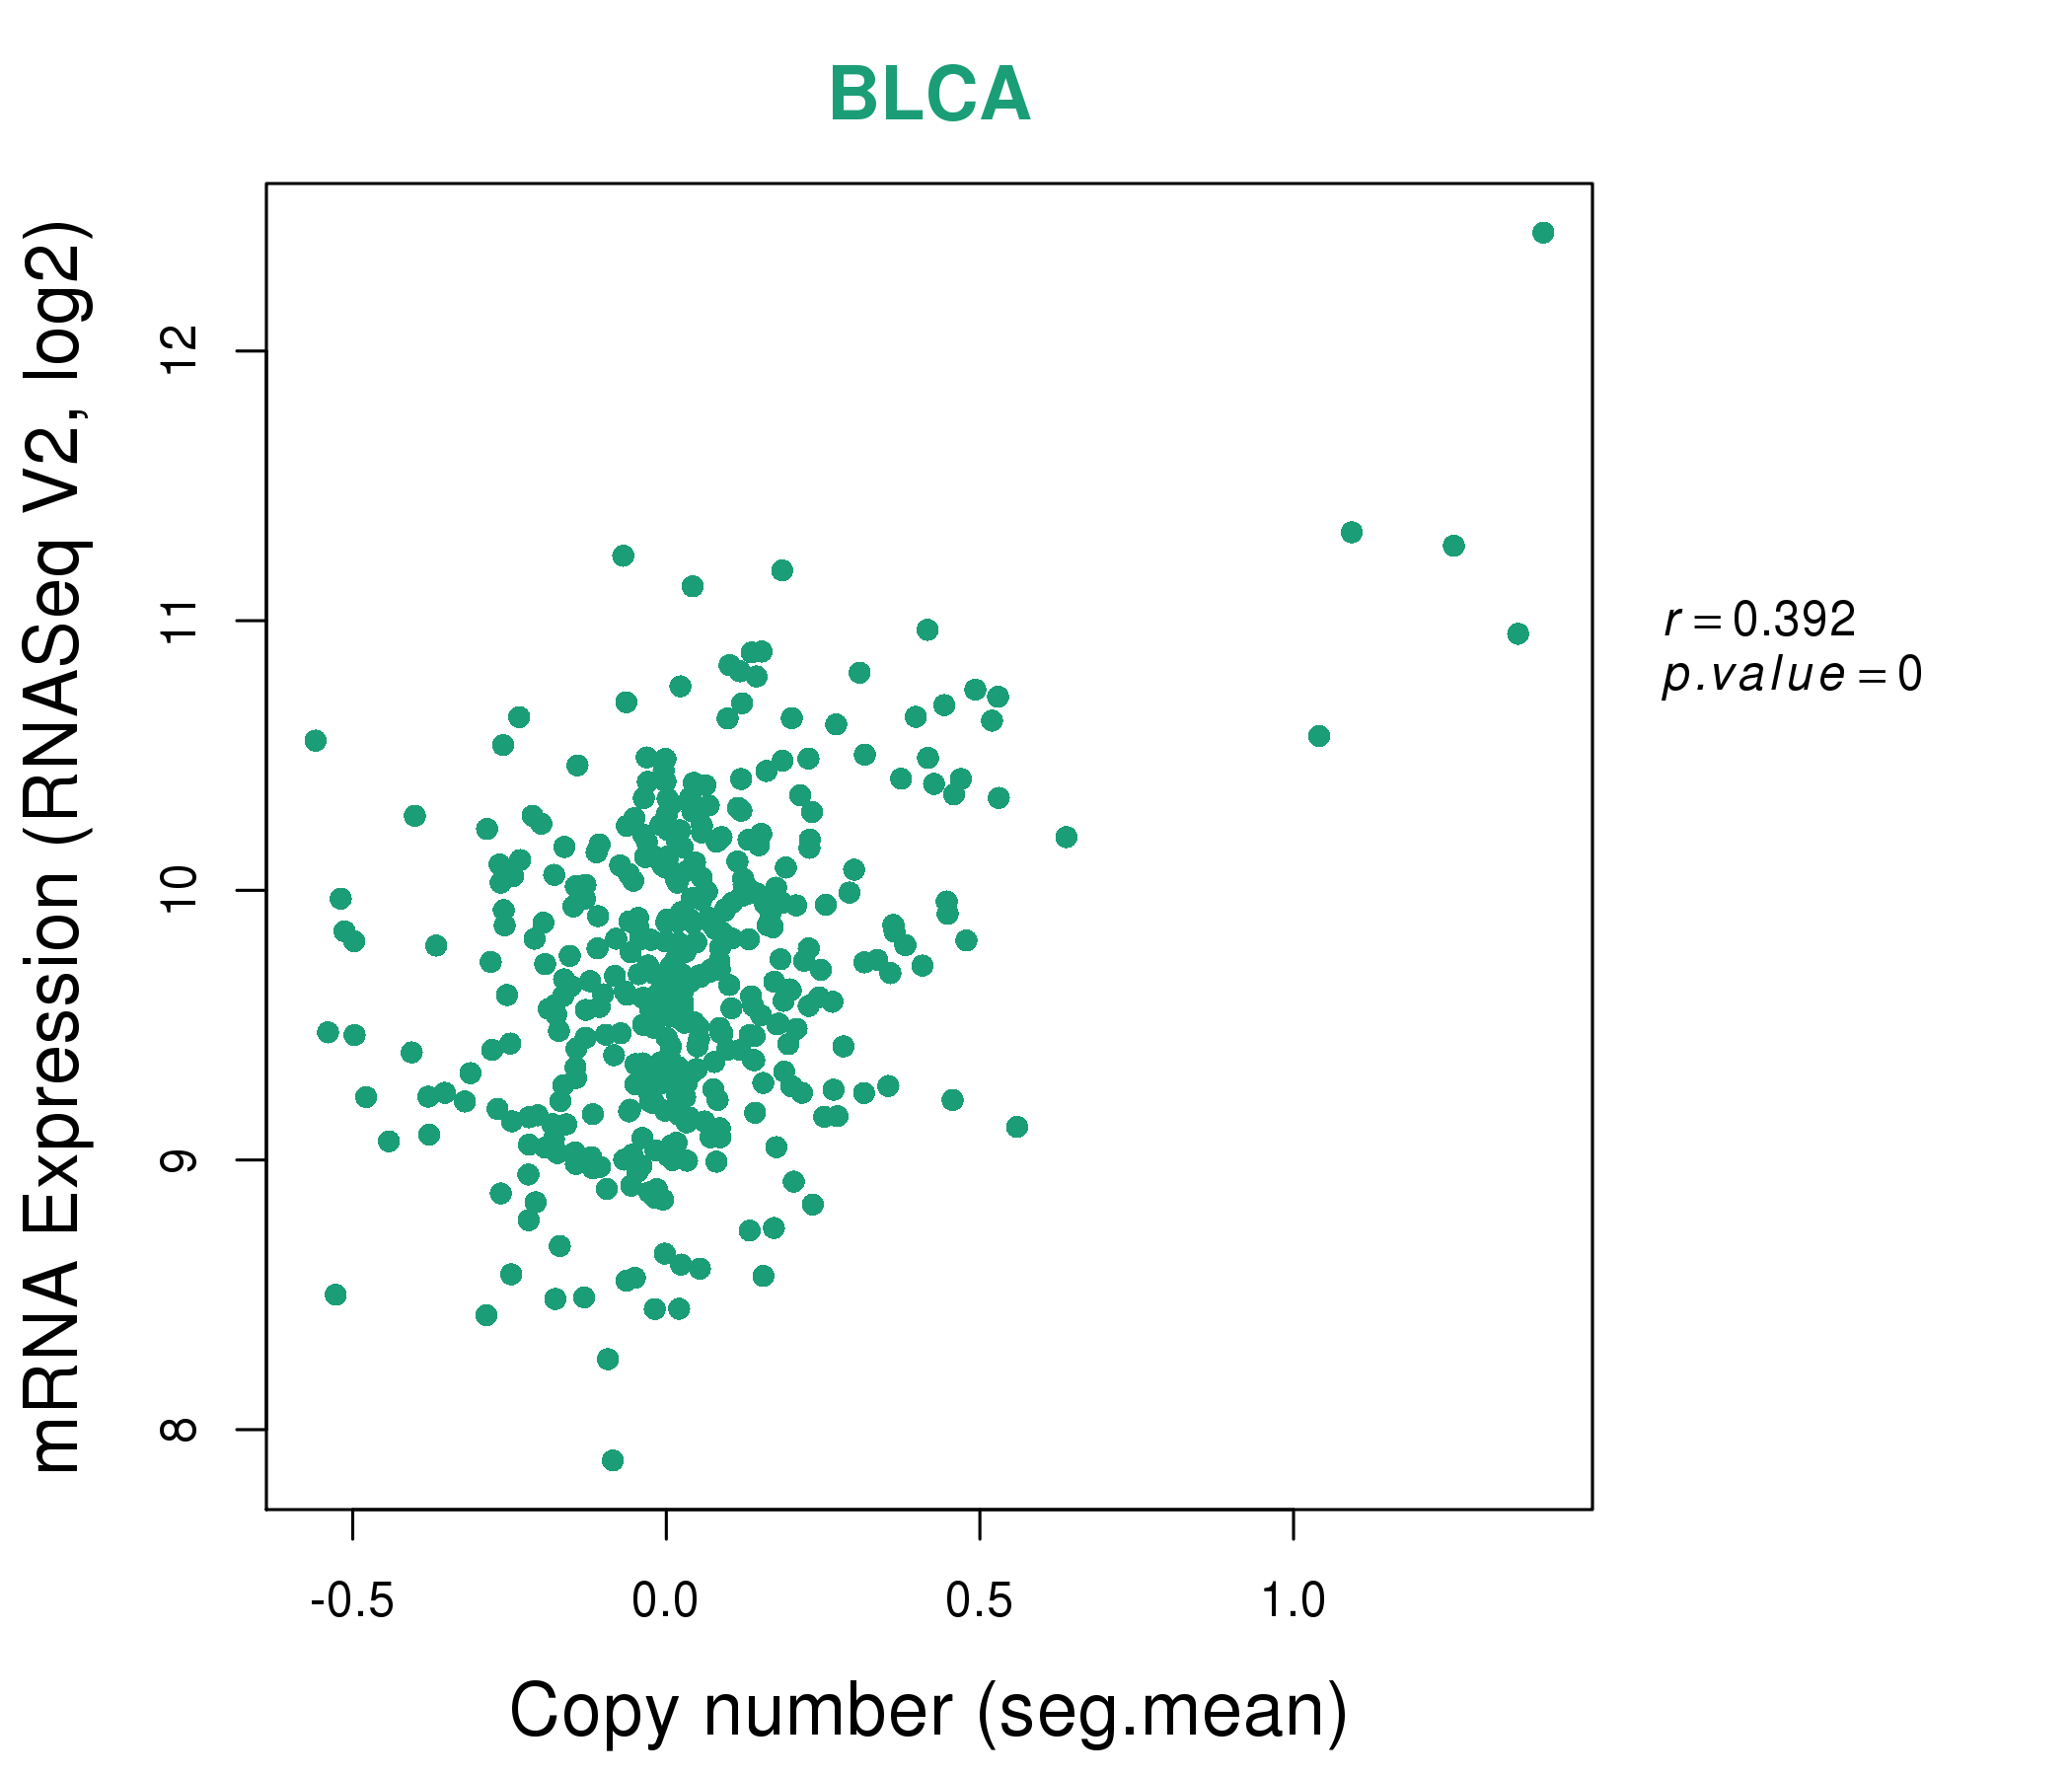
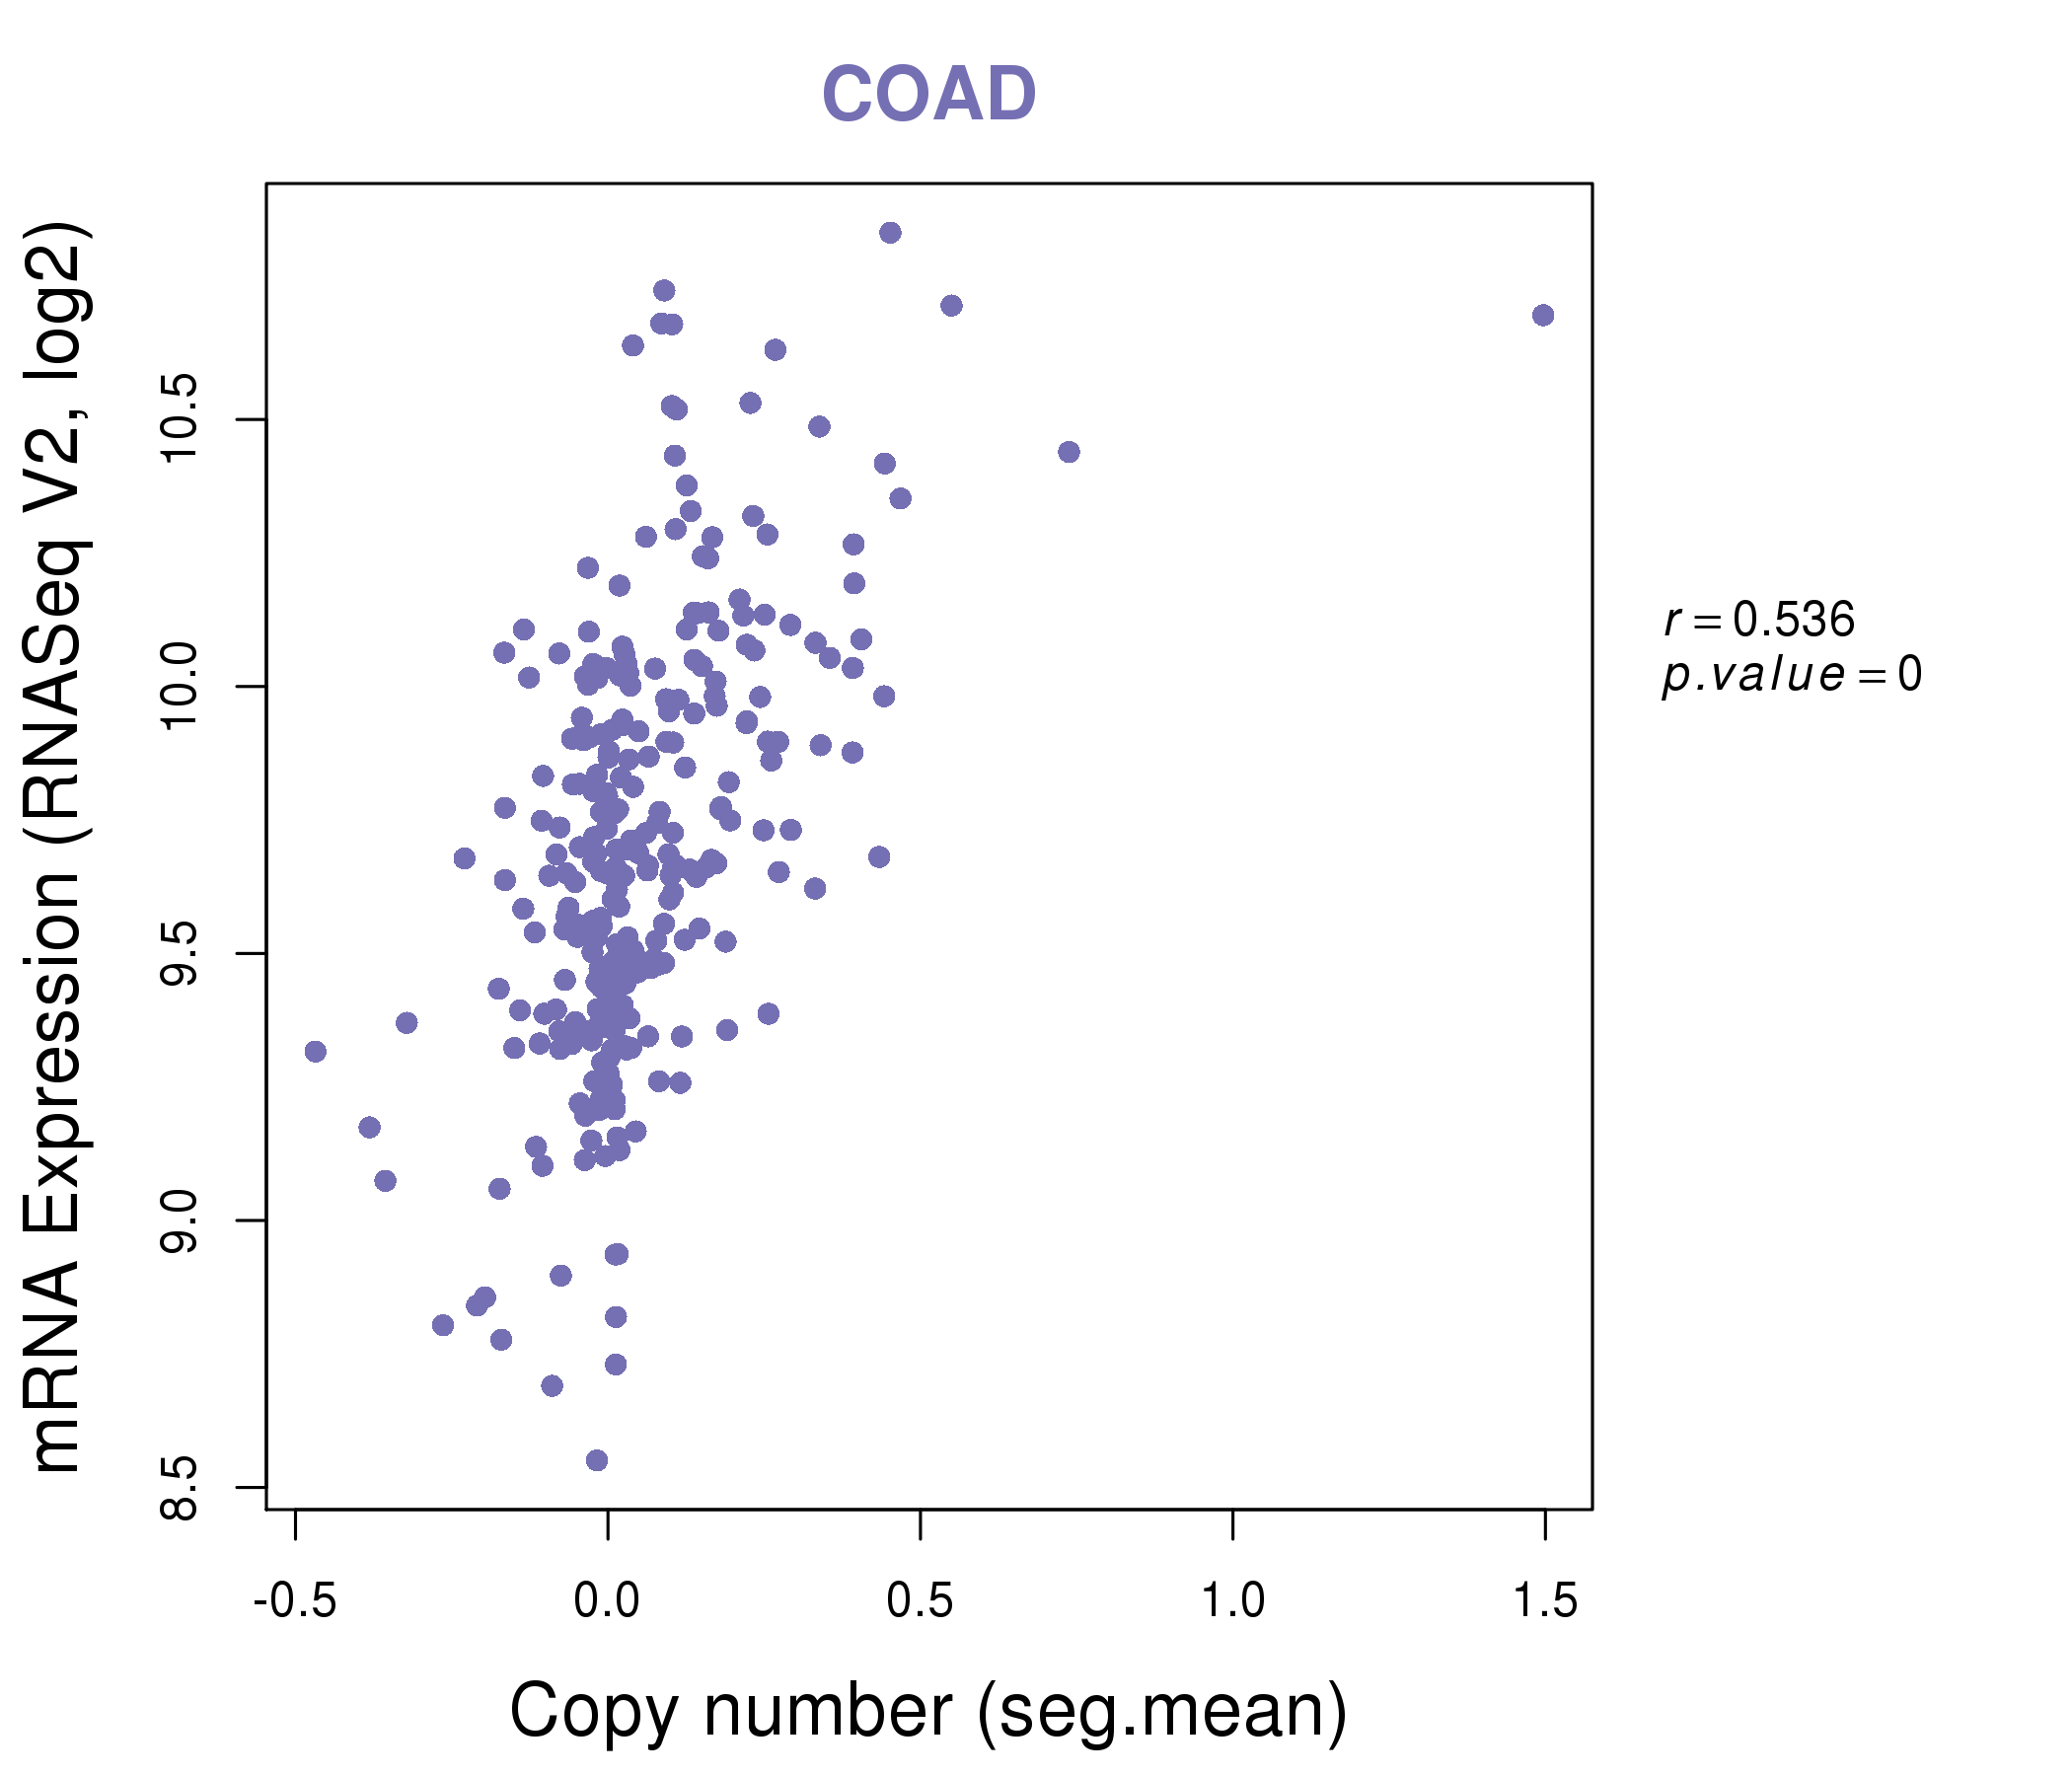
| * Copy number data were extracted from TCGA using R package TCGA-Assembler. The URLs of all public data files on TCGA DCC data server were gathered on Jan-05-2015. Function ProcessCNAData in TCGA-Assembler package was used to obtain gene-level copy number value which is calculated as the average copy number of the genomic region of a gene. |
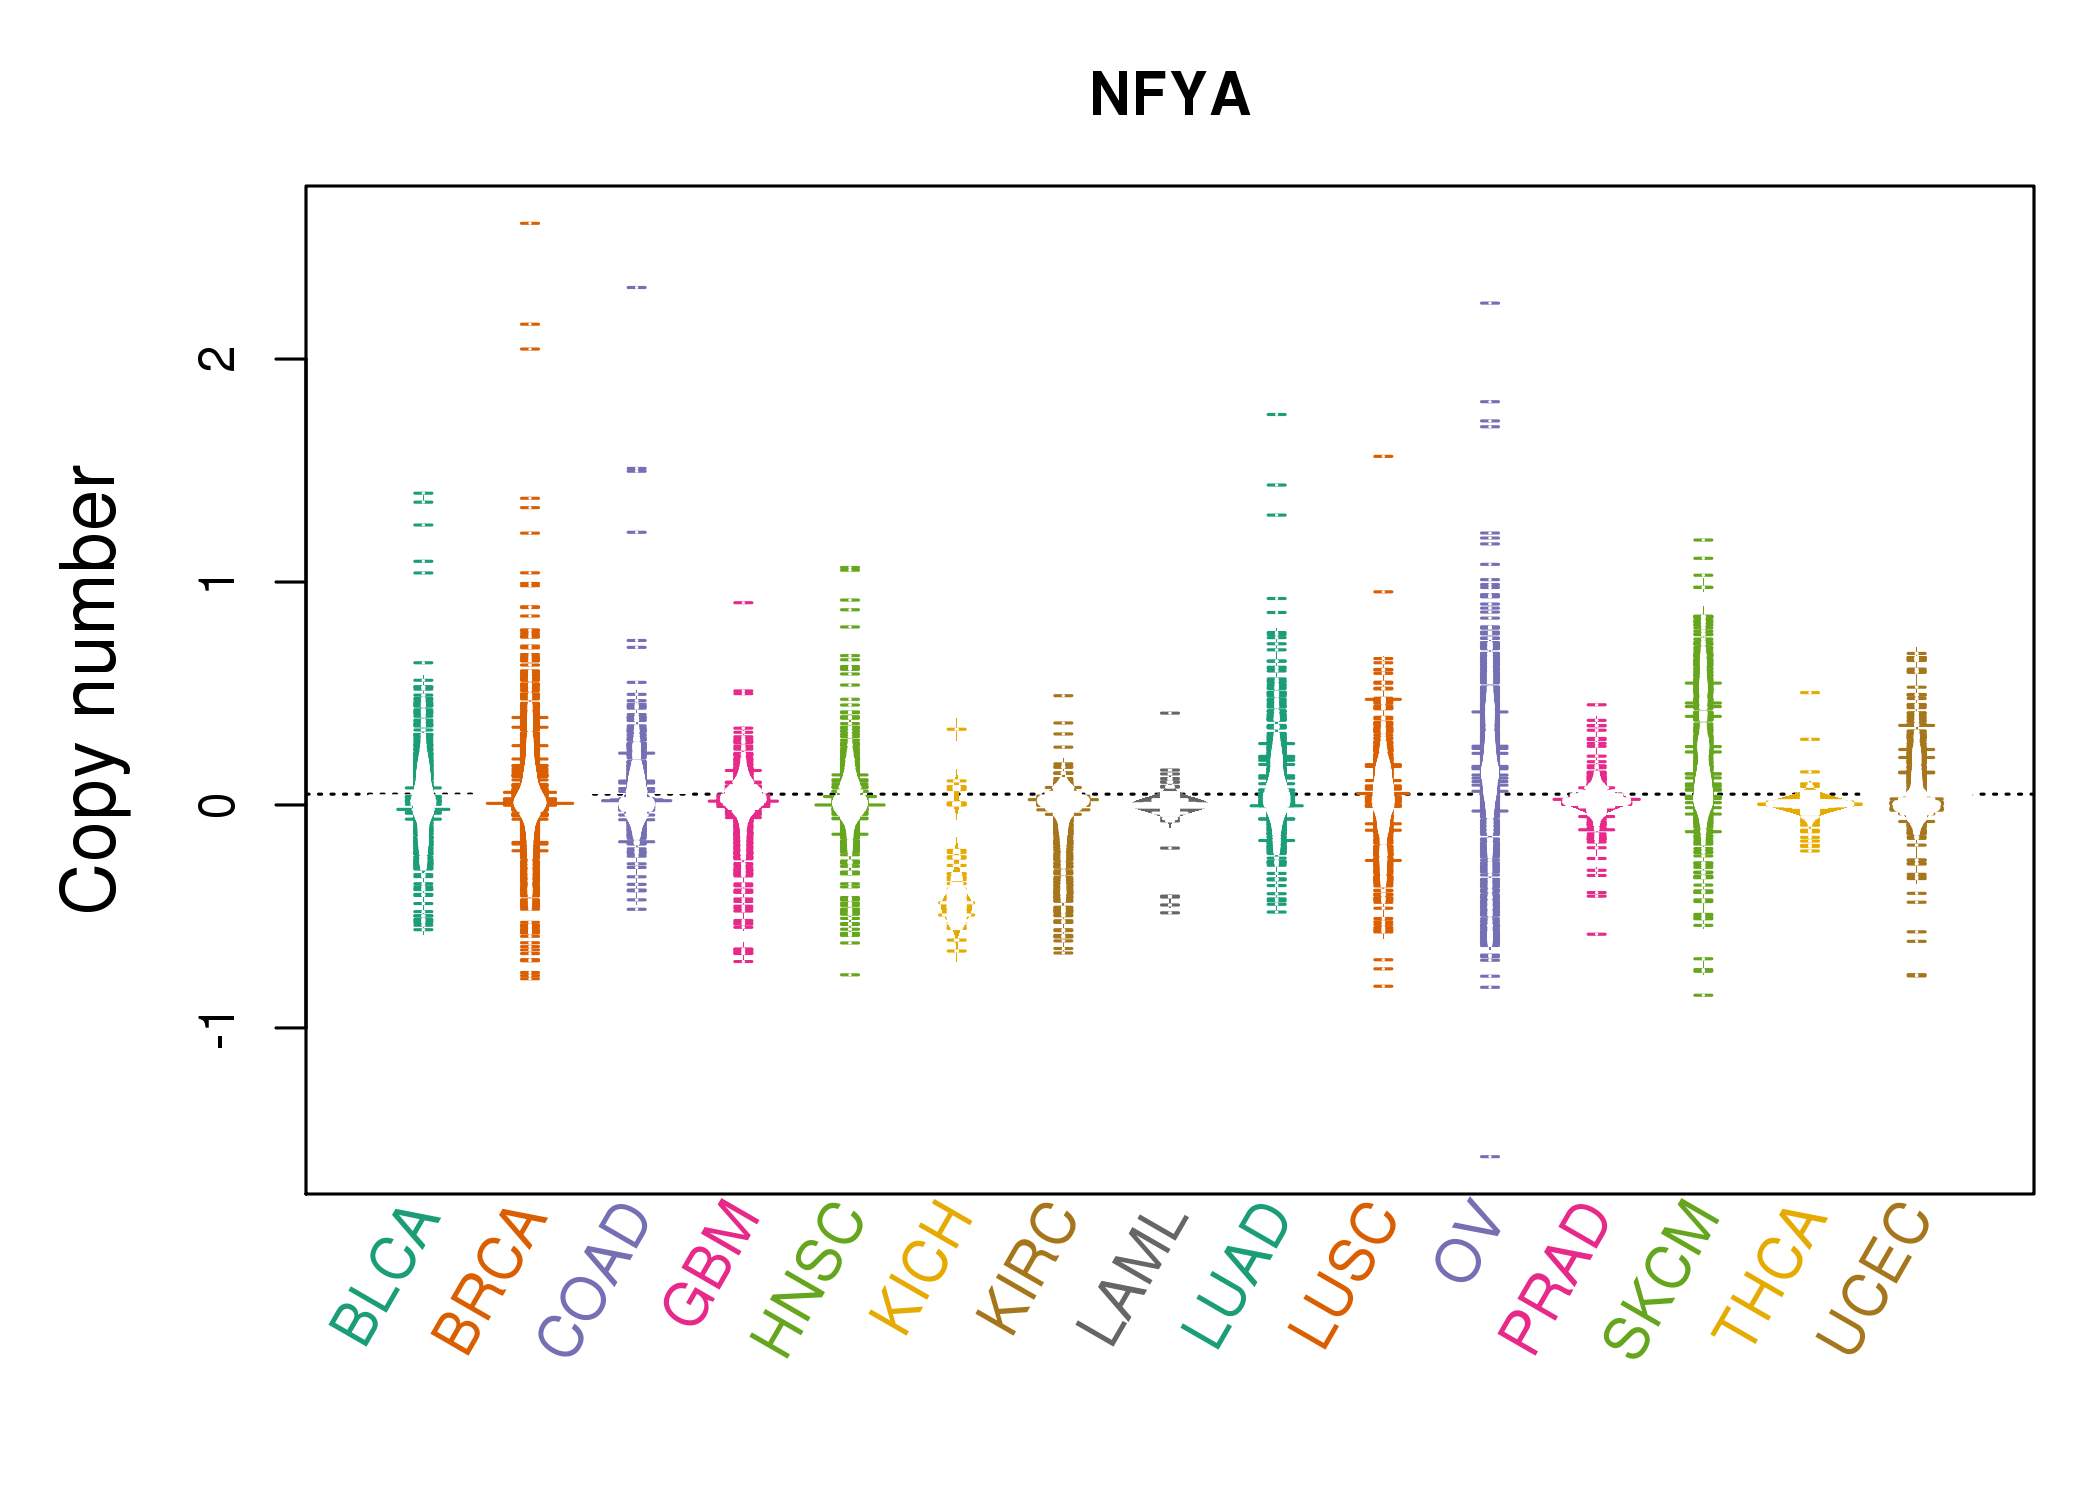 |
| cf) Tissue ID[Tissue type]: BLCA[Bladder Urothelial Carcinoma], BRCA[Breast invasive carcinoma], CESC[Cervical squamous cell carcinoma and endocervical adenocarcinoma], COAD[Colon adenocarcinoma], GBM[Glioblastoma multiforme], Glioma Low Grade, HNSC[Head and Neck squamous cell carcinoma], KICH[Kidney Chromophobe], KIRC[Kidney renal clear cell carcinoma], KIRP[Kidney renal papillary cell carcinoma], LAML[Acute Myeloid Leukemia], LUAD[Lung adenocarcinoma], LUSC[Lung squamous cell carcinoma], OV[Ovarian serous cystadenocarcinoma ], PAAD[Pancreatic adenocarcinoma], PRAD[Prostate adenocarcinoma], SKCM[Skin Cutaneous Melanoma], STAD[Stomach adenocarcinoma], THCA[Thyroid carcinoma], UCEC[Uterine Corpus Endometrial Carcinoma] |
| Top |
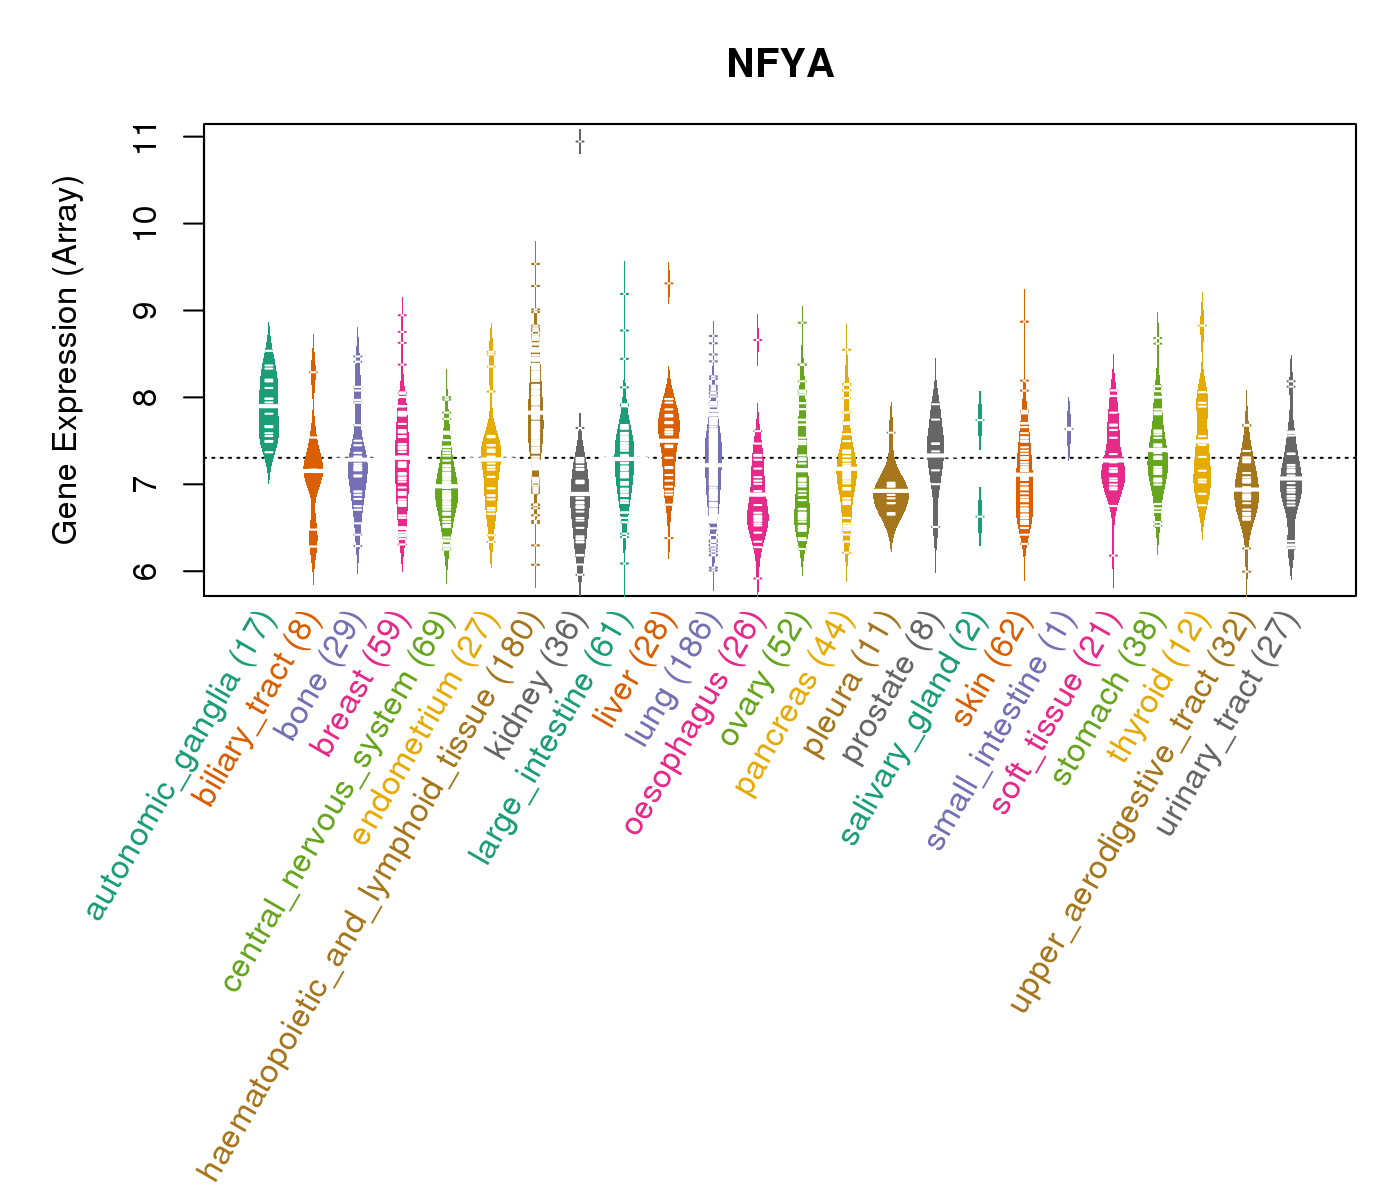
| Gene Expression for NFYA |
| * CCLE gene expression data were extracted from CCLE_Expression_Entrez_2012-10-18.res: Gene-centric RMA-normalized mRNA expression data. |
 |
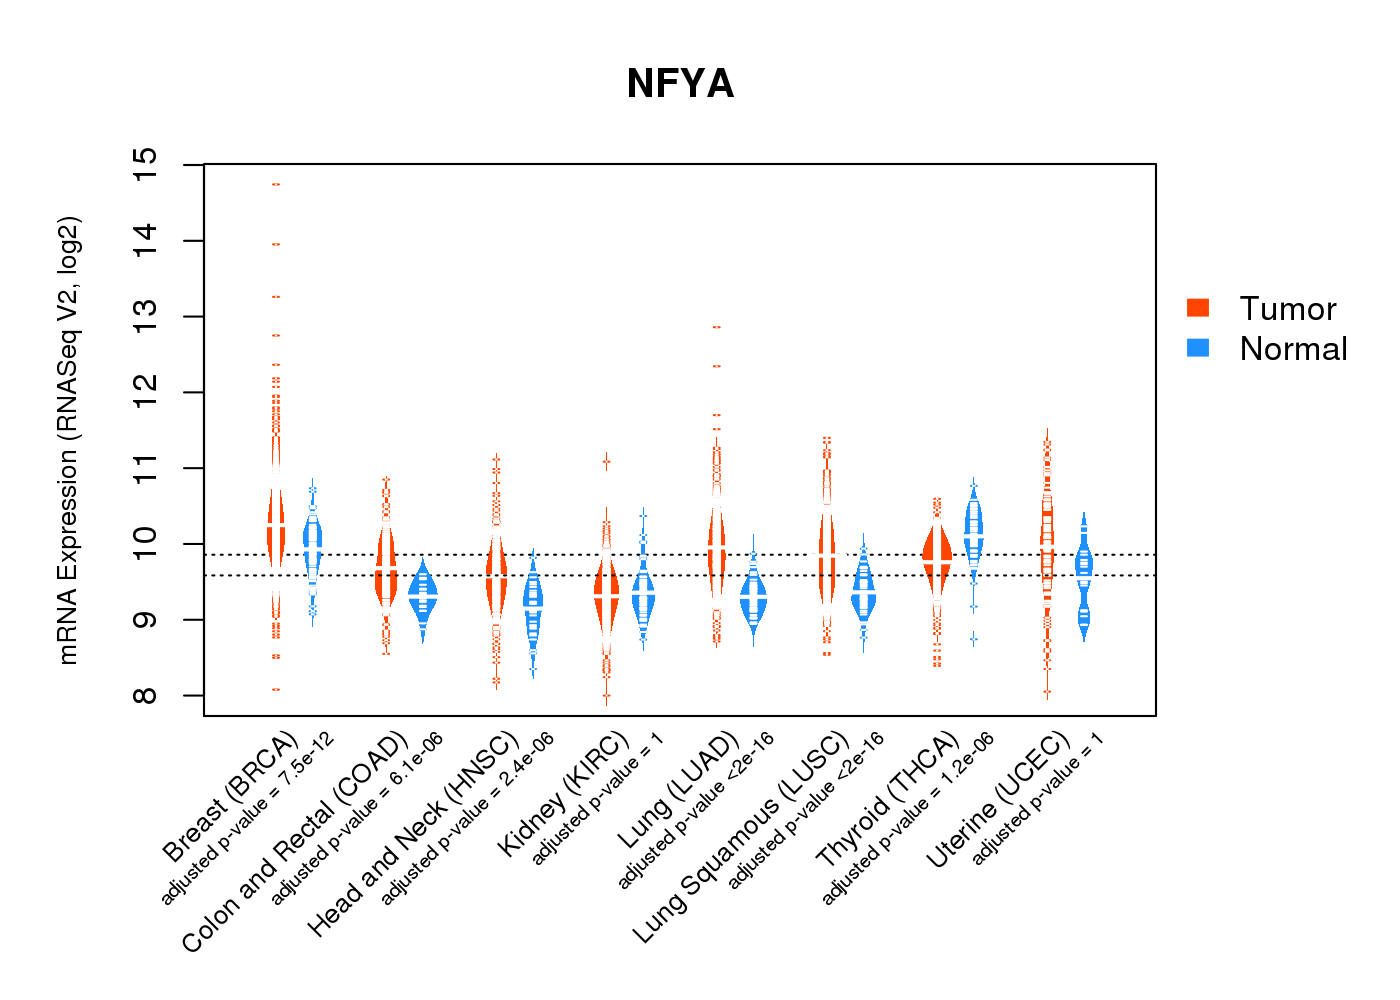
| * Normalized gene expression data of RNASeqV2 was extracted from TCGA using R package TCGA-Assembler. The URLs of all public data files on TCGA DCC data server were gathered at Jan-05-2015. Only eight cancer types have enough normal control samples for differential expression analysis. (t test, adjusted p<0.05 (using Benjamini-Hochberg FDR)) |
 |
| Top |
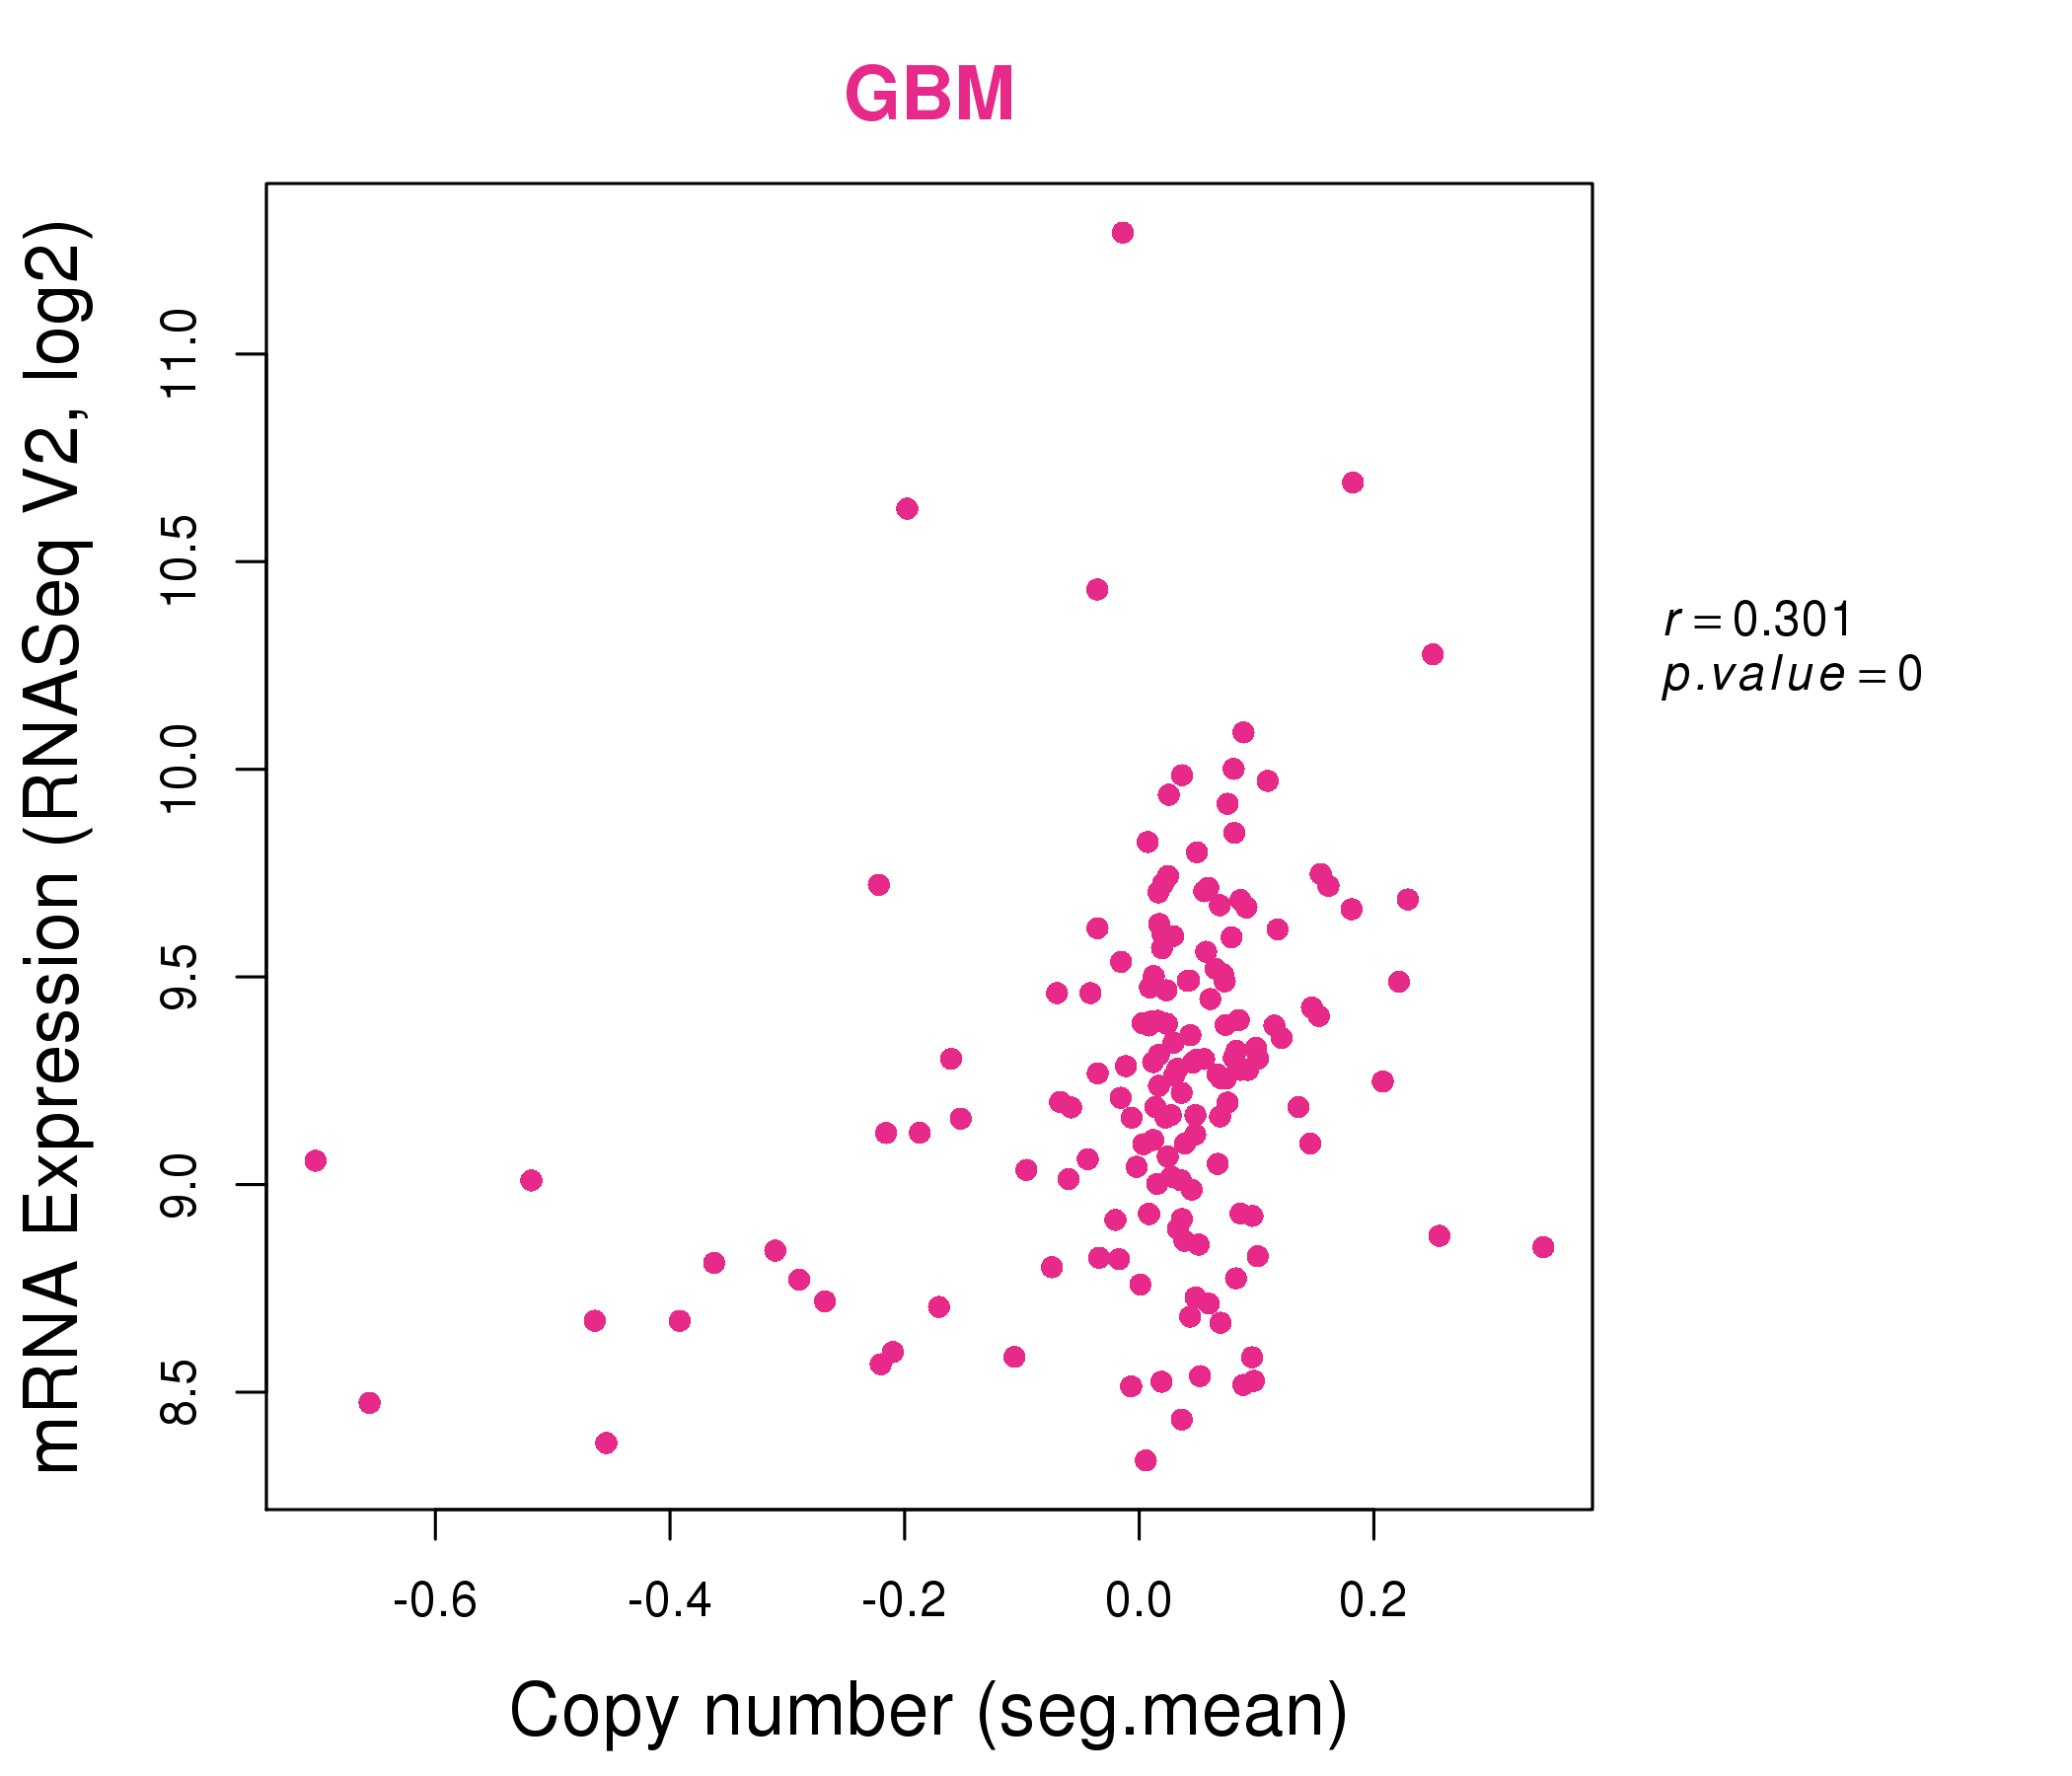
| * This plots show the correlation between CNV and gene expression. |
: Open all plots for all cancer types
 |
|
 |
|

| Top |
| Gene-Gene Network Information |
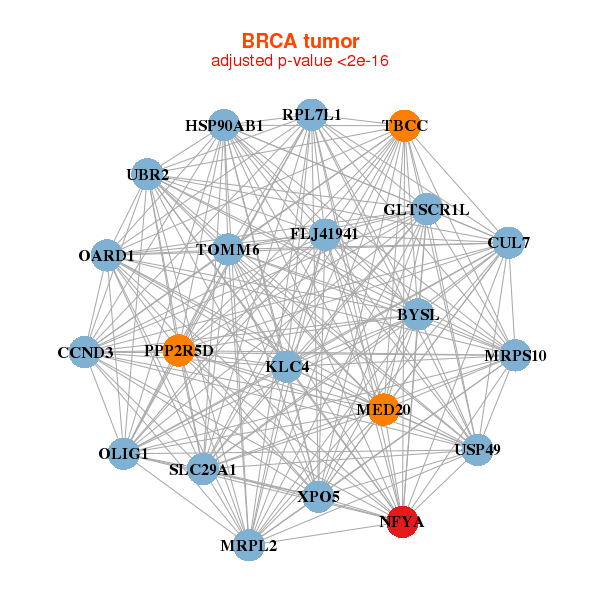
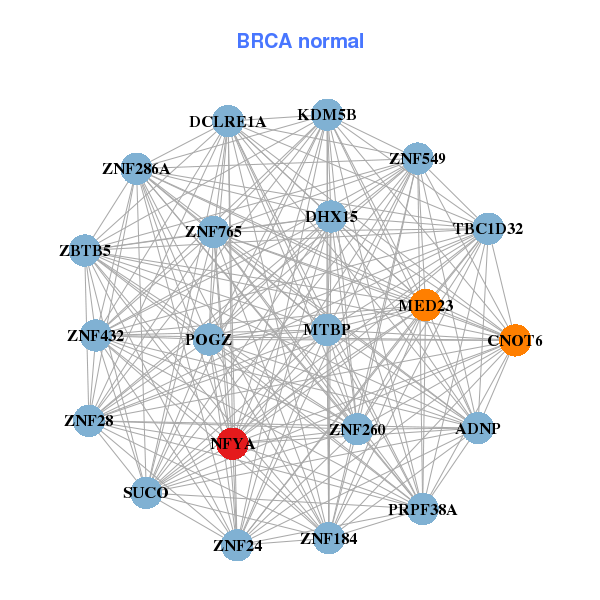
| * Co-Expression network figures were drawn using R package igraph. Only the top 20 genes with the highest correlations were shown. Red circle: input gene, orange circle: cell metabolism gene, sky circle: other gene |
: Open all plots for all cancer types
 |
|
| BYSL,OARD1,CCND3,CUL7,FLJ41941,HSP90AB1,GLTSCR1L, KLC4,MED20,MRPL2,MRPS10,NFYA,OLIG1,PPP2R5D, RPL7L1,SLC29A1,TBCC,TOMM6,UBR2,USP49,XPO5 | ADNP,SUCO,TBC1D32,CNOT6,DCLRE1A,DHX15,KDM5B, MED23,MTBP,NFYA,POGZ,PRPF38A,ZBTB5,ZNF184, ZNF24,ZNF260,ZNF286A,ZNF28,ZNF432,ZNF549,ZNF765 |
 |
|
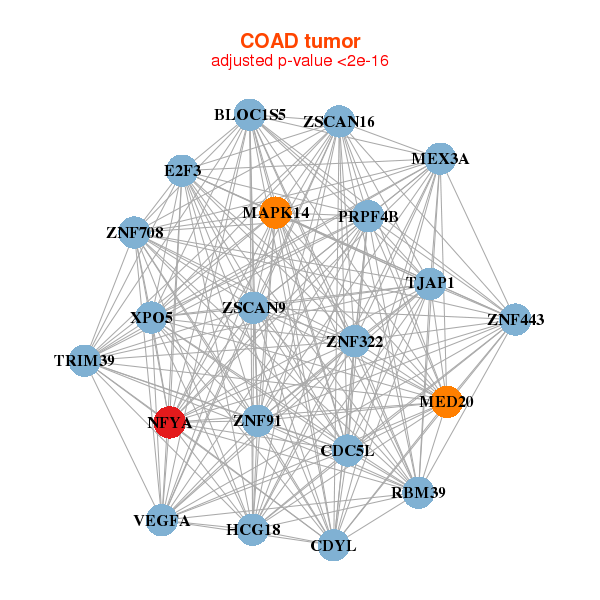
| CDC5L,CDYL,E2F3,HCG18,MAPK14,MED20,MEX3A, BLOC1S5,NFYA,PRPF4B,RBM39,TJAP1,TRIM39,VEGFA, XPO5,ZSCAN9,ZNF322,ZNF443,ZNF708,ZNF91,ZSCAN16 | PROSER1,CASP2,CMTM4,D2HGDH,EXPH5,GRHL2,KIAA1147, LIMD1,MCTP2,MED23,FOXD2-AS1,NFYA,PVRL1,SH3RF2, SYNE2,TLN2,ZBED4,ZBTB10,ZCCHC8,ZDHHC23,ZFP62 |
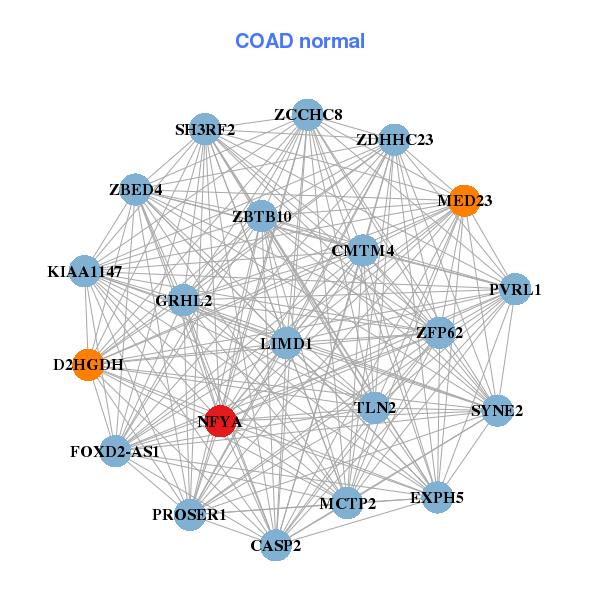
| * Co-Expression network figures were drawn using R package igraph. Only the top 20 genes with the highest correlations were shown. Red circle: input gene, orange circle: cell metabolism gene, sky circle: other gene |
: Open all plots for all cancer types
| Top |
: Open all interacting genes' information including KEGG pathway for all interacting genes from DAVID
| Top |
| Pharmacological Information for NFYA |
| There's no related Drug. |
| Top |
| Cross referenced IDs for NFYA |
| * We obtained these cross-references from Uniprot database. It covers 150 different DBs, 18 categories. http://www.uniprot.org/help/cross_references_section |
: Open all cross reference information
|
Copyright © 2016-Present - The Univsersity of Texas Health Science Center at Houston @ |