|
||||||||||||||||||||
| |
| Phenotypic Information (metabolism pathway, cancer, disease, phenome) |
| |
| |
| Gene-Gene Network Information: Co-Expression Network, Interacting Genes & KEGG |
| |
|


| Gene Summary for NME3 |
| Basic gene info. | Gene symbol | NME3 |
| Gene name | NME/NM23 nucleoside diphosphate kinase 3 | |
| Synonyms | DR-nm23|NDPK-C|NDPKC|NM23-H3|NM23H3|c371H6.2 | |
| Cytomap | UCSC genome browser: 16q13.3 | |
| Genomic location | chr16 :1820320-1821710 | |
| Type of gene | protein-coding | |
| RefGenes | NM_002513.2, | |
| Ensembl id | ENSG00000103024 | |
| Description | NDK 3NDP kinase 3NDP kinase Cnon-metastatic cells 3, protein expressed innucleoside diphosphate kinase 3nucleoside diphosphate kinase C | |
| Modification date | 20141207 | |
| dbXrefs | MIM : 601817 | |
| HGNC : HGNC | ||
| Ensembl : ENSG00000103024 | ||
| HPRD : 03488 | ||
| Vega : OTTHUMG00000128635 | ||
| Protein | UniProt: go to UniProt's Cross Reference DB Table | |
| Expression | CleanEX: HS_NME3 | |
| BioGPS: 4832 | ||
| Gene Expression Atlas: ENSG00000103024 | ||
| The Human Protein Atlas: ENSG00000103024 | ||
| Pathway | NCI Pathway Interaction Database: NME3 | |
| KEGG: NME3 | ||
| REACTOME: NME3 | ||
| ConsensusPathDB | ||
| Pathway Commons: NME3 | ||
| Metabolism | MetaCyc: NME3 | |
| HUMANCyc: NME3 | ||
| Regulation | Ensembl's Regulation: ENSG00000103024 | |
| miRBase: chr16 :1,820,320-1,821,710 | ||
| TargetScan: NM_002513 | ||
| cisRED: ENSG00000103024 | ||
| Context | iHOP: NME3 | |
| cancer metabolism search in PubMed: NME3 | ||
| UCL Cancer Institute: NME3 | ||
| Assigned class in ccmGDB | C | |
| Top |
| Phenotypic Information for NME3(metabolism pathway, cancer, disease, phenome) |
| Cancer | CGAP: NME3 |
| Familial Cancer Database: NME3 | |
| * This gene is included in those cancer gene databases. |
|
|
|
|
|
| . | ||||||||||||||
Oncogene 1 | Significant driver gene in | |||||||||||||||||||
| cf) number; DB name 1 Oncogene; http://nar.oxfordjournals.org/content/35/suppl_1/D721.long, 2 Tumor Suppressor gene; https://bioinfo.uth.edu/TSGene/, 3 Cancer Gene Census; http://www.nature.com/nrc/journal/v4/n3/abs/nrc1299.html, 4 CancerGenes; http://nar.oxfordjournals.org/content/35/suppl_1/D721.long, 5 Network of Cancer Gene; http://ncg.kcl.ac.uk/index.php, 1Therapeutic Vulnerabilities in Cancer; http://cbio.mskcc.org/cancergenomics/statius/ |
| KEGG_PURINE_METABOLISM KEGG_PYRIMIDINE_METABOLISM | |
| OMIM | |
| Orphanet | |
| Disease | KEGG Disease: NME3 |
| MedGen: NME3 (Human Medical Genetics with Condition) | |
| ClinVar: NME3 | |
| Phenotype | MGI: NME3 (International Mouse Phenotyping Consortium) |
| PhenomicDB: NME3 | |
| Mutations for NME3 |
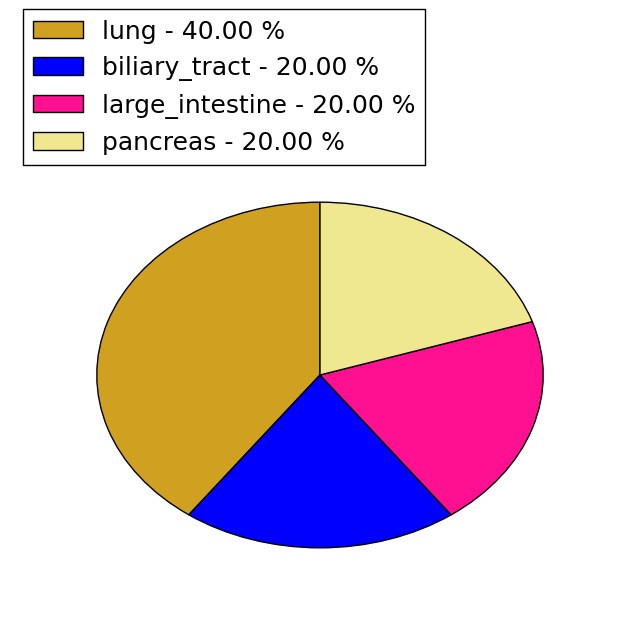
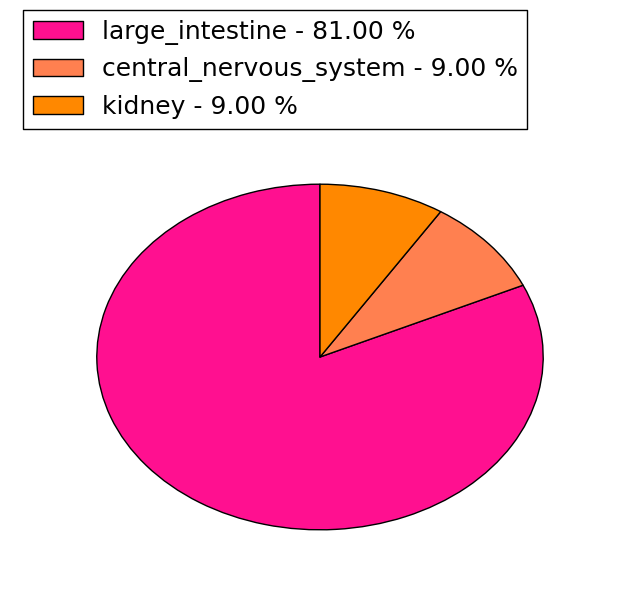
| * Under tables are showing count per each tissue to give us broad intuition about tissue specific mutation patterns.You can go to the detailed page for each mutation database's web site. |
| There's no structural variation information in COSMIC data for this gene. |
| * From mRNA Sanger sequences, Chitars2.0 arranged chimeric transcripts. This table shows NME3 related fusion information. |
| ID | Head Gene | Tail Gene | Accession | Gene_a | qStart_a | qEnd_a | Chromosome_a | tStart_a | tEnd_a | Gene_a | qStart_a | qEnd_a | Chromosome_a | tStart_a | tEnd_a |
| AA688018 | CTDSPL2 | 17 | 37 | 15 | 44738895 | 44738915 | NME3 | 28 | 216 | 16 | 1820321 | 1820511 | |
| Top |
| There's no copy number variation information in COSMIC data for this gene. |
| Top |
|
 |
| Top |
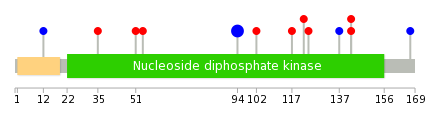
| Stat. for Non-Synonymous SNVs (# total SNVs=5) | (# total SNVs=11) |
 |  |
(# total SNVs=0) | (# total SNVs=0) |
| Top |
| * When you move the cursor on each content, you can see more deailed mutation information on the Tooltip. Those are primary_site,primary_histology,mutation(aa),pubmedID. |
| GRCh37 position | Mutation(aa) | Unique sampleID count |
| chr16:1820992-1820992 | p.V94V | 11 |
| chr16:1820659-1820659 | p.L167L | 1 |
| chr16:1821306-1821306 | p.K51R | 1 |
| chr16:1820734-1820734 | p.S142R | 1 |
| chr16:1821355-1821355 | p.R35W | 1 |
| chr16:1820735-1820735 | p.S142N | 1 |
| chr16:1821500-1821500 | p.L12L | 1 |
| chr16:1820749-1820749 | p.S137S | 1 |
| chr16:1820904-1820904 | p.D124Y | 1 |
| chr16:1820909-1820909 | p.R122H | 1 |
| Top |
|
 |
| Point Mutation/ Tissue ID | 1 | 2 | 3 | 4 | 5 | 6 | 7 | 8 | 9 | 10 | 11 | 12 | 13 | 14 | 15 | 16 | 17 | 18 | 19 | 20 |
| # sample | 1 | 1 | 1 | |||||||||||||||||
| # mutation | 1 | 1 | 1 | |||||||||||||||||
| nonsynonymous SNV | 1 | 1 | ||||||||||||||||||
| synonymous SNV | 1 |
| cf) Tissue ID; Tissue type (1; BLCA[Bladder Urothelial Carcinoma], 2; BRCA[Breast invasive carcinoma], 3; CESC[Cervical squamous cell carcinoma and endocervical adenocarcinoma], 4; COAD[Colon adenocarcinoma], 5; GBM[Glioblastoma multiforme], 6; Glioma Low Grade, 7; HNSC[Head and Neck squamous cell carcinoma], 8; KICH[Kidney Chromophobe], 9; KIRC[Kidney renal clear cell carcinoma], 10; KIRP[Kidney renal papillary cell carcinoma], 11; LAML[Acute Myeloid Leukemia], 12; LUAD[Lung adenocarcinoma], 13; LUSC[Lung squamous cell carcinoma], 14; OV[Ovarian serous cystadenocarcinoma ], 15; PAAD[Pancreatic adenocarcinoma], 16; PRAD[Prostate adenocarcinoma], 17; SKCM[Skin Cutaneous Melanoma], 18:STAD[Stomach adenocarcinoma], 19:THCA[Thyroid carcinoma], 20:UCEC[Uterine Corpus Endometrial Carcinoma]) |
| Top |
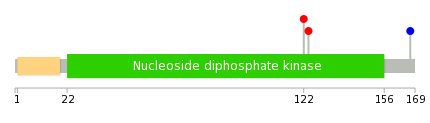
| * We represented just top 10 SNVs. When you move the cursor on each content, you can see more deailed mutation information on the Tooltip. Those are primary_site, primary_histology, mutation(aa), pubmedID. |
| Genomic Position | Mutation(aa) | Unique sampleID count |
| chr16:1820659 | p.D124Y | 1 |
| chr16:1820904 | p.R122H | 1 |
| chr16:1820909 | p.L167L | 1 |
| * Copy number data were extracted from TCGA using R package TCGA-Assembler. The URLs of all public data files on TCGA DCC data server were gathered on Jan-05-2015. Function ProcessCNAData in TCGA-Assembler package was used to obtain gene-level copy number value which is calculated as the average copy number of the genomic region of a gene. |
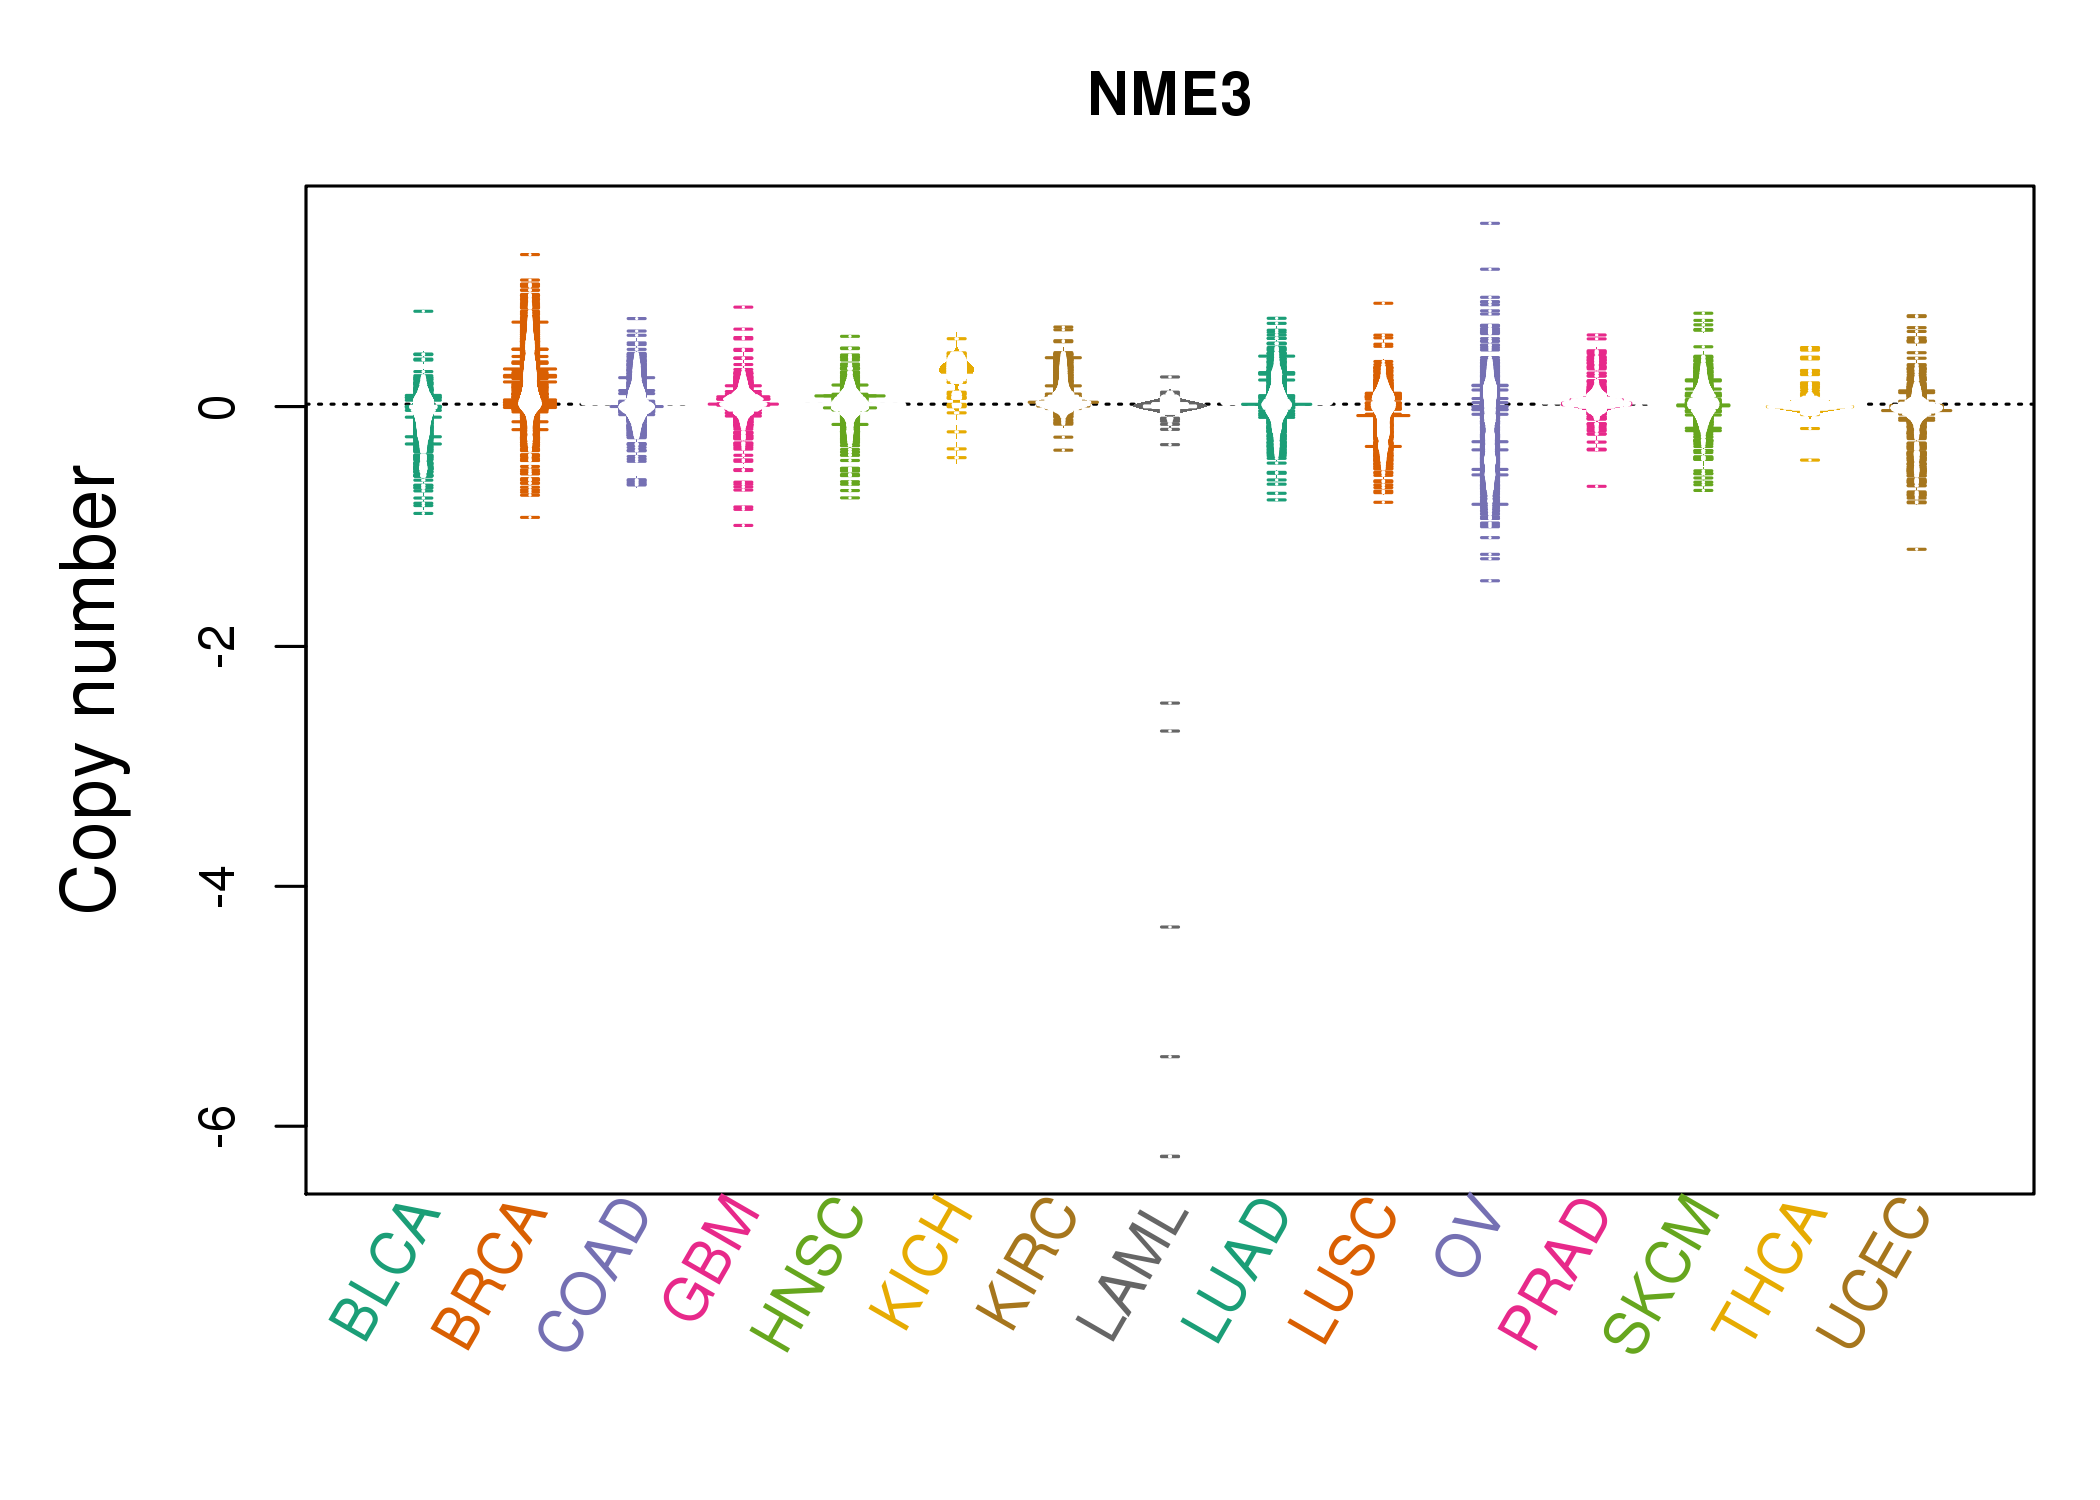 |
| cf) Tissue ID[Tissue type]: BLCA[Bladder Urothelial Carcinoma], BRCA[Breast invasive carcinoma], CESC[Cervical squamous cell carcinoma and endocervical adenocarcinoma], COAD[Colon adenocarcinoma], GBM[Glioblastoma multiforme], Glioma Low Grade, HNSC[Head and Neck squamous cell carcinoma], KICH[Kidney Chromophobe], KIRC[Kidney renal clear cell carcinoma], KIRP[Kidney renal papillary cell carcinoma], LAML[Acute Myeloid Leukemia], LUAD[Lung adenocarcinoma], LUSC[Lung squamous cell carcinoma], OV[Ovarian serous cystadenocarcinoma ], PAAD[Pancreatic adenocarcinoma], PRAD[Prostate adenocarcinoma], SKCM[Skin Cutaneous Melanoma], STAD[Stomach adenocarcinoma], THCA[Thyroid carcinoma], UCEC[Uterine Corpus Endometrial Carcinoma] |
| Top |
| Gene Expression for NME3 |
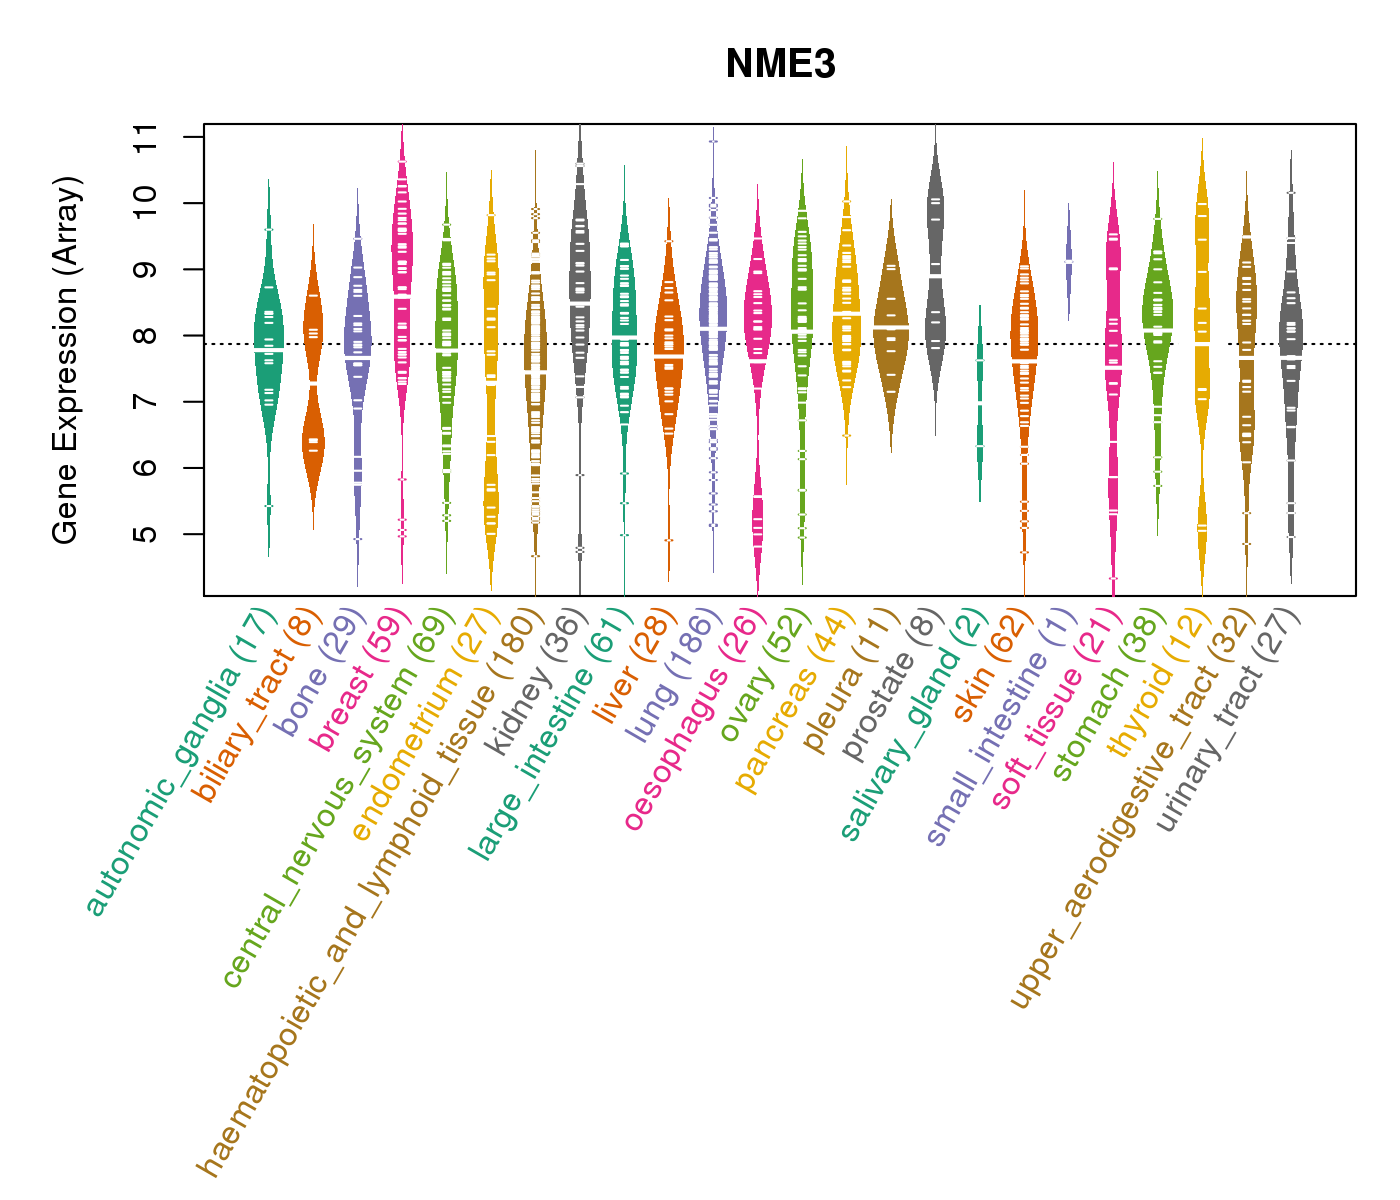
| * CCLE gene expression data were extracted from CCLE_Expression_Entrez_2012-10-18.res: Gene-centric RMA-normalized mRNA expression data. |
 |
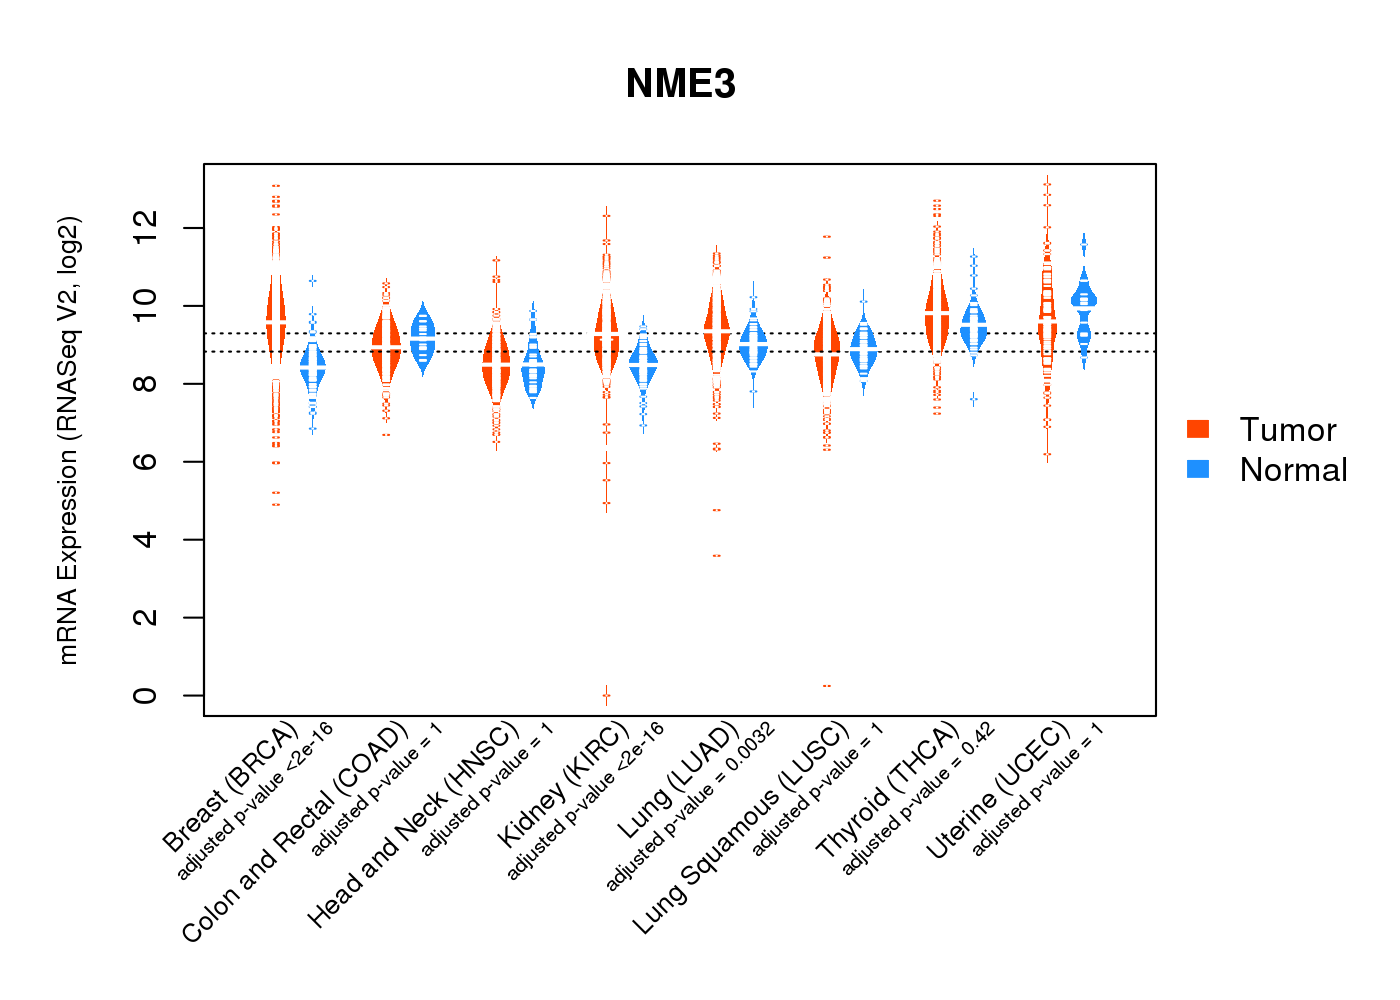
| * Normalized gene expression data of RNASeqV2 was extracted from TCGA using R package TCGA-Assembler. The URLs of all public data files on TCGA DCC data server were gathered at Jan-05-2015. Only eight cancer types have enough normal control samples for differential expression analysis. (t test, adjusted p<0.05 (using Benjamini-Hochberg FDR)) |
 |
| Top |
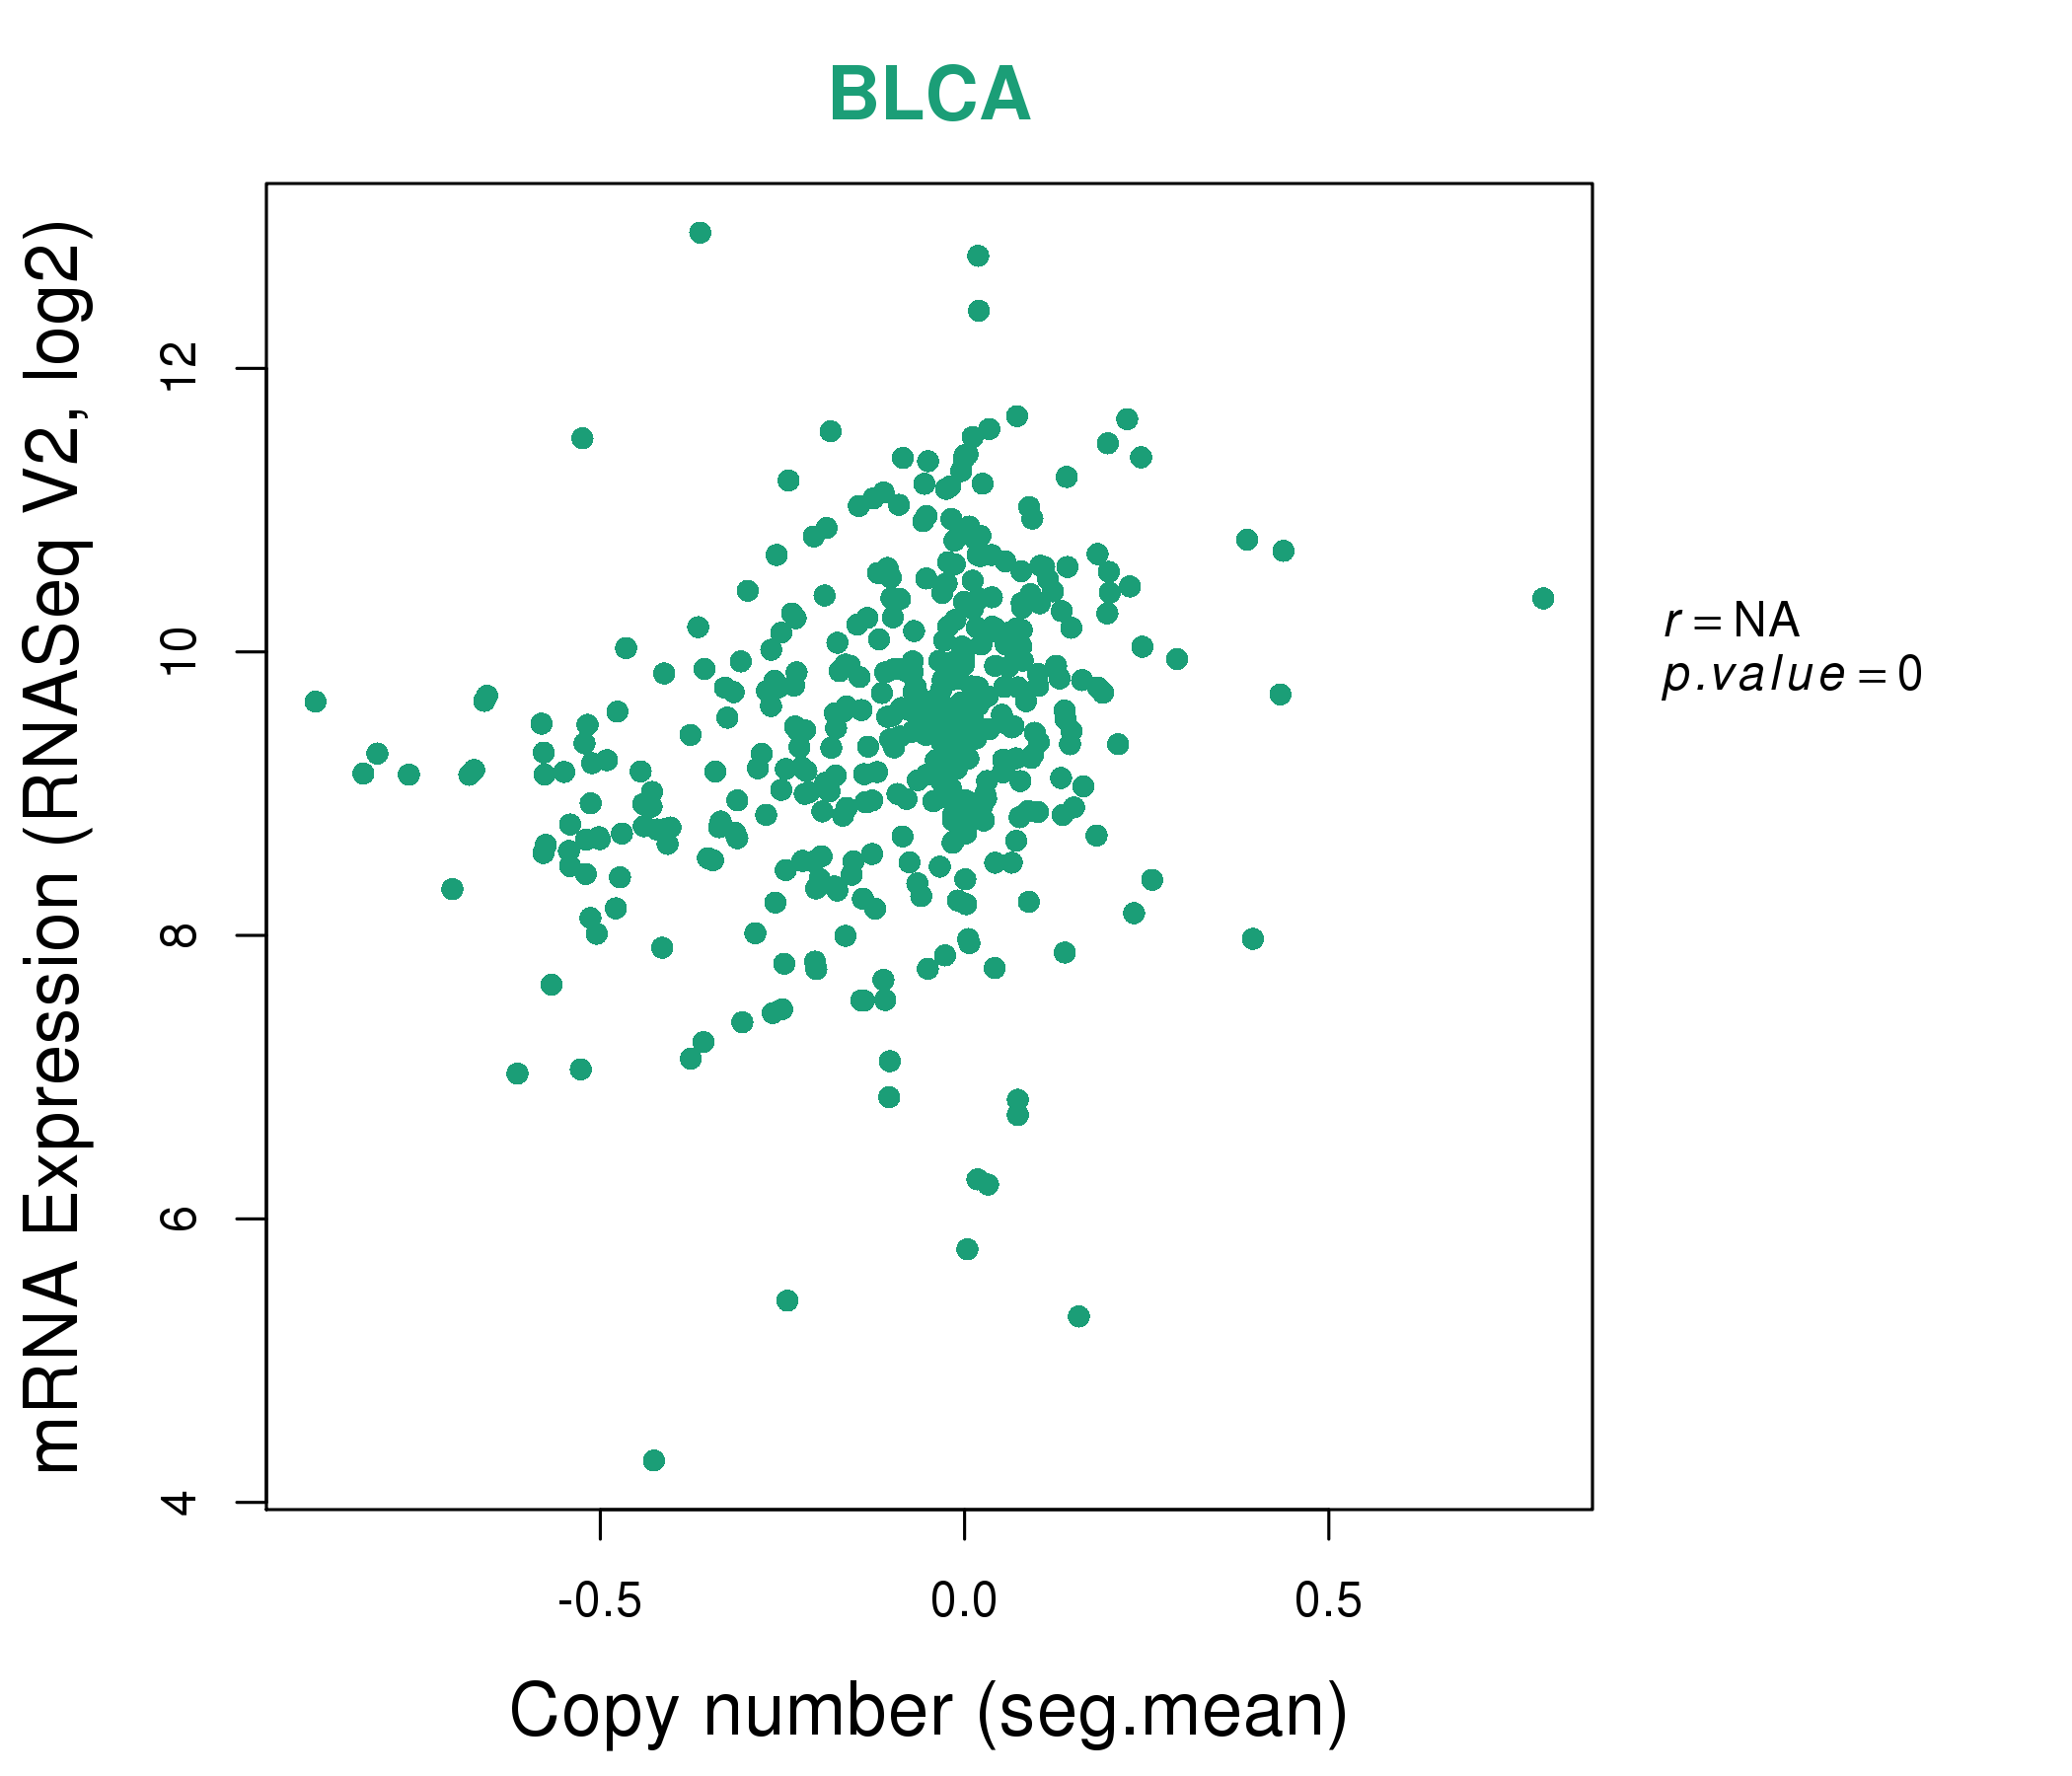
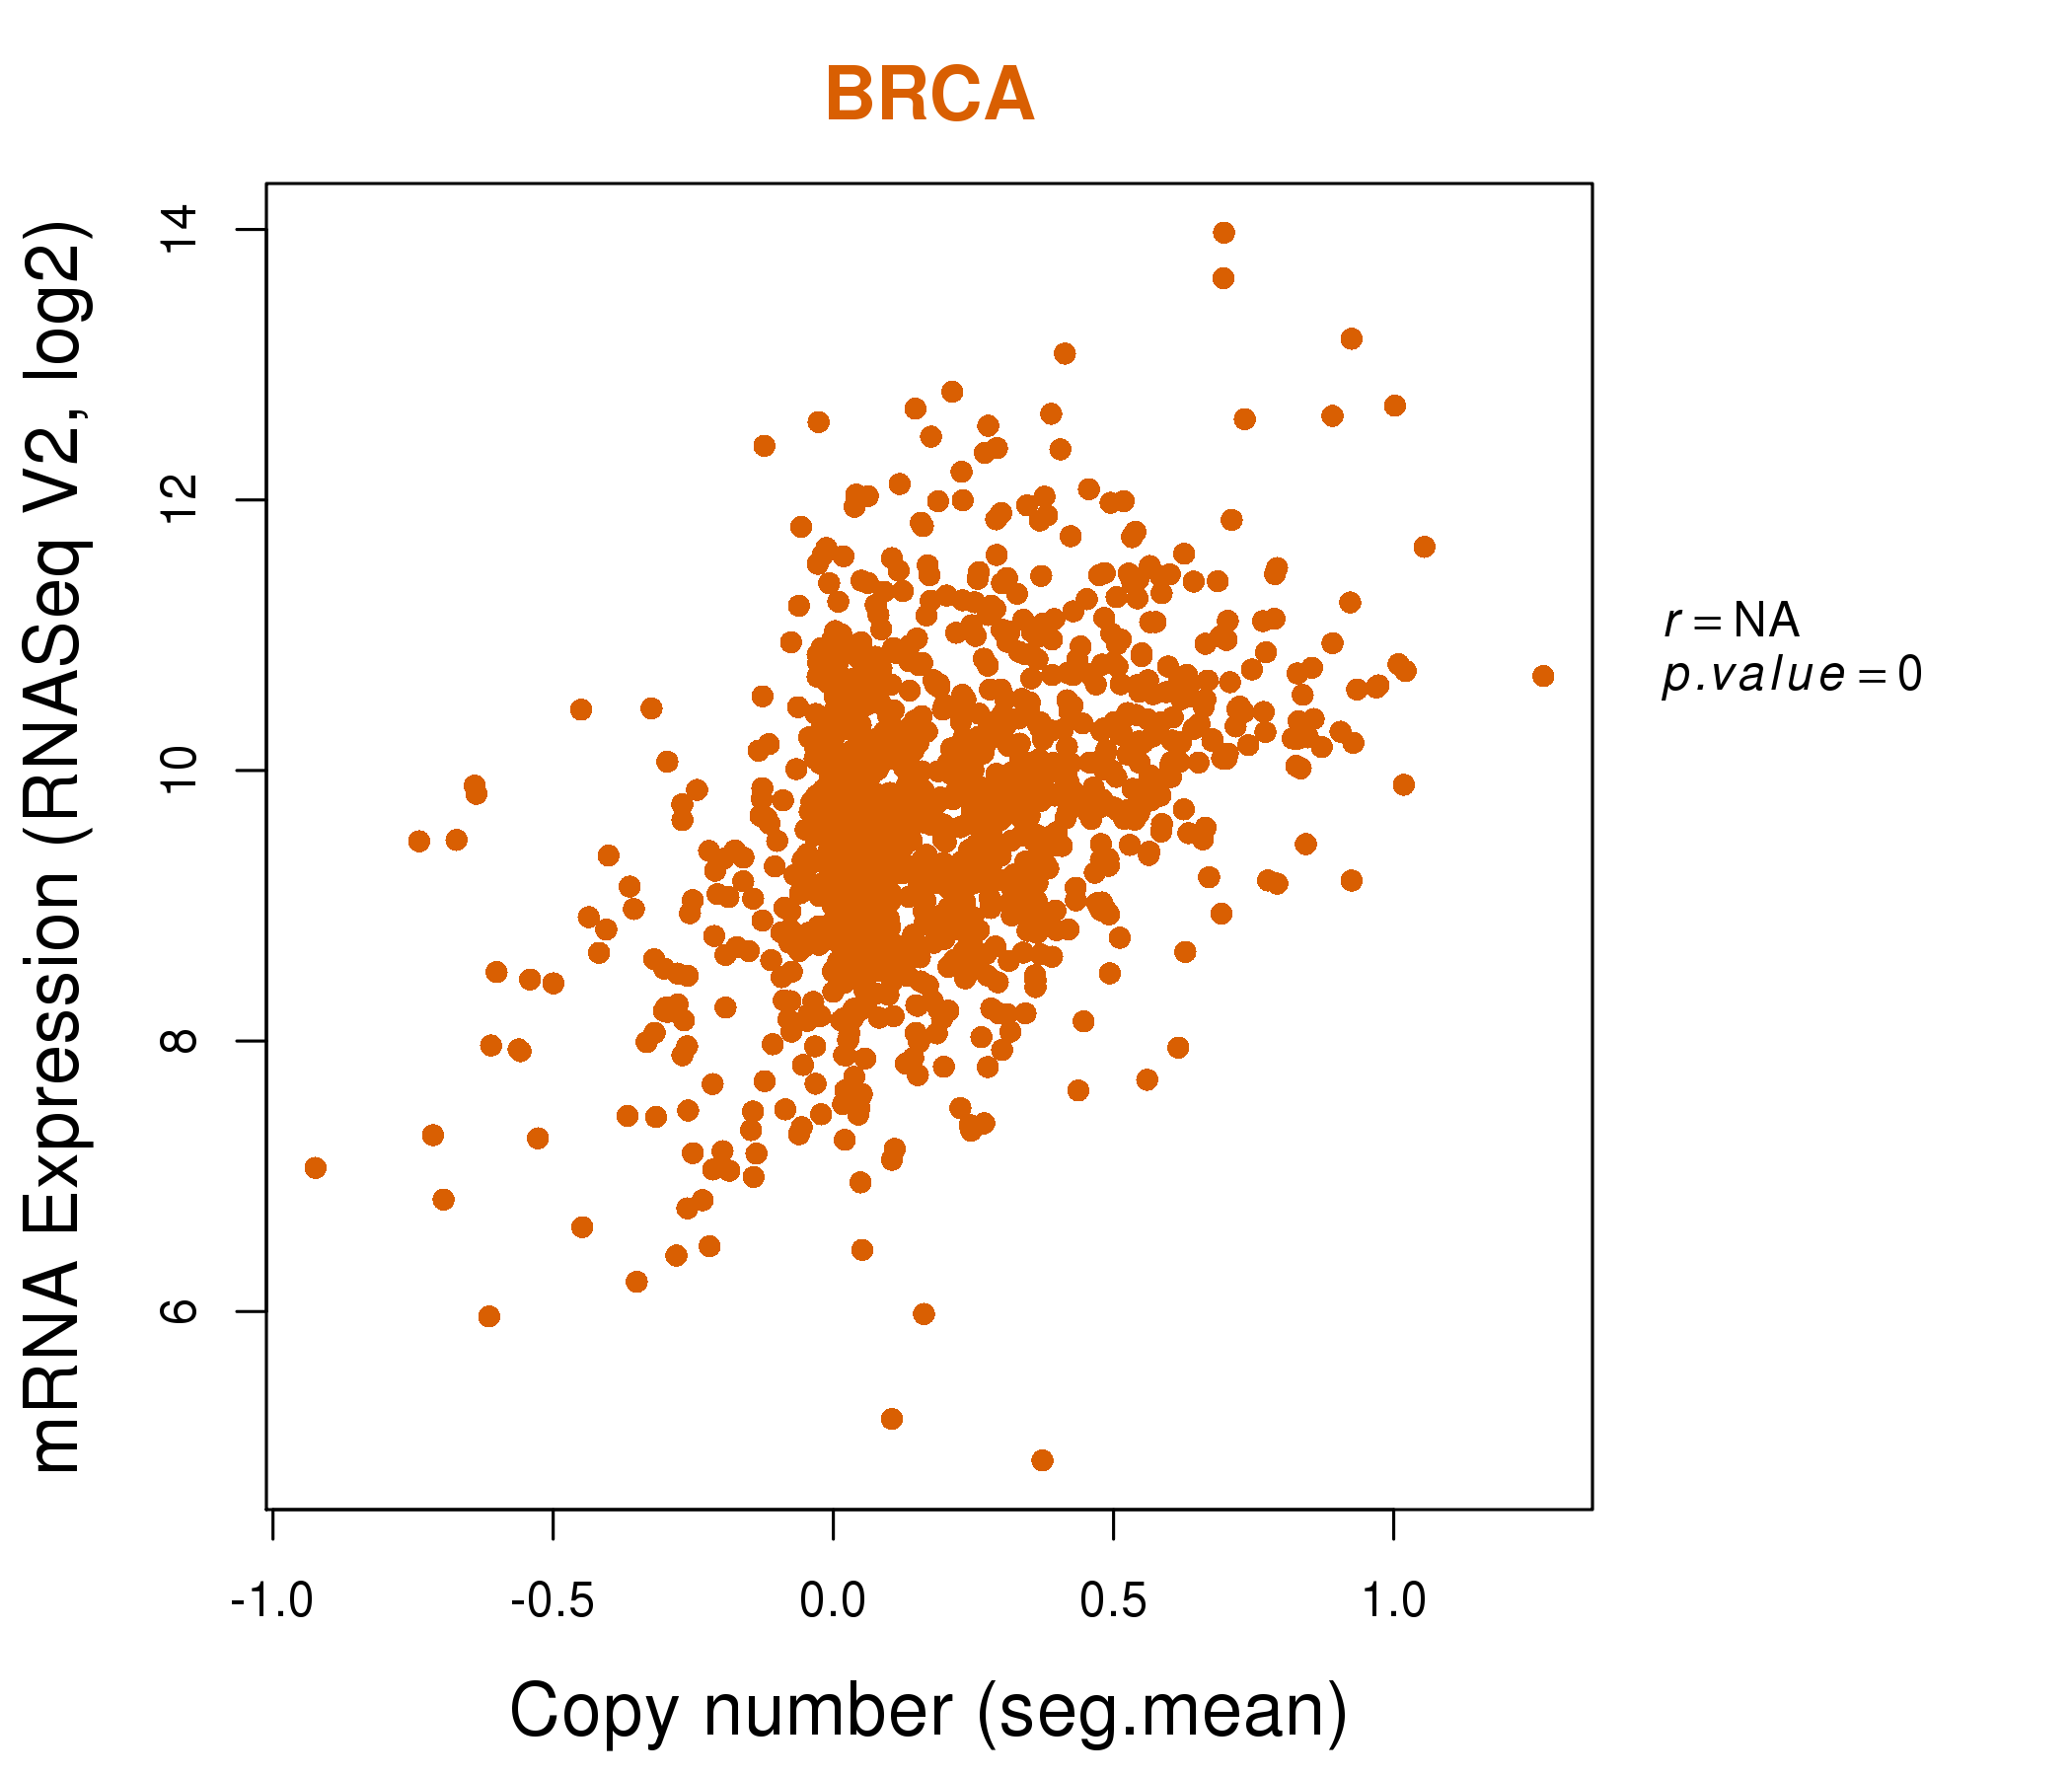
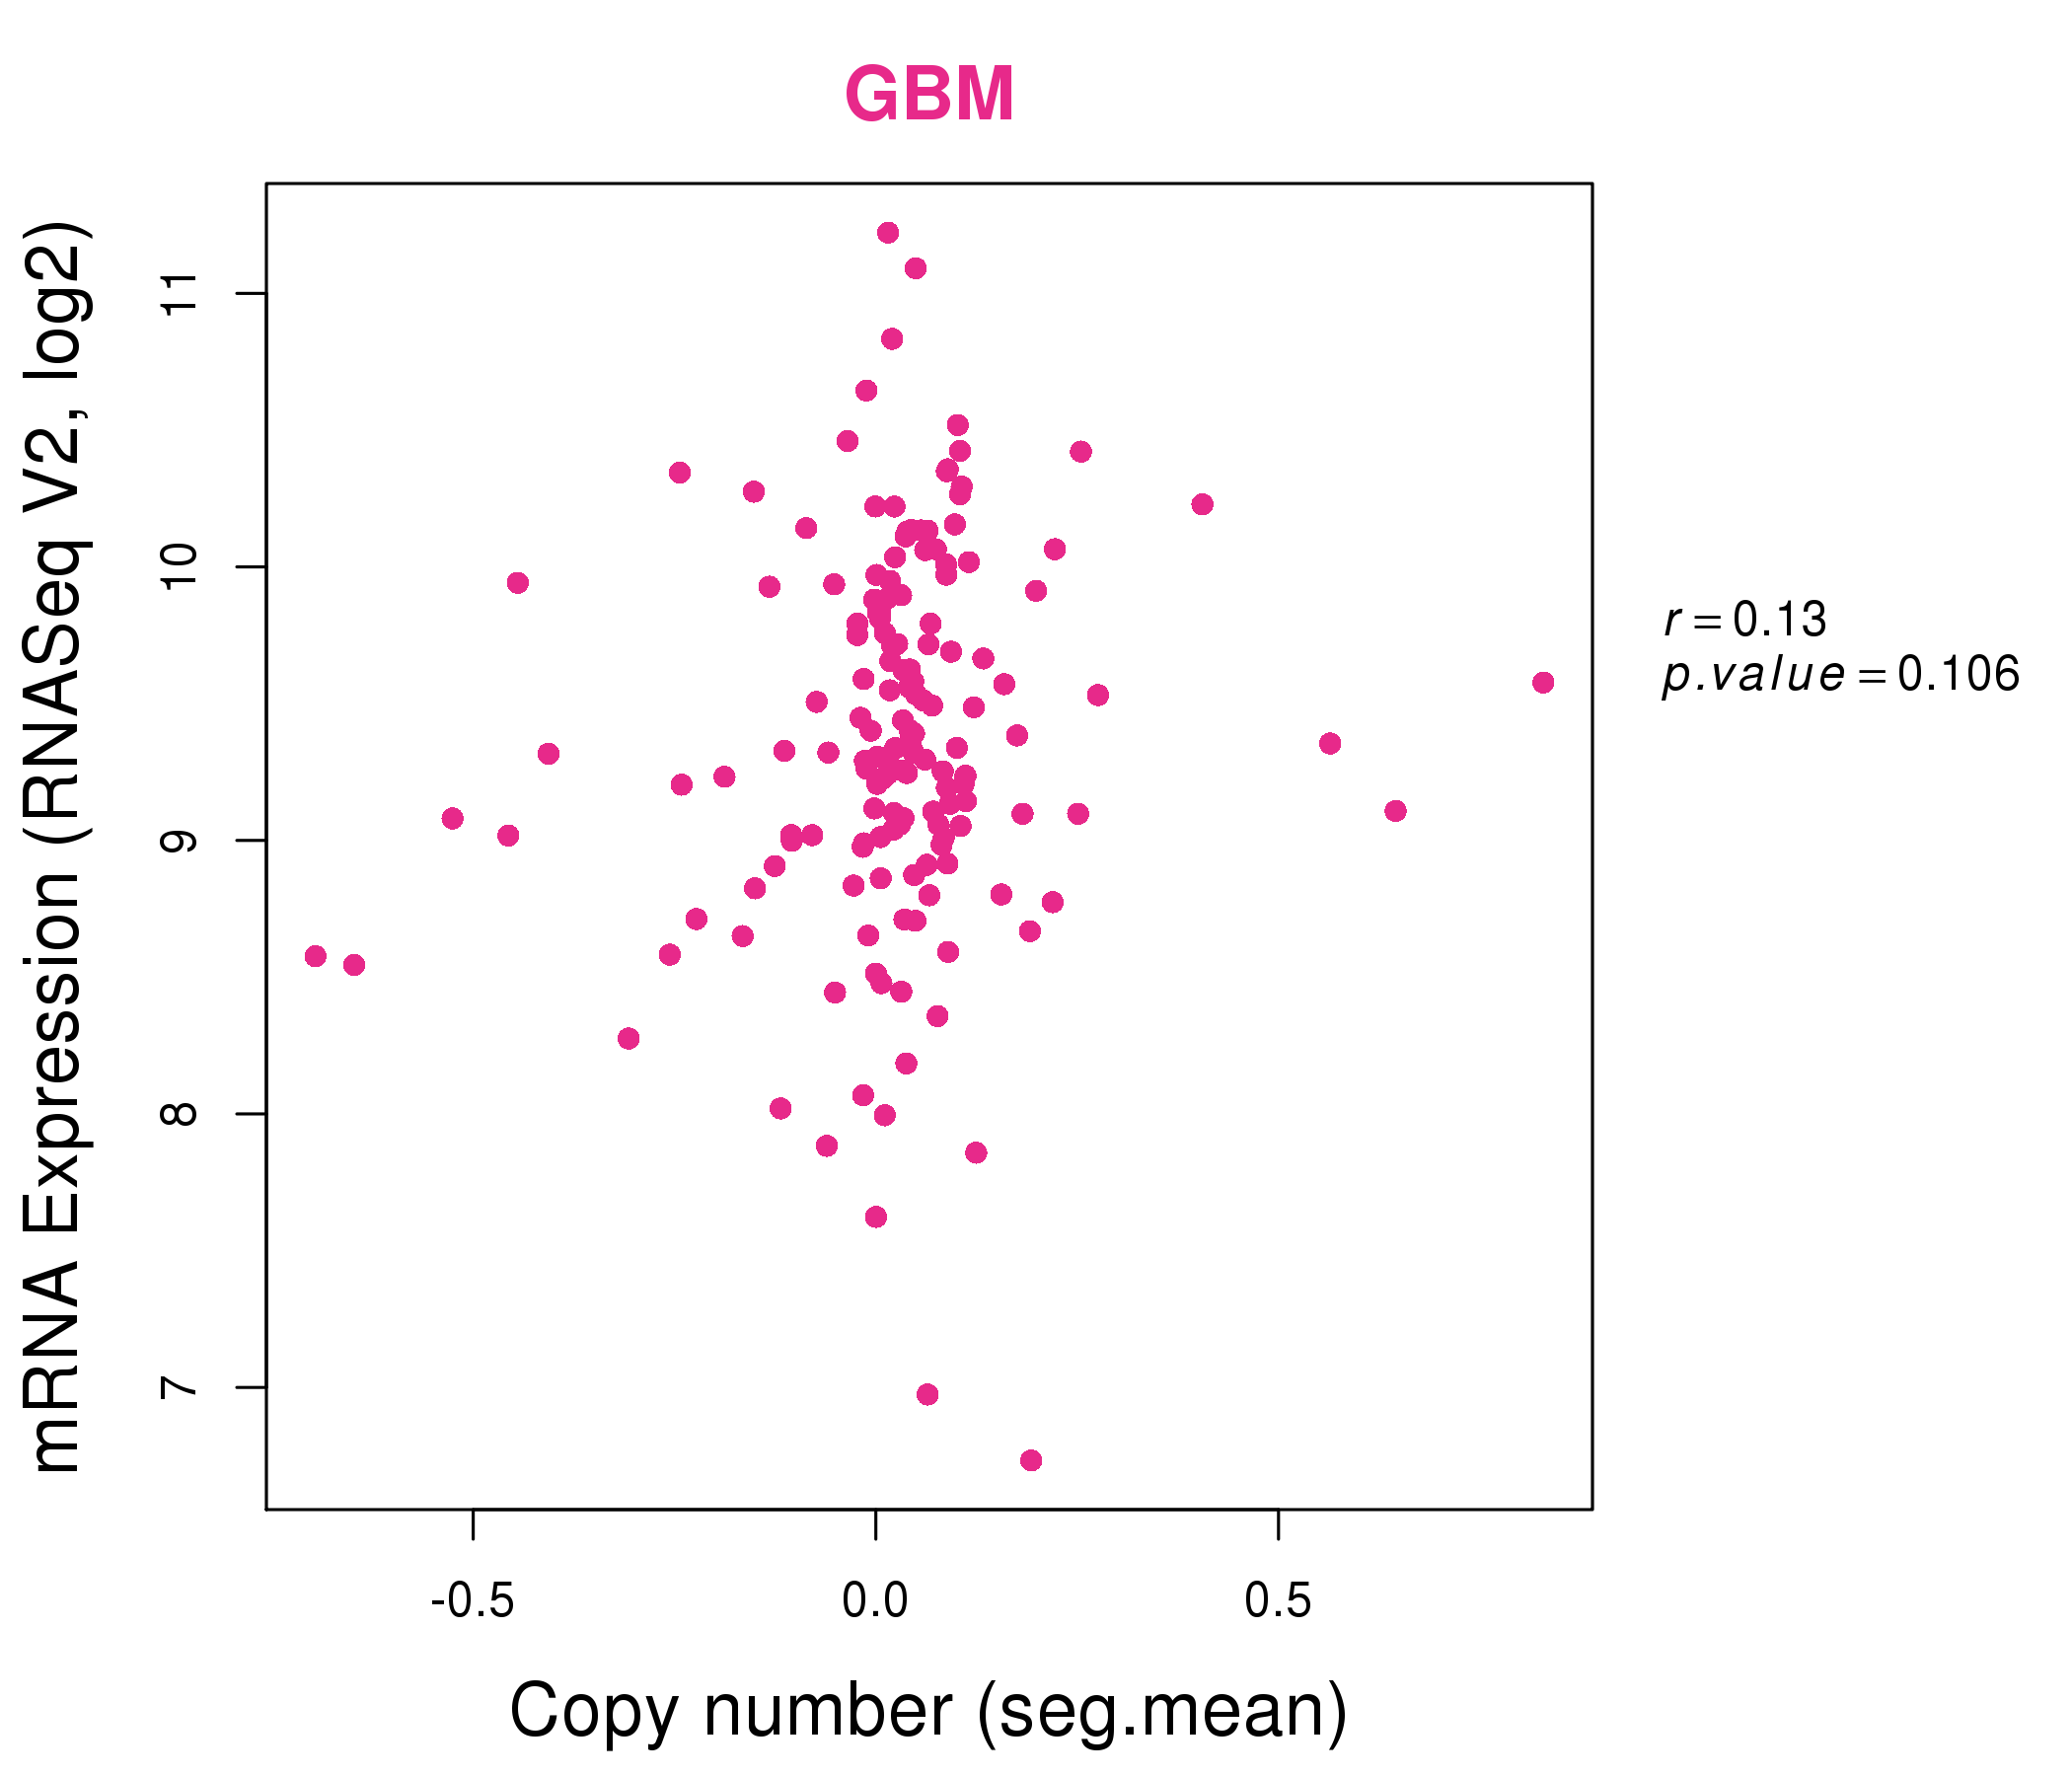
| * This plots show the correlation between CNV and gene expression. |
: Open all plots for all cancer types
 |
|
 |
|
| Top |
| Gene-Gene Network Information |
| * Co-Expression network figures were drawn using R package igraph. Only the top 20 genes with the highest correlations were shown. Red circle: input gene, orange circle: cell metabolism gene, sky circle: other gene |
: Open all plots for all cancer types
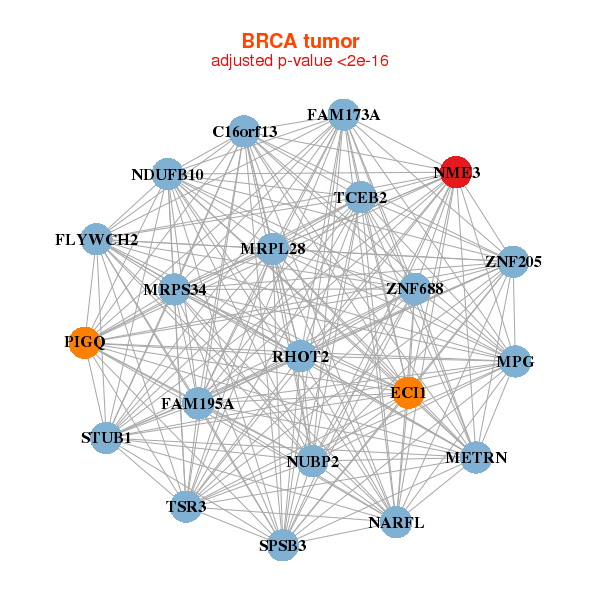 |
|
| C16orf13,TSR3,ECI1,FAM173A,FAM195A,FLYWCH2,METRN, MPG,MRPL28,MRPS34,NARFL,NDUFB10,NME3,NUBP2, PIGQ,RHOT2,SPSB3,STUB1,TCEB2,ZNF205,ZNF688 | C1orf86,PPP1R35,C9orf142,DGCR6L,DPM3,MVB12A,MZT2B, FBXL15,HSPBP1,MPG,NME3,NPDC1,NUBP2,PTRH1, RAB11B,RBM42,SCAND1,SIRT6,SNAPC2,TMUB1,TRAPPC5 |
 |
|
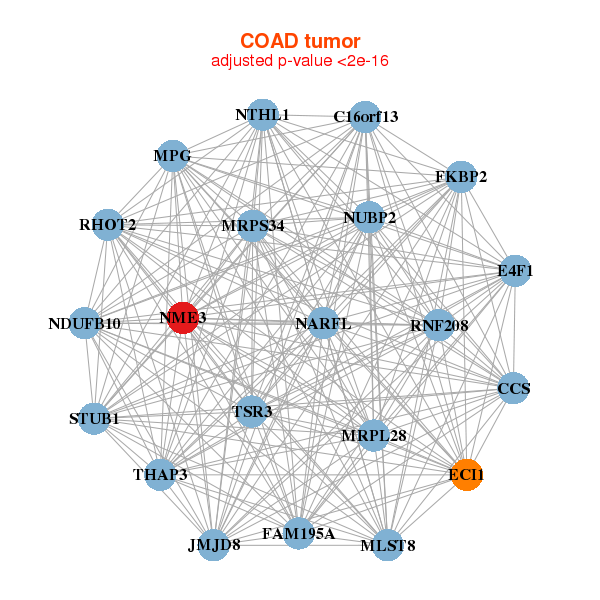
| C16orf13,TSR3,CCS,ECI1,E4F1,FAM195A,FKBP2, JMJD8,MLST8,MPG,MRPL28,MRPS34,NARFL,NDUFB10, NME3,NTHL1,NUBP2,RHOT2,RNF208,STUB1,THAP3 | ALKBH7,APBA3,ATP5G2,C16orf13,C19orf60,C9orf16,DHPS, DRG2,FBXL15,GNPTG,HMG20B,INO80B,MPG,NDUFAF3, NME3,RABAC1,RPL13,RPS15,TRAPPC5,UNC119,ZNF688 |
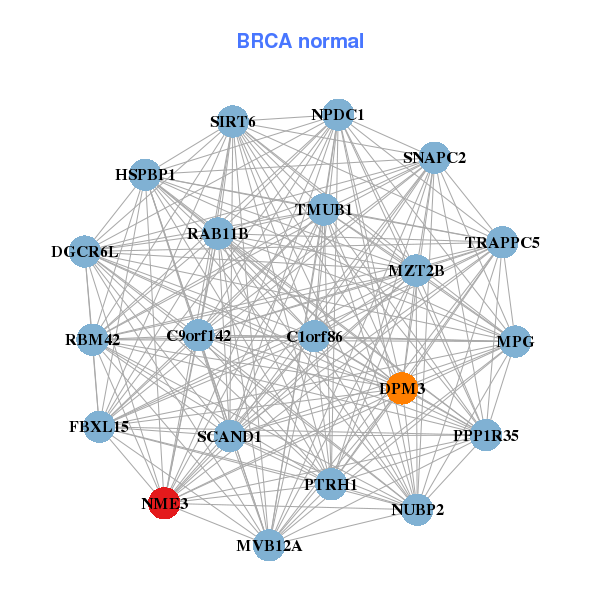
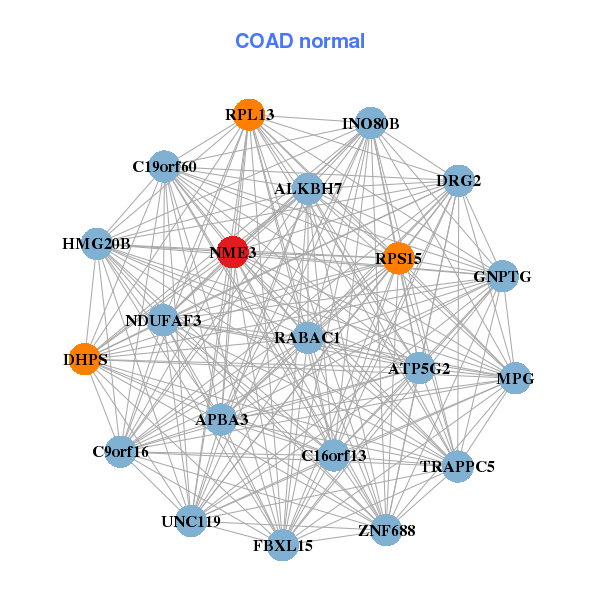
| * Co-Expression network figures were drawn using R package igraph. Only the top 20 genes with the highest correlations were shown. Red circle: input gene, orange circle: cell metabolism gene, sky circle: other gene |
: Open all plots for all cancer types
| Top |
: Open all interacting genes' information including KEGG pathway for all interacting genes from DAVID
| Top |
| Pharmacological Information for NME3 |
| There's no related Drug. |
| Top |
| Cross referenced IDs for NME3 |
| * We obtained these cross-references from Uniprot database. It covers 150 different DBs, 18 categories. http://www.uniprot.org/help/cross_references_section |
: Open all cross reference information
|
Copyright © 2016-Present - The Univsersity of Texas Health Science Center at Houston @ |