|
||||||||||||||||||||||||||||||||||||||||||||||||||||||||||||||||||||||||||||||||||||||||||||||||||||||||||||||||||||||||||||||||||||||||||||||||||||||||||||||||||||||||||||||||||||||||||||||||||||||||||||||||||||||||||||||||||||||||||||||||||||||||||||||||||||||||||||||||||||||||||||||||||||||||||||||||||||||||||
| |
| Phenotypic Information (metabolism pathway, cancer, disease, phenome) |
| |
| |
| Gene-Gene Network Information: Co-Expression Network, Interacting Genes & KEGG |
| |
|


| Gene Summary for CNOT2 |
| Top |
| Phenotypic Information for CNOT2(metabolism pathway, cancer, disease, phenome) |
| Cancer | CGAP: CNOT2 |
| Familial Cancer Database: CNOT2 | |
| * This gene is included in those cancer gene databases. |
|
|
|
|
|
| . | ||||||||||||||||||||||||||||||||||||||||||||||||||||||||||||||||||||||||||||||||||||||||||||||||||||||||||||||||||||||||||||||||||||||||||||||||||||||||||||||||||||||||||||||||||||||||||||||||||||||||||||||||||||||||||||||||||||||||||||||||||||||||||||||||||||||||||||||||||||||||||||||||||||||||||||||||||||
Oncogene 1 | Significant driver gene in | |||||||||||||||||||||||||||||||||||||||||||||||||||||||||||||||||||||||||||||||||||||||||||||||||||||||||||||||||||||||||||||||||||||||||||||||||||||||||||||||||||||||||||||||||||||||||||||||||||||||||||||||||||||||||||||||||||||||||||||||||||||||||||||||||||||||||||||||||||||||||||||||||||||||||||||||||||||||||
| cf) number; DB name 1 Oncogene; http://nar.oxfordjournals.org/content/35/suppl_1/D721.long, 2 Tumor Suppressor gene; https://bioinfo.uth.edu/TSGene/, 3 Cancer Gene Census; http://www.nature.com/nrc/journal/v4/n3/abs/nrc1299.html, 4 CancerGenes; http://nar.oxfordjournals.org/content/35/suppl_1/D721.long, 5 Network of Cancer Gene; http://ncg.kcl.ac.uk/index.php, 1Therapeutic Vulnerabilities in Cancer; http://cbio.mskcc.org/cancergenomics/statius/ |
| REACTOME_METABOLISM_OF_MRNA REACTOME_METABOLISM_OF_RNA | |
| OMIM | |
| Orphanet | |
| Disease | KEGG Disease: CNOT2 |
| MedGen: CNOT2 (Human Medical Genetics with Condition) | |
| ClinVar: CNOT2 | |
| Phenotype | MGI: CNOT2 (International Mouse Phenotyping Consortium) |
| PhenomicDB: CNOT2 | |
| Mutations for CNOT2 |
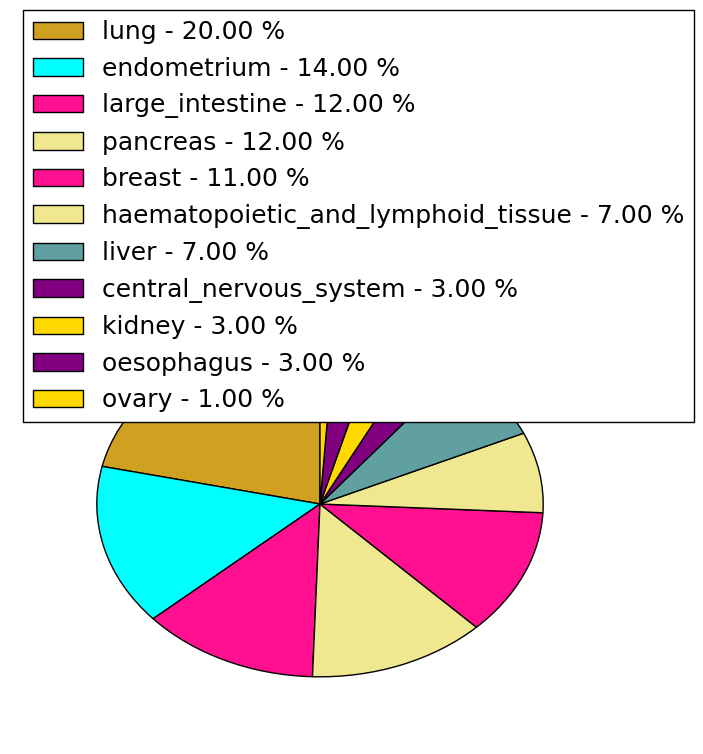
| * Under tables are showing count per each tissue to give us broad intuition about tissue specific mutation patterns.You can go to the detailed page for each mutation database's web site. |
| - Statistics for Tissue and Mutation type | Top |
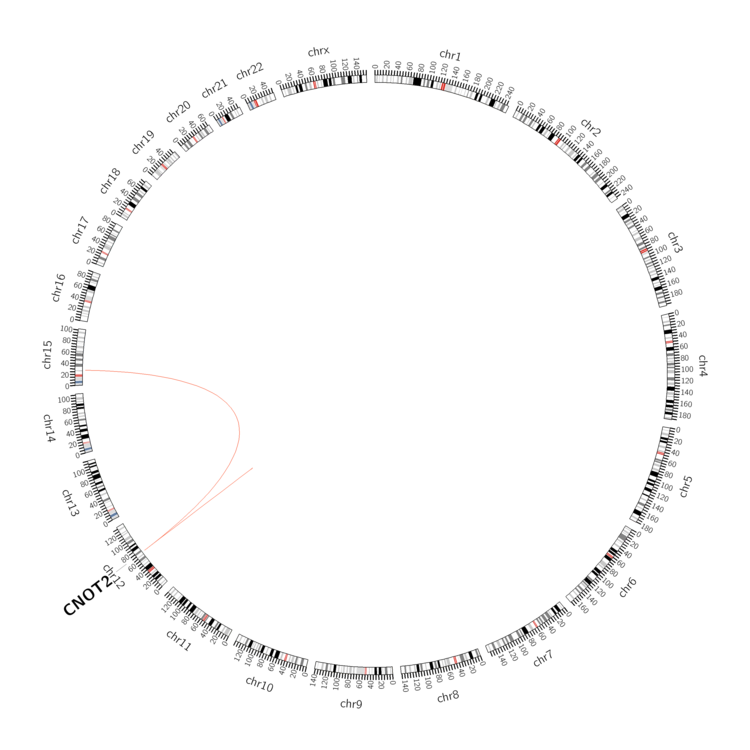 |
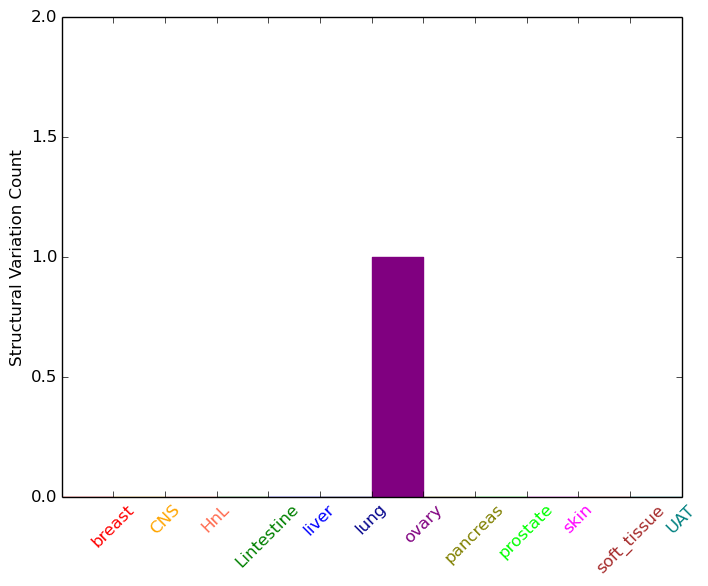
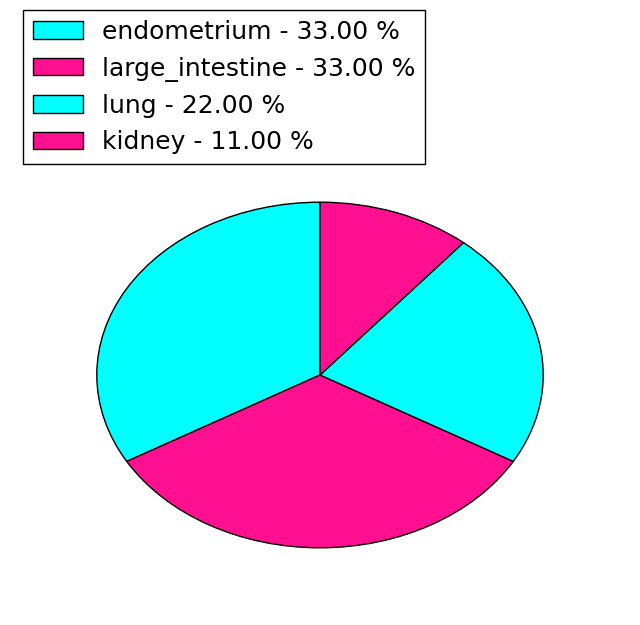
| - For Inter-chromosomal Variations |
| * Inter-chromosomal variantions includes 'interchromosomal amplicon to amplicon', 'interchromosomal amplicon to non-amplified dna', 'interchromosomal insertion', 'Interchromosomal unknown type'. |
 |
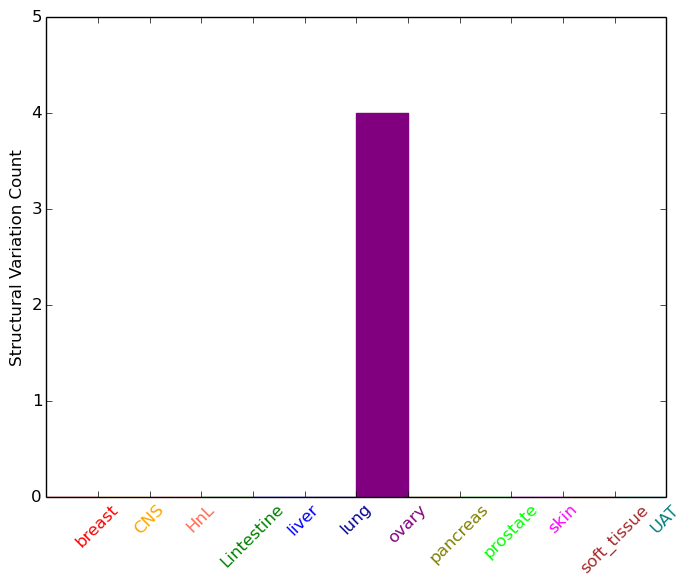
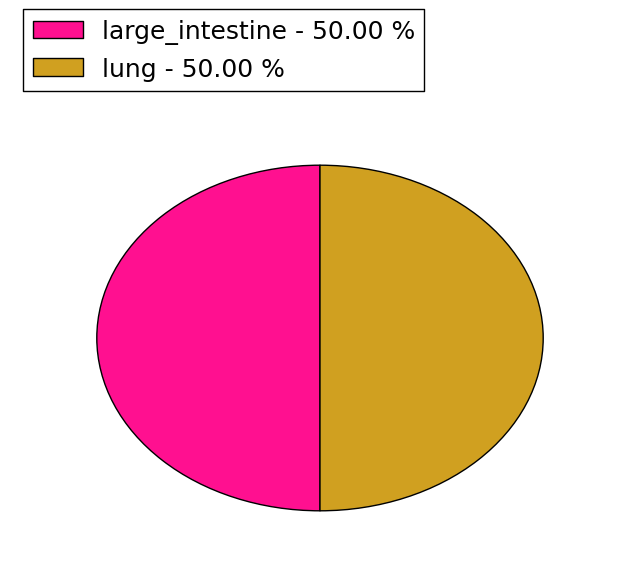
| - For Intra-chromosomal Variations |
| * Intra-chromosomal variantions includes 'intrachromosomal amplicon to amplicon', 'intrachromosomal amplicon to non-amplified dna', 'intrachromosomal deletion', 'intrachromosomal fold-back inversion', 'intrachromosomal inversion', 'intrachromosomal tandem duplication', 'Intrachromosomal unknown type', 'intrachromosomal with inverted orientation', 'intrachromosomal with non-inverted orientation'. |
 |
| Sample | Symbol_a | Chr_a | Start_a | End_a | Symbol_b | Chr_b | Start_b | End_b |
| ovary | CNOT2 | chr12 | 70650450 | 70650470 | chr15 | 27825113 | 27825133 | |
| ovary | CNOT2 | chr12 | 70659511 | 70659531 | CNOT2 | chr12 | 70659270 | 70659290 |
| ovary | CNOT2 | chr12 | 70681821 | 70681841 | CNOT2 | chr12 | 70681953 | 70681973 |
| cf) Tissue number; Tissue name (1;Breast, 2;Central_nervous_system, 3;Haematopoietic_and_lymphoid_tissue, 4;Large_intestine, 5;Liver, 6;Lung, 7;Ovary, 8;Pancreas, 9;Prostate, 10;Skin, 11;Soft_tissue, 12;Upper_aerodigestive_tract) |
| * From mRNA Sanger sequences, Chitars2.0 arranged chimeric transcripts. This table shows CNOT2 related fusion information. |
| ID | Head Gene | Tail Gene | Accession | Gene_a | qStart_a | qEnd_a | Chromosome_a | tStart_a | tEnd_a | Gene_a | qStart_a | qEnd_a | Chromosome_a | tStart_a | tEnd_a |
| AA071465 | FAU | 22 | 74 | 11 | 64888102 | 64888154 | CNOT2 | 66 | 491 | 12 | 70747715 | 70748140 | |
| AF130057 | CNOT2 | 1 | 2594 | 12 | 70715461 | 70718054 | AHSG | 2584 | 2860 | 3 | 186338832 | 186339107 | |
| BC008476 | PCDH9 | 1 | 1019 | 13 | 67748432 | 67749456 | CNOT2 | 1018 | 1205 | 12 | 70677266 | 70677455 | |
| Top |
| Mutation type/ Tissue ID | brca | cns | cerv | endome | haematopo | kidn | Lintest | liver | lung | ns | ovary | pancre | prost | skin | stoma | thyro | urina | |||
| Total # sample | 3 | 2 | 1 | 1 | 1 | 2 | ||||||||||||||
| GAIN (# sample) | 3 | 2 | 1 | 1 | 2 | |||||||||||||||
| LOSS (# sample) | 1 |
| cf) Tissue ID; Tissue type (1; Breast, 2; Central_nervous_system, 3; Cervix, 4; Endometrium, 5; Haematopoietic_and_lymphoid_tissue, 6; Kidney, 7; Large_intestine, 8; Liver, 9; Lung, 10; NS, 11; Ovary, 12; Pancreas, 13; Prostate, 14; Skin, 15; Stomach, 16; Thyroid, 17; Urinary_tract) |
| Top |
|
 |
| Top |
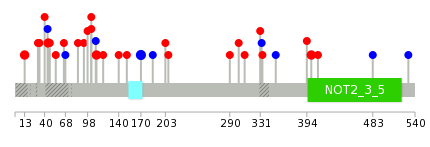
| Stat. for Non-Synonymous SNVs (# total SNVs=54) | (# total SNVs=9) |
 |  |
(# total SNVs=2) | (# total SNVs=0) |
 |
| Top |
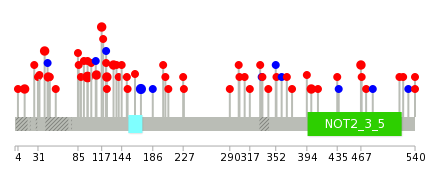
| * When you move the cursor on each content, you can see more deailed mutation information on the Tooltip. Those are primary_site,primary_histology,mutation(aa),pubmedID. |
| GRCh37 position | Mutation(aa) | Unique sampleID count |
| chr12:70723257-70723257 | p.R98H | 4 |
| chr12:70724190-70724190 | p.S170S | 3 |
| chr12:70747693-70747693 | p.*541K | 3 |
| chr12:70723313-70723313 | p.P117T | 2 |
| chr12:70672044-70672044 | p.R13I | 2 |
| chr12:70723334-70723334 | p.P124S | 2 |
| chr12:70735907-70735907 | p.A400V | 2 |
| chr12:70724078-70724078 | p.P133L | 2 |
| chr12:70747694-70747694 | p.*541fs? | 2 |
| chr12:70704744-70704744 | p.E40K | 2 |
| Top |
|
 |
| Point Mutation/ Tissue ID | 1 | 2 | 3 | 4 | 5 | 6 | 7 | 8 | 9 | 10 | 11 | 12 | 13 | 14 | 15 | 16 | 17 | 18 | 19 | 20 |
| # sample | 2 | 5 | 1 | 1 | 1 | 5 | 4 | 1 | 3 | 4 | 1 | 10 | ||||||||
| # mutation | 2 | 6 | 2 | 1 | 1 | 6 | 4 | 1 | 3 | 4 | 1 | 10 | ||||||||
| nonsynonymous SNV | 2 | 4 | 2 | 1 | 4 | 3 | 1 | 2 | 4 | 7 | ||||||||||
| synonymous SNV | 2 | 1 | 2 | 1 | 1 | 1 | 3 |
| cf) Tissue ID; Tissue type (1; BLCA[Bladder Urothelial Carcinoma], 2; BRCA[Breast invasive carcinoma], 3; CESC[Cervical squamous cell carcinoma and endocervical adenocarcinoma], 4; COAD[Colon adenocarcinoma], 5; GBM[Glioblastoma multiforme], 6; Glioma Low Grade, 7; HNSC[Head and Neck squamous cell carcinoma], 8; KICH[Kidney Chromophobe], 9; KIRC[Kidney renal clear cell carcinoma], 10; KIRP[Kidney renal papillary cell carcinoma], 11; LAML[Acute Myeloid Leukemia], 12; LUAD[Lung adenocarcinoma], 13; LUSC[Lung squamous cell carcinoma], 14; OV[Ovarian serous cystadenocarcinoma ], 15; PAAD[Pancreatic adenocarcinoma], 16; PRAD[Prostate adenocarcinoma], 17; SKCM[Skin Cutaneous Melanoma], 18:STAD[Stomach adenocarcinoma], 19:THCA[Thyroid carcinoma], 20:UCEC[Uterine Corpus Endometrial Carcinoma]) |
| Top |
| * We represented just top 10 SNVs. When you move the cursor on each content, you can see more deailed mutation information on the Tooltip. Those are primary_site, primary_histology, mutation(aa), pubmedID. |
| Genomic Position | Mutation(aa) | Unique sampleID count |
| chr12:70724190 | p.S170S,CNOT2 | 3 |
| chr12:70672044 | p.R13I,CNOT2 | 2 |
| chr12:70735907 | p.V110I,CNOT2 | 2 |
| chr12:70704760 | p.A400V,CNOT2 | 2 |
| chr12:70723292 | p.S45N,CNOT2 | 2 |
| chr12:70732480 | p.G103D,CNOT2 | 1 |
| chr12:70713110 | p.T352T,CNOT2 | 1 |
| chr12:70735890 | p.H109H,CNOT2 | 1 |
| chr12:70723217 | p.N394K,CNOT2 | 1 |
| chr12:70724238 | p.E31K,CNOT2 | 1 |
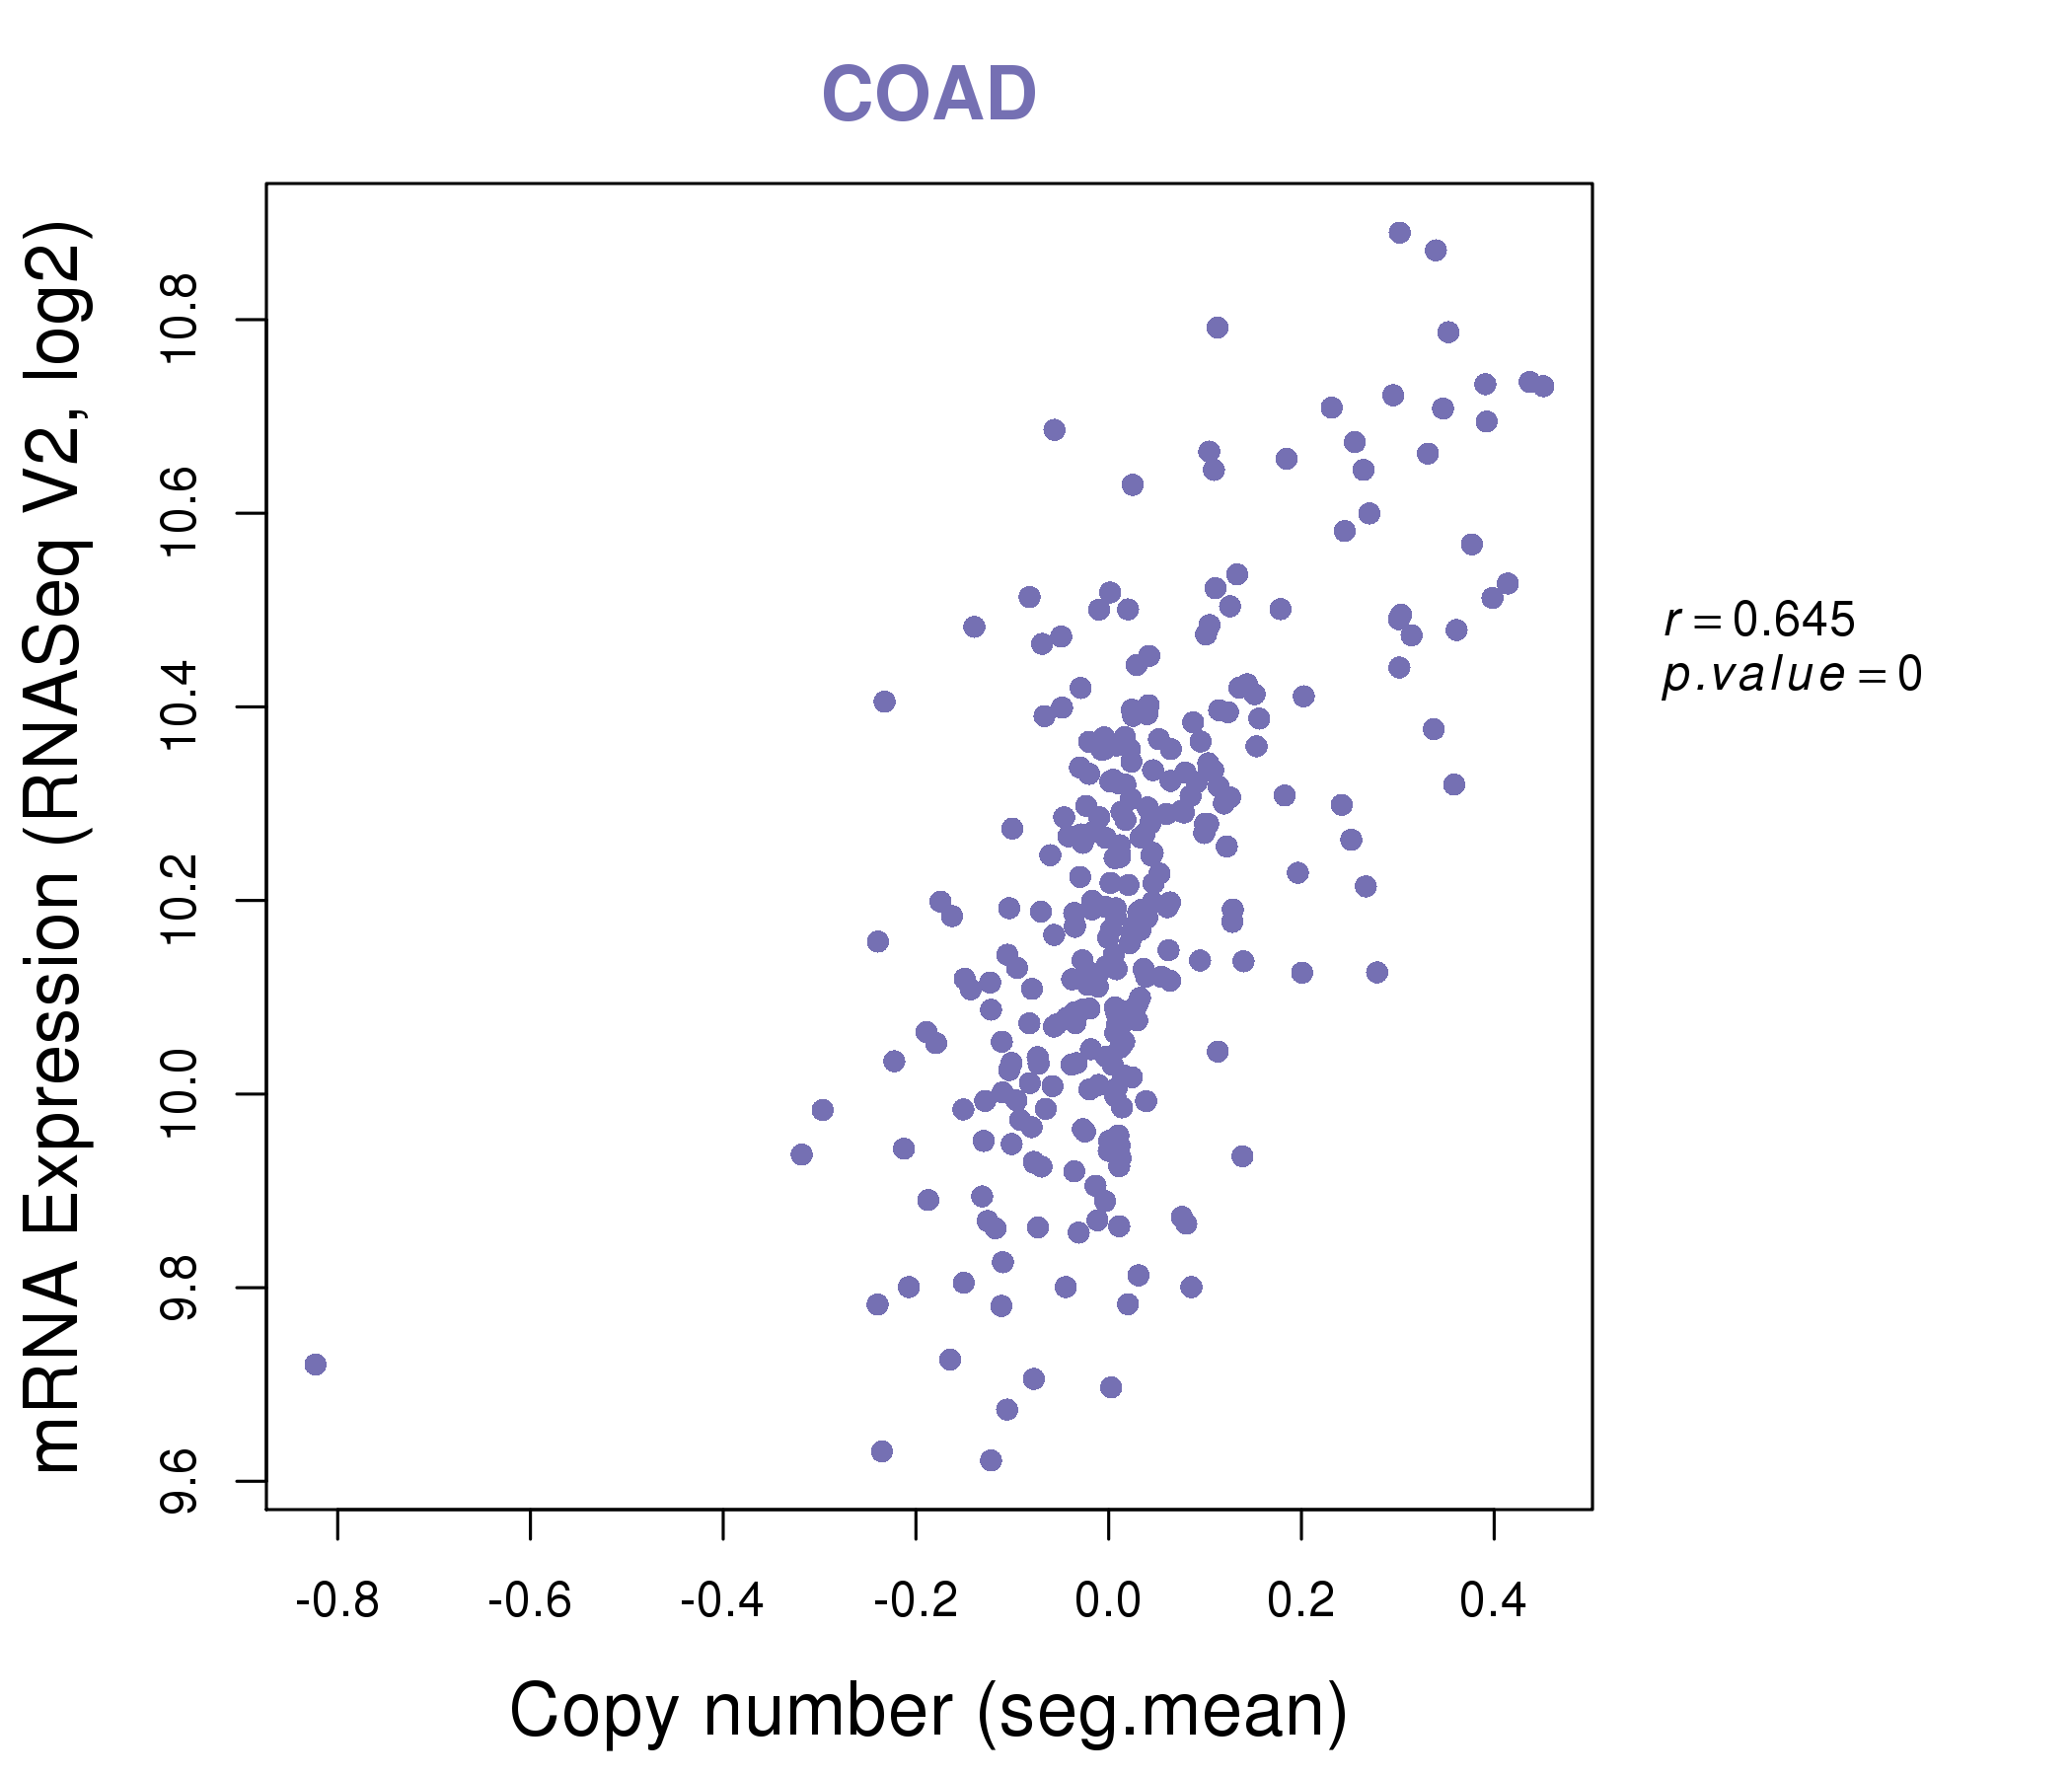
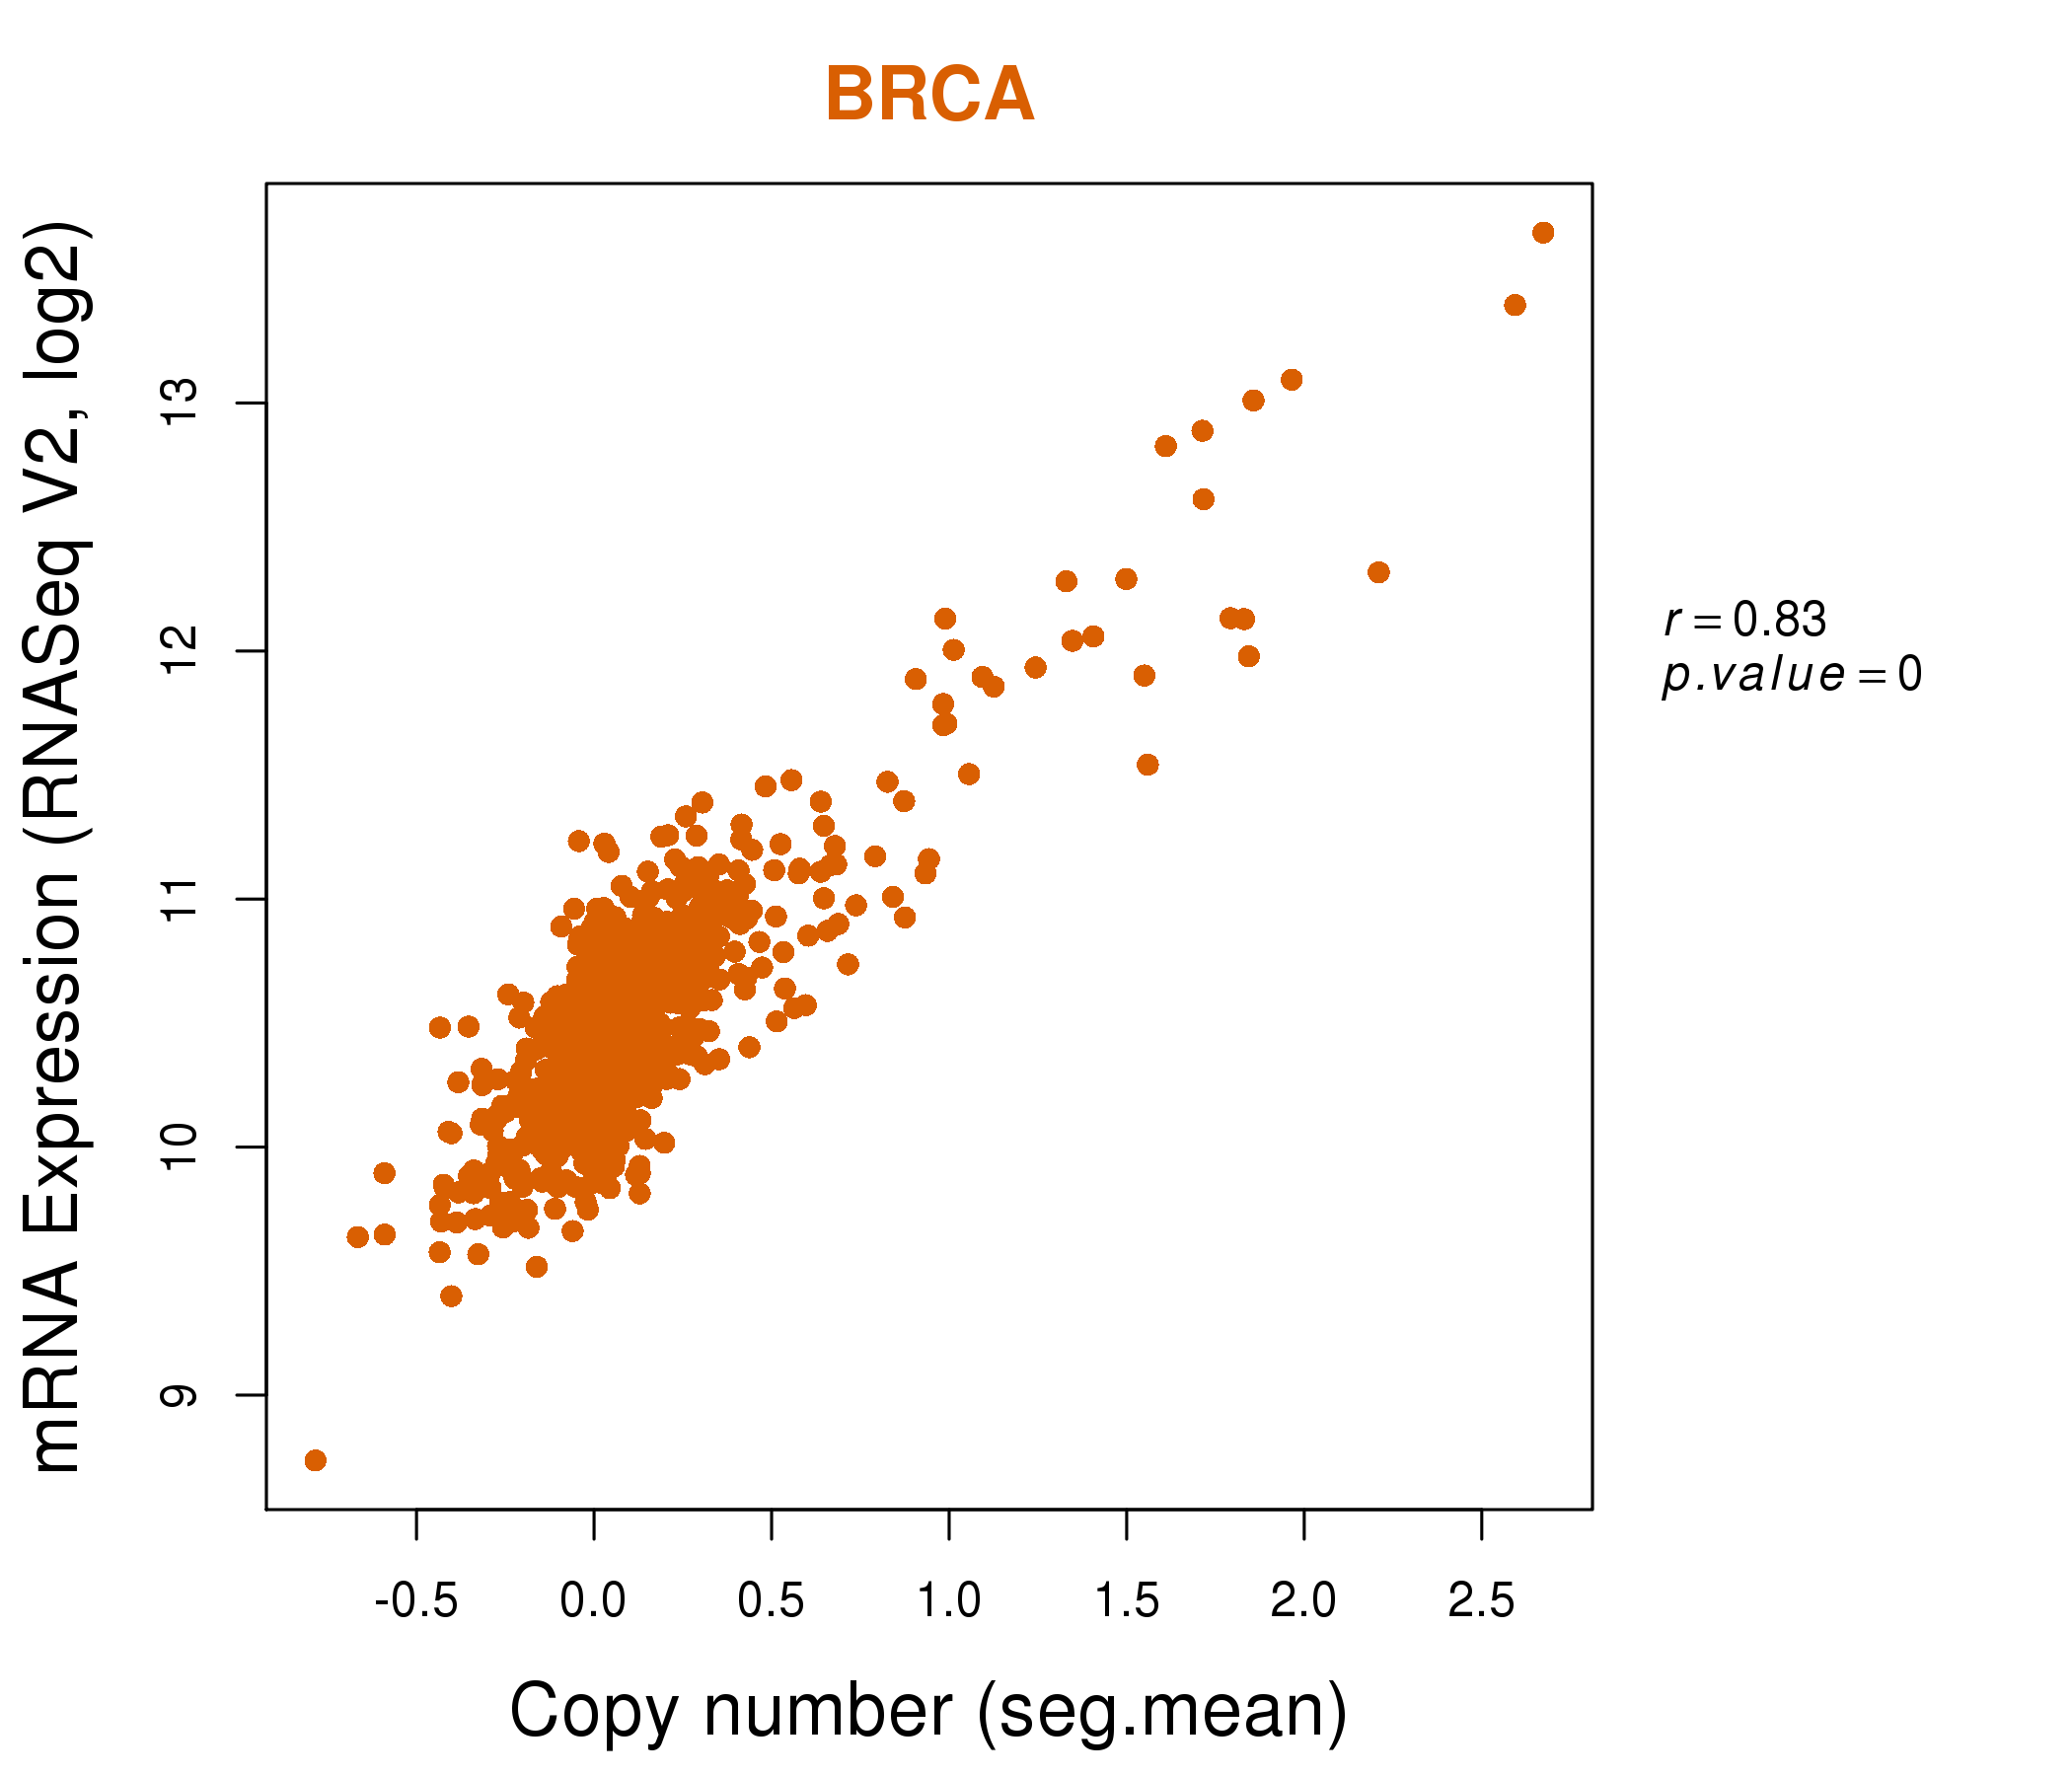
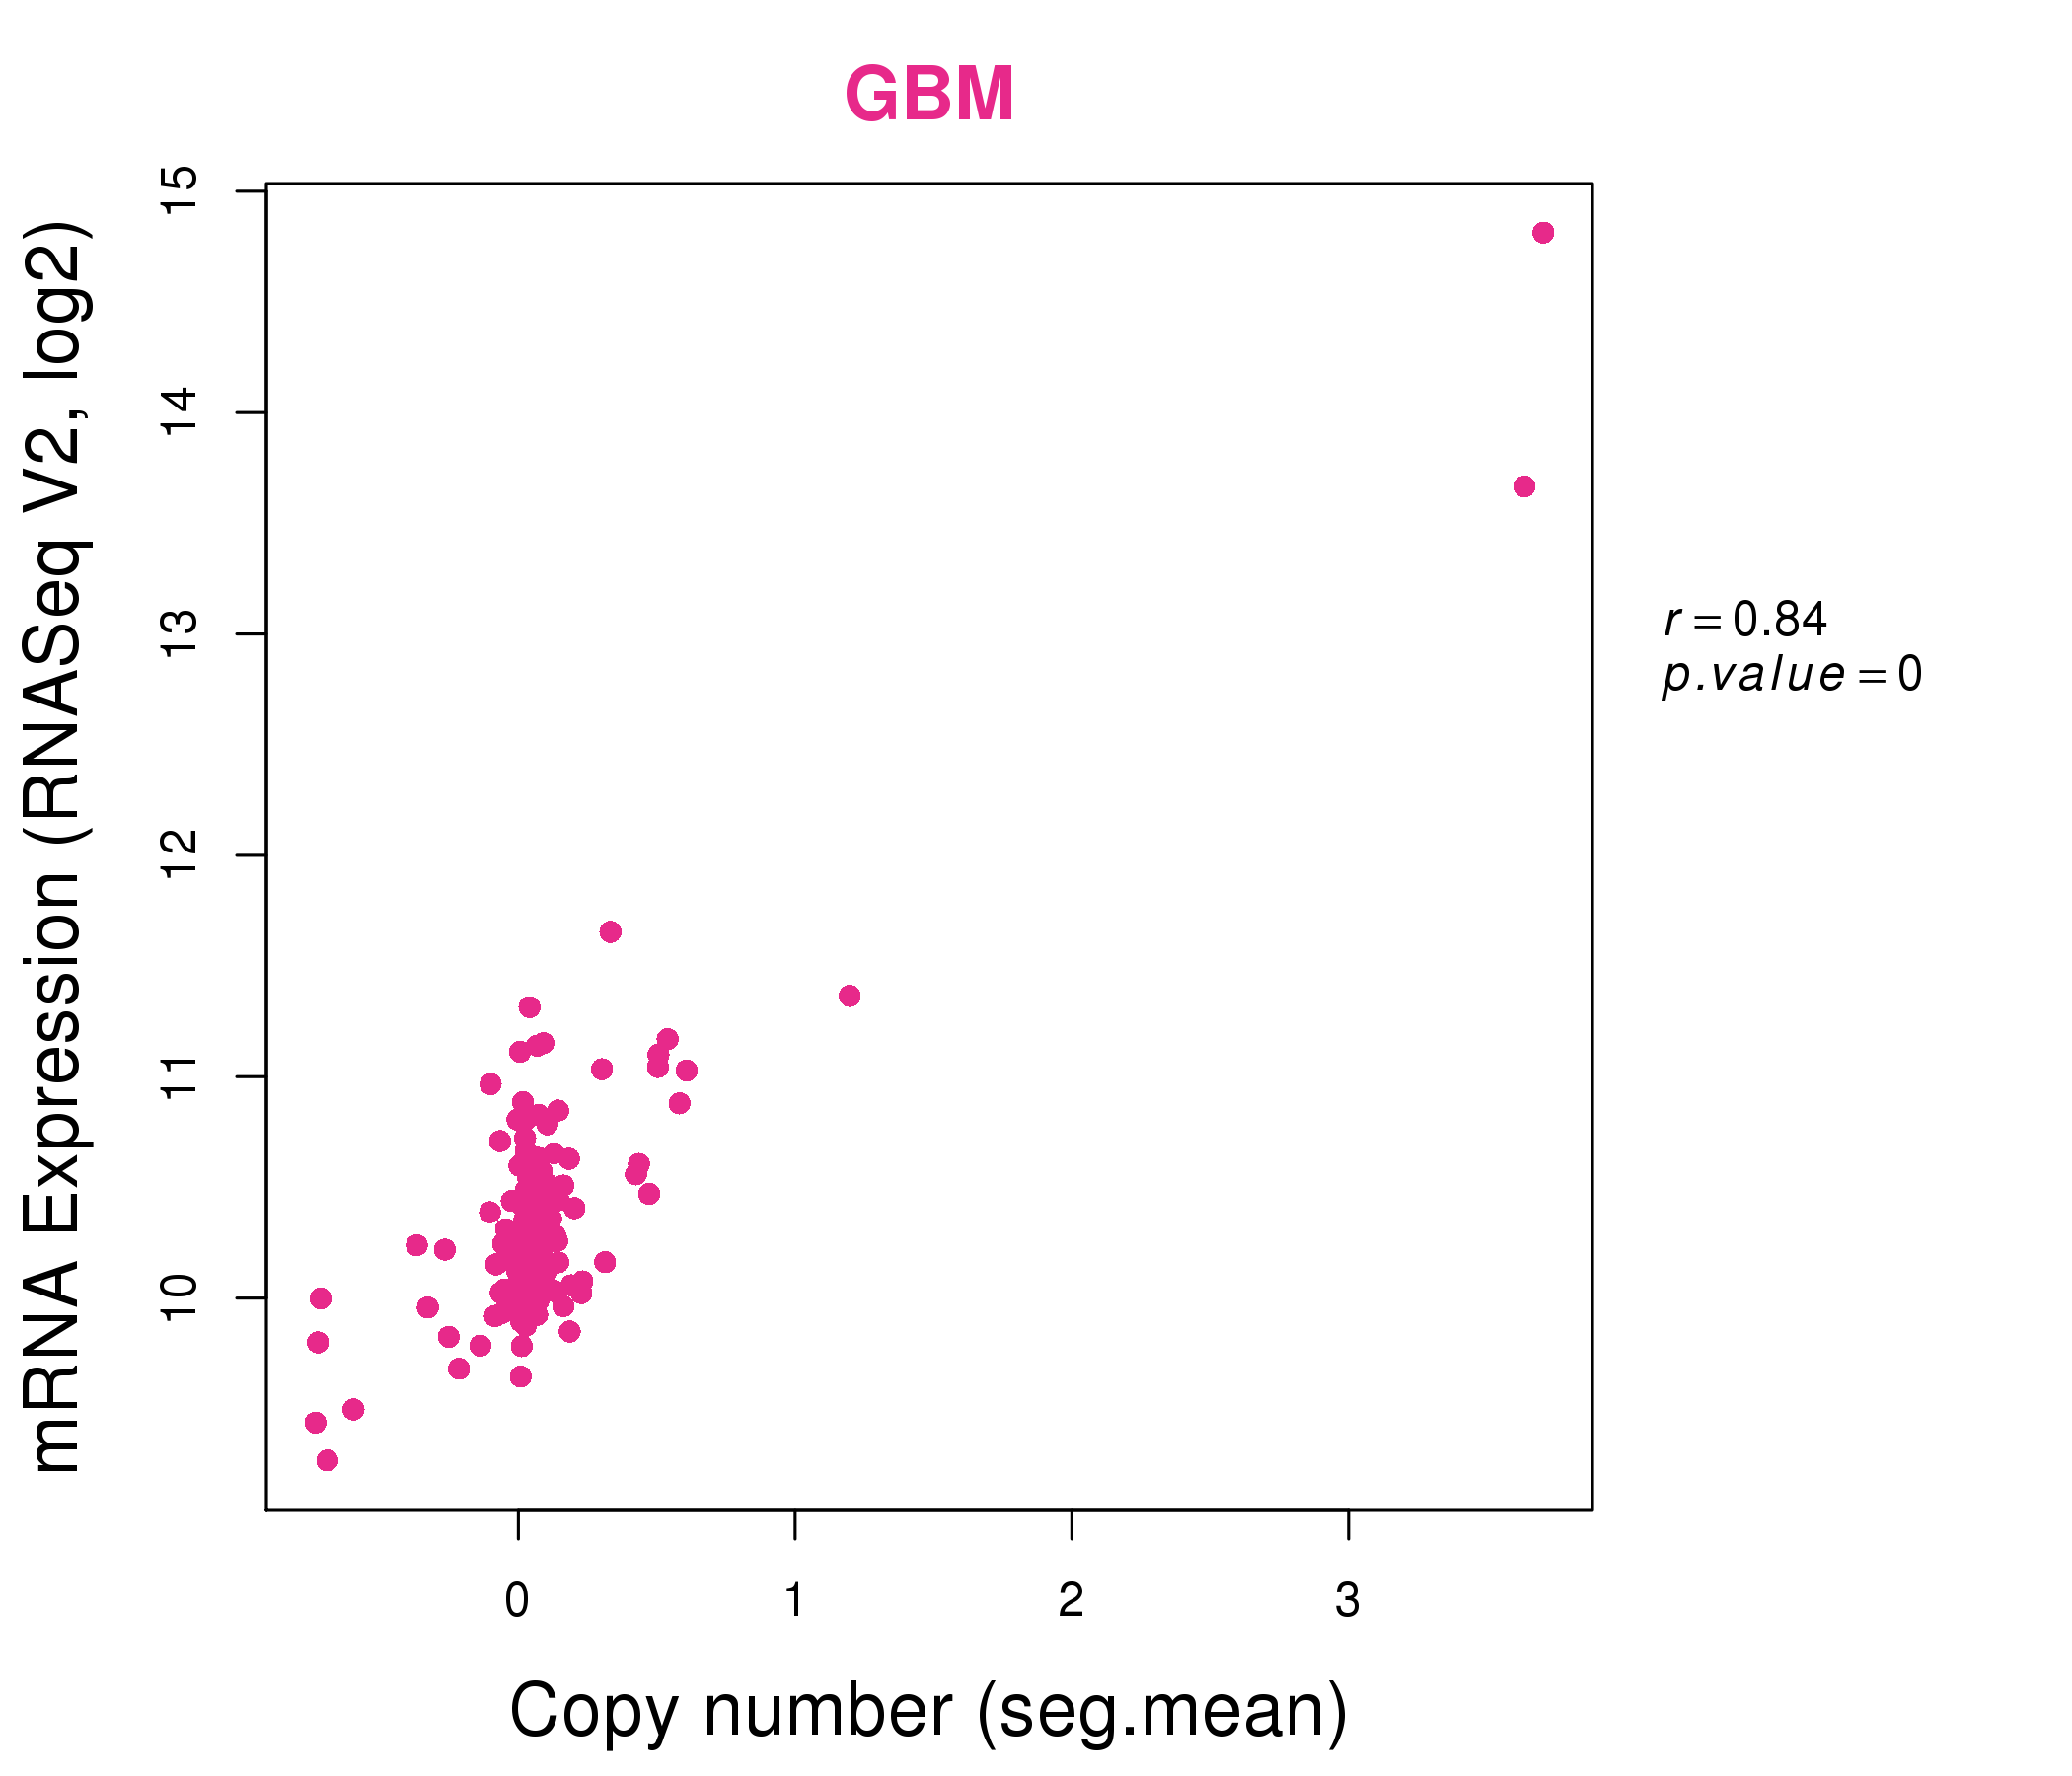
| * Copy number data were extracted from TCGA using R package TCGA-Assembler. The URLs of all public data files on TCGA DCC data server were gathered on Jan-05-2015. Function ProcessCNAData in TCGA-Assembler package was used to obtain gene-level copy number value which is calculated as the average copy number of the genomic region of a gene. |
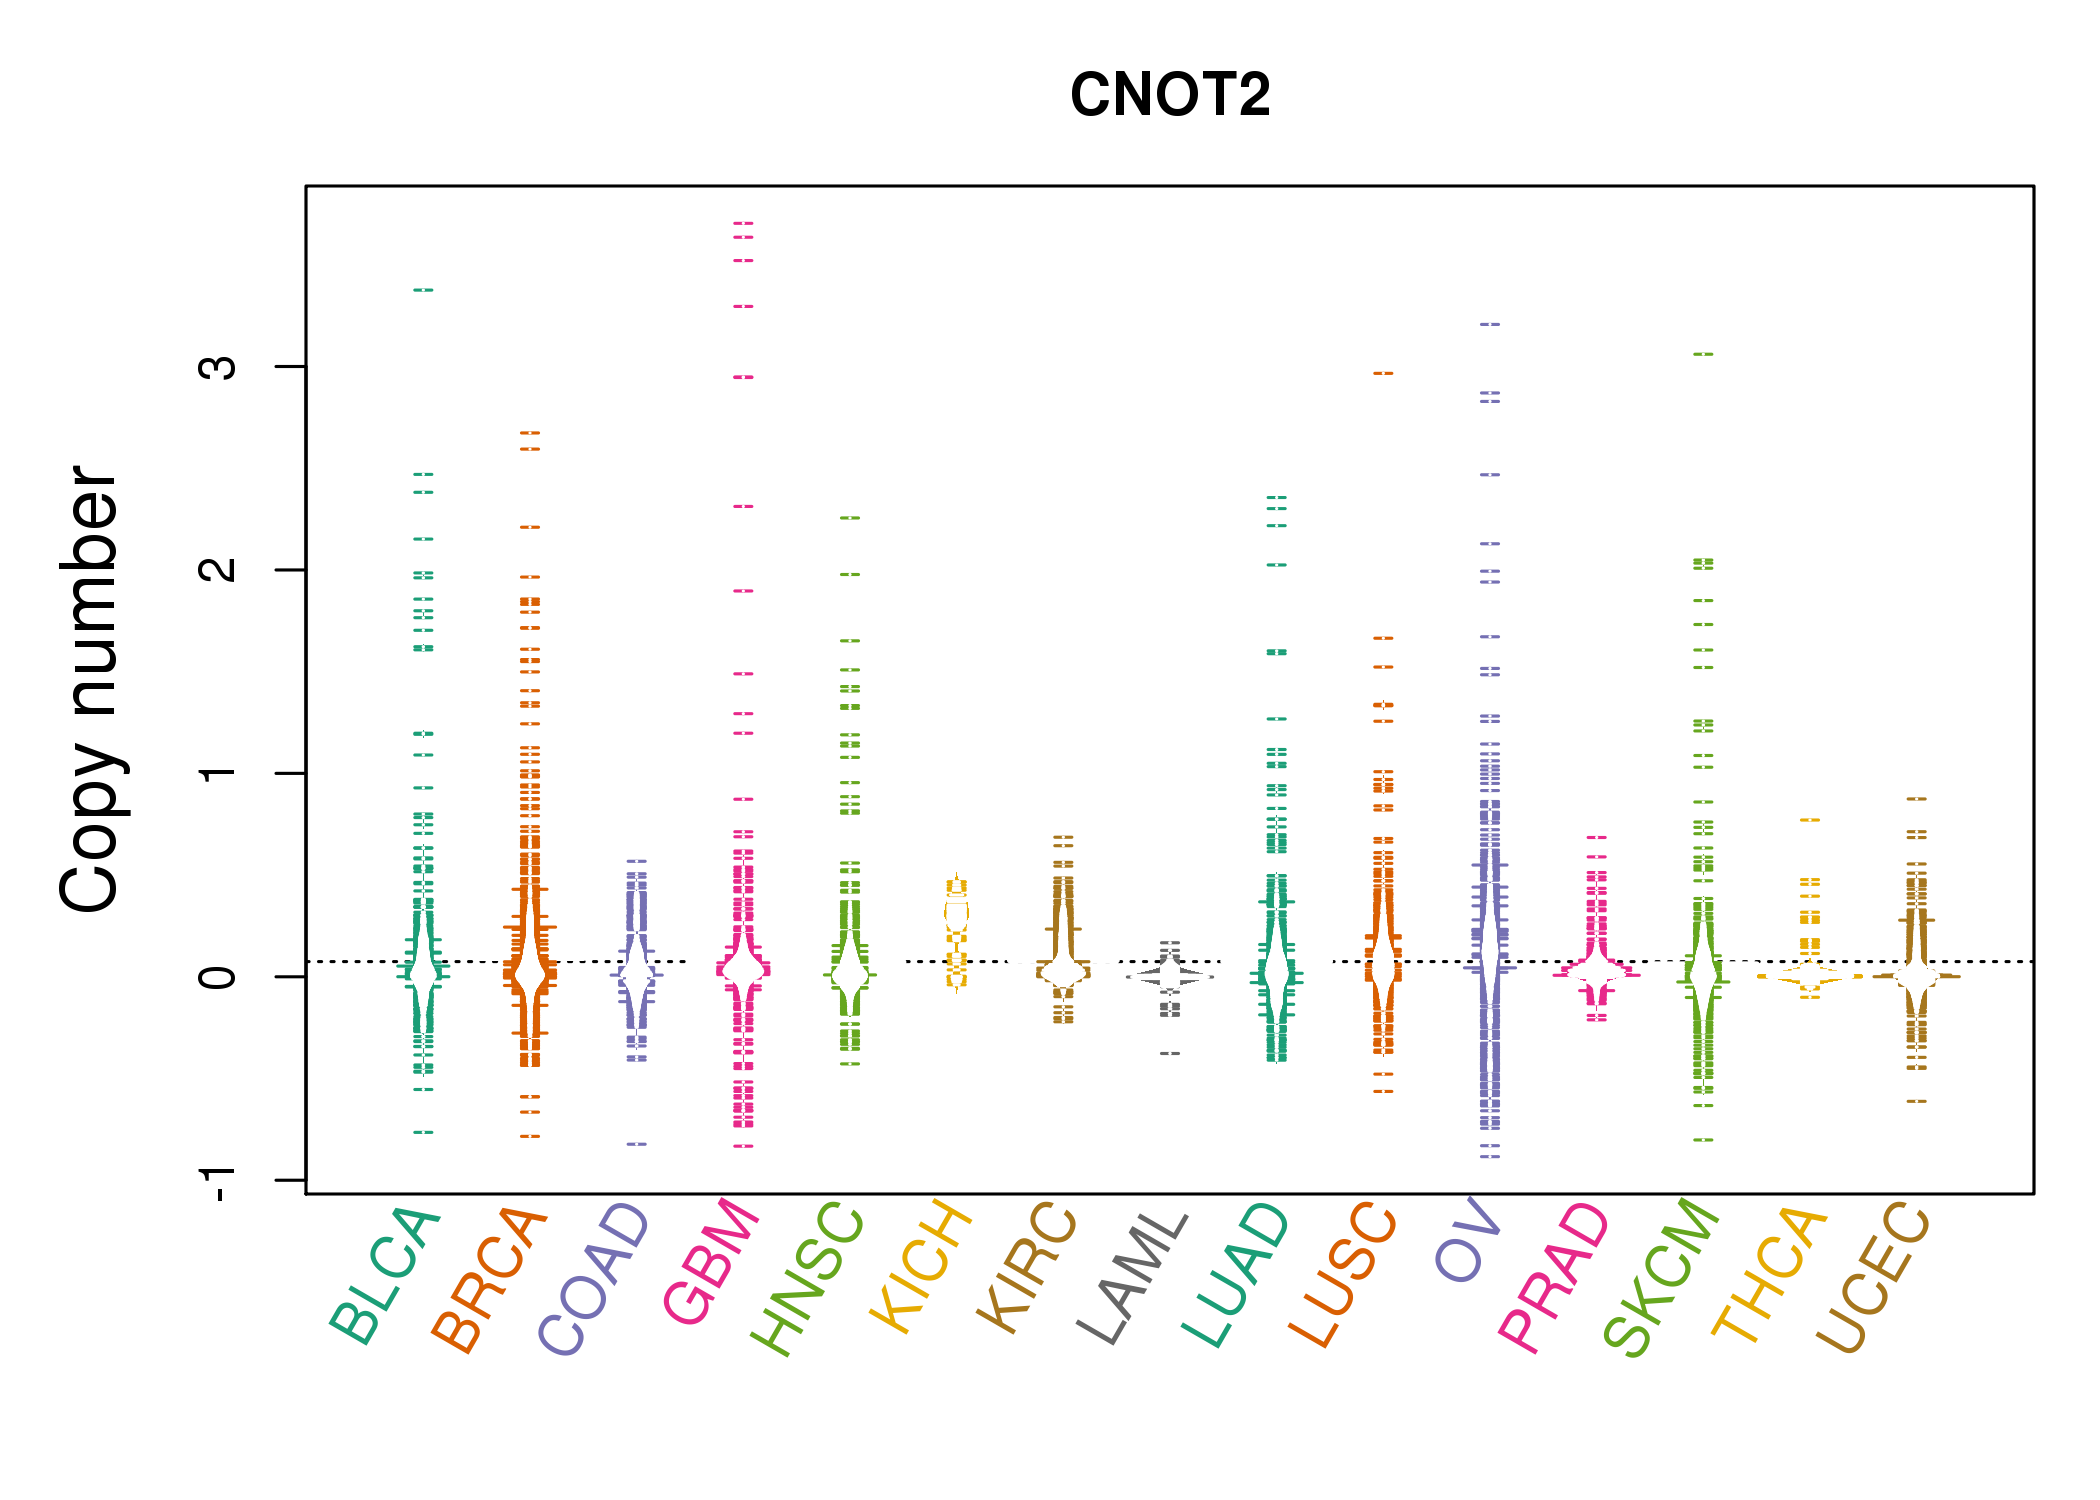 |
| cf) Tissue ID[Tissue type]: BLCA[Bladder Urothelial Carcinoma], BRCA[Breast invasive carcinoma], CESC[Cervical squamous cell carcinoma and endocervical adenocarcinoma], COAD[Colon adenocarcinoma], GBM[Glioblastoma multiforme], Glioma Low Grade, HNSC[Head and Neck squamous cell carcinoma], KICH[Kidney Chromophobe], KIRC[Kidney renal clear cell carcinoma], KIRP[Kidney renal papillary cell carcinoma], LAML[Acute Myeloid Leukemia], LUAD[Lung adenocarcinoma], LUSC[Lung squamous cell carcinoma], OV[Ovarian serous cystadenocarcinoma ], PAAD[Pancreatic adenocarcinoma], PRAD[Prostate adenocarcinoma], SKCM[Skin Cutaneous Melanoma], STAD[Stomach adenocarcinoma], THCA[Thyroid carcinoma], UCEC[Uterine Corpus Endometrial Carcinoma] |
| Top |
| Gene Expression for CNOT2 |
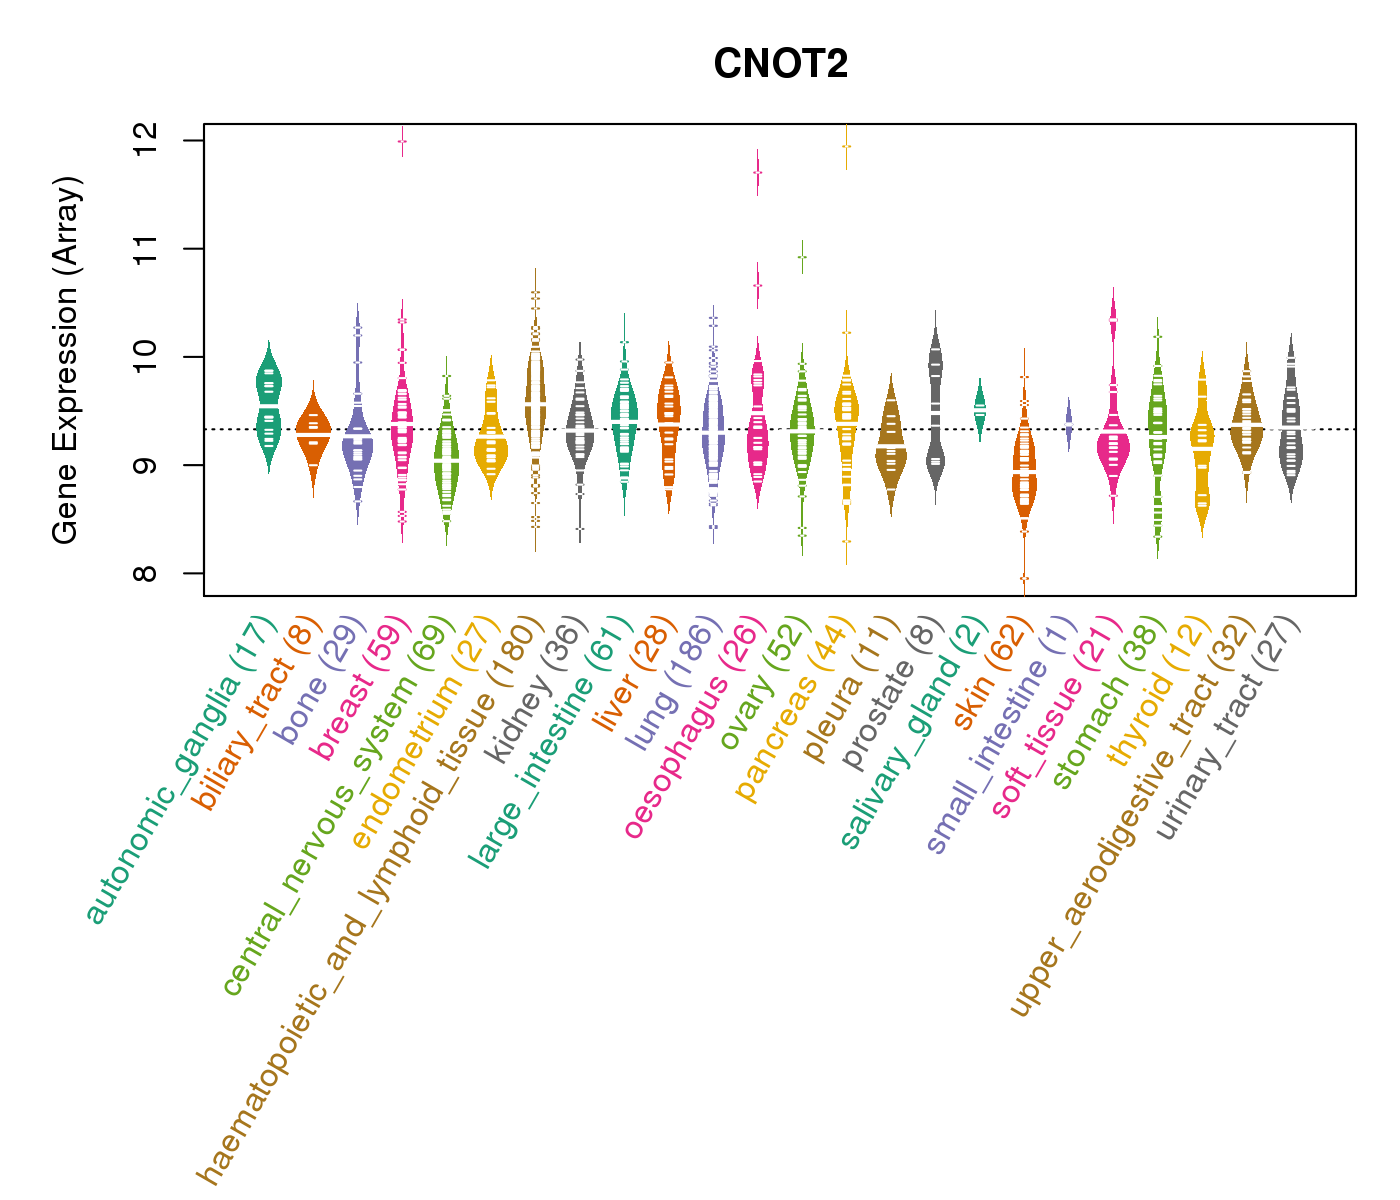
| * CCLE gene expression data were extracted from CCLE_Expression_Entrez_2012-10-18.res: Gene-centric RMA-normalized mRNA expression data. |
 |
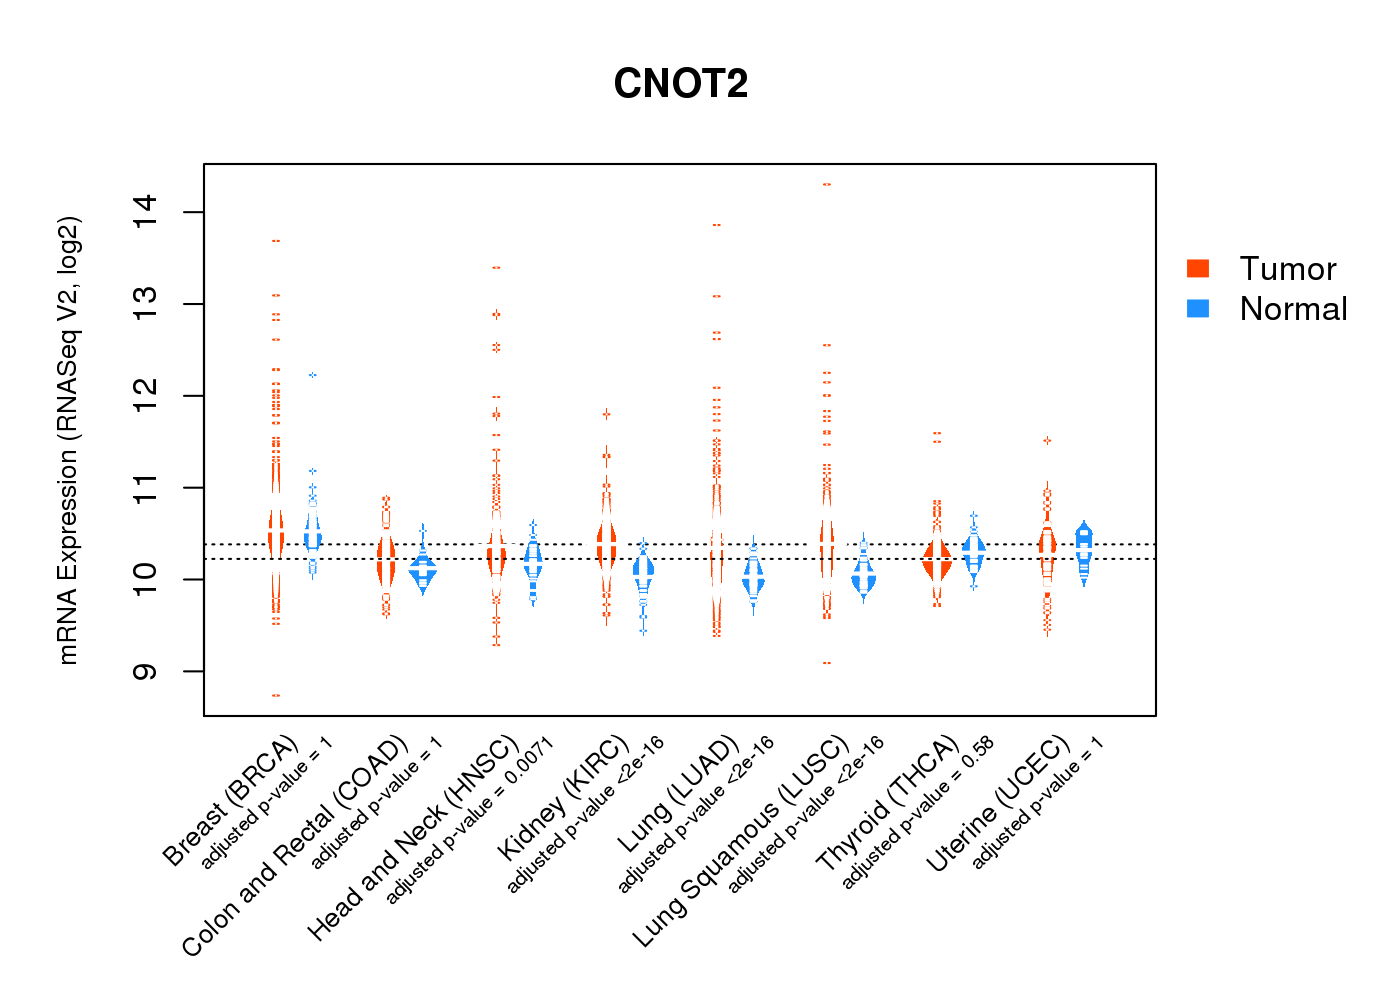
| * Normalized gene expression data of RNASeqV2 was extracted from TCGA using R package TCGA-Assembler. The URLs of all public data files on TCGA DCC data server were gathered at Jan-05-2015. Only eight cancer types have enough normal control samples for differential expression analysis. (t test, adjusted p<0.05 (using Benjamini-Hochberg FDR)) |
 |
| Top |
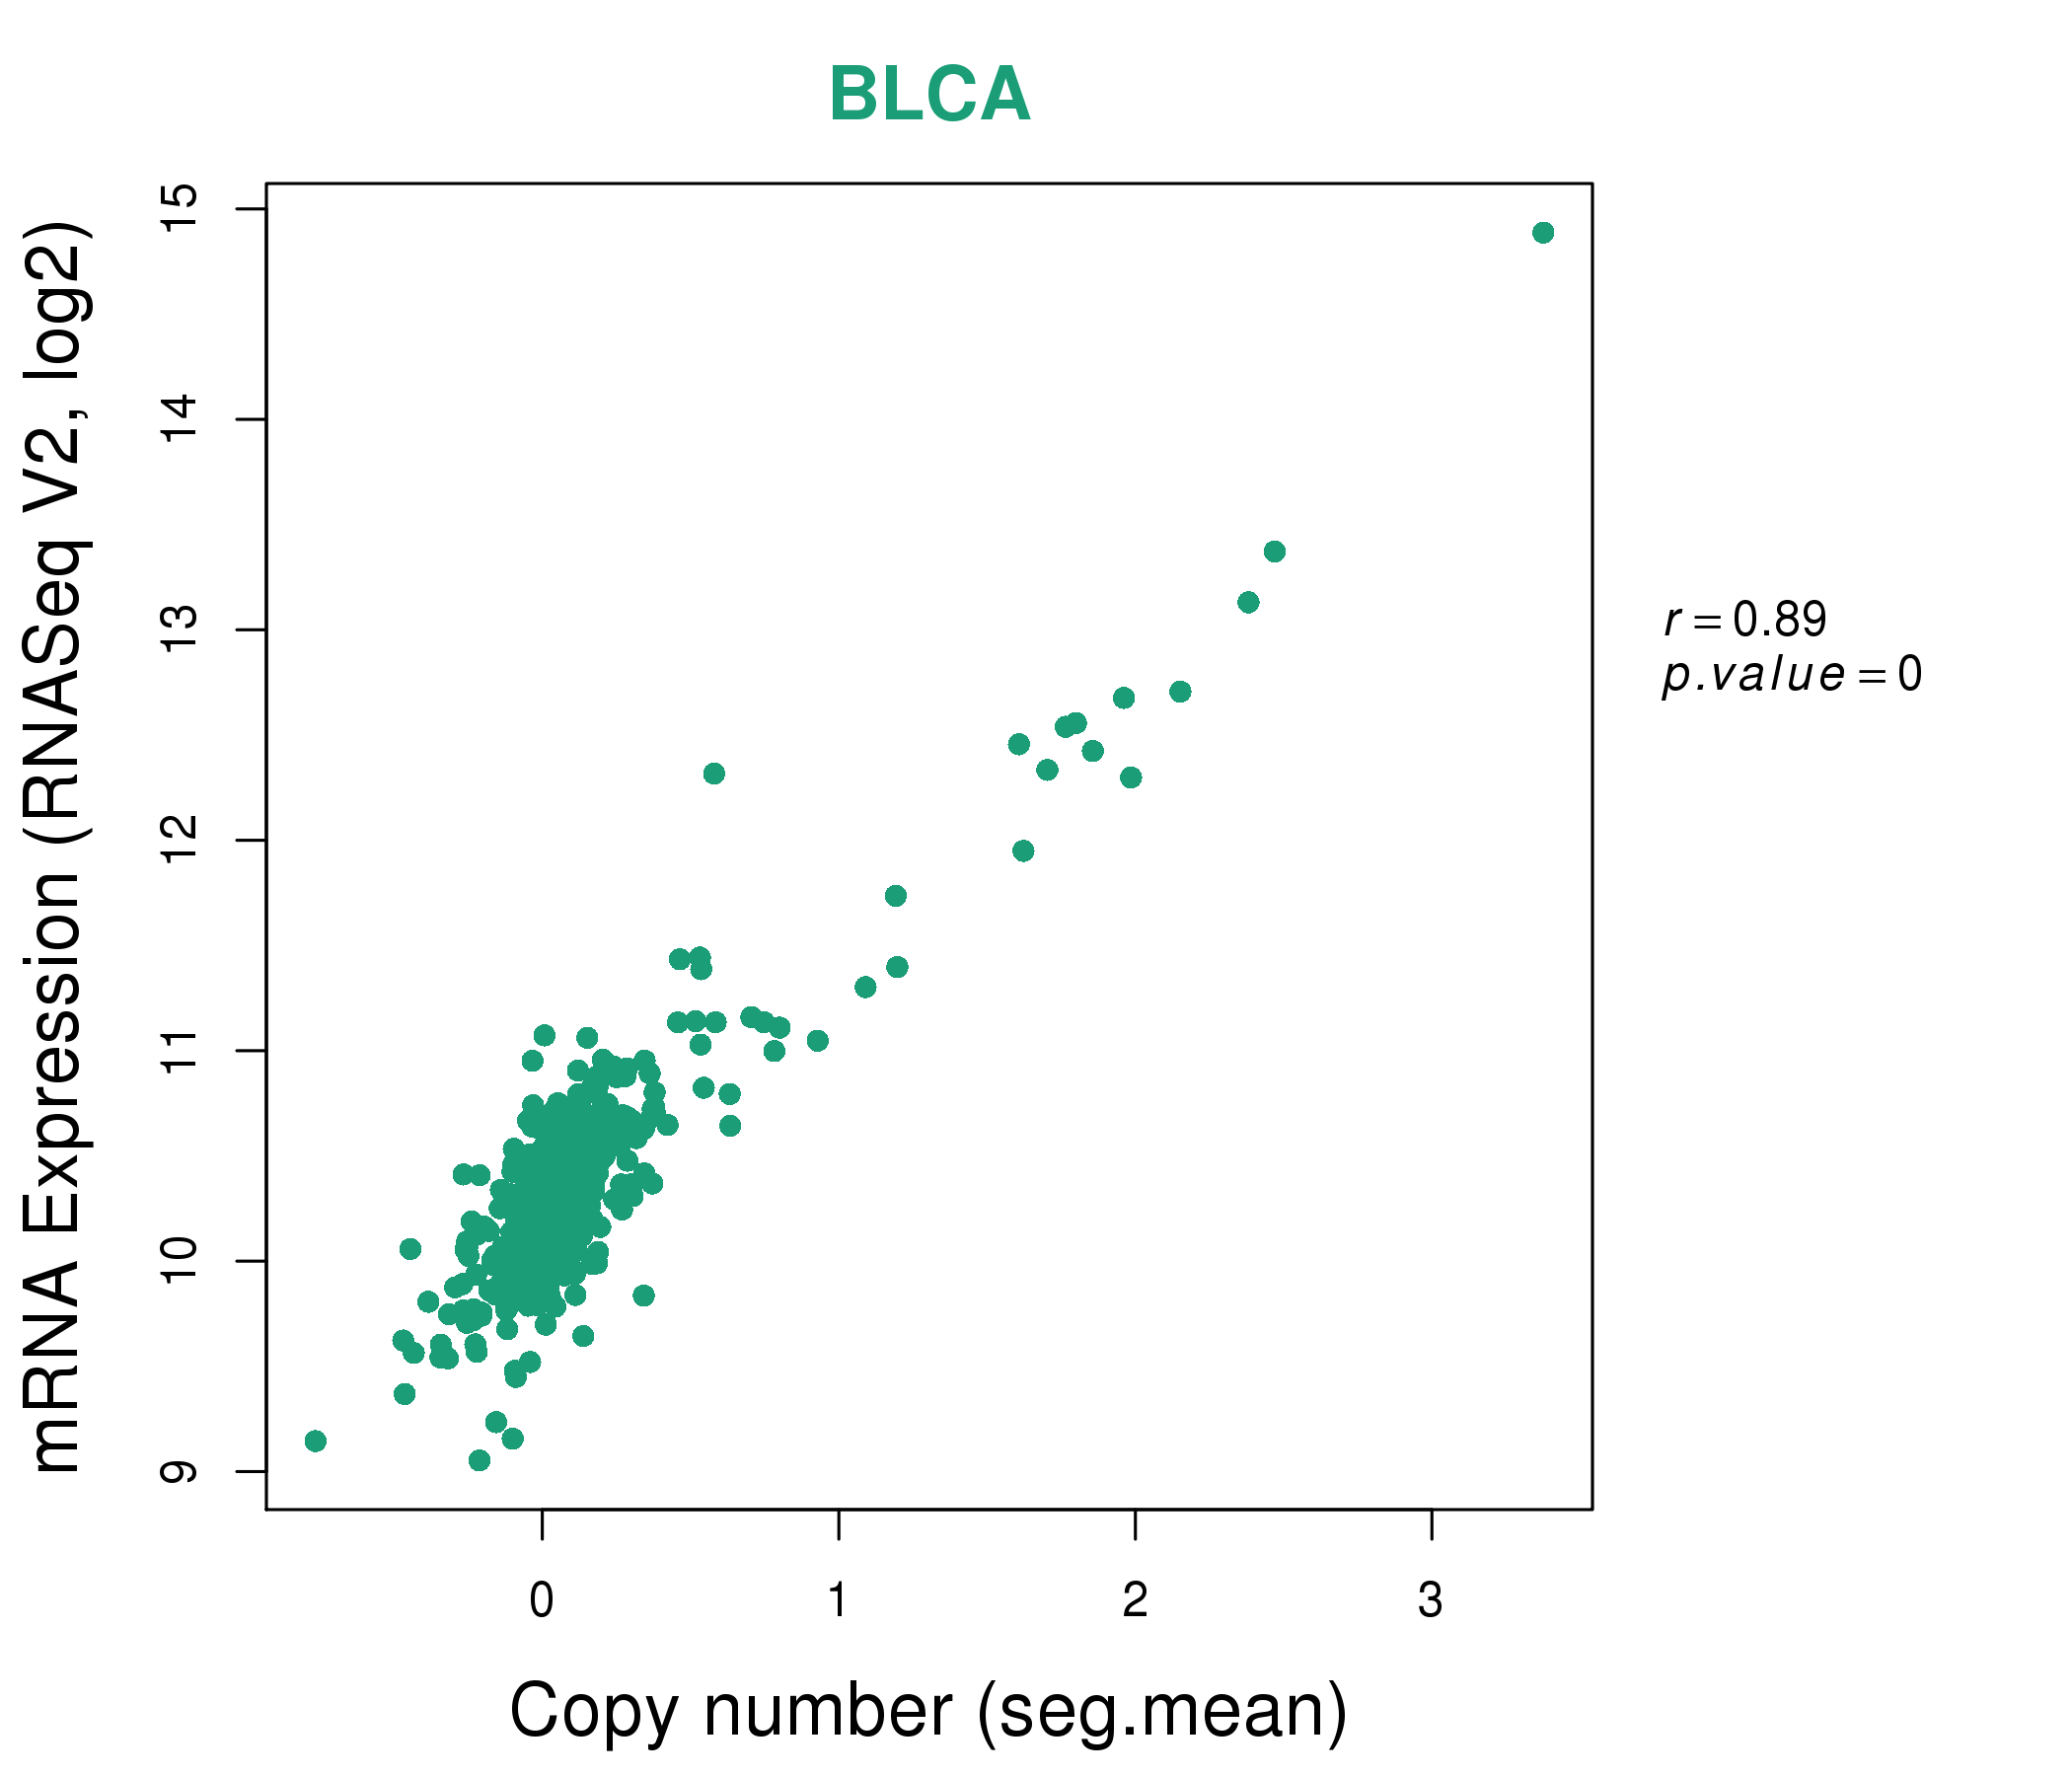
| * This plots show the correlation between CNV and gene expression. |
: Open all plots for all cancer types
 |
|
 |
|
| Top |
| Gene-Gene Network Information |
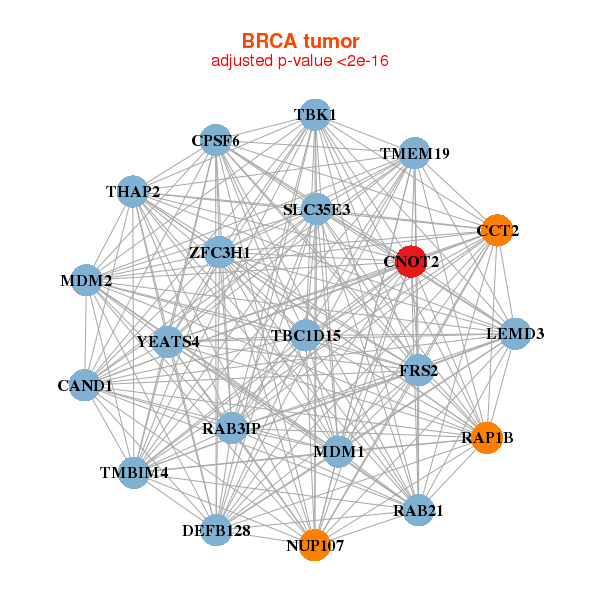
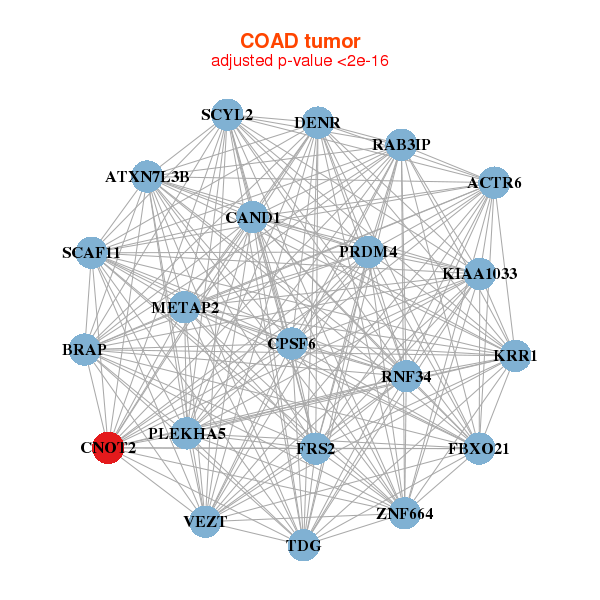
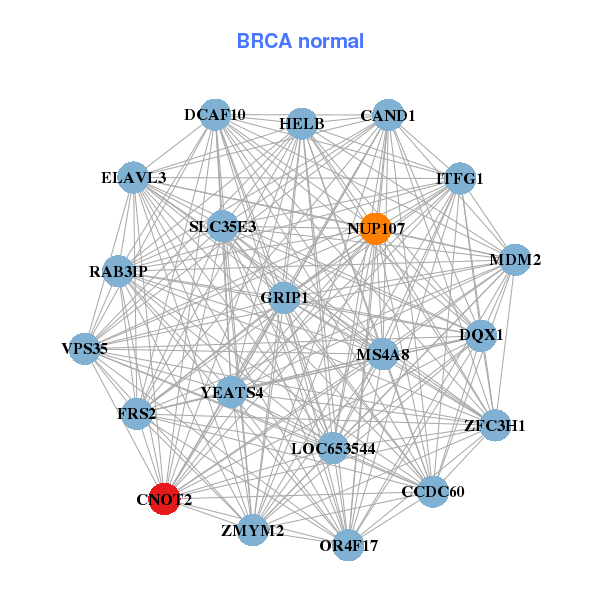
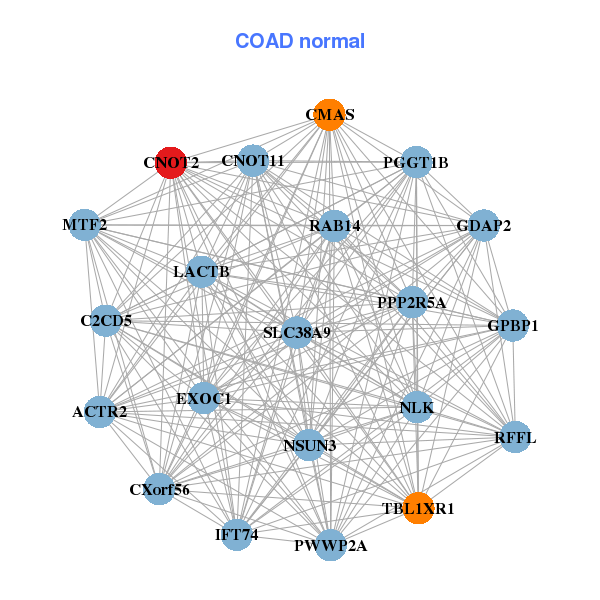
| * Co-Expression network figures were drawn using R package igraph. Only the top 20 genes with the highest correlations were shown. Red circle: input gene, orange circle: cell metabolism gene, sky circle: other gene |
: Open all plots for all cancer types
 |
|
| CAND1,CCT2,CNOT2,CPSF6,DEFB128,FRS2,LEMD3, MDM1,MDM2,NUP107,RAB21,RAB3IP,RAP1B,SLC35E3, TBC1D15,TBK1,THAP2,TMBIM4,TMEM19,YEATS4,ZFC3H1 | CAND1,CCDC60,CNOT2,DCAF10,DQX1,ELAVL3,FRS2, GRIP1,HELB,ITFG1,LOC653544,MDM2,MS4A8,NUP107, OR4F17,RAB3IP,SLC35E3,VPS35,YEATS4,ZFC3H1,ZMYM2 |
 |
|
| ACTR6,ATXN7L3B,BRAP,CAND1,CNOT2,CPSF6,DENR, FBXO21,FRS2,KIAA1033,KRR1,METAP2,PLEKHA5,PRDM4, RAB3IP,RNF34,SCYL2,SCAF11,TDG,VEZT,ZNF664 | ACTR2,CNOT11,CMAS,CNOT2,CXorf56,EXOC1,GDAP2, GPBP1,IFT74,C2CD5,LACTB,MTF2,NLK,NSUN3, PGGT1B,PPP2R5A,PWWP2A,RAB14,RFFL,SLC38A9,TBL1XR1 |
| * Co-Expression network figures were drawn using R package igraph. Only the top 20 genes with the highest correlations were shown. Red circle: input gene, orange circle: cell metabolism gene, sky circle: other gene |
: Open all plots for all cancer types
| Top |
: Open all interacting genes' information including KEGG pathway for all interacting genes from DAVID
| Top |
| Pharmacological Information for CNOT2 |
| There's no related Drug. |
| Top |
| Cross referenced IDs for CNOT2 |
| * We obtained these cross-references from Uniprot database. It covers 150 different DBs, 18 categories. http://www.uniprot.org/help/cross_references_section |
: Open all cross reference information
|
Copyright © 2016-Present - The Univsersity of Texas Health Science Center at Houston @ |