|
||||||||||||||||||||||||||||||||||||||||||||||||||||||||||||||||||||||||||||||||||||||||||||||||||||||||||||||||||||||||||||||||||||||||||||||||||||||||||||||||||||||||||||||||||||||||||||||||||||||||||||||||||||||||||||||||||||||||||||||||||||||||||||||||||||||||||||||||||||||||||||||||||||||||||||||||||||||||||
| |
| Phenotypic Information (metabolism pathway, cancer, disease, phenome) |
| |
| |
| Gene-Gene Network Information: Co-Expression Network, Interacting Genes & KEGG |
| |
|


| Gene Summary for CNOT3 |
| Basic gene info. | Gene symbol | CNOT3 |
| Gene name | CCR4-NOT transcription complex, subunit 3 | |
| Synonyms | LENG2|NOT3|NOT3H | |
| Cytomap | UCSC genome browser: 19q13.4 | |
| Genomic location | chr19 :54641435-54659446 | |
| Type of gene | protein-coding | |
| RefGenes | NM_014516.3, | |
| Ensembl id | ENSG00000268909 | |
| Description | CCR4-NOT transcription complex subunit 3CCR4-associated factor 3NOT3 (negative regulator of transcription 3, yeast) homologleukocyte receptor cluster member 2 | |
| Modification date | 20141207 | |
| dbXrefs | MIM : 604910 | |
| HGNC : HGNC | ||
| Ensembl : ENSG00000088038 | ||
| HPRD : 05368 | ||
| Vega : OTTHUMG00000066468 | ||
| Protein | UniProt: O75175 go to UniProt's Cross Reference DB Table | |
| Expression | CleanEX: HS_CNOT3 | |
| BioGPS: 4849 | ||
| Gene Expression Atlas: ENSG00000268909 | ||
| The Human Protein Atlas: ENSG00000268909 | ||
| Pathway | NCI Pathway Interaction Database: CNOT3 | |
| KEGG: CNOT3 | ||
| REACTOME: CNOT3 | ||
| ConsensusPathDB | ||
| Pathway Commons: CNOT3 | ||
| Metabolism | MetaCyc: CNOT3 | |
| HUMANCyc: CNOT3 | ||
| Regulation | Ensembl's Regulation: ENSG00000268909 | |
| miRBase: chr19 :54,641,435-54,659,446 | ||
| TargetScan: NM_014516 | ||
| cisRED: ENSG00000268909 | ||
| Context | iHOP: CNOT3 | |
| cancer metabolism search in PubMed: CNOT3 | ||
| UCL Cancer Institute: CNOT3 | ||
| Assigned class in ccmGDB | B - This gene belongs to cancer gene. | |
| Top |
| Phenotypic Information for CNOT3(metabolism pathway, cancer, disease, phenome) |
| Cancer | CGAP: CNOT3 |
| Familial Cancer Database: CNOT3 | |
| * This gene is included in those cancer gene databases. |
|
|
|
|
|
| . | ||||||||||||||||||||||||||||||||||||||||||||||||||||||||||||||||||||||||||||||||||||||||||||||||||||||||||||||||||||||||||||||||||||||||||||||||||||||||||||||||||||||||||||||||||||||||||||||||||||||||||||||||||||||||||||||||||||||||||||||||||||||||||||||||||||||||||||||||||||||||||||||||||||||||||||||||||||
Oncogene 1 | Significant driver gene in | |||||||||||||||||||||||||||||||||||||||||||||||||||||||||||||||||||||||||||||||||||||||||||||||||||||||||||||||||||||||||||||||||||||||||||||||||||||||||||||||||||||||||||||||||||||||||||||||||||||||||||||||||||||||||||||||||||||||||||||||||||||||||||||||||||||||||||||||||||||||||||||||||||||||||||||||||||||||||
| cf) number; DB name 1 Oncogene; http://nar.oxfordjournals.org/content/35/suppl_1/D721.long, 2 Tumor Suppressor gene; https://bioinfo.uth.edu/TSGene/, 3 Cancer Gene Census; http://www.nature.com/nrc/journal/v4/n3/abs/nrc1299.html, 4 CancerGenes; http://nar.oxfordjournals.org/content/35/suppl_1/D721.long, 5 Network of Cancer Gene; http://ncg.kcl.ac.uk/index.php, 1Therapeutic Vulnerabilities in Cancer; http://cbio.mskcc.org/cancergenomics/statius/ |
| REACTOME_METABOLISM_OF_MRNA REACTOME_METABOLISM_OF_RNA | |
| OMIM | 604910; gene. |
| Orphanet | 99861; Precursor T-cell acute lymphoblastic leukemia. |
| Disease | KEGG Disease: CNOT3 |
| MedGen: CNOT3 (Human Medical Genetics with Condition) | |
| ClinVar: CNOT3 | |
| Phenotype | MGI: CNOT3 (International Mouse Phenotyping Consortium) |
| PhenomicDB: CNOT3 | |
| Mutations for CNOT3 |
| * Under tables are showing count per each tissue to give us broad intuition about tissue specific mutation patterns.You can go to the detailed page for each mutation database's web site. |
| There's no structural variation information in COSMIC data for this gene. |
| * From mRNA Sanger sequences, Chitars2.0 arranged chimeric transcripts. This table shows CNOT3 related fusion information. |
| ID | Head Gene | Tail Gene | Accession | Gene_a | qStart_a | qEnd_a | Chromosome_a | tStart_a | tEnd_a | Gene_a | qStart_a | qEnd_a | Chromosome_a | tStart_a | tEnd_a |
| Top |
| Mutation type/ Tissue ID | brca | cns | cerv | endome | haematopo | kidn | Lintest | liver | lung | ns | ovary | pancre | prost | skin | stoma | thyro | urina | |||
| Total # sample | 1 | |||||||||||||||||||
| GAIN (# sample) | 1 | |||||||||||||||||||
| LOSS (# sample) |
| cf) Tissue ID; Tissue type (1; Breast, 2; Central_nervous_system, 3; Cervix, 4; Endometrium, 5; Haematopoietic_and_lymphoid_tissue, 6; Kidney, 7; Large_intestine, 8; Liver, 9; Lung, 10; NS, 11; Ovary, 12; Pancreas, 13; Prostate, 14; Skin, 15; Stomach, 16; Thyroid, 17; Urinary_tract) |
| Top |
|
 |
| Top |
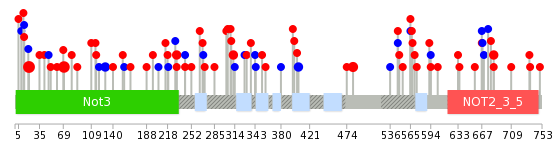
| Stat. for Non-Synonymous SNVs (# total SNVs=56) | (# total SNVs=19) |
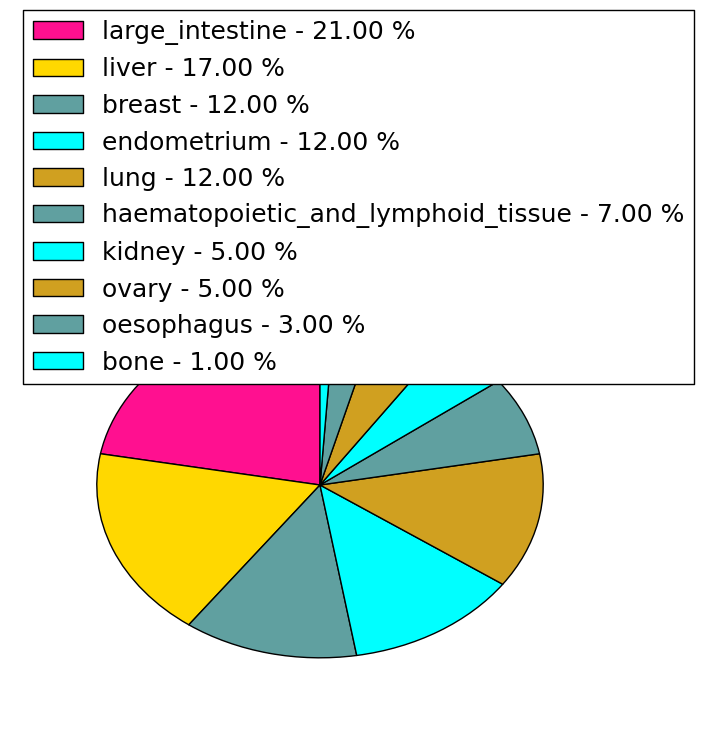 | 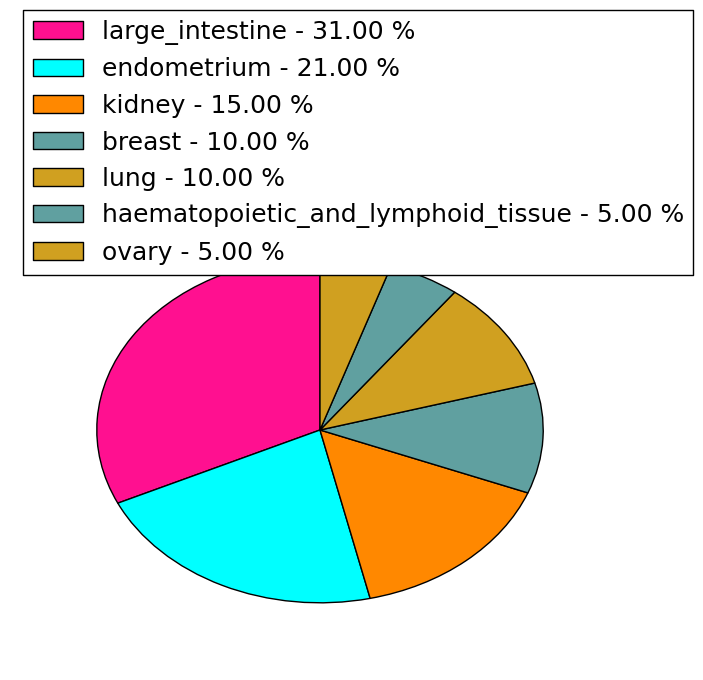 |
(# total SNVs=4) | (# total SNVs=2) |
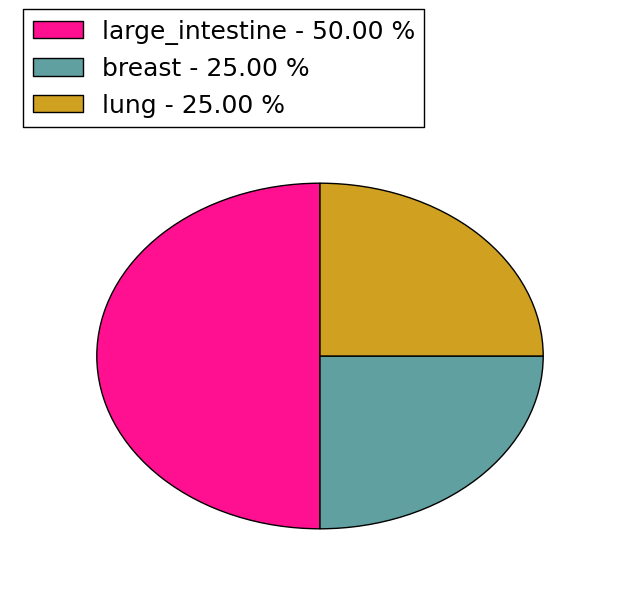 |  |
| Top |
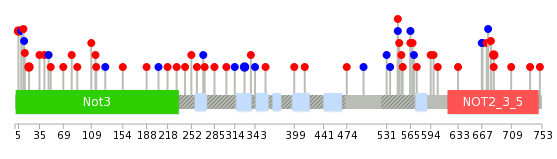
| * When you move the cursor on each content, you can see more deailed mutation information on the Tooltip. Those are primary_site,primary_histology,mutation(aa),pubmedID. |
| GRCh37 position | Mutation(aa) | Unique sampleID count |
| chr19:54646887-54646887 | p.E20K | 7 |
| chr19:54647435-54647435 | p.E70K | 6 |
| chr19:54649671-54649671 | p.P243P | 3 |
| chr19:54653335-54653335 | p.V483M | 3 |
| chr19:54649666-54649667 | p.P244fs*9 | 3 |
| chr19:54649696-54649696 | p.E252K | 2 |
| chr19:54651924-54651924 | p.Q312H | 2 |
| chr19:54652203-54652203 | p.G405G | 2 |
| chr19:54647870-54647870 | p.T129T | 2 |
| chr19:54657465-54657465 | p.Q684R | 2 |
| Top |
|
 |
| Point Mutation/ Tissue ID | 1 | 2 | 3 | 4 | 5 | 6 | 7 | 8 | 9 | 10 | 11 | 12 | 13 | 14 | 15 | 16 | 17 | 18 | 19 | 20 |
| # sample | 5 | 3 | 10 | 4 | 5 | 5 | 2 | 3 | 1 | 2 | 7 | 6 | 9 | |||||||
| # mutation | 6 | 3 | 8 | 4 | 5 | 5 | 2 | 4 | 1 | 2 | 7 | 7 | 12 | |||||||
| nonsynonymous SNV | 5 | 3 | 4 | 3 | 3 | 4 | 2 | 3 | 1 | 2 | 4 | 6 | 8 | |||||||
| synonymous SNV | 1 | 4 | 1 | 2 | 1 | 1 | 3 | 1 | 4 |
| cf) Tissue ID; Tissue type (1; BLCA[Bladder Urothelial Carcinoma], 2; BRCA[Breast invasive carcinoma], 3; CESC[Cervical squamous cell carcinoma and endocervical adenocarcinoma], 4; COAD[Colon adenocarcinoma], 5; GBM[Glioblastoma multiforme], 6; Glioma Low Grade, 7; HNSC[Head and Neck squamous cell carcinoma], 8; KICH[Kidney Chromophobe], 9; KIRC[Kidney renal clear cell carcinoma], 10; KIRP[Kidney renal papillary cell carcinoma], 11; LAML[Acute Myeloid Leukemia], 12; LUAD[Lung adenocarcinoma], 13; LUSC[Lung squamous cell carcinoma], 14; OV[Ovarian serous cystadenocarcinoma ], 15; PAAD[Pancreatic adenocarcinoma], 16; PRAD[Prostate adenocarcinoma], 17; SKCM[Skin Cutaneous Melanoma], 18:STAD[Stomach adenocarcinoma], 19:THCA[Thyroid carcinoma], 20:UCEC[Uterine Corpus Endometrial Carcinoma]) |
| Top |
| * We represented just top 10 SNVs. When you move the cursor on each content, you can see more deailed mutation information on the Tooltip. Those are primary_site, primary_histology, mutation(aa), pubmedID. |
| Genomic Position | Mutation(aa) | Unique sampleID count |
| chr19:54651972 | p.P328P | 2 |
| chr19:54646728 | p.R5H | 2 |
| chr19:54646887 | p.E20K | 2 |
| chr19:54657465 | p.Q684R | 2 |
| chr19:54659091 | p.L565L | 1 |
| chr19:54655998 | p.K736N | 1 |
| chr19:54647235 | p.D115Y | 1 |
| chr19:54649502 | p.T337I | 1 |
| chr19:54656270 | p.R568Q | 1 |
| chr19:54651998 | p.R750Q | 1 |
| * Copy number data were extracted from TCGA using R package TCGA-Assembler. The URLs of all public data files on TCGA DCC data server were gathered on Jan-05-2015. Function ProcessCNAData in TCGA-Assembler package was used to obtain gene-level copy number value which is calculated as the average copy number of the genomic region of a gene. |
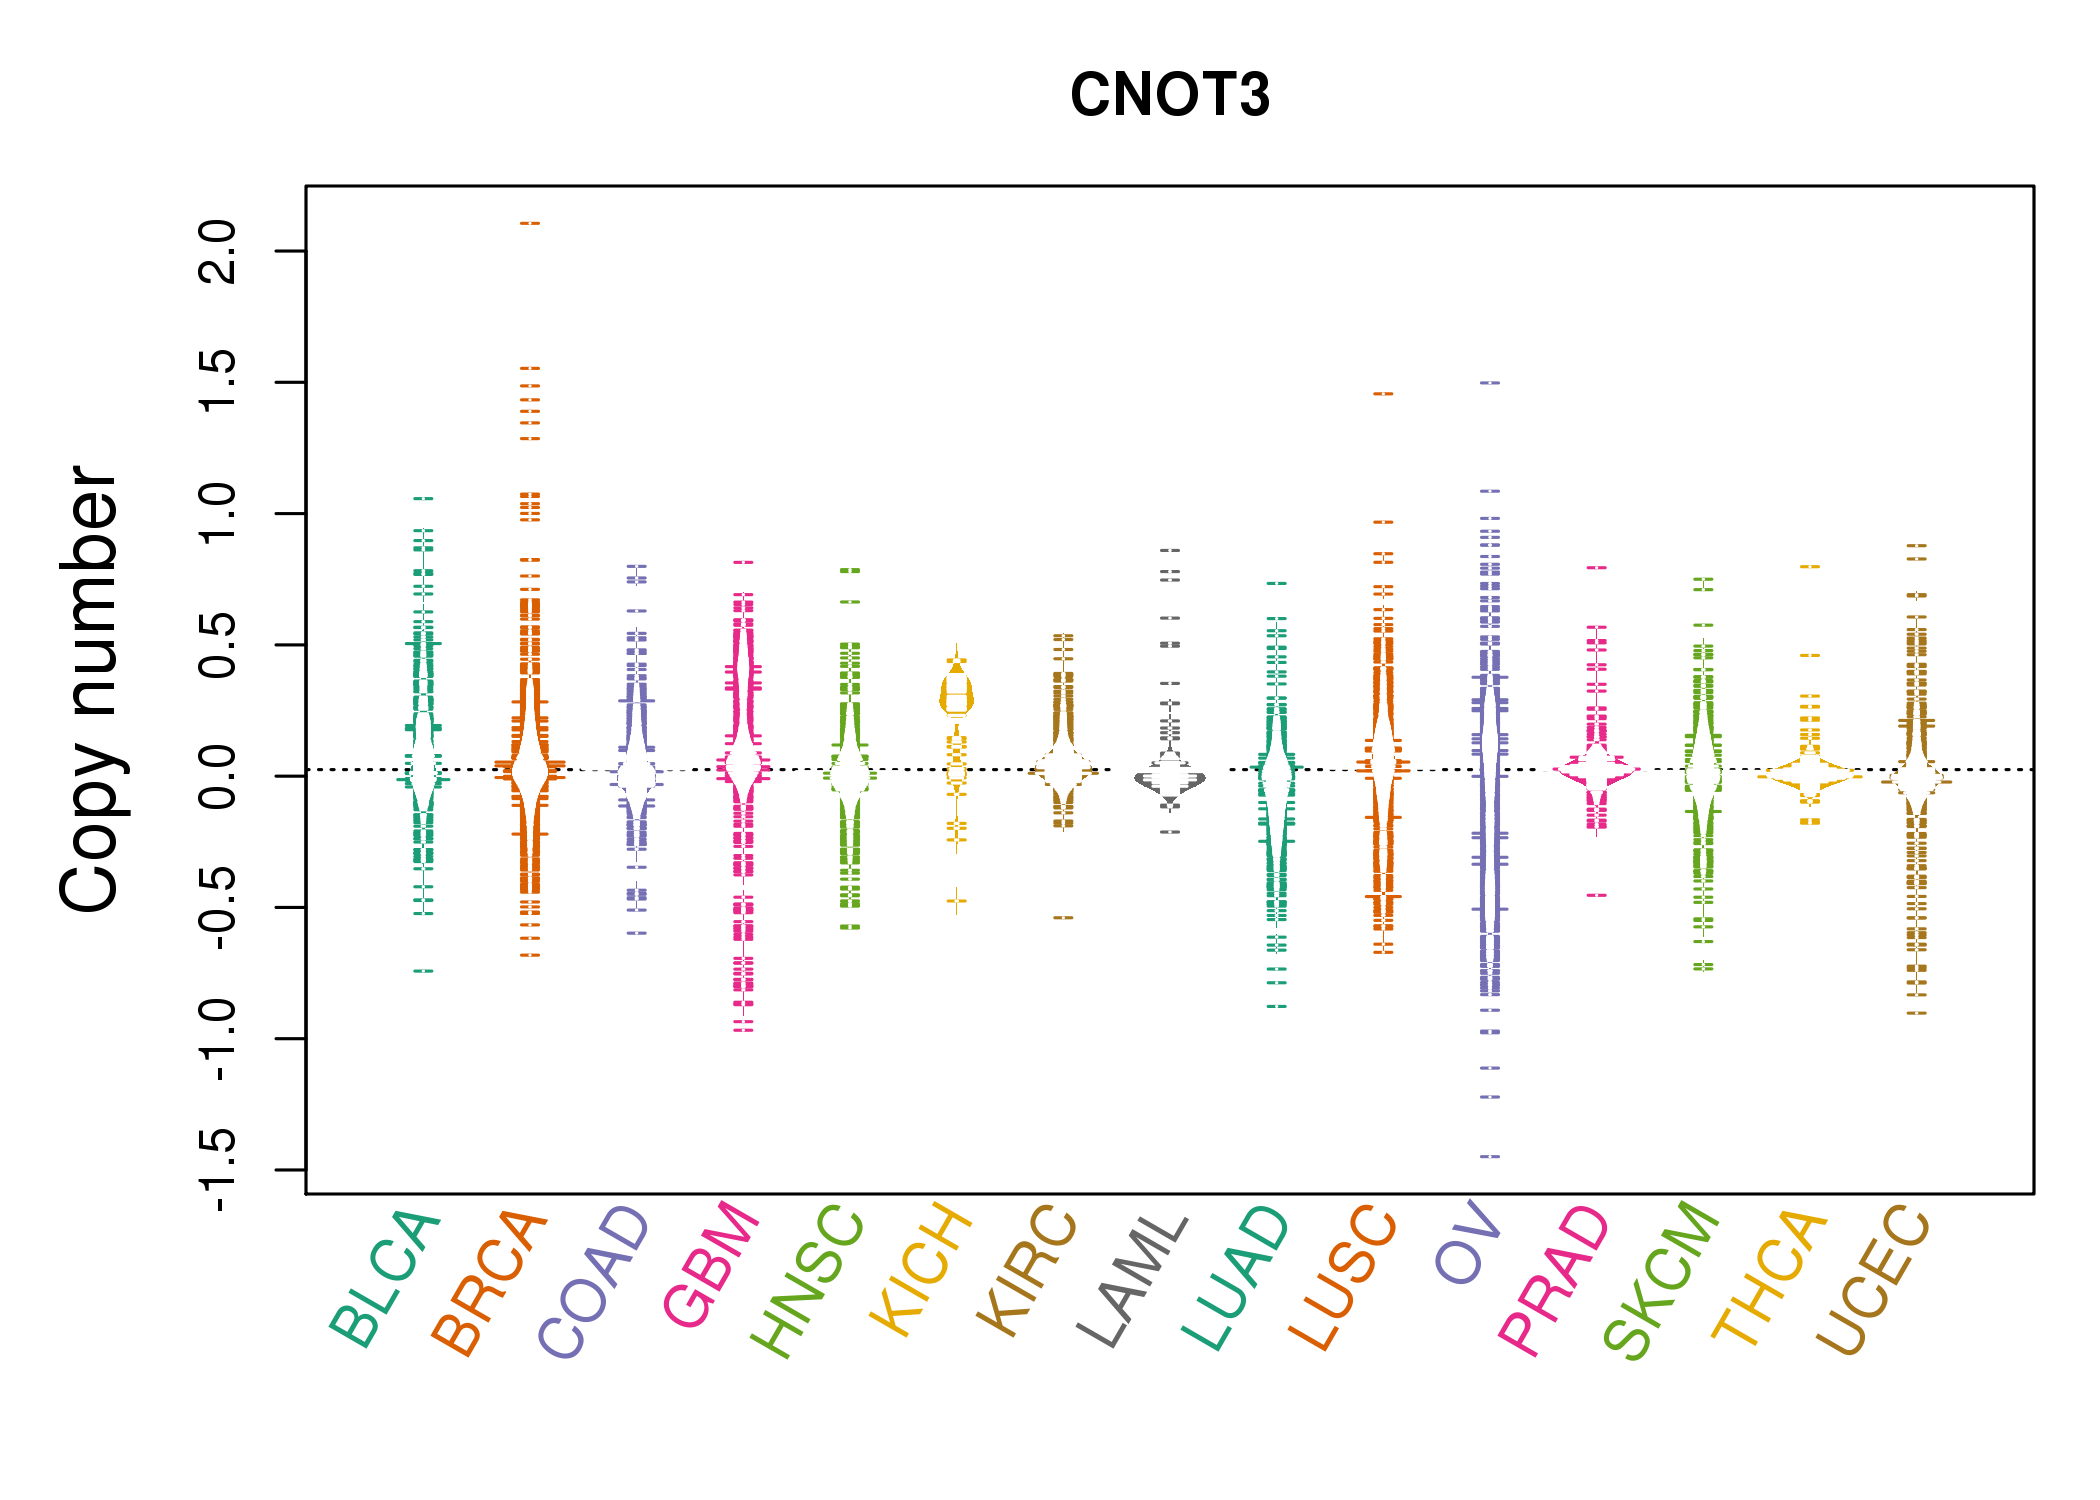 |
| cf) Tissue ID[Tissue type]: BLCA[Bladder Urothelial Carcinoma], BRCA[Breast invasive carcinoma], CESC[Cervical squamous cell carcinoma and endocervical adenocarcinoma], COAD[Colon adenocarcinoma], GBM[Glioblastoma multiforme], Glioma Low Grade, HNSC[Head and Neck squamous cell carcinoma], KICH[Kidney Chromophobe], KIRC[Kidney renal clear cell carcinoma], KIRP[Kidney renal papillary cell carcinoma], LAML[Acute Myeloid Leukemia], LUAD[Lung adenocarcinoma], LUSC[Lung squamous cell carcinoma], OV[Ovarian serous cystadenocarcinoma ], PAAD[Pancreatic adenocarcinoma], PRAD[Prostate adenocarcinoma], SKCM[Skin Cutaneous Melanoma], STAD[Stomach adenocarcinoma], THCA[Thyroid carcinoma], UCEC[Uterine Corpus Endometrial Carcinoma] |
| Top |
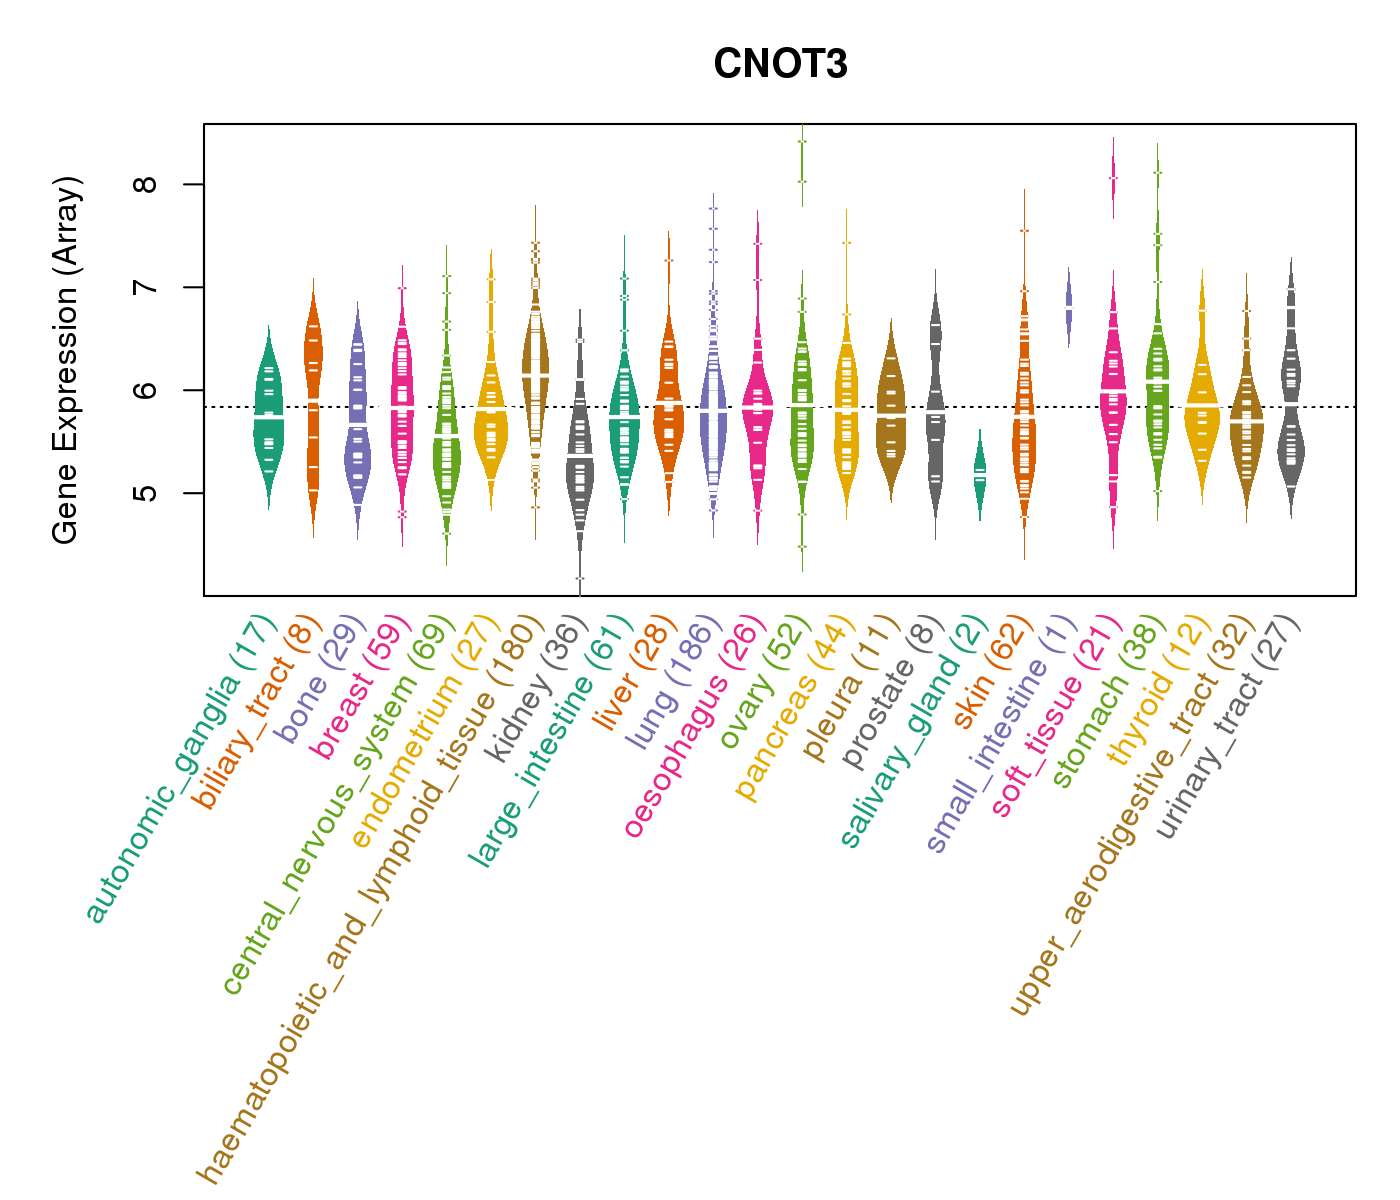
| Gene Expression for CNOT3 |
| * CCLE gene expression data were extracted from CCLE_Expression_Entrez_2012-10-18.res: Gene-centric RMA-normalized mRNA expression data. |
 |
| * Normalized gene expression data of RNASeqV2 was extracted from TCGA using R package TCGA-Assembler. The URLs of all public data files on TCGA DCC data server were gathered at Jan-05-2015. Only eight cancer types have enough normal control samples for differential expression analysis. (t test, adjusted p<0.05 (using Benjamini-Hochberg FDR)) |
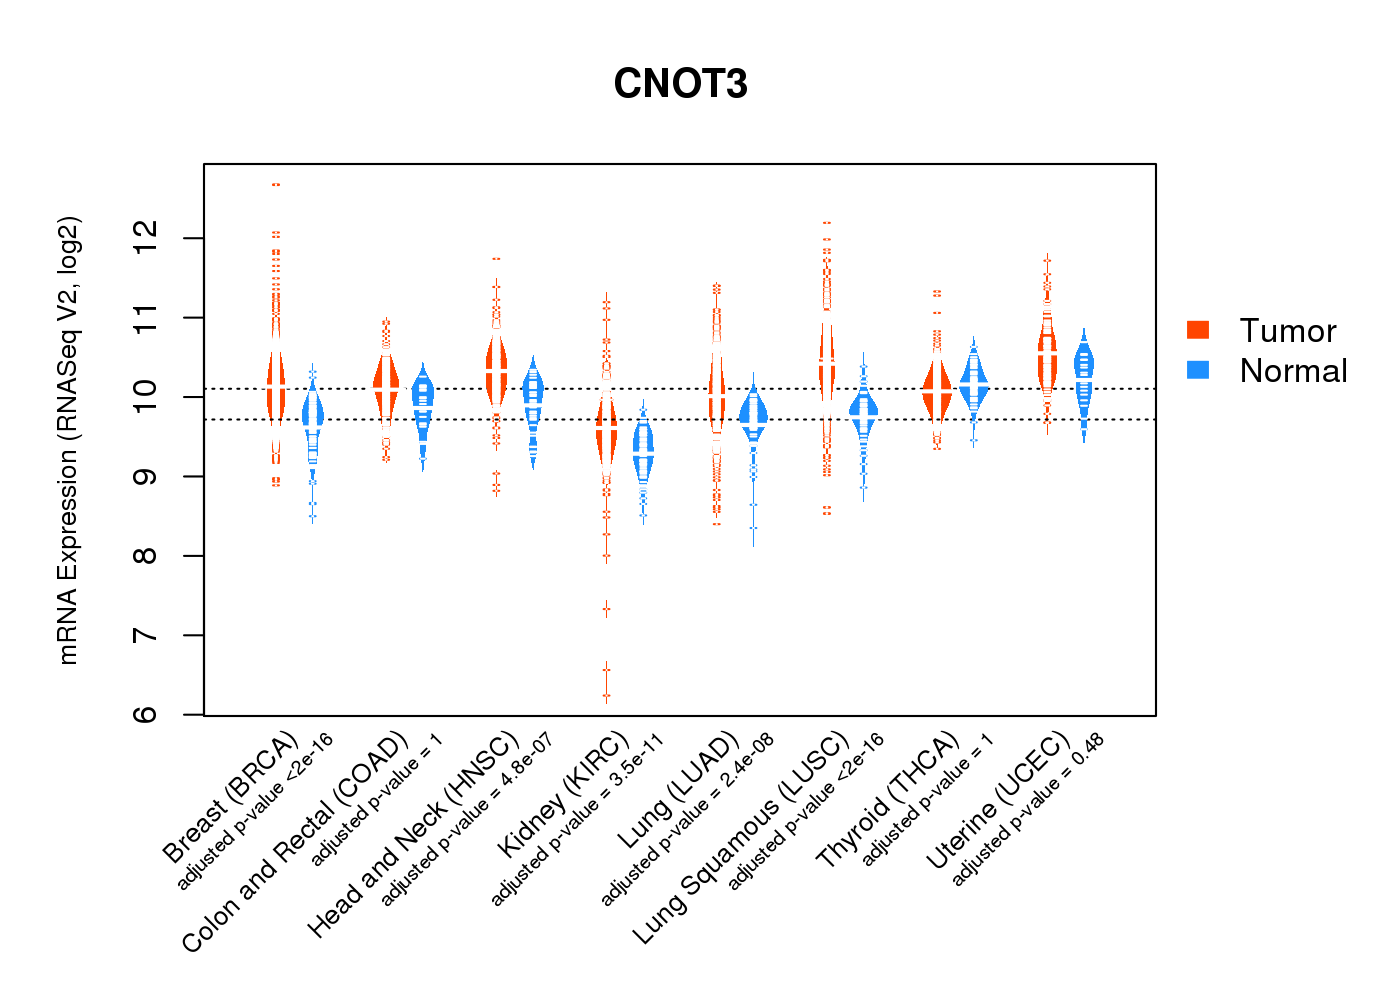 |
| Top |
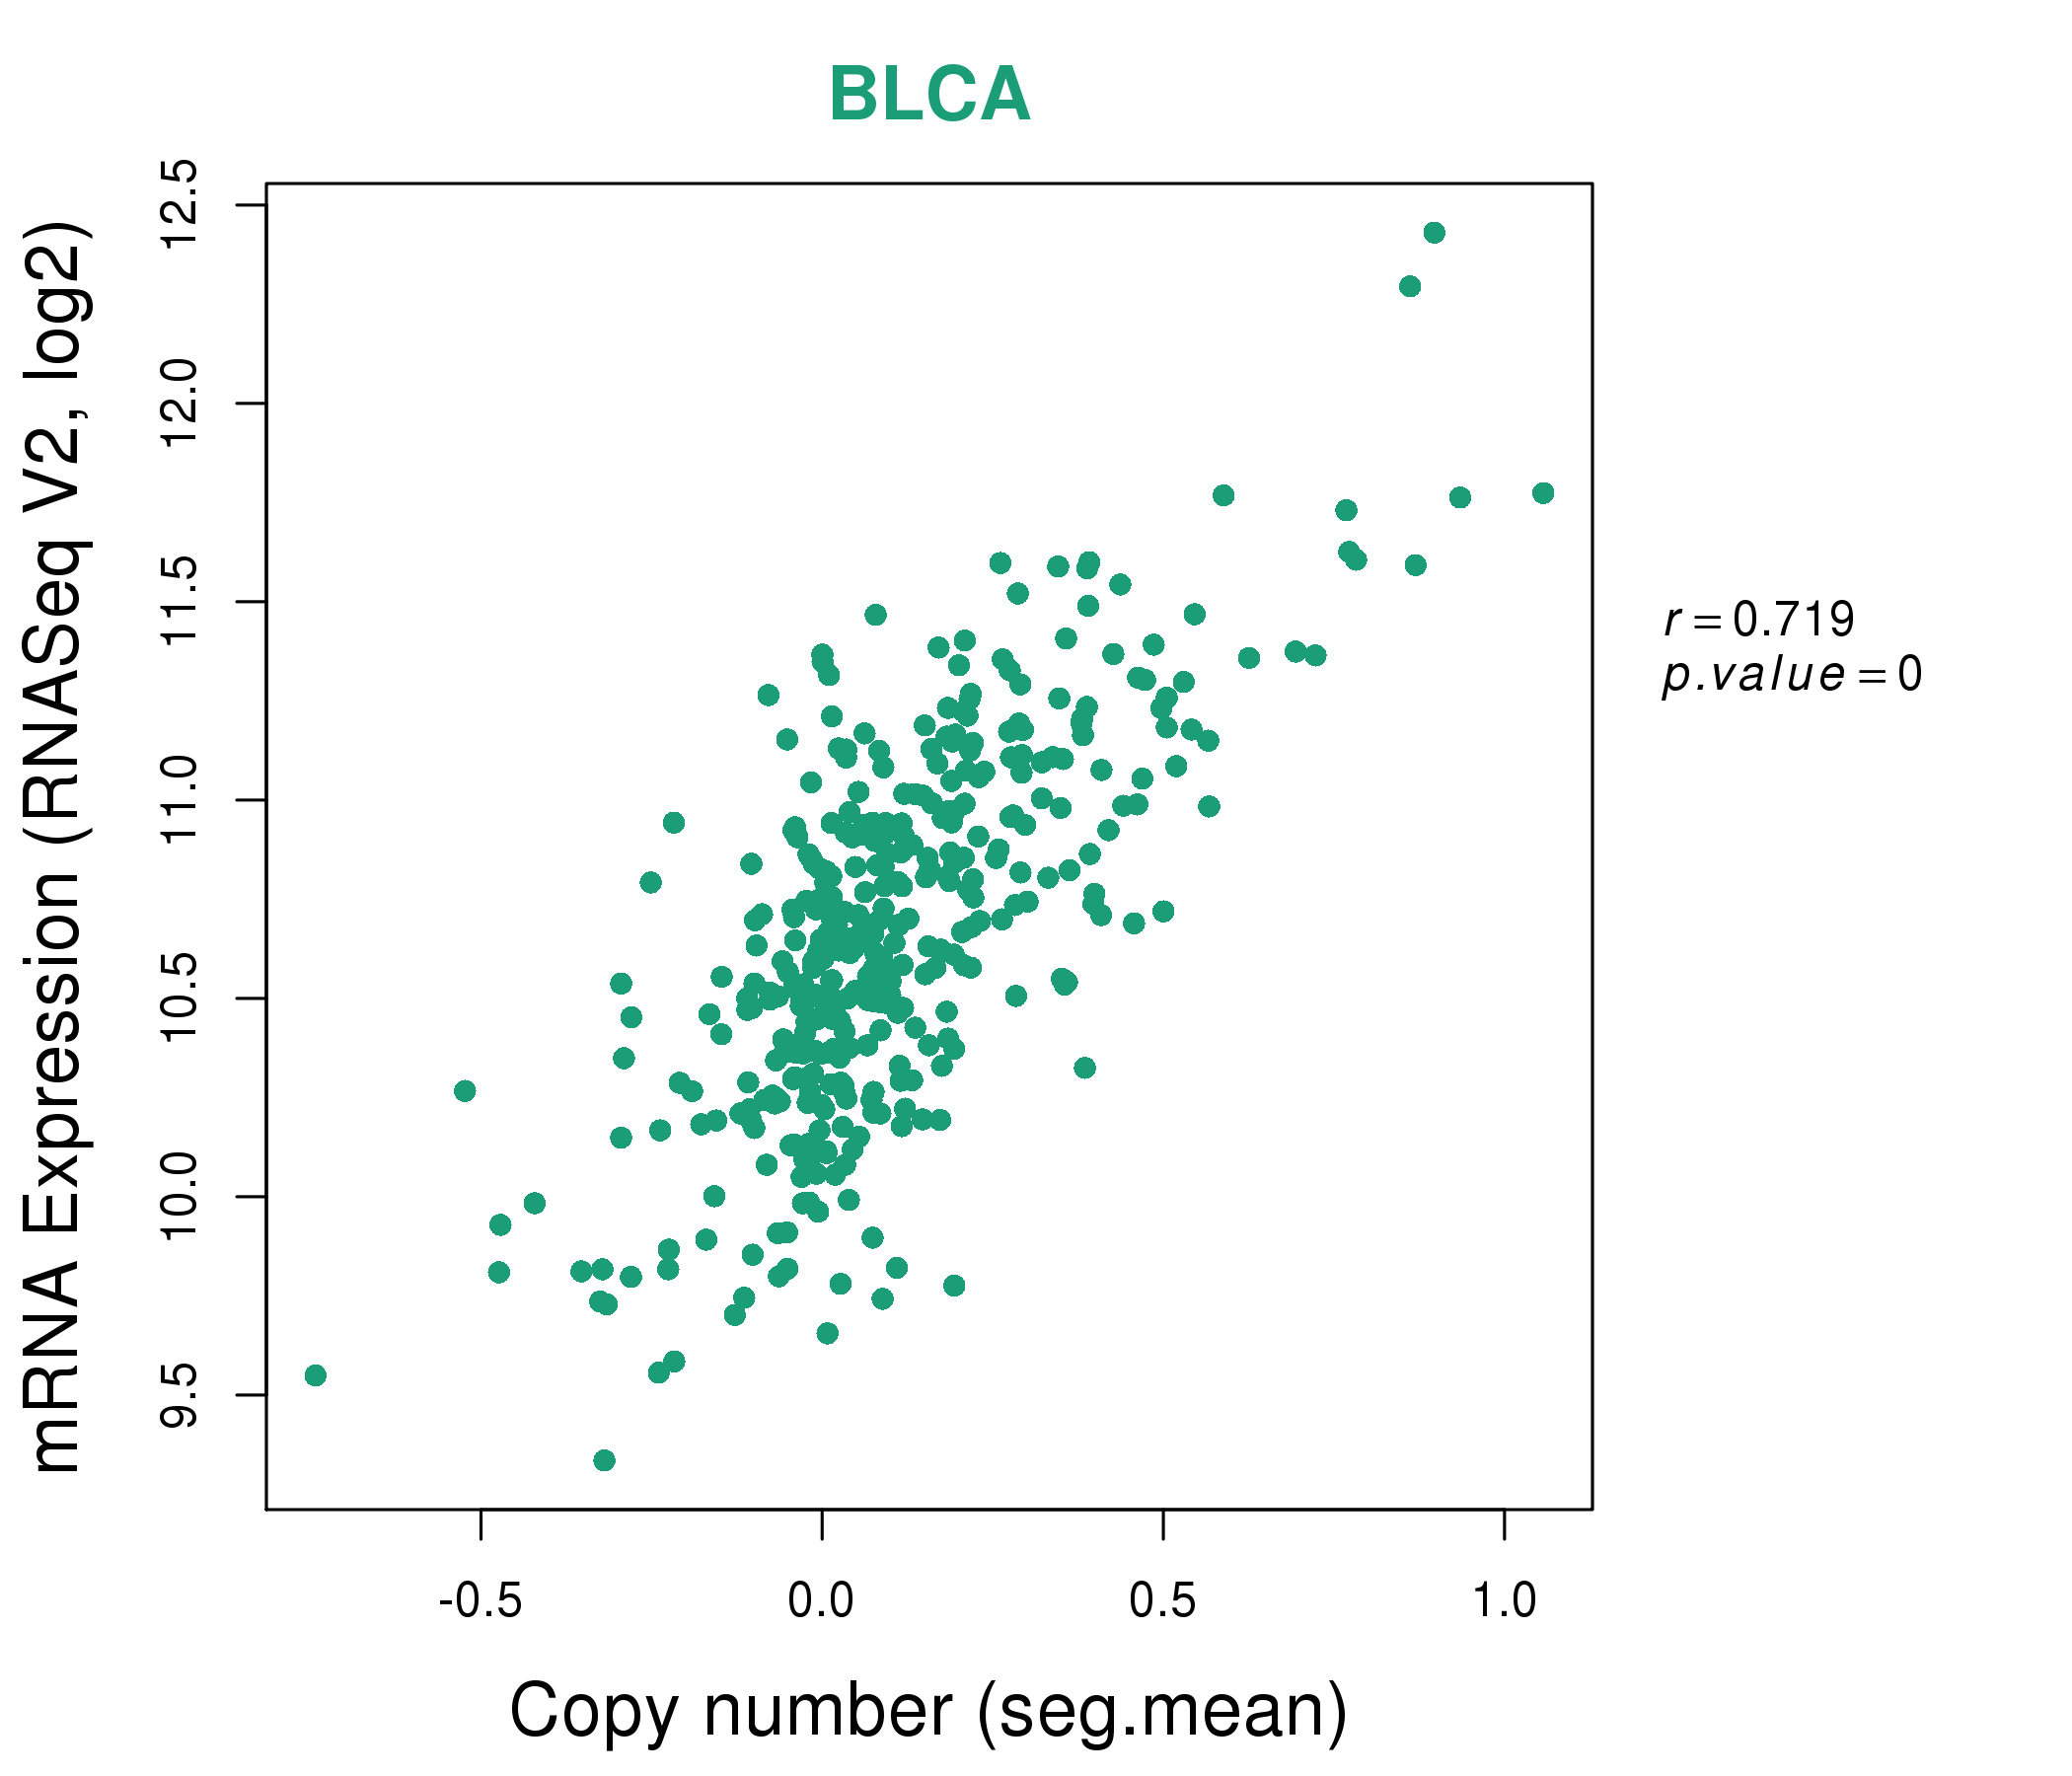
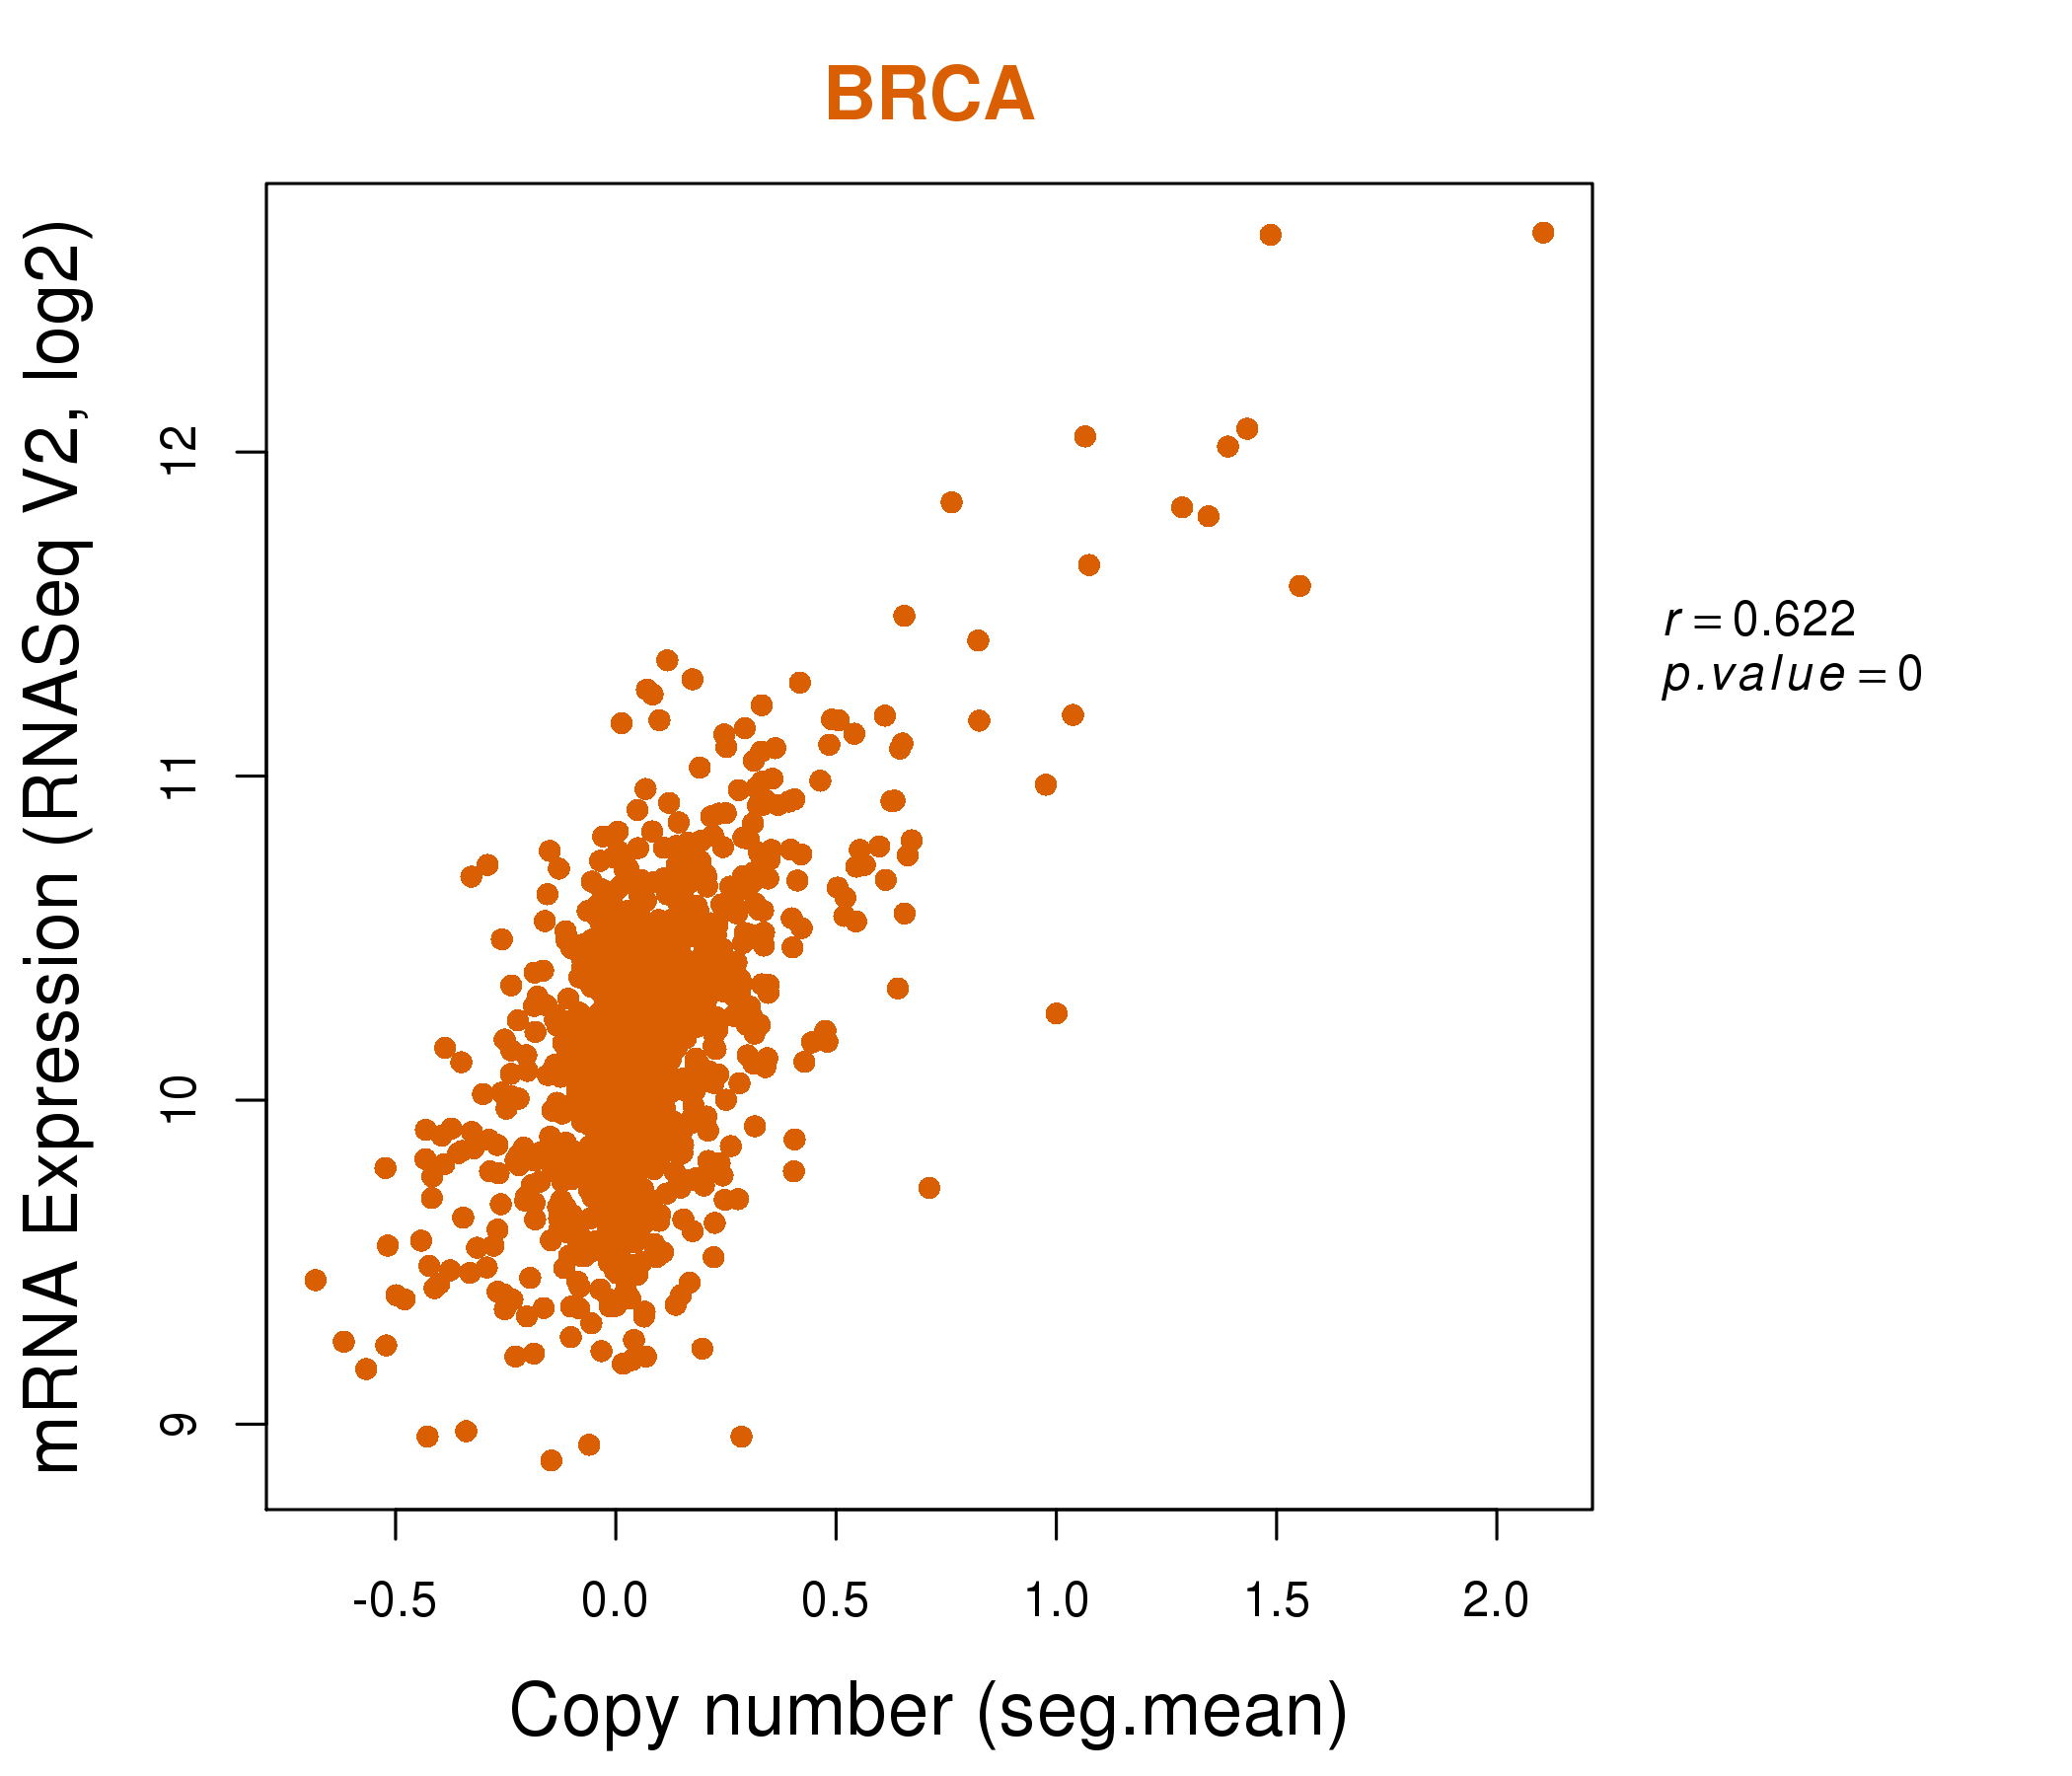
| * This plots show the correlation between CNV and gene expression. |
: Open all plots for all cancer types
 |
|
 |
|

| Top |
| Gene-Gene Network Information |
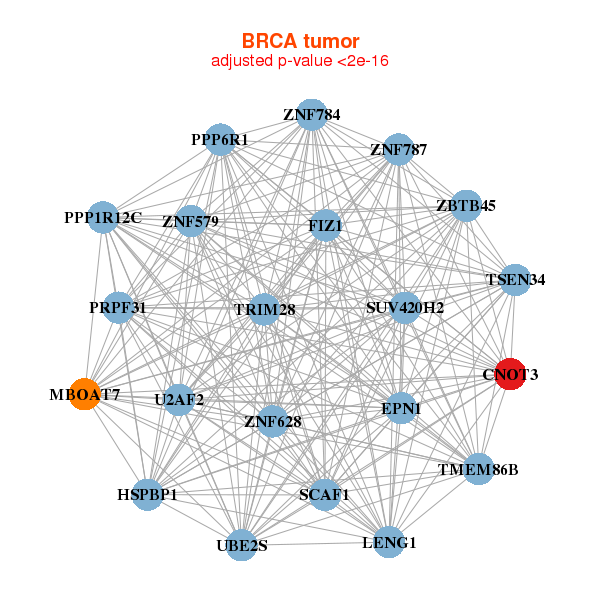
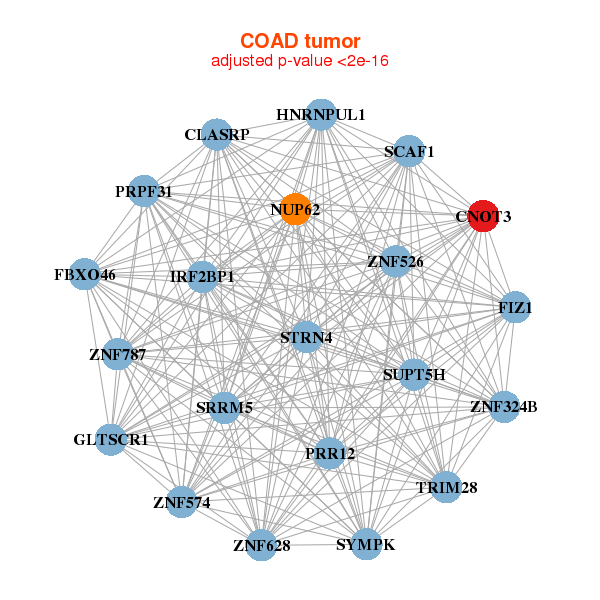
| * Co-Expression network figures were drawn using R package igraph. Only the top 20 genes with the highest correlations were shown. Red circle: input gene, orange circle: cell metabolism gene, sky circle: other gene |
: Open all plots for all cancer types
 |
|
| CNOT3,EPN1,FIZ1,HSPBP1,LENG1,MBOAT7,PPP1R12C, PRPF31,PPP6R1,SCAF1,SUV420H2,TMEM86B,TRIM28,TSEN34, U2AF2,UBE2S,ZBTB45,ZNF579,ZNF628,ZNF784,ZNF787 | ATF6B,AXIN1,C9orf114,CHERP,CNOT3,CXXC1,DGCR2, EHMT2,FBRS,FZR1,GGA1,MOGS,NDOR1,SLC12A9, SNAPC4,TRIM28,U2AF2,USP20,NELFA,ZFYVE27,ZNF446 |
 |
|
| CNOT3,FBXO46,FIZ1,GLTSCR1,HNRNPUL1,IRF2BP1,NUP62, PRPF31,PRR12,SCAF1,CLASRP,SRRM5,STRN4,SUPT5H, SYMPK,TRIM28,ZNF324B,ZNF526,ZNF574,ZNF628,ZNF787 | ACIN1,ATXN2L,CEP131,BRPF1,CNOT3,CPSF1,DIS3L2, EHMT1,FBXL19,MCM3AP,POLE,POLG,PPIL2,SCRIB, SMARCA4,SNAPC4,SNRNP70,SYMPK,TRIM41,ZMIZ2,ZNF335 |
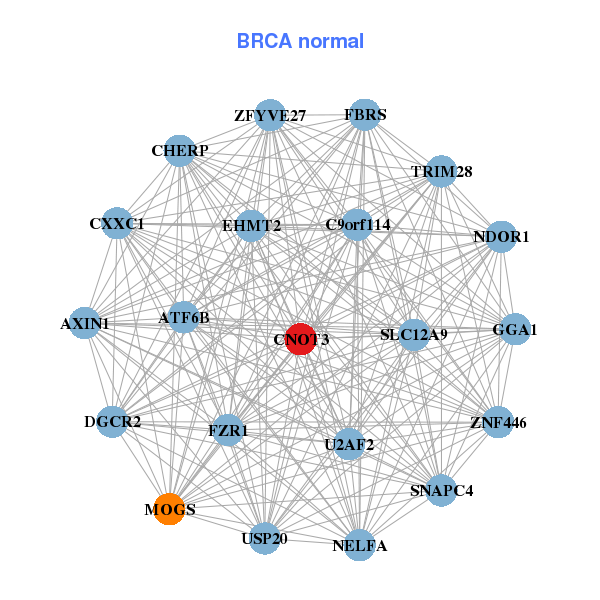

| * Co-Expression network figures were drawn using R package igraph. Only the top 20 genes with the highest correlations were shown. Red circle: input gene, orange circle: cell metabolism gene, sky circle: other gene |
: Open all plots for all cancer types
| Top |
: Open all interacting genes' information including KEGG pathway for all interacting genes from DAVID
| Top |
| Pharmacological Information for CNOT3 |
| There's no related Drug. |
| Top |
| Cross referenced IDs for CNOT3 |
| * We obtained these cross-references from Uniprot database. It covers 150 different DBs, 18 categories. http://www.uniprot.org/help/cross_references_section |
: Open all cross reference information
|
Copyright © 2016-Present - The Univsersity of Texas Health Science Center at Houston @ |