|
|||||||||||||||||||||||||||||||||||||||||||||||||||||||||||||||||||||||||||||||||||||||||||||||||||||||||||||||||||||||||||||||||||||||||||||||||||||||||||||||||||||||||||||||||||||||||||||||||||||||||||||||||||||||||||||||||||||||||||||||||||||||||||||||||||||||||||||||||||||||||||||||||||||||||||||||||||||||||||||||||||||||||||||||||||||||||||||||||||||||||||||||||||||||||||||||||||||||||||||||||||||||||||||||||||||||||||||||||||||||||||||||||||||||||||
| |
| Phenotypic Information (metabolism pathway, cancer, disease, phenome) |
| |
| |
| Gene-Gene Network Information: Co-Expression Network, Interacting Genes & KEGG |
| |
|


| Gene Summary for PNP |
| Top |
| Phenotypic Information for PNP(metabolism pathway, cancer, disease, phenome) |
| Cancer | CGAP: PNP |
| Familial Cancer Database: PNP | |
| * This gene is included in those cancer gene databases. |
|
|
|
|
|
| . | |||||||||||||||||||||||||||||||||||||||||||||||||||||||||||||||||||||||||||||||||||||||||||||||||||||||||||||||||||||||||||||||||||||||||||||||||||||||||||||||||||||||||||||||||||||||||||||||||||||||||||||||||||||||||||||||||||||||||||||||||||||||||||||||||||||||||||||||||||||||||||||||||||||||||||||||||||||||||||||||||||||||||||||||||||||||||||||||||||||||||||||||||||||||||||||||||||||||||||||||||||||||||||||||||||||||||||||||||||||||||||||||||||||
Oncogene 1 | Significant driver gene in | ||||||||||||||||||||||||||||||||||||||||||||||||||||||||||||||||||||||||||||||||||||||||||||||||||||||||||||||||||||||||||||||||||||||||||||||||||||||||||||||||||||||||||||||||||||||||||||||||||||||||||||||||||||||||||||||||||||||||||||||||||||||||||||||||||||||||||||||||||||||||||||||||||||||||||||||||||||||||||||||||||||||||||||||||||||||||||||||||||||||||||||||||||||||||||||||||||||||||||||||||||||||||||||||||||||||||||||||||||||||||||||||||||||||||||
| cf) number; DB name 1 Oncogene; http://nar.oxfordjournals.org/content/35/suppl_1/D721.long, 2 Tumor Suppressor gene; https://bioinfo.uth.edu/TSGene/, 3 Cancer Gene Census; http://www.nature.com/nrc/journal/v4/n3/abs/nrc1299.html, 4 CancerGenes; http://nar.oxfordjournals.org/content/35/suppl_1/D721.long, 5 Network of Cancer Gene; http://ncg.kcl.ac.uk/index.php, 1Therapeutic Vulnerabilities in Cancer; http://cbio.mskcc.org/cancergenomics/statius/ |
| KEGG_PURINE_METABOLISM KEGG_PYRIMIDINE_METABOLISM KEGG_NICOTINATE_AND_NICOTINAMIDE_METABOLISM REACTOME_METABOLISM_OF_NUCLEOTIDES REACTOME_PURINE_METABOLISM | |
| OMIM | |
| Orphanet | |
| Disease | KEGG Disease: PNP |
| MedGen: PNP (Human Medical Genetics with Condition) | |
| ClinVar: PNP | |
| Phenotype | MGI: PNP (International Mouse Phenotyping Consortium) |
| PhenomicDB: PNP | |
| Mutations for PNP |
| * Under tables are showing count per each tissue to give us broad intuition about tissue specific mutation patterns.You can go to the detailed page for each mutation database's web site. |
| There's no structural variation information in COSMIC data for this gene. |
| * From mRNA Sanger sequences, Chitars2.0 arranged chimeric transcripts. This table shows PNP related fusion information. |
| ID | Head Gene | Tail Gene | Accession | Gene_a | qStart_a | qEnd_a | Chromosome_a | tStart_a | tEnd_a | Gene_a | qStart_a | qEnd_a | Chromosome_a | tStart_a | tEnd_a |
| AF116670 | SUV420H1 | 1 | 275 | 11 | 67944564 | 67944838 | PNP | 266 | 1085 | 14 | 20943299 | 20945248 | |
| BQ315891 | PNP | 2 | 151 | 14 | 20944895 | 20945047 | RAB7A | 151 | 324 | 3 | 128516859 | 128525334 | |
| AI064779 | APOA2 | 21 | 494 | 1 | 161192082 | 161193418 | PNP | 492 | 553 | 14 | 20944930 | 20944991 | |
| AI133239 | SUV420H1 | 1 | 275 | 11 | 67944564 | 67944838 | PNP | 266 | 669 | 14 | 20943299 | 20944832 | |
| Top |
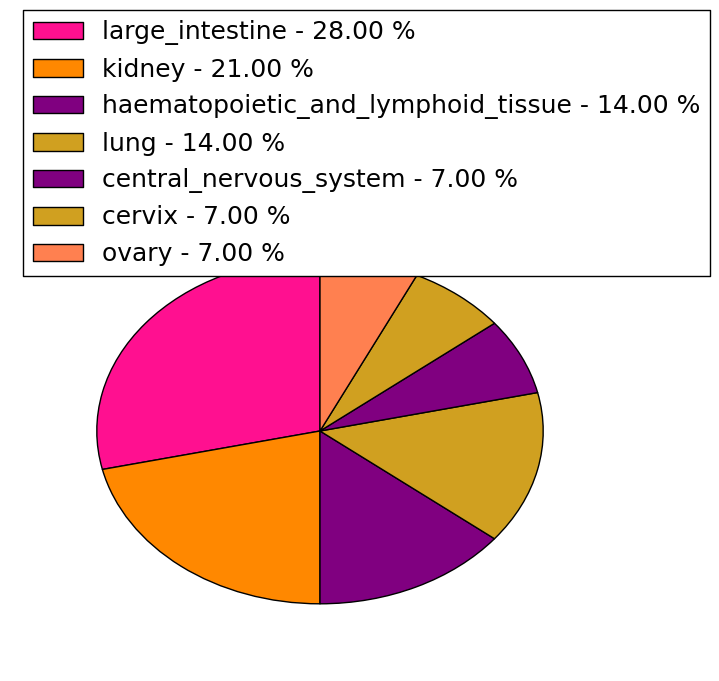
| Mutation type/ Tissue ID | brca | cns | cerv | endome | haematopo | kidn | Lintest | liver | lung | ns | ovary | pancre | prost | skin | stoma | thyro | urina | |||
| Total # sample | 1 | 1 | ||||||||||||||||||
| GAIN (# sample) | 1 | |||||||||||||||||||
| LOSS (# sample) | 1 |
| cf) Tissue ID; Tissue type (1; Breast, 2; Central_nervous_system, 3; Cervix, 4; Endometrium, 5; Haematopoietic_and_lymphoid_tissue, 6; Kidney, 7; Large_intestine, 8; Liver, 9; Lung, 10; NS, 11; Ovary, 12; Pancreas, 13; Prostate, 14; Skin, 15; Stomach, 16; Thyroid, 17; Urinary_tract) |
| Top |
|
 |
| Top |
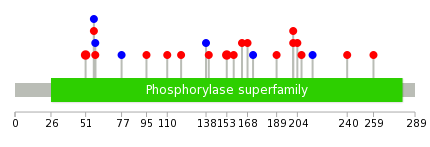
| Stat. for Non-Synonymous SNVs (# total SNVs=14) | (# total SNVs=2) |
 |  |
(# total SNVs=2) | (# total SNVs=0) |
 |
| Top |
| * When you move the cursor on each content, you can see more deailed mutation information on the Tooltip. Those are primary_site,primary_histology,mutation(aa),pubmedID. |
| GRCh37 position | Mutation(aa) | Unique sampleID count |
| chr14:20943360-20943360 | p.E201K | 2 |
| chr14:20940606-20940606 | p.G51S | 2 |
| chr14:20943103-20943103 | p.E153K | 2 |
| chr14:20942733-20942733 | p.K95M | 1 |
| chr14:20942975-20942975 | p.T110I | 1 |
| chr14:20943361-20943361 | p.E201V | 1 |
| chr14:20943005-20943005 | p.L120P | 1 |
| chr14:20943370-20943370 | p.A204V | 1 |
| chr14:20940544-20940545 | p.I30fs*10 | 1 |
| chr14:20943058-20943058 | p.L138L | 1 |
| Top |
|
 |
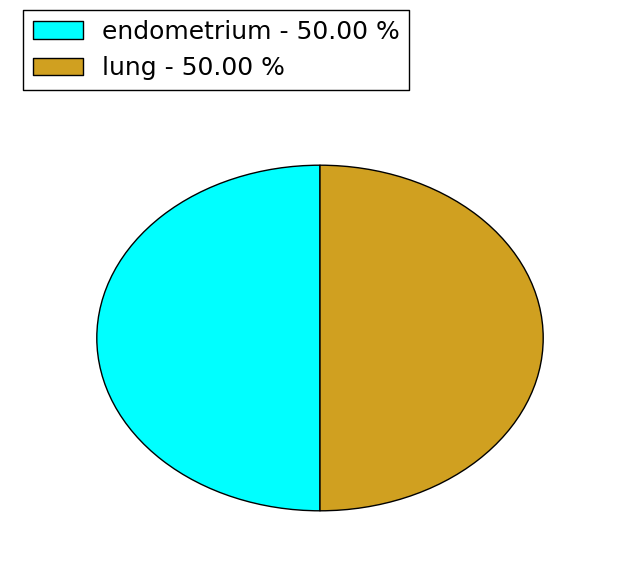
| Point Mutation/ Tissue ID | 1 | 2 | 3 | 4 | 5 | 6 | 7 | 8 | 9 | 10 | 11 | 12 | 13 | 14 | 15 | 16 | 17 | 18 | 19 | 20 |
| # sample | 4 | 1 | 1 | 2 | 1 | 4 | 1 | 1 | ||||||||||||
| # mutation | 3 | 1 | 1 | 2 | 1 | 4 | 1 | 1 | ||||||||||||
| nonsynonymous SNV | 3 | 1 | 1 | 1 | 1 | 2 | ||||||||||||||
| synonymous SNV | 1 | 2 | 1 | 1 |
| cf) Tissue ID; Tissue type (1; BLCA[Bladder Urothelial Carcinoma], 2; BRCA[Breast invasive carcinoma], 3; CESC[Cervical squamous cell carcinoma and endocervical adenocarcinoma], 4; COAD[Colon adenocarcinoma], 5; GBM[Glioblastoma multiforme], 6; Glioma Low Grade, 7; HNSC[Head and Neck squamous cell carcinoma], 8; KICH[Kidney Chromophobe], 9; KIRC[Kidney renal clear cell carcinoma], 10; KIRP[Kidney renal papillary cell carcinoma], 11; LAML[Acute Myeloid Leukemia], 12; LUAD[Lung adenocarcinoma], 13; LUSC[Lung squamous cell carcinoma], 14; OV[Ovarian serous cystadenocarcinoma ], 15; PAAD[Pancreatic adenocarcinoma], 16; PRAD[Prostate adenocarcinoma], 17; SKCM[Skin Cutaneous Melanoma], 18:STAD[Stomach adenocarcinoma], 19:THCA[Thyroid carcinoma], 20:UCEC[Uterine Corpus Endometrial Carcinoma]) |
| Top |
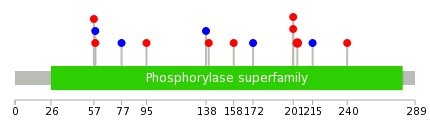
| * We represented just top 10 SNVs. When you move the cursor on each content, you can see more deailed mutation information on the Tooltip. Those are primary_site, primary_histology, mutation(aa), pubmedID. |
| Genomic Position | Mutation(aa) | Unique sampleID count |
| chr14:20943370 | p.A204V | 2 |
| chr14:20943275 | p.D215D | 1 |
| chr14:20943360 | p.L240F | 1 |
| chr14:20943361 | p.P57S | 1 |
| chr14:20940624 | p.R58Q | 1 |
| chr14:20940628 | p.R58R | 1 |
| chr14:20943404 | p.A77A | 1 |
| chr14:20940629 | p.K95M | 1 |
| chr14:20944608 | p.L138L | 1 |
| chr14:20942680 | p.G140C | 1 |
| * Copy number data were extracted from TCGA using R package TCGA-Assembler. The URLs of all public data files on TCGA DCC data server were gathered on Jan-05-2015. Function ProcessCNAData in TCGA-Assembler package was used to obtain gene-level copy number value which is calculated as the average copy number of the genomic region of a gene. |
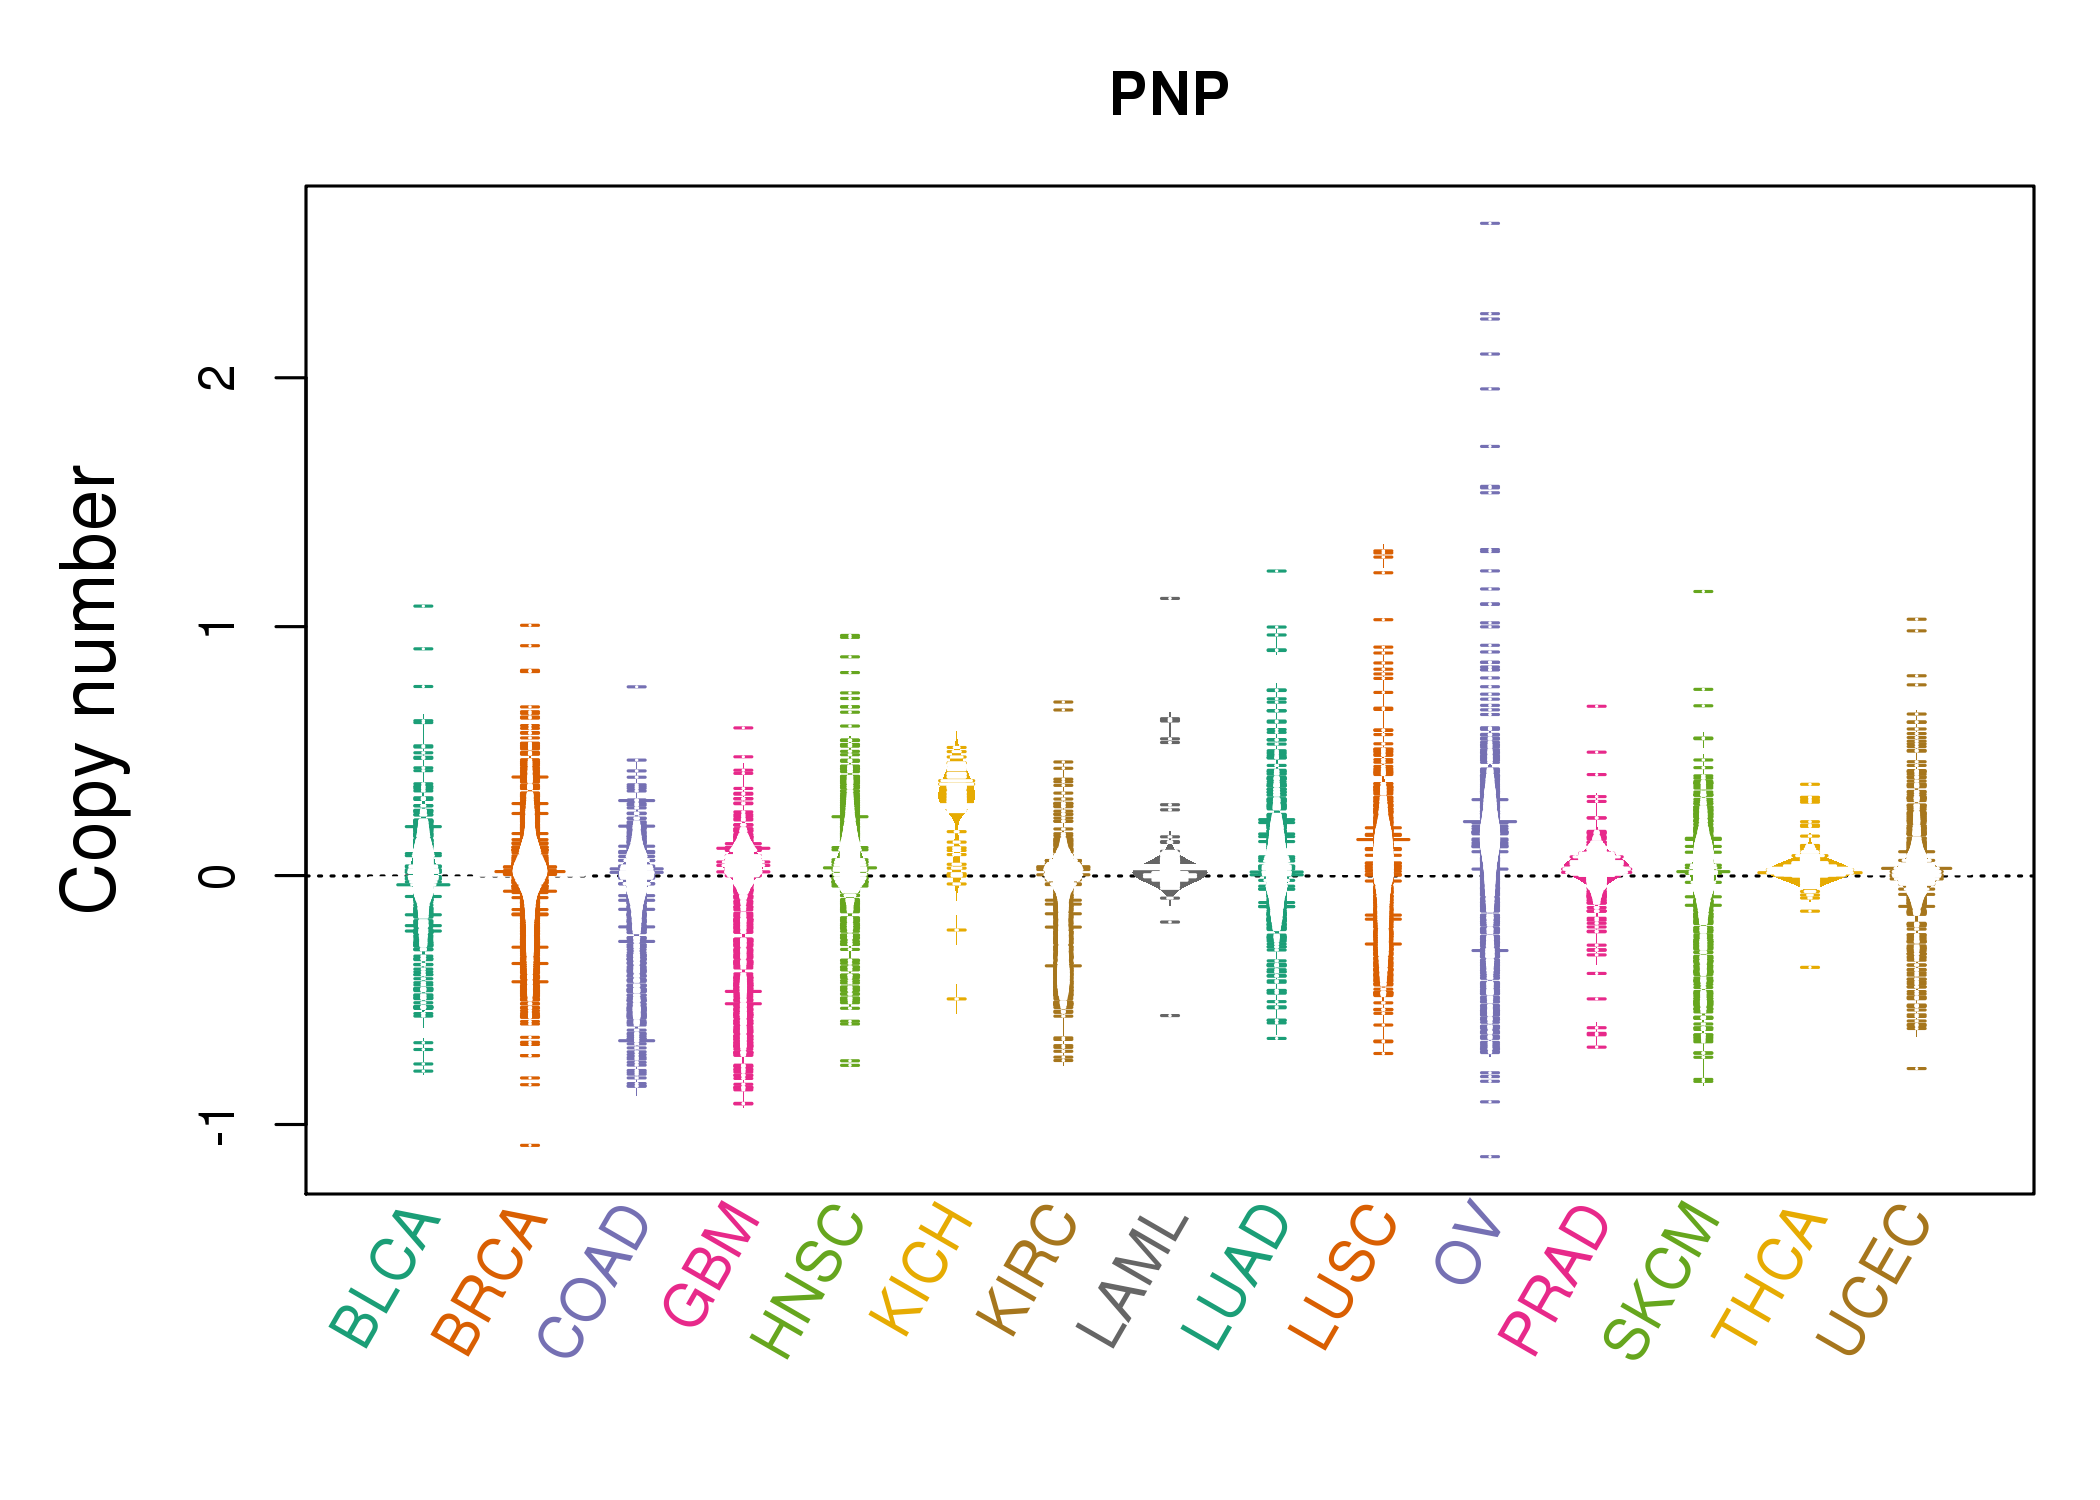 |
| cf) Tissue ID[Tissue type]: BLCA[Bladder Urothelial Carcinoma], BRCA[Breast invasive carcinoma], CESC[Cervical squamous cell carcinoma and endocervical adenocarcinoma], COAD[Colon adenocarcinoma], GBM[Glioblastoma multiforme], Glioma Low Grade, HNSC[Head and Neck squamous cell carcinoma], KICH[Kidney Chromophobe], KIRC[Kidney renal clear cell carcinoma], KIRP[Kidney renal papillary cell carcinoma], LAML[Acute Myeloid Leukemia], LUAD[Lung adenocarcinoma], LUSC[Lung squamous cell carcinoma], OV[Ovarian serous cystadenocarcinoma ], PAAD[Pancreatic adenocarcinoma], PRAD[Prostate adenocarcinoma], SKCM[Skin Cutaneous Melanoma], STAD[Stomach adenocarcinoma], THCA[Thyroid carcinoma], UCEC[Uterine Corpus Endometrial Carcinoma] |
| Top |
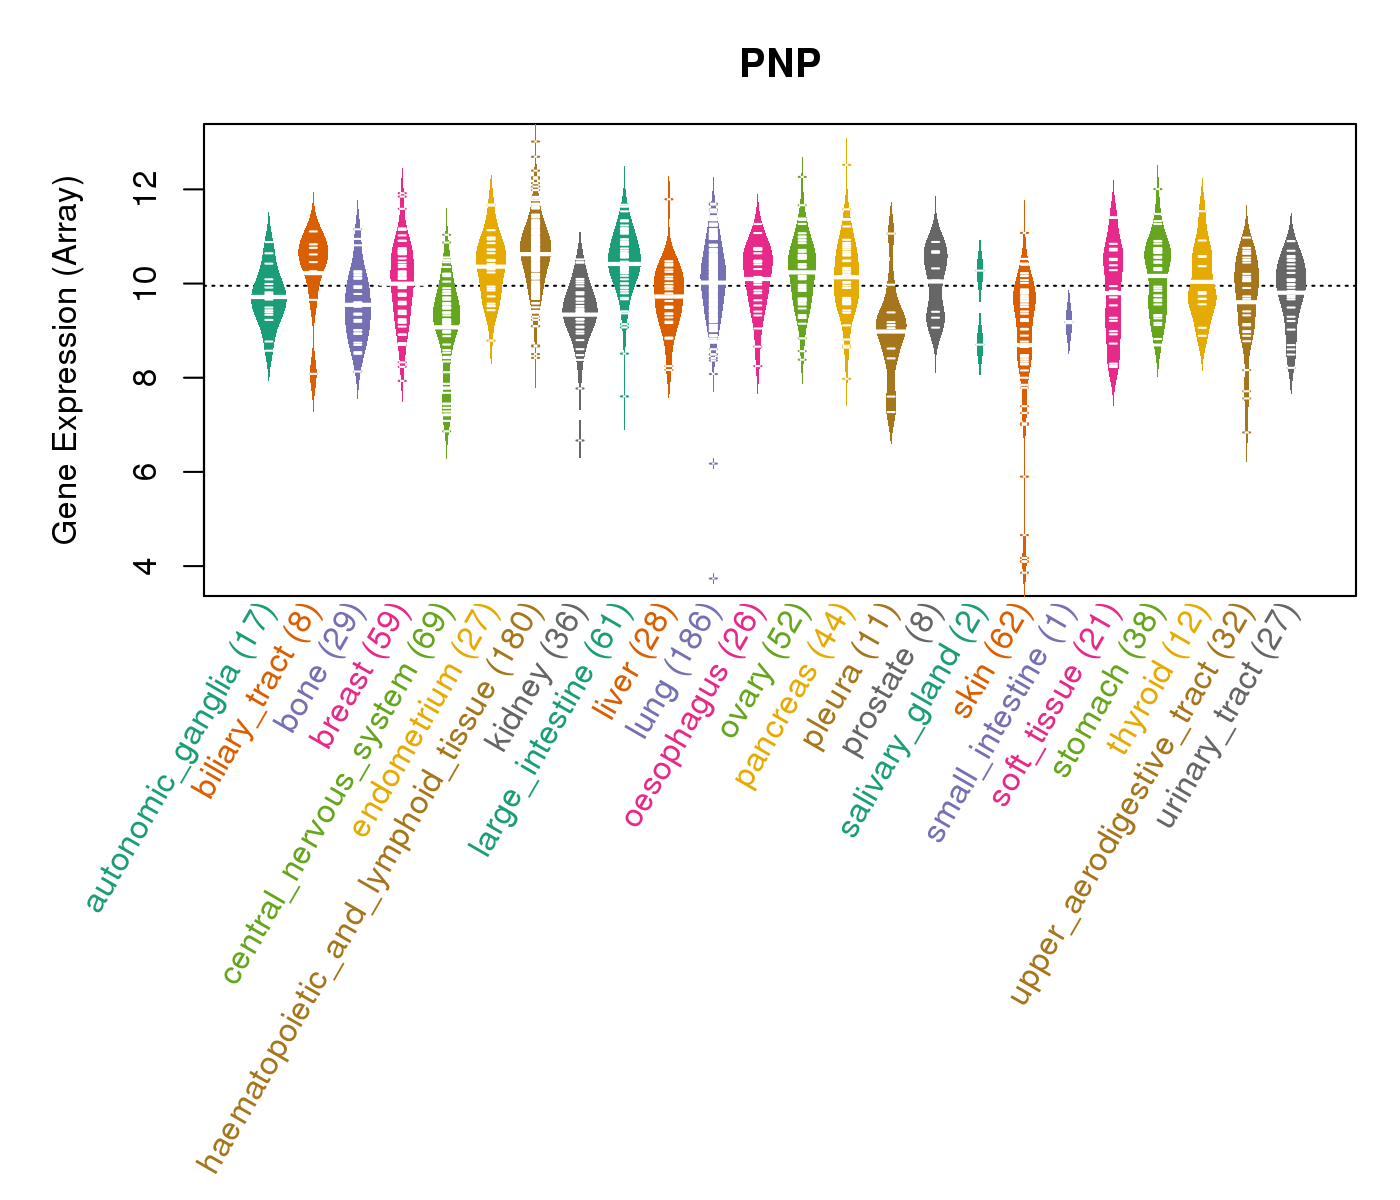
| Gene Expression for PNP |
| * CCLE gene expression data were extracted from CCLE_Expression_Entrez_2012-10-18.res: Gene-centric RMA-normalized mRNA expression data. |
 |
| * Normalized gene expression data of RNASeqV2 was extracted from TCGA using R package TCGA-Assembler. The URLs of all public data files on TCGA DCC data server were gathered at Jan-05-2015. Only eight cancer types have enough normal control samples for differential expression analysis. (t test, adjusted p<0.05 (using Benjamini-Hochberg FDR)) |
 |
| Top |
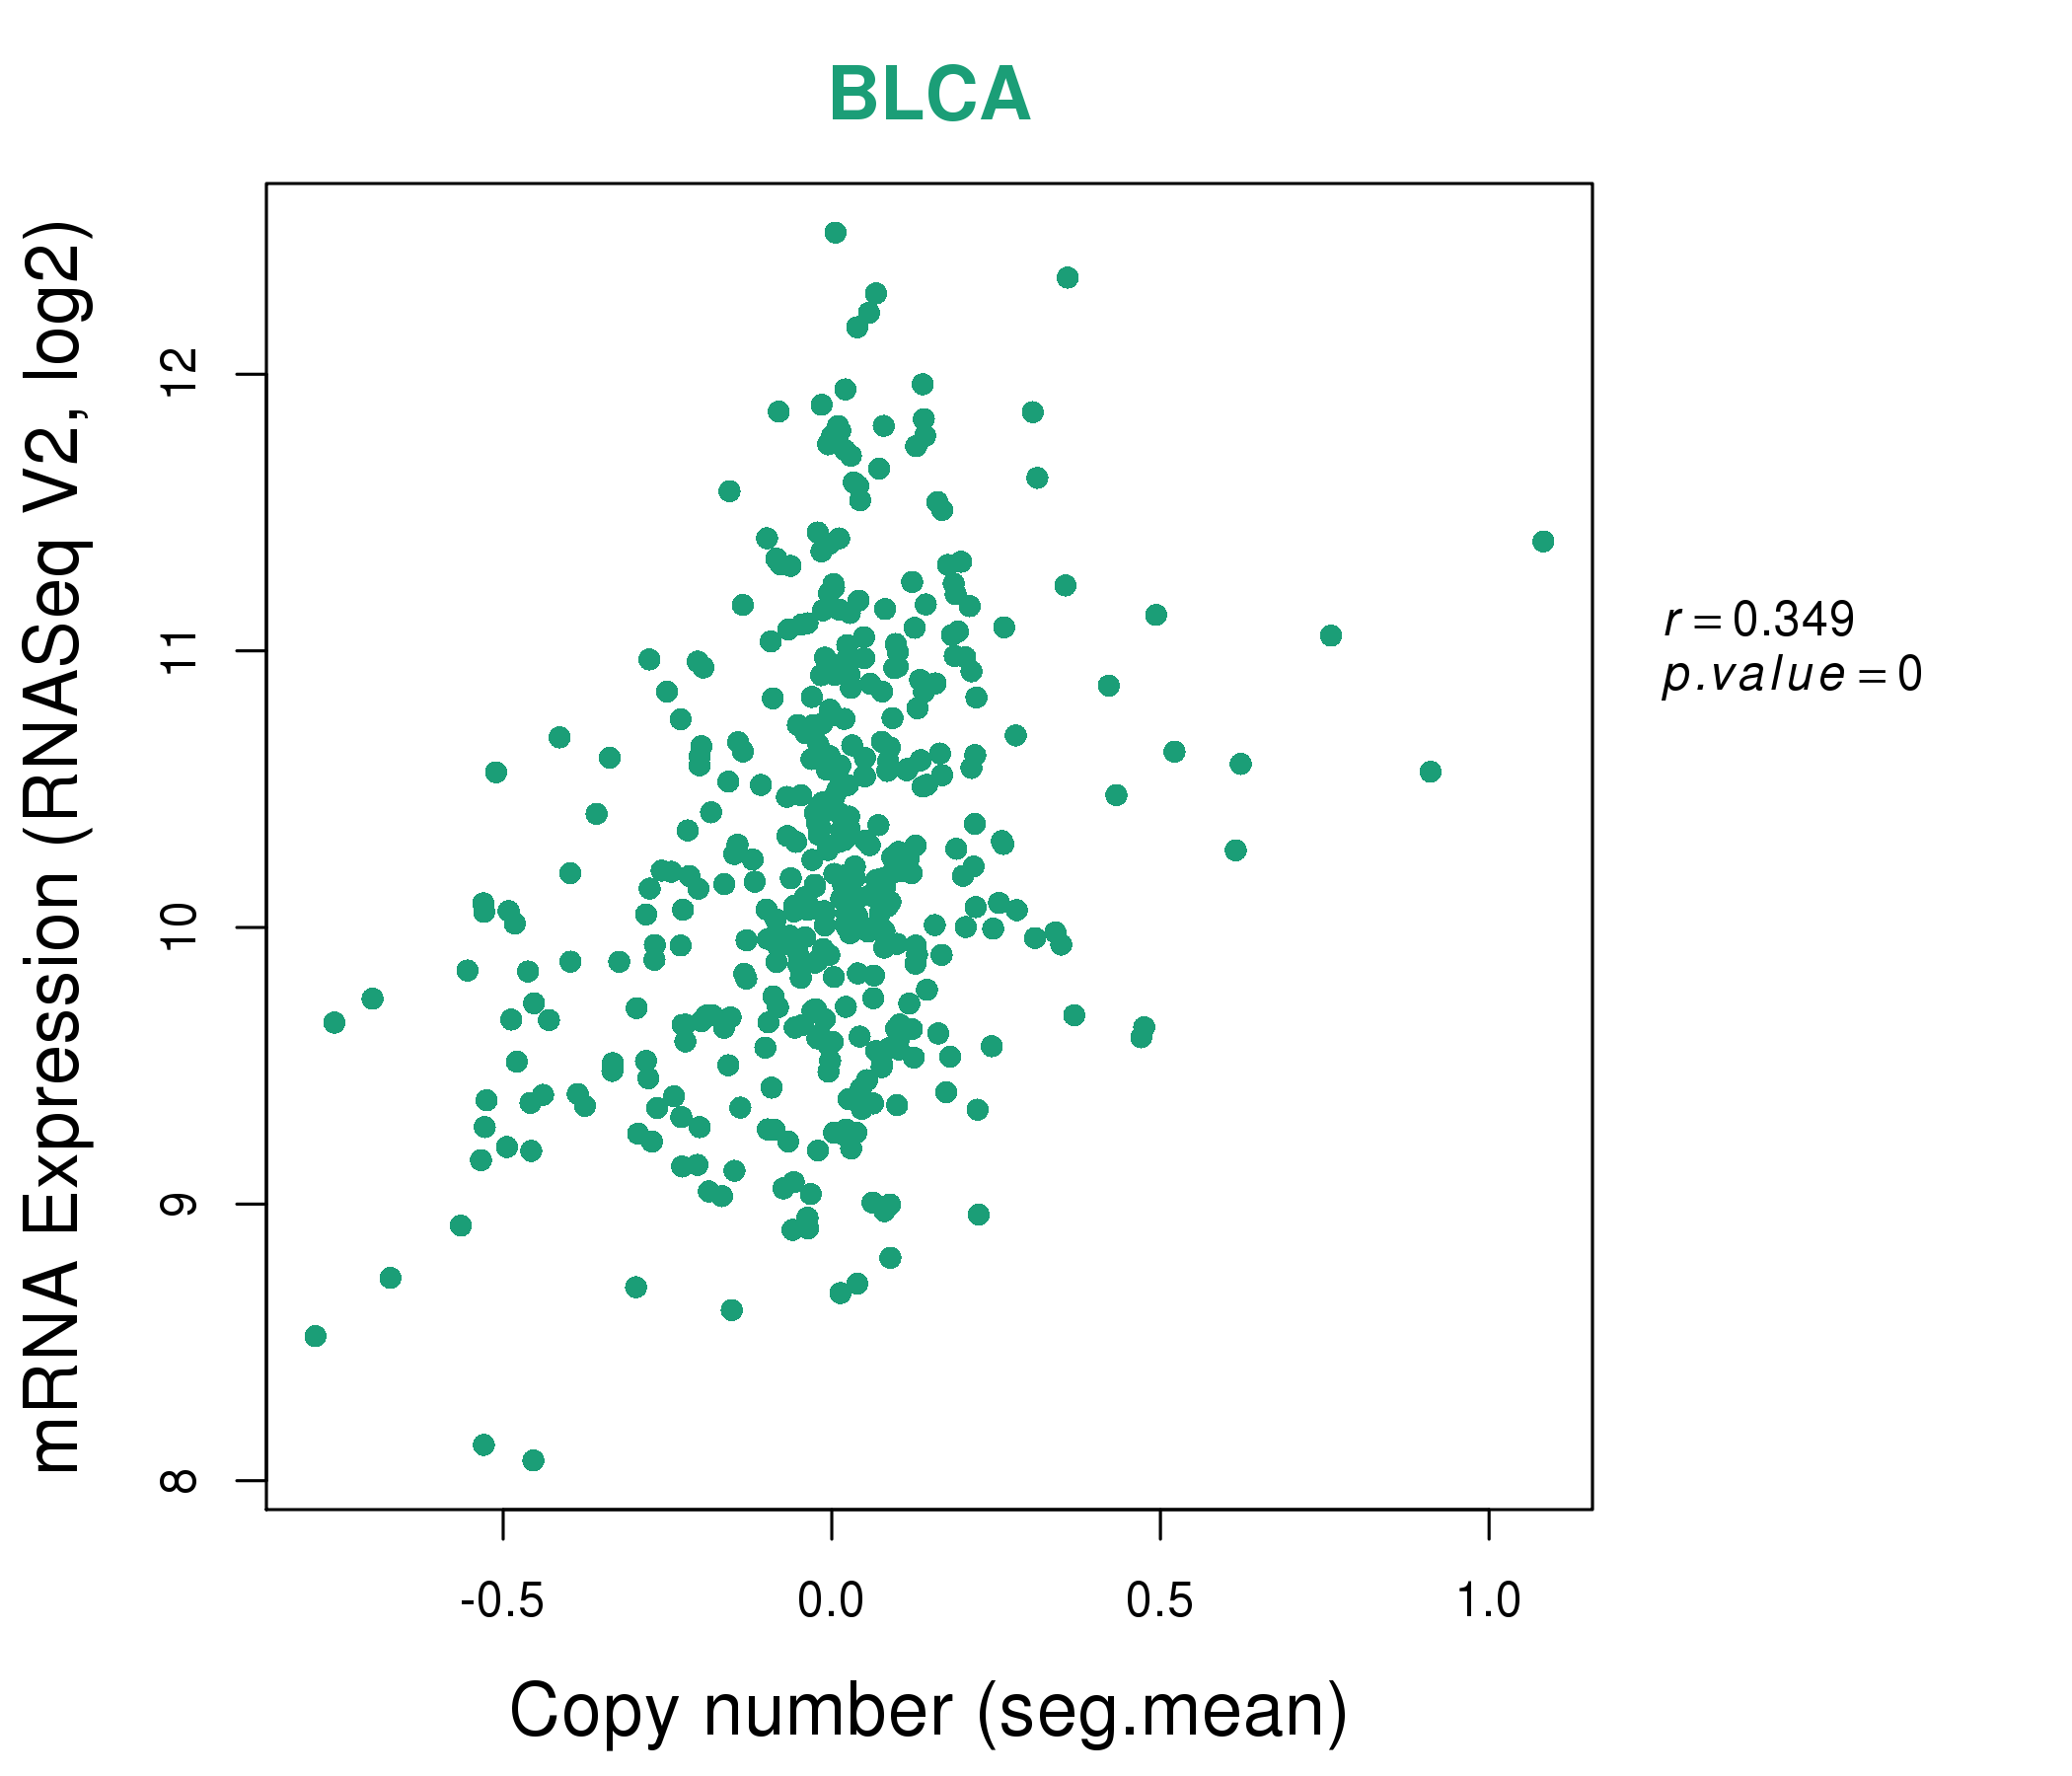
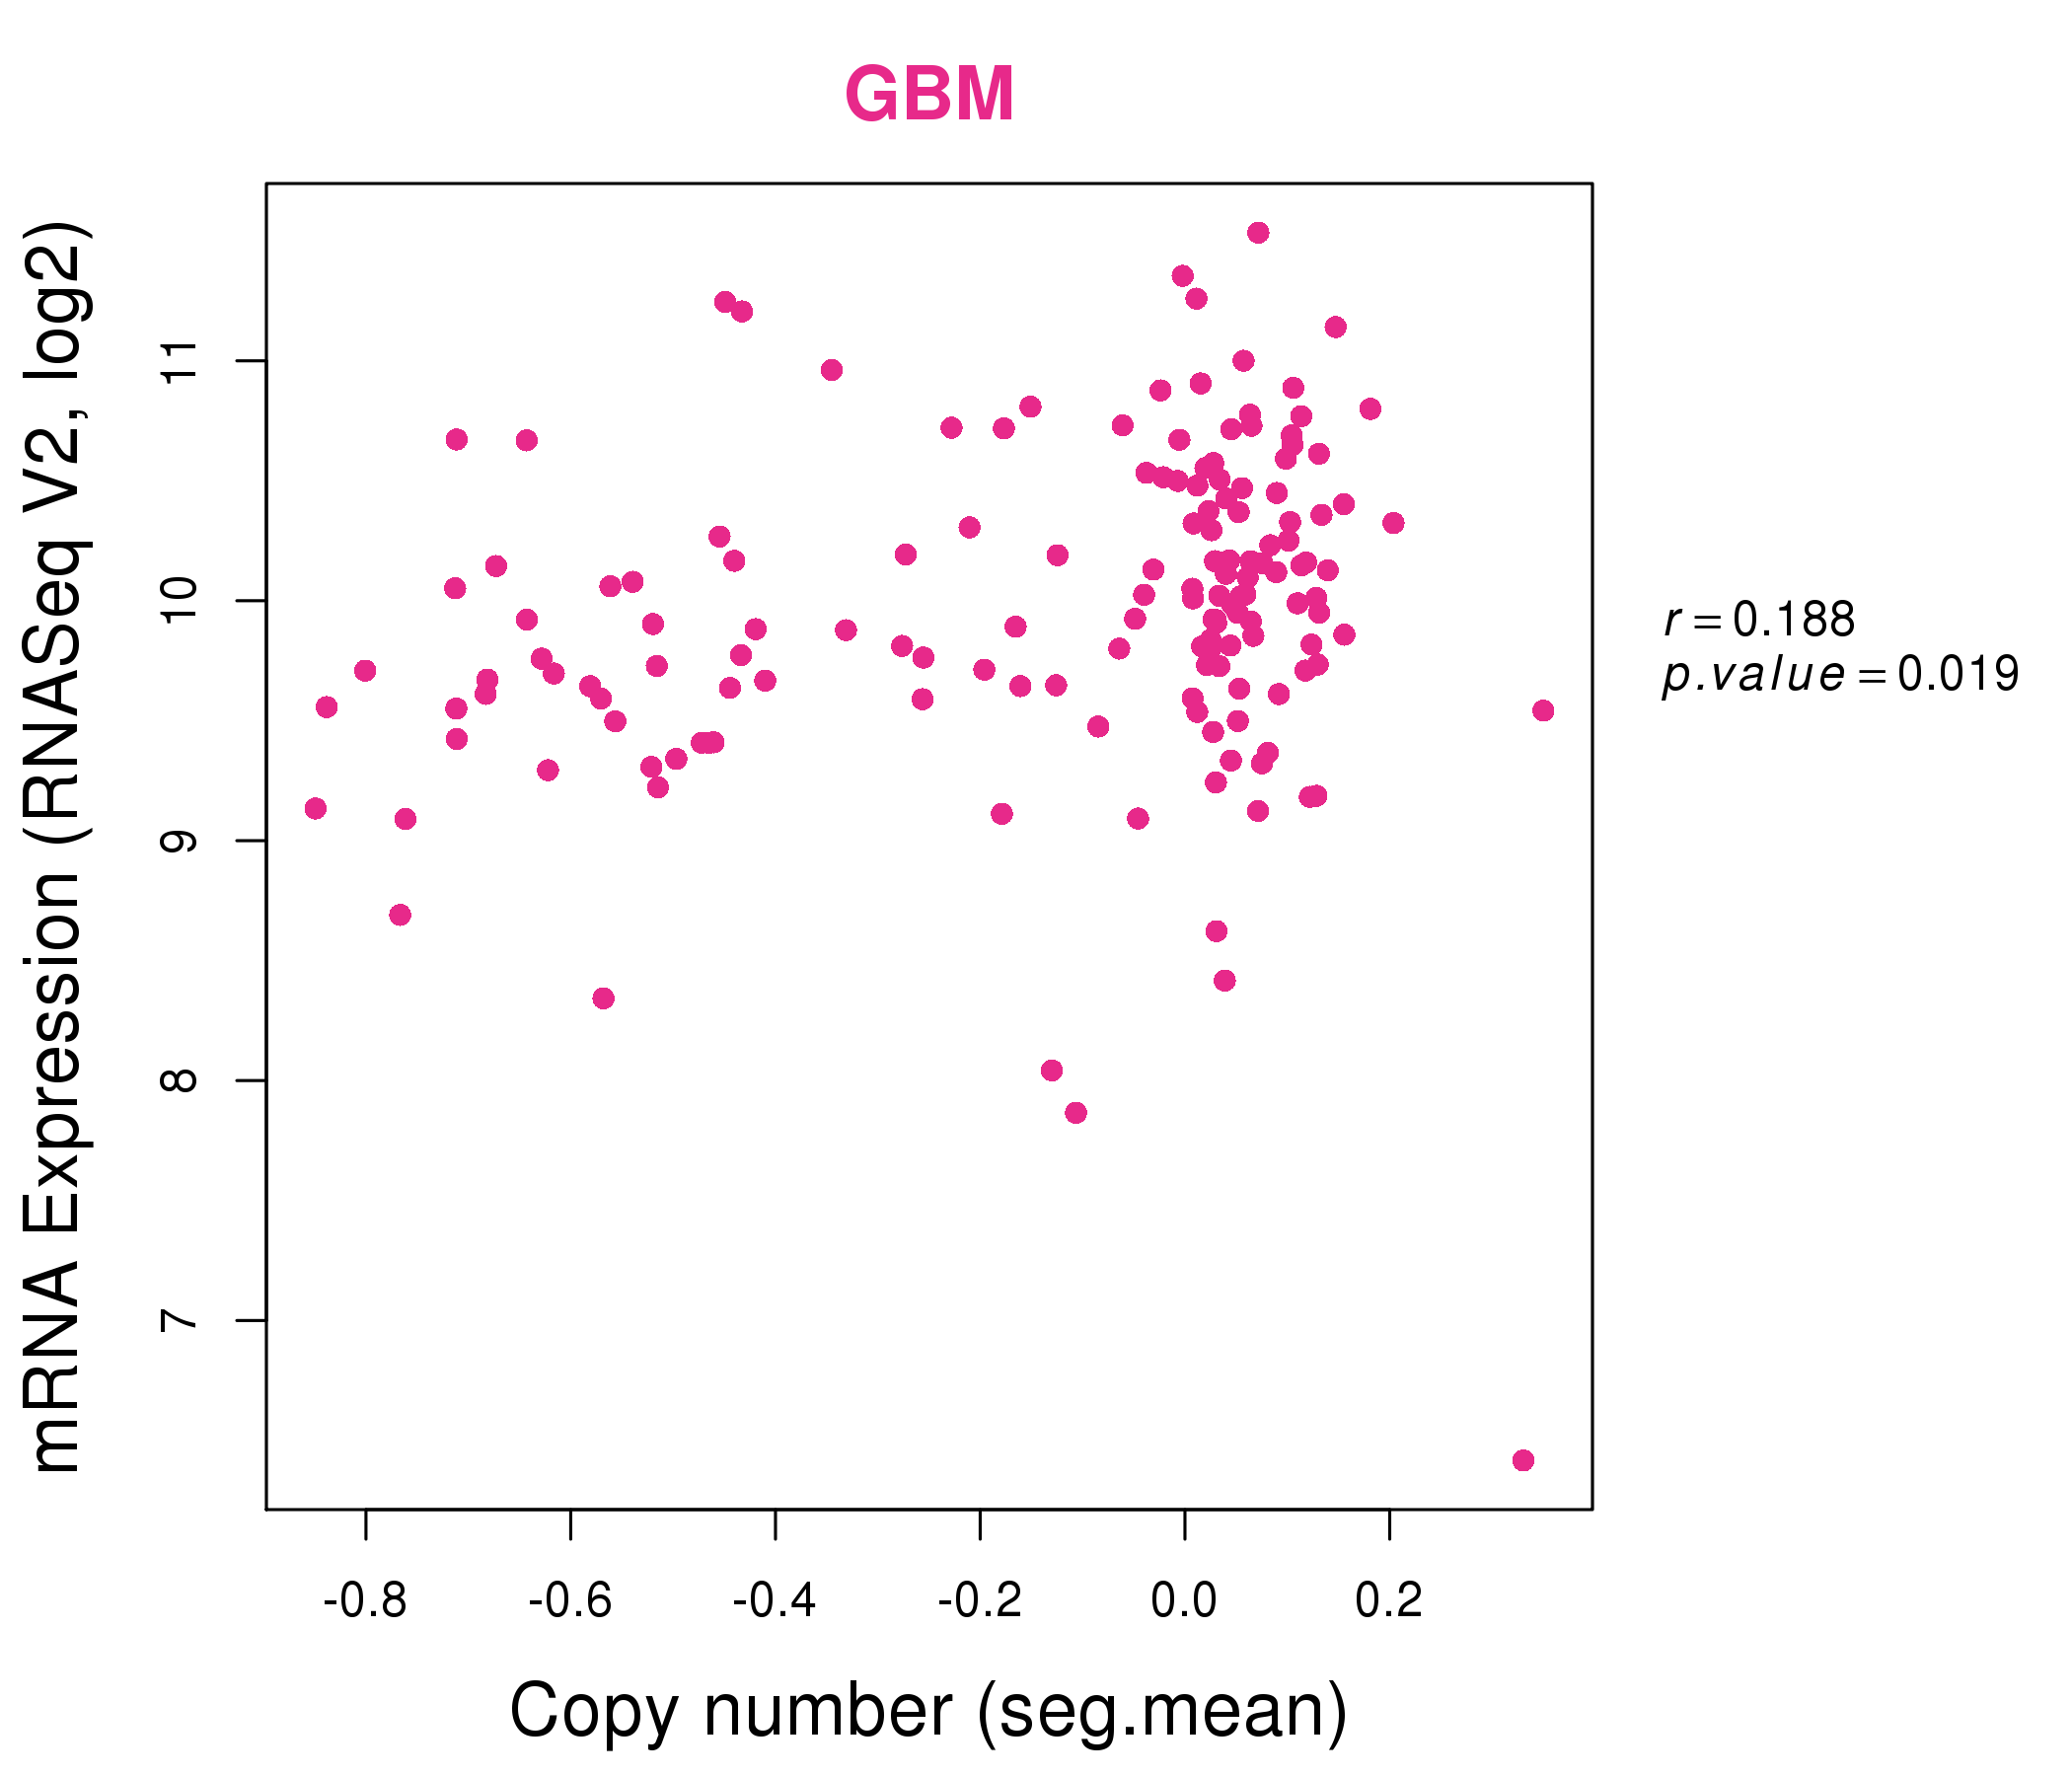
| * This plots show the correlation between CNV and gene expression. |
: Open all plots for all cancer types
 |
|
 |
|

| Top |
| Gene-Gene Network Information |
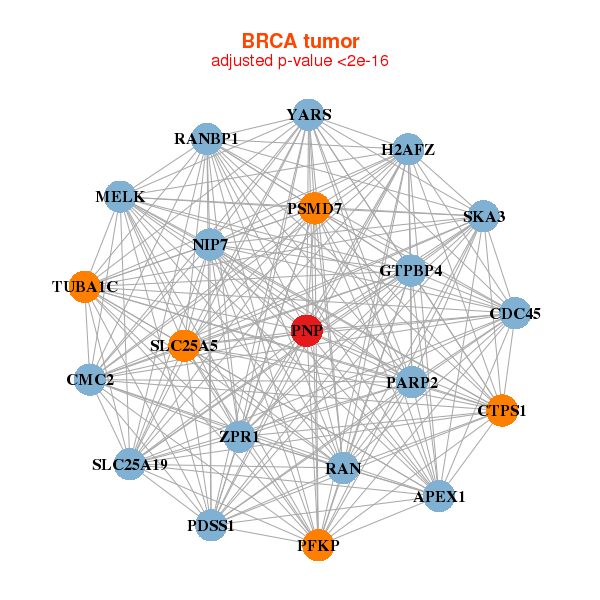
| * Co-Expression network figures were drawn using R package igraph. Only the top 20 genes with the highest correlations were shown. Red circle: input gene, orange circle: cell metabolism gene, sky circle: other gene |
: Open all plots for all cancer types
 |
| ||||
| BUB1,CEBPZ,CENPA,DBF4,EIF2AK2,FAM136A,GTPBP4, IFIH1,MASTL,MSH2,MTIF2,NOP58,PNO1,PNPT1, PTCD3,PUS7,SUV39H2,TTK,WDR12,WDR43,XPO1 | ANKRD28,C5orf22,TRAPPC13,CUL3,DHX29,DHX36,DNM1L, ESF1,FASTKD2,HSPA14,IBTK,KRR1,MFN1,NAA15, OTUD6B,PATL1,PNPT1,RRP15,SLC30A9,UBE3A,UTP15 | ||||
 |
| ||||
| NDUFAF7,CCDC138,CEBPZ,CPSF3,DDX18,HSPD1,HSPE1, LRPPRC,MEMO1,MRPL19,MRPL30,MTIF2,PNO1,PNPT1, PTCD3,SSB,USP39,WDR12,WDR43,WDR75,ZC3H15 | ABCE1,CCDC86,DDX21,DKC1,EXOSC9,FASTKD2,GNL2, GTPBP4,MAK16,NIFK,NOP16,NOP58,ODC1,PIGW, PNPT1,RCL1,SRSF2,SRSF7,TRMT6,WDR43,WDR77 |

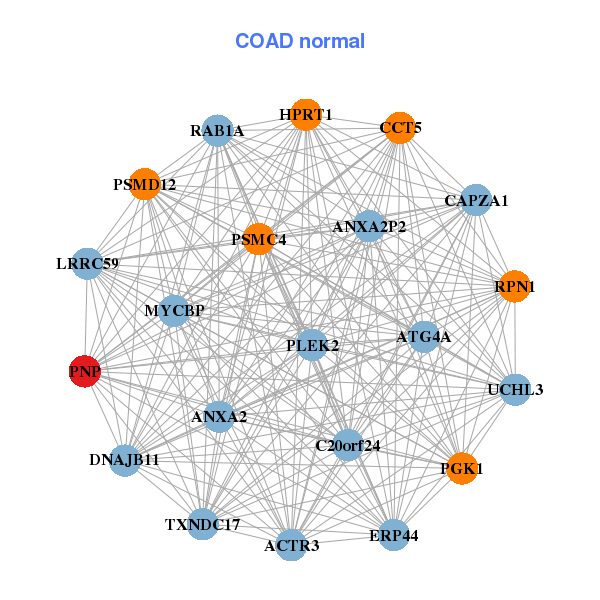
| * Co-Expression network figures were drawn using R package igraph. Only the top 20 genes with the highest correlations were shown. Red circle: input gene, orange circle: cell metabolism gene, sky circle: other gene |
: Open all plots for all cancer types
| Top |
: Open all interacting genes' information including KEGG pathway for all interacting genes from DAVID
| Top |
| Pharmacological Information for PNP |
| DB Category | DB Name | DB's ID and Url link |
| * Gene Centered Interaction Network. |
 |
| * Drug Centered Interaction Network. |
| DrugBank ID | Target Name | Drug Groups | Generic Name | Drug Centered Network | Drug Structure |
| DB00242 | purine nucleoside phosphorylase | approved; investigational | Cladribine |  | 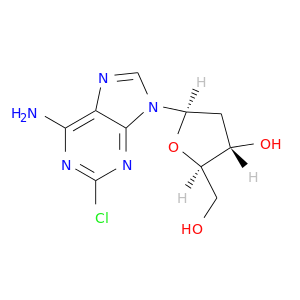 |
| DB00900 | purine nucleoside phosphorylase | approved | Didanosine | 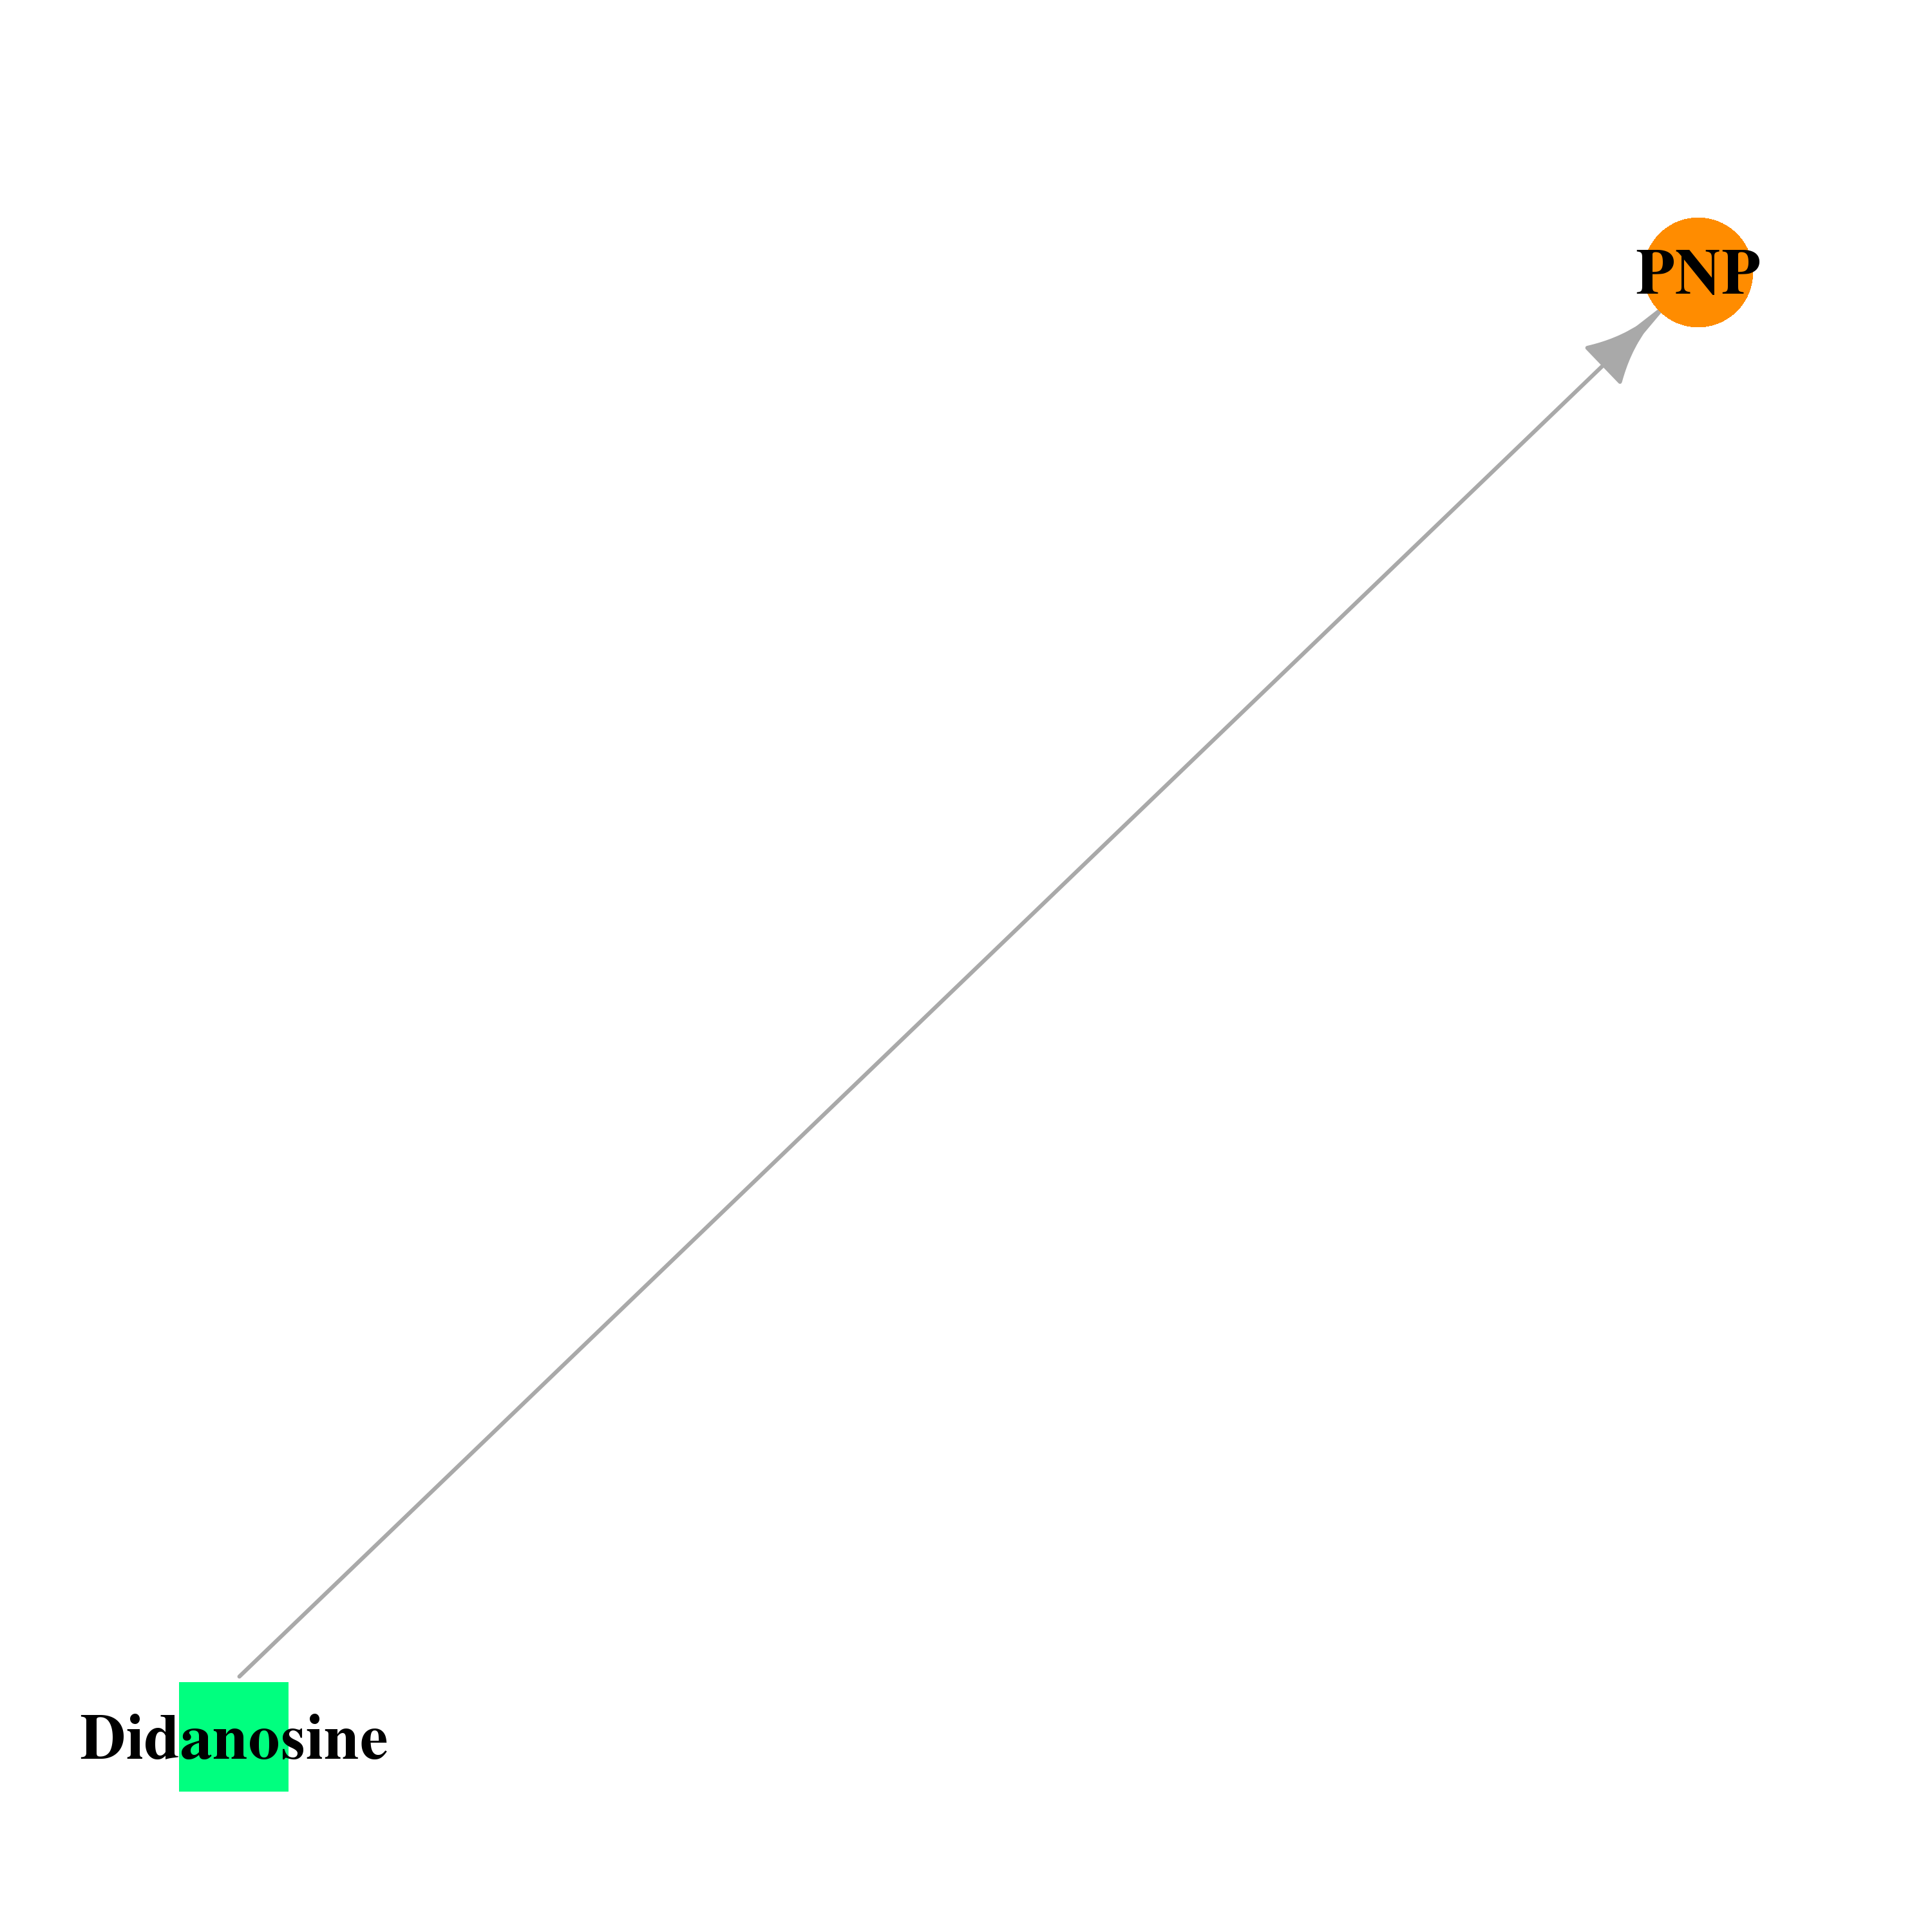 | 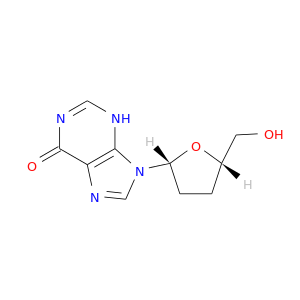 |
| DB01667 | purine nucleoside phosphorylase | experimental | 8-Azaguanine |  |  |
| DB02222 | purine nucleoside phosphorylase | experimental | 2,6-Diamino-(S)-9-[2-(Phosphonomethoxy)Propyl]Purine | 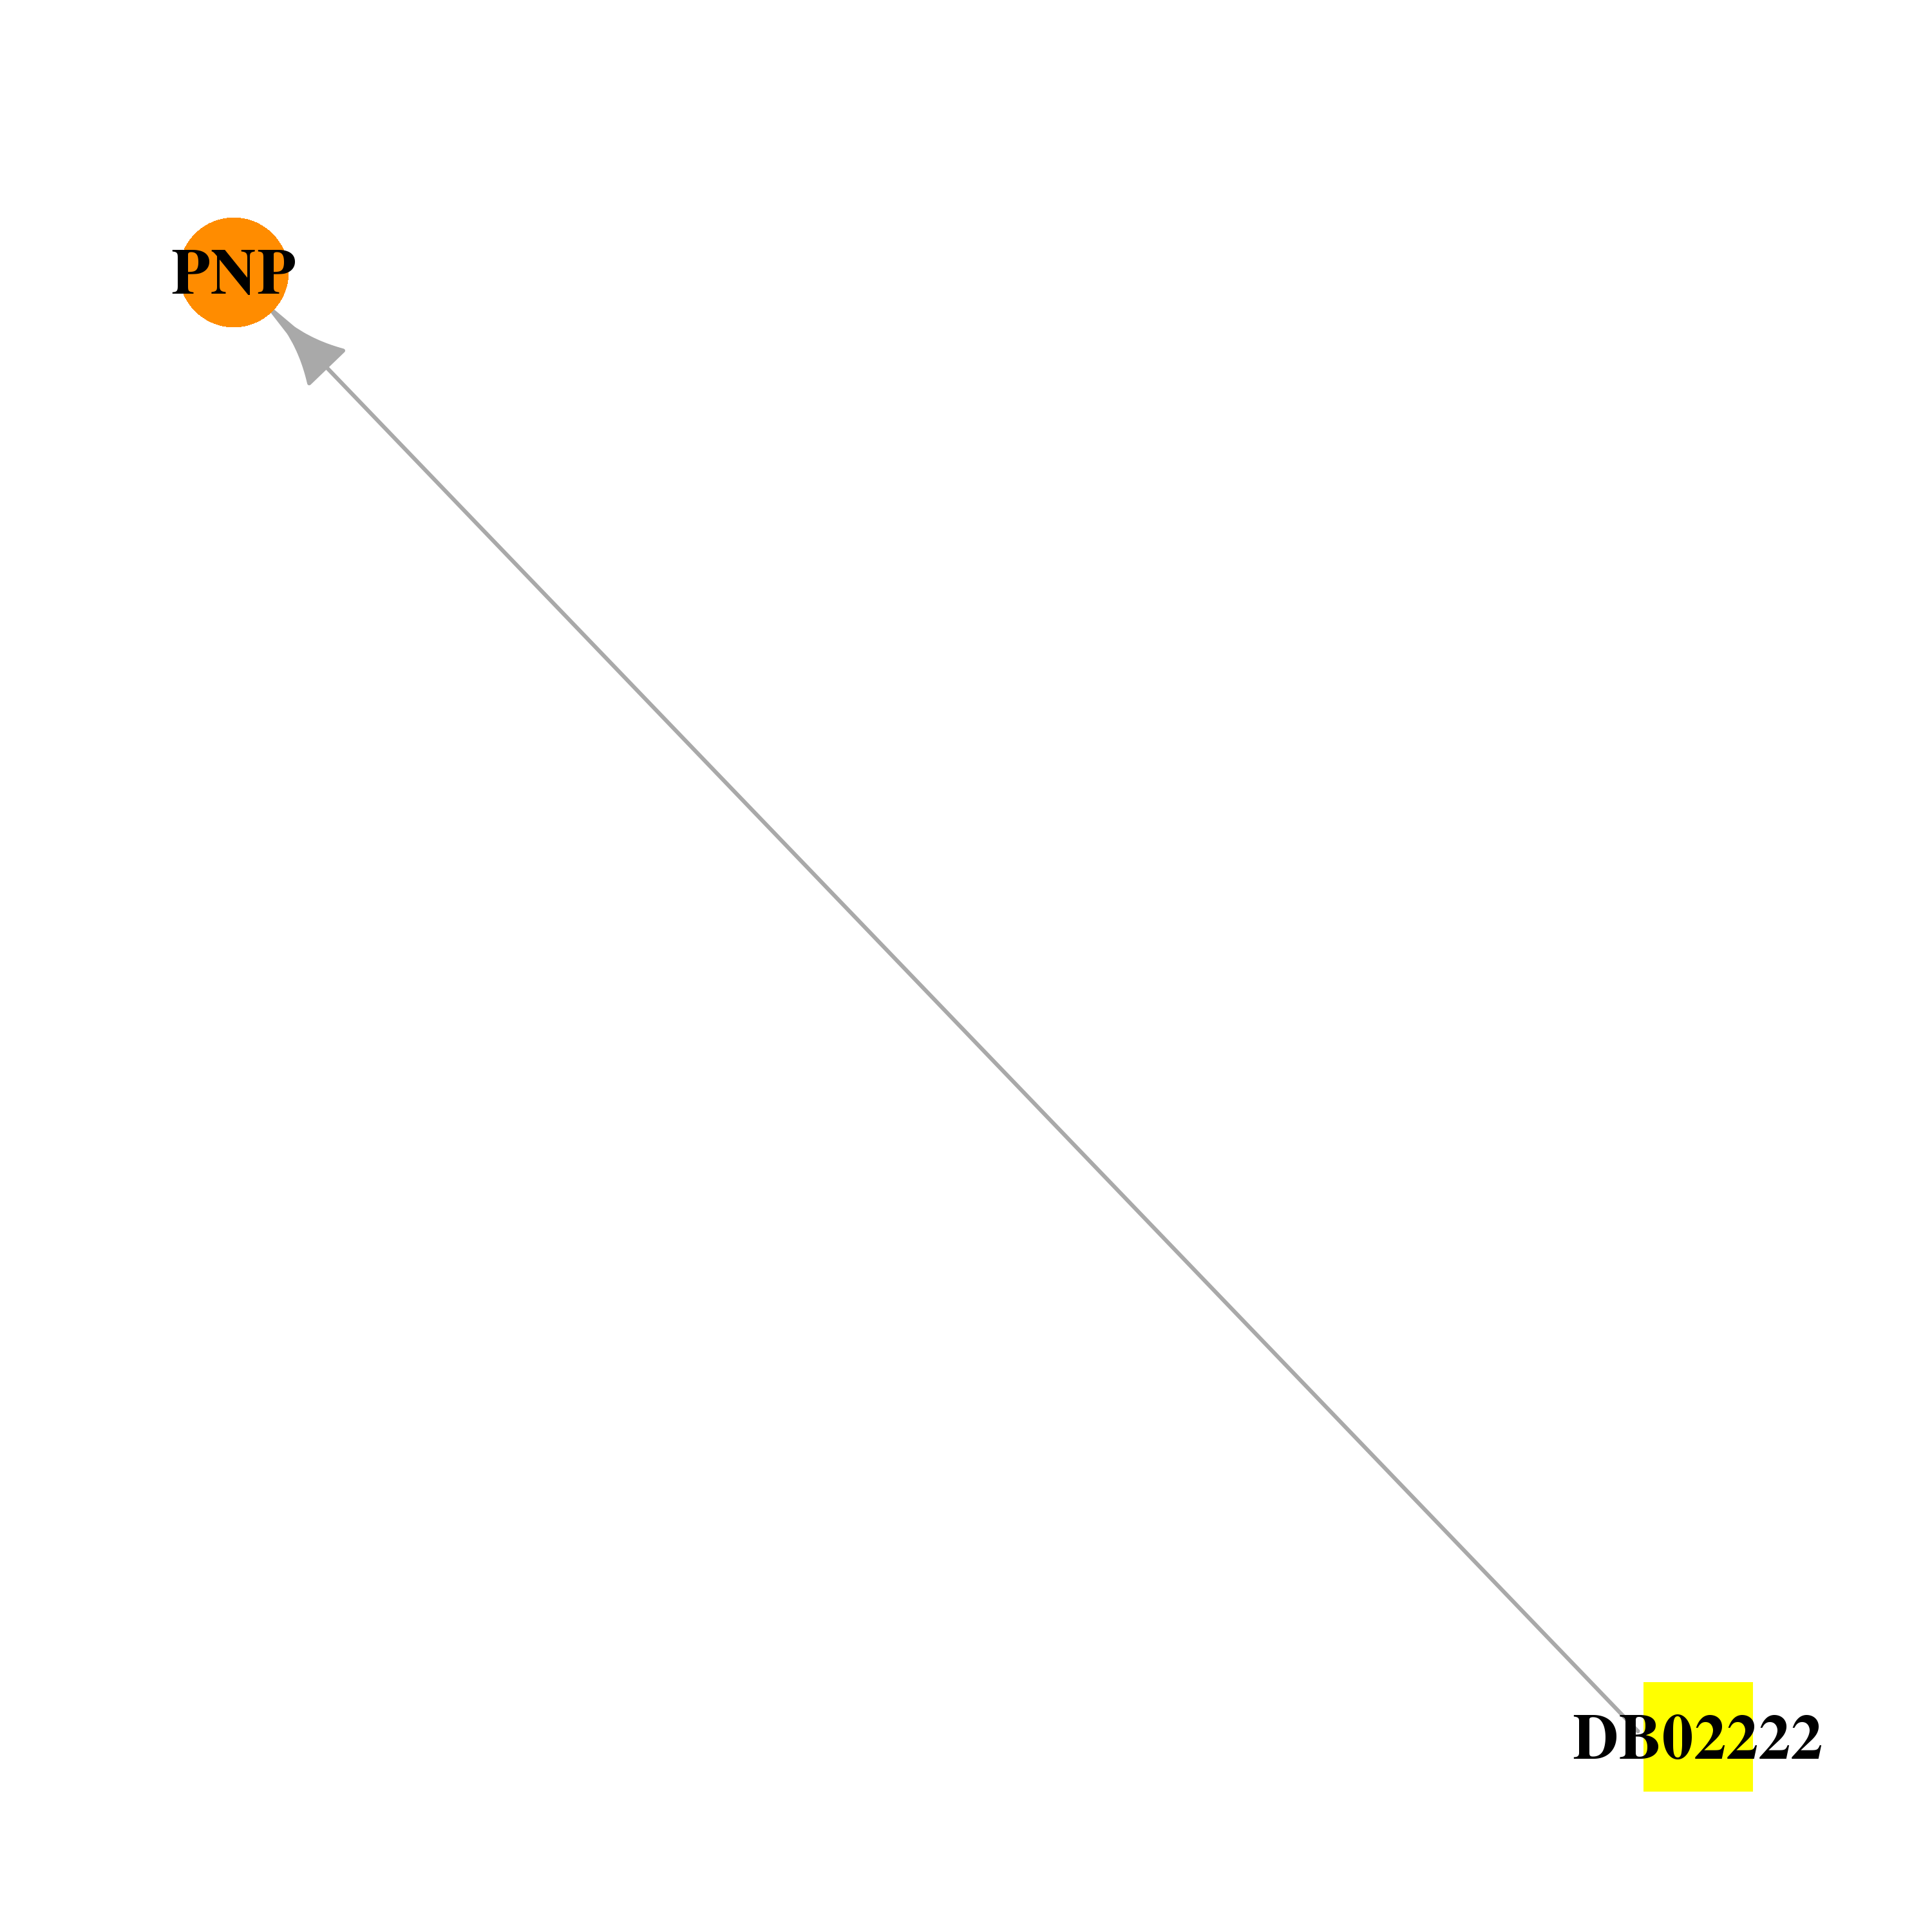 | 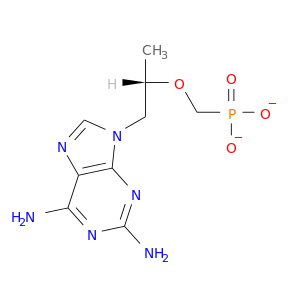 |
| DB02230 | purine nucleoside phosphorylase | experimental | Immucillin-G | 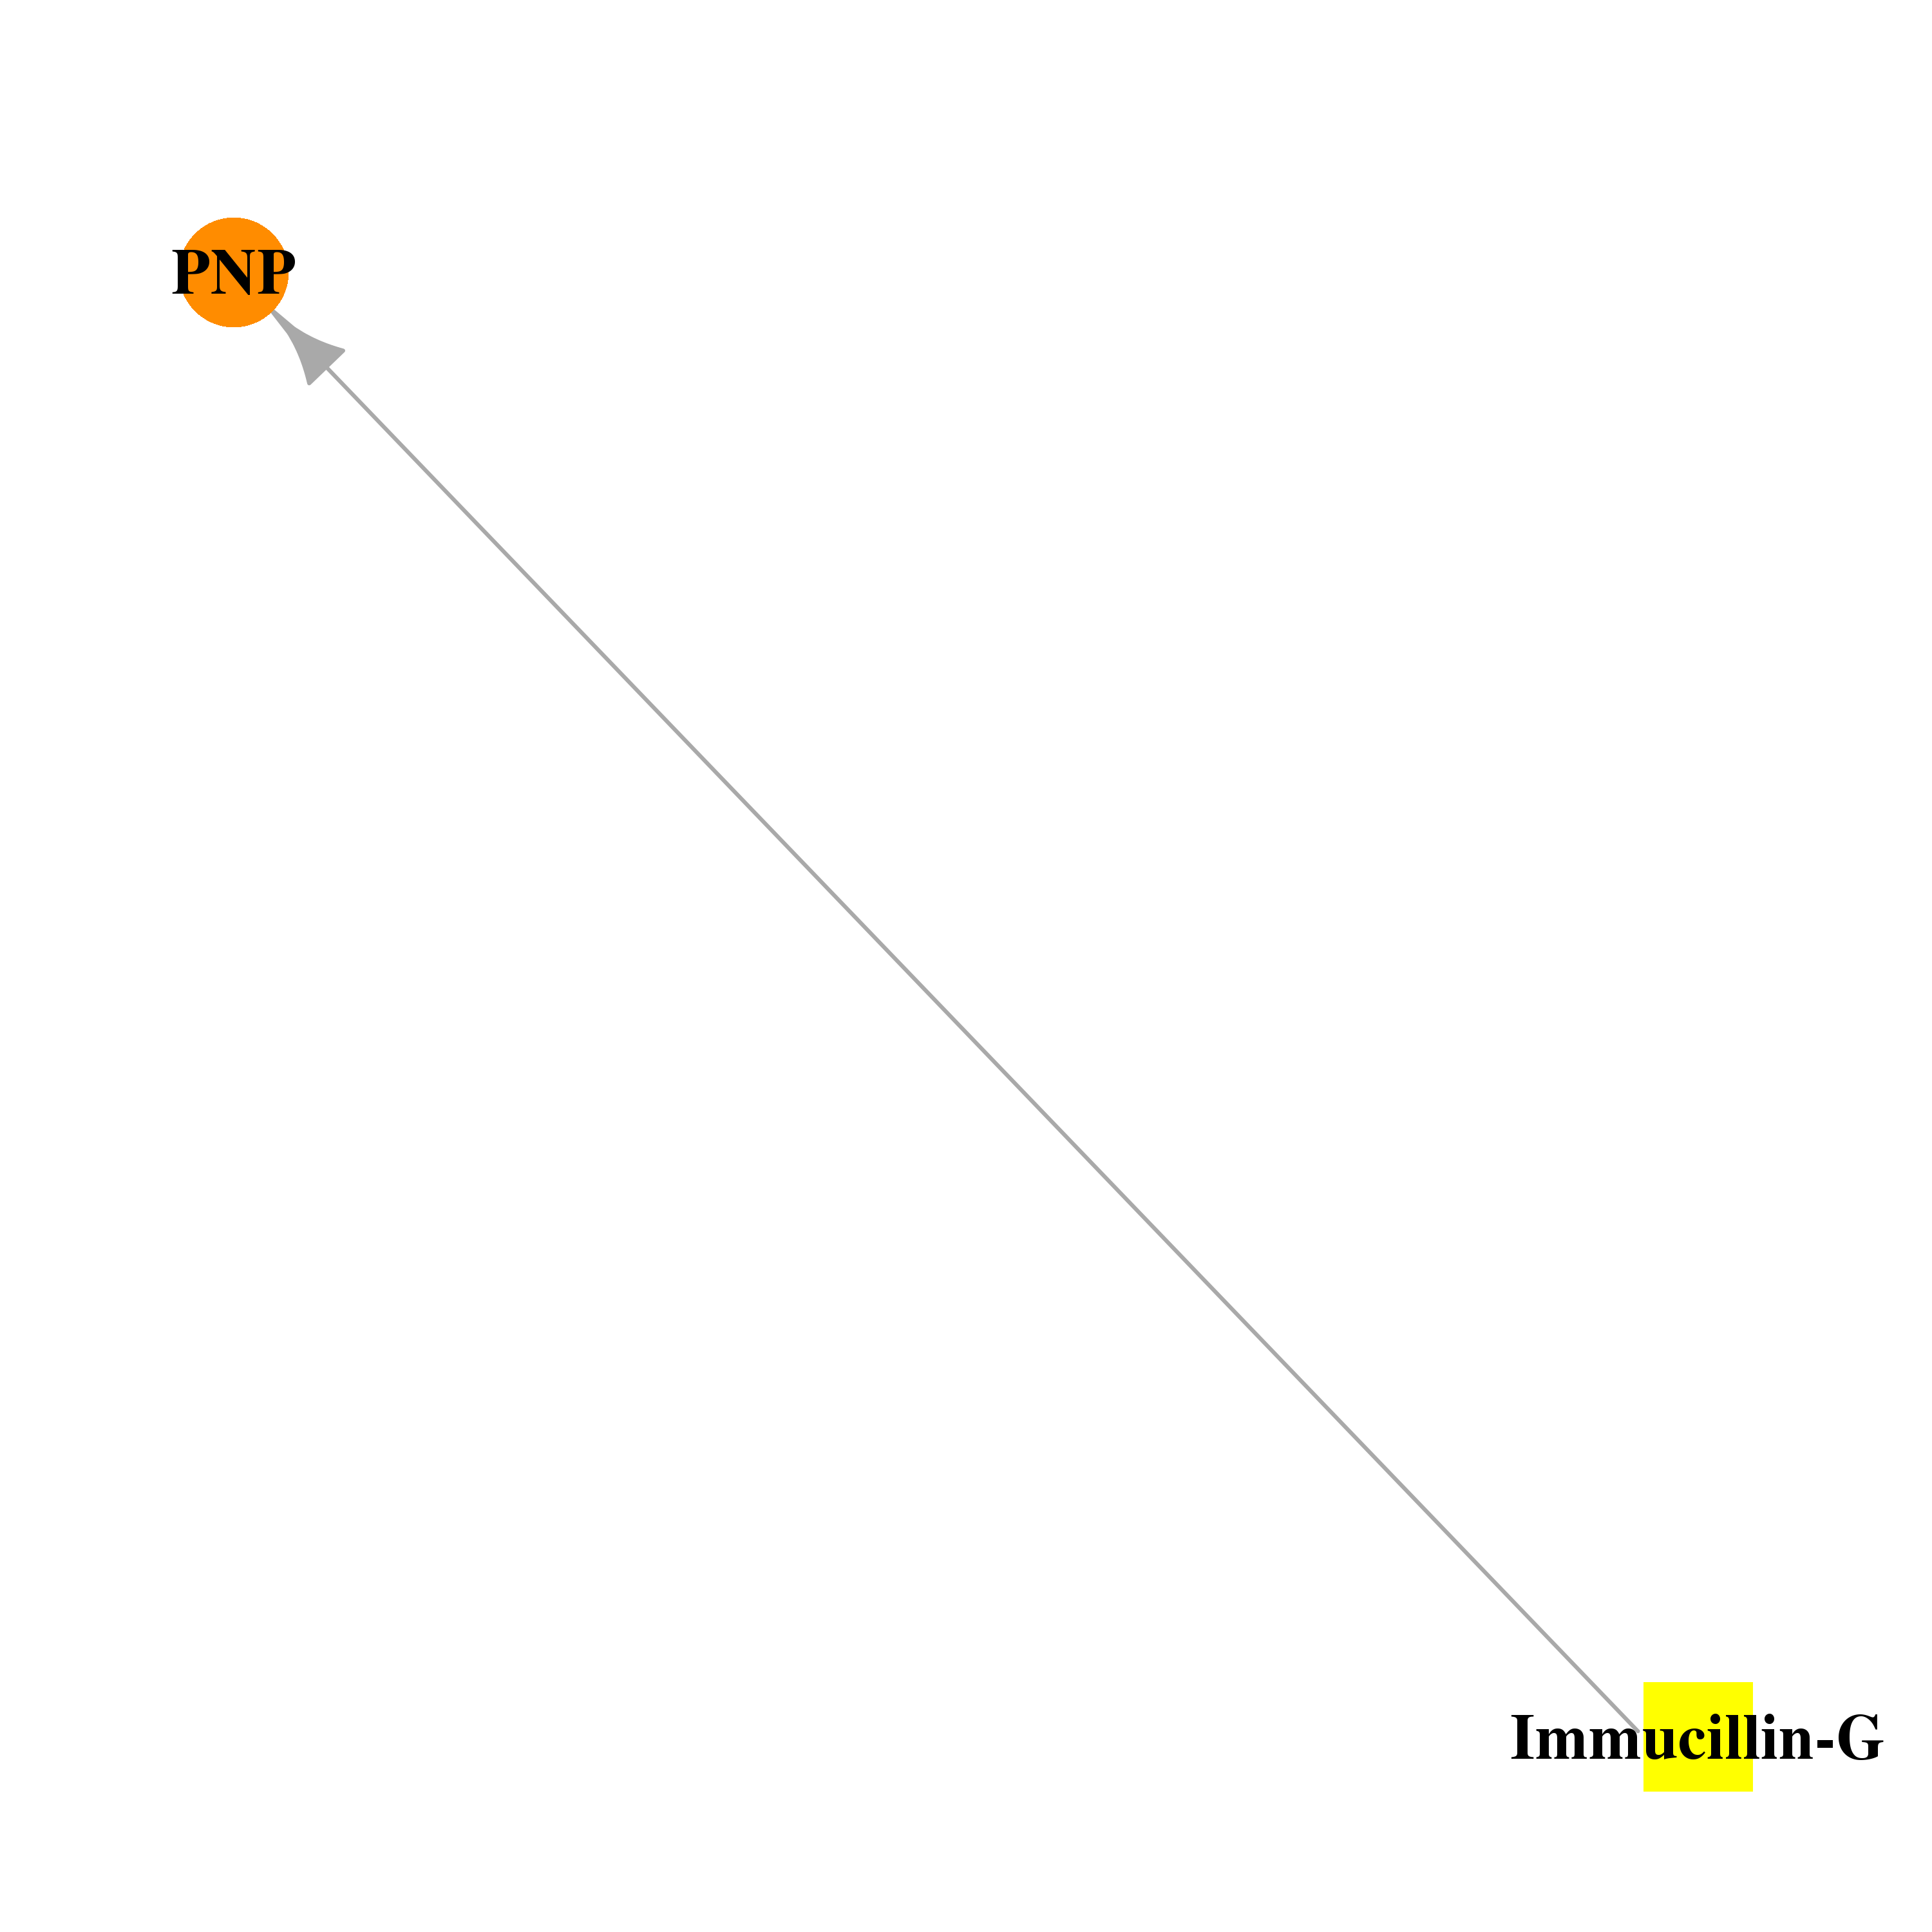 | 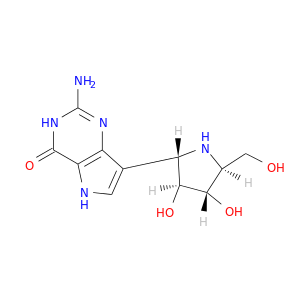 |
| DB02377 | purine nucleoside phosphorylase | experimental | Guanine | 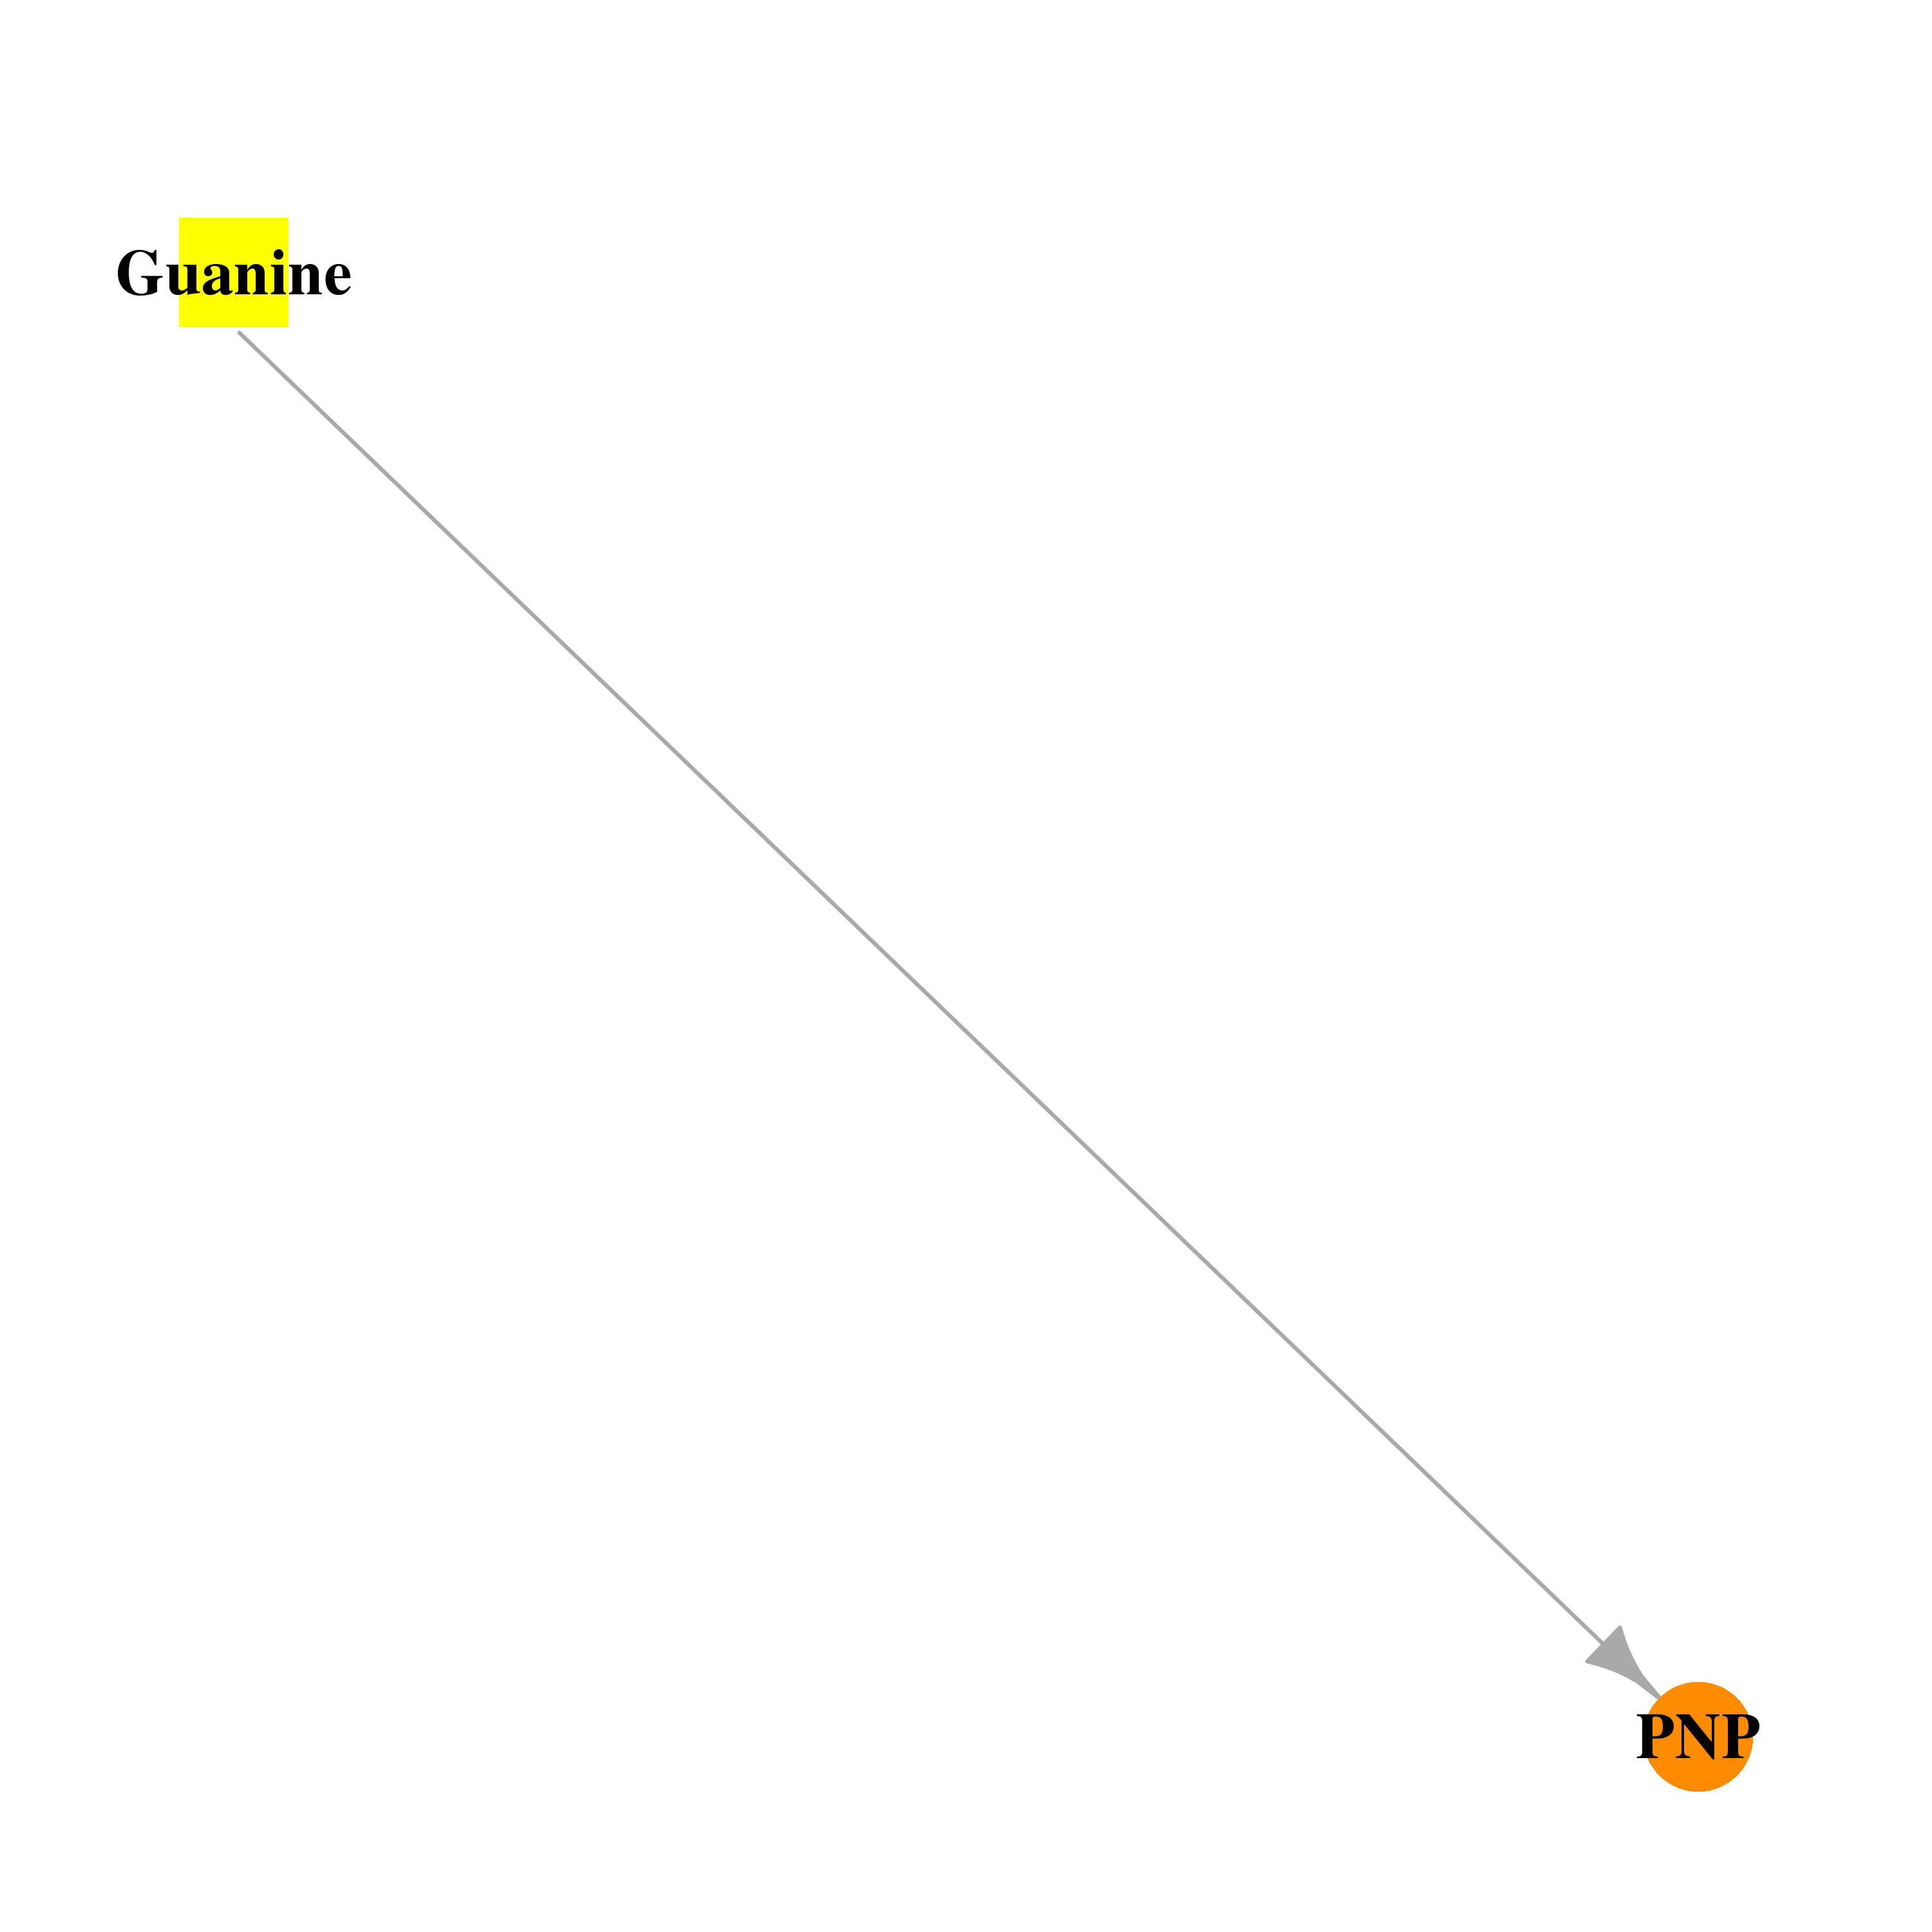 |  |
| DB02391 | purine nucleoside phosphorylase | experimental | 2-Amino-7-[2-(2-Hydroxy-1-Hydroxymethyl-Ethylamino)-Ethyl]-1,7-Dihydro-Purin-6-One |  |  |
| DB02568 | purine nucleoside phosphorylase | experimental | Peldesine | 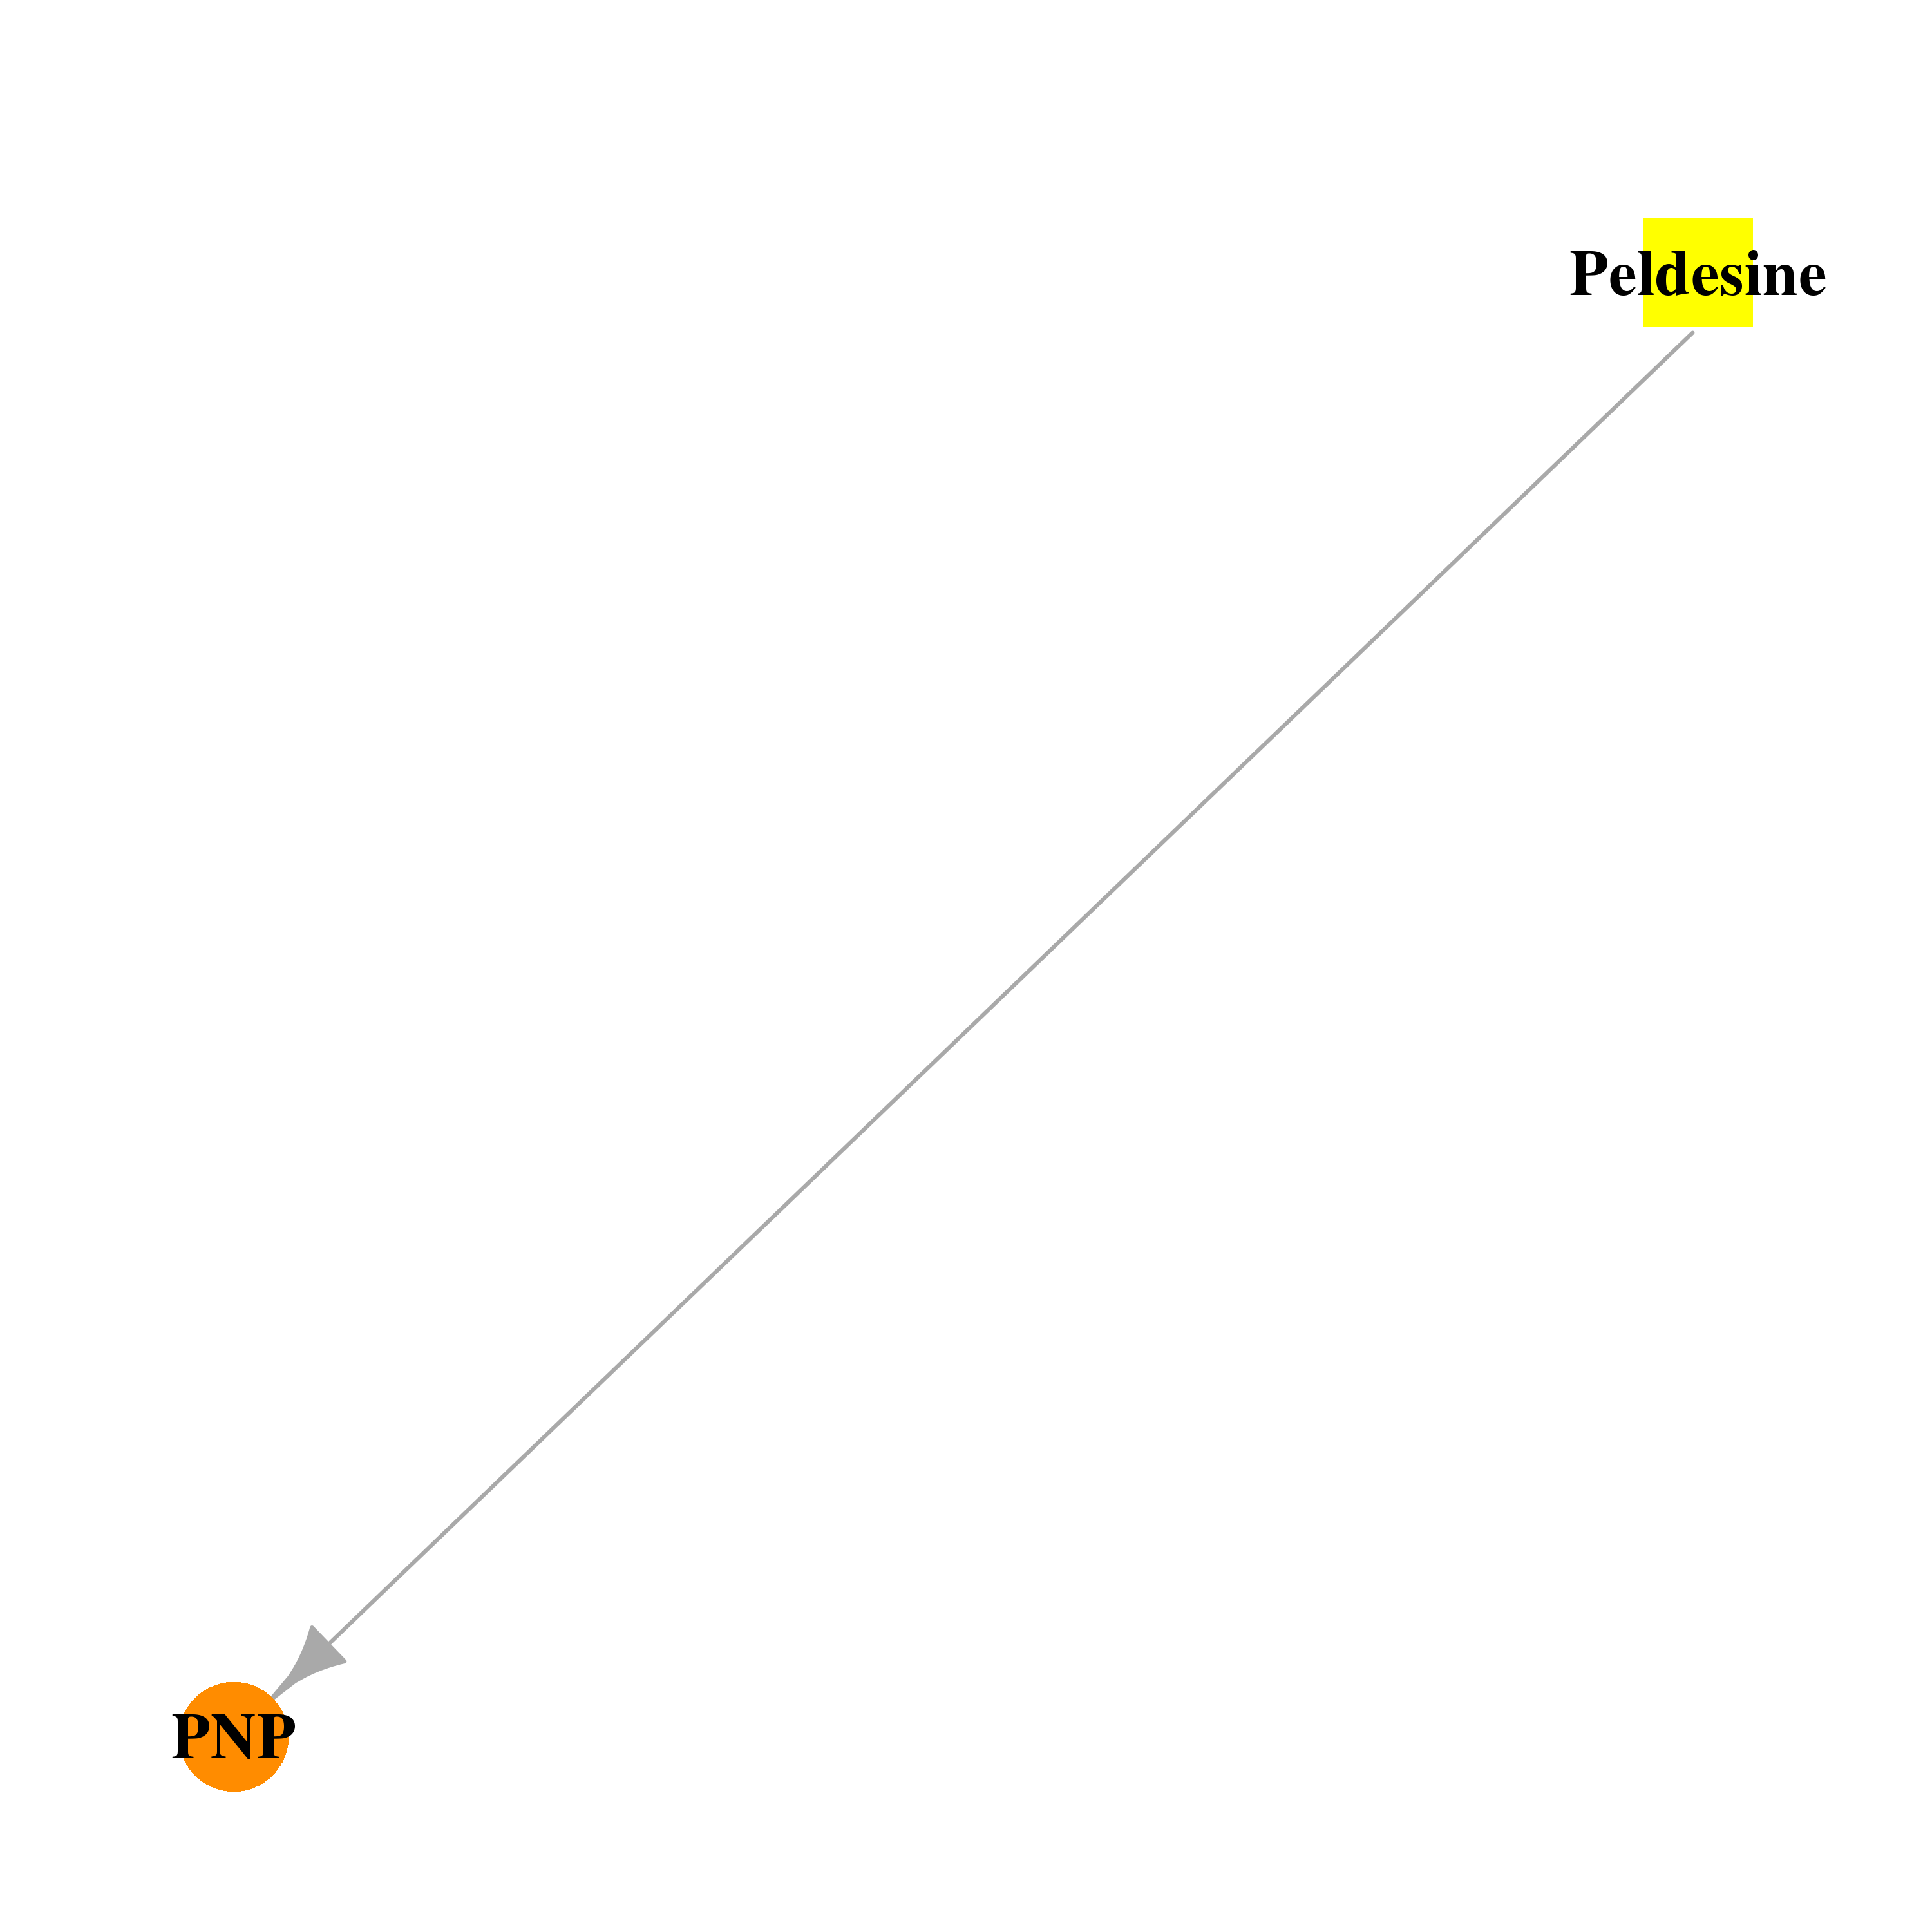 |  |
| DB02796 | purine nucleoside phosphorylase | experimental | 9-Deazainosine |  |  |
| DB02857 | purine nucleoside phosphorylase | experimental | Guanosine |  |  |
| DB03101 | purine nucleoside phosphorylase | experimental | Ribose-1-Phosphate |  |  |
| DB03551 | purine nucleoside phosphorylase | experimental | 4'-Deaza-1'-Aza-2'-Deoxy-1'-(9-Methylene)-Immucillin-H, (3r,4r)-N-[9-Deazahypoxanthin-9-Yl)Methyl]-4-Hydroxymethyl-Pyrrolidin-3-Ol |  |  |
| DB03609 | purine nucleoside phosphorylase | experimental | 3-Deoxyguanosine |  |  |
| DB03881 | purine nucleoside phosphorylase | experimental | MT-Immucillin-H | 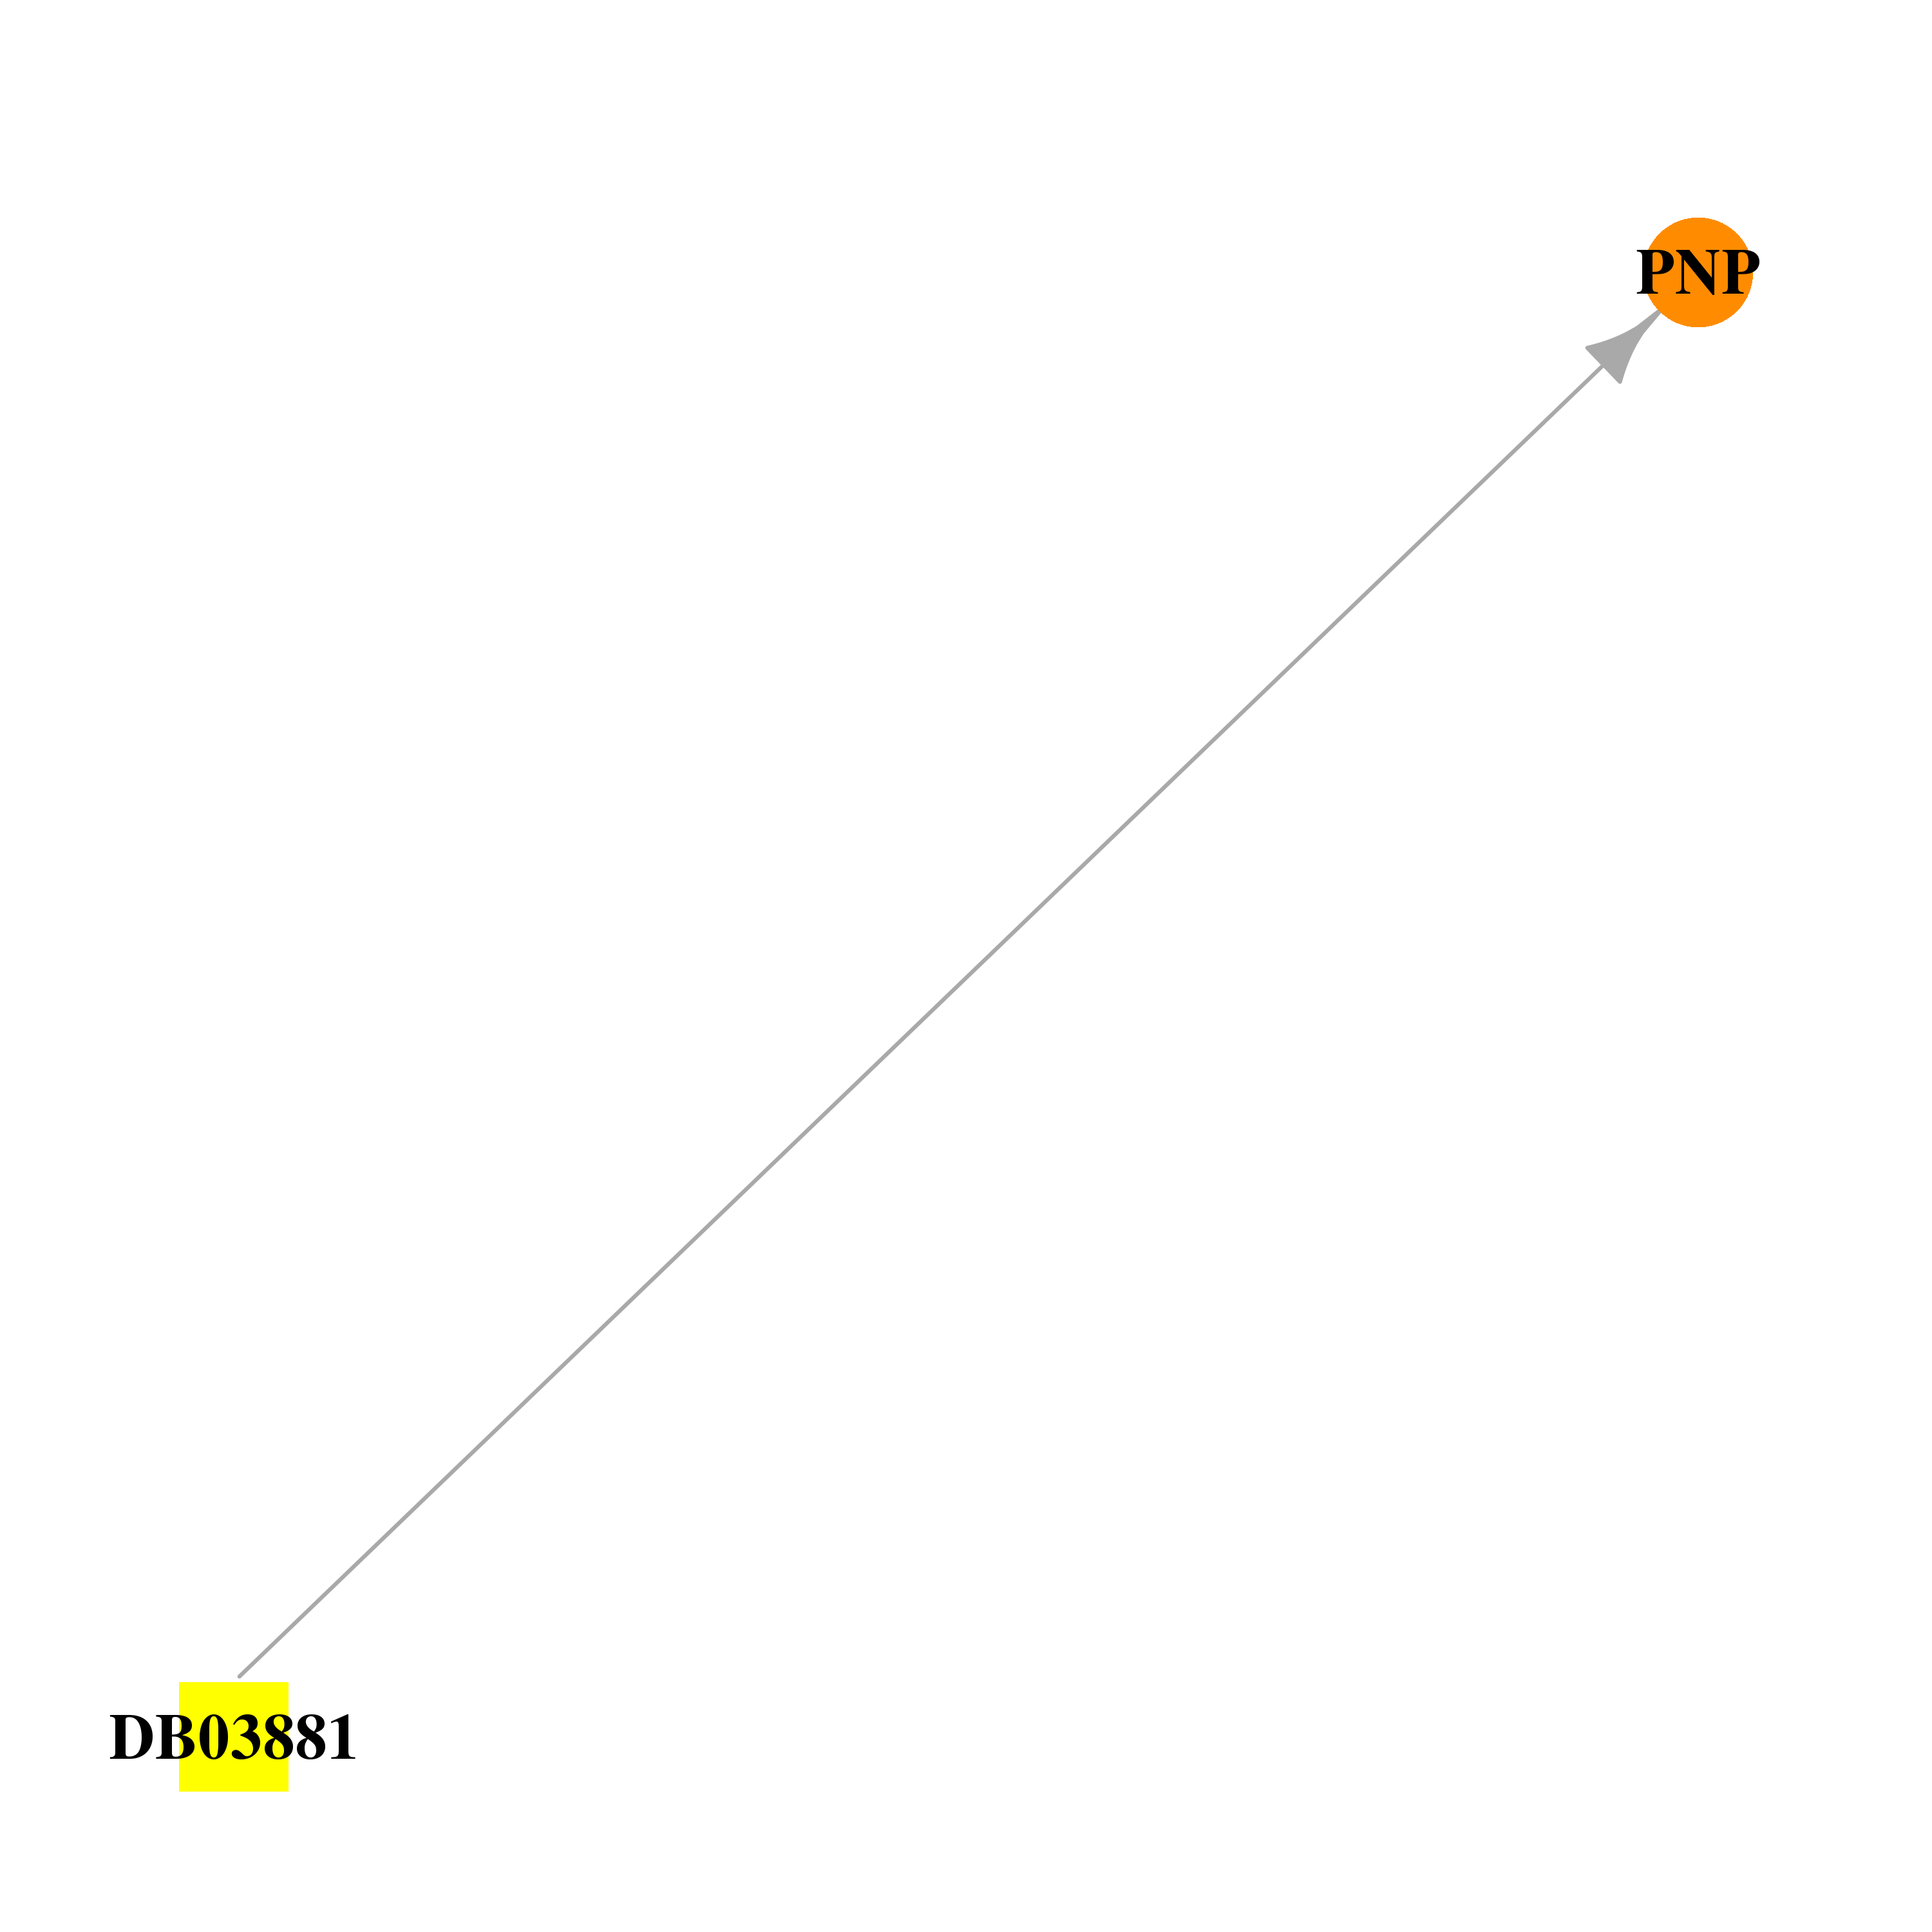 | 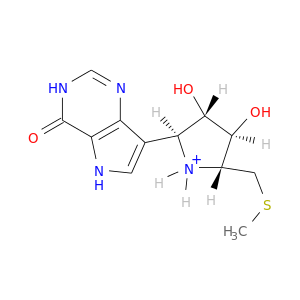 |
| DB04076 | purine nucleoside phosphorylase | experimental | Hypoxanthine | 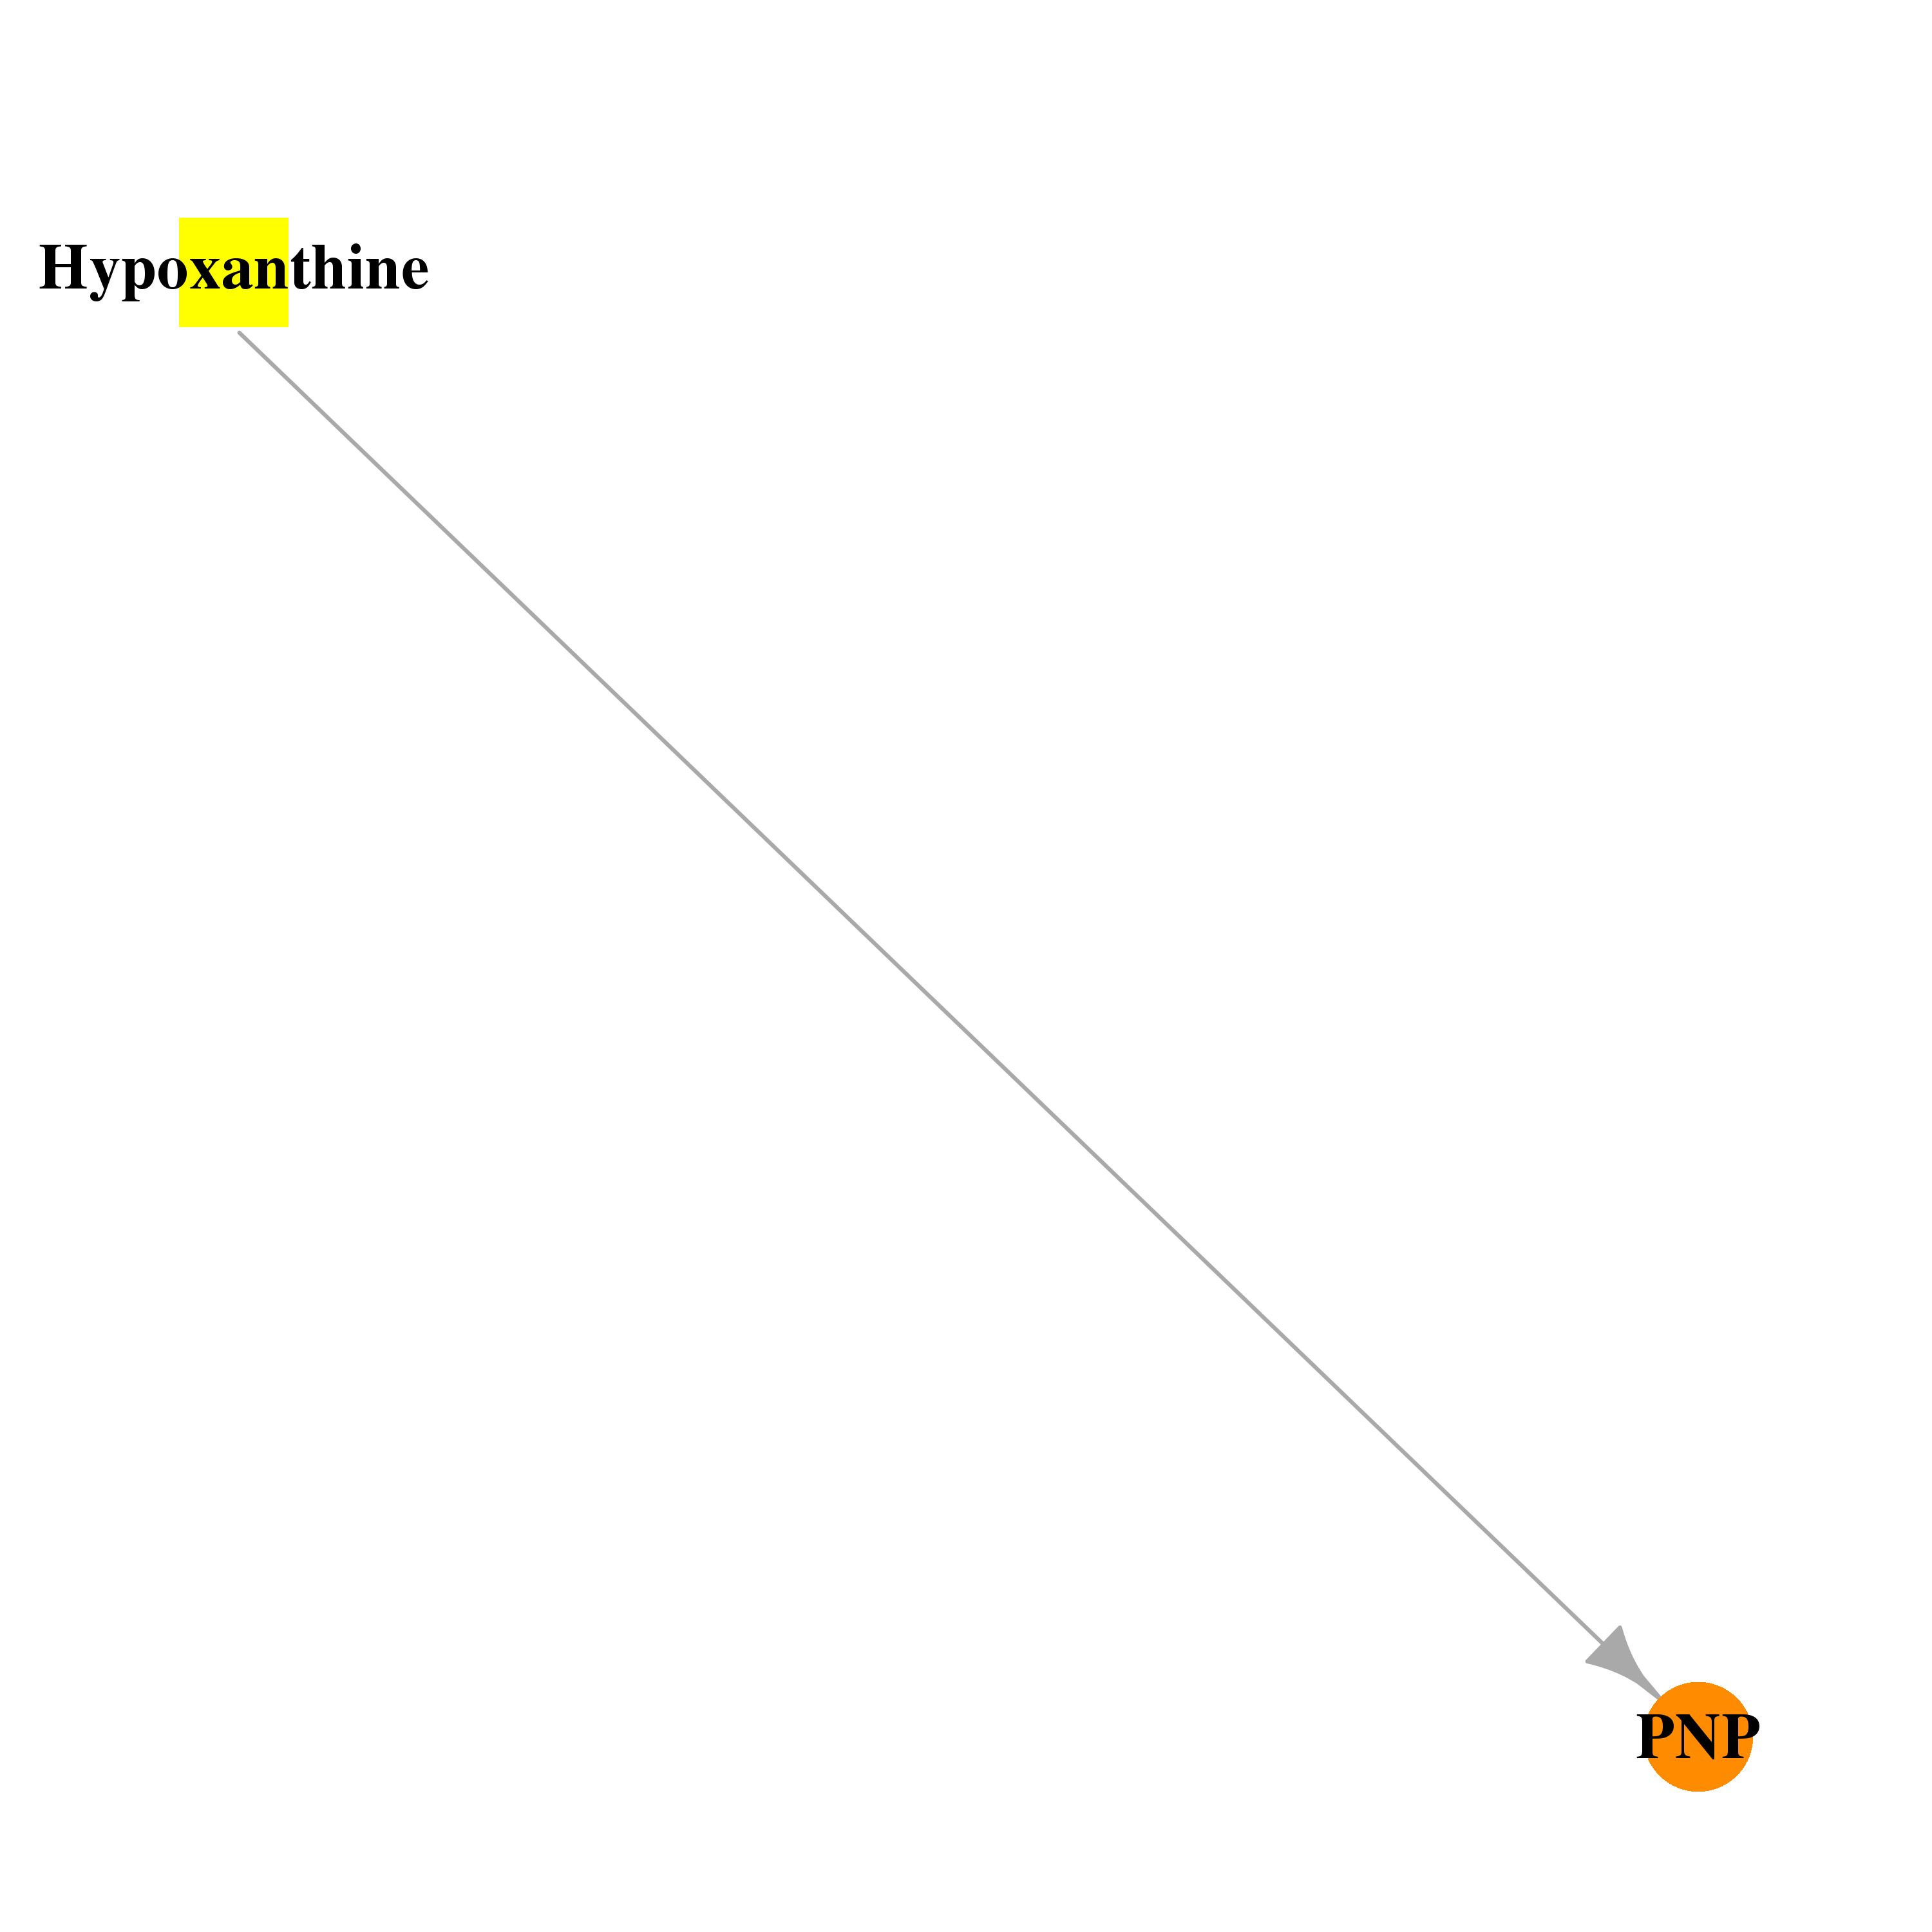 | 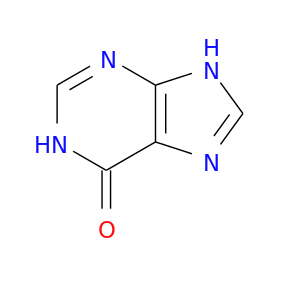 |
| DB04260 | purine nucleoside phosphorylase | experimental | 9-(5,5-Difluoro-5-Phosphonopentyl)Guanine |  | 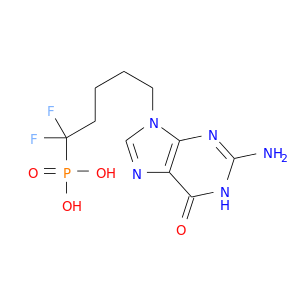 |
| DB04753 | purine nucleoside phosphorylase | experimental | 9-DEAZAINOSINE-2',3'-O-ETHYLIDENEPHOSPHONATE |  | 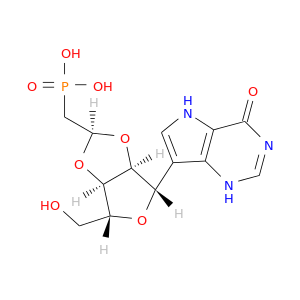 |
| DB04754 | purine nucleoside phosphorylase | experimental | GUANOSINE-2',3'-O-ETHYLIDENEPHOSPHONATE |  | 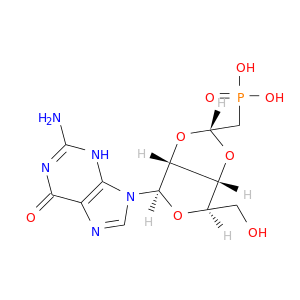 |
| DB04757 | purine nucleoside phosphorylase | experimental | GUANOSINE-2',3'-O-METHYLIDENEPHOSPHONATE | 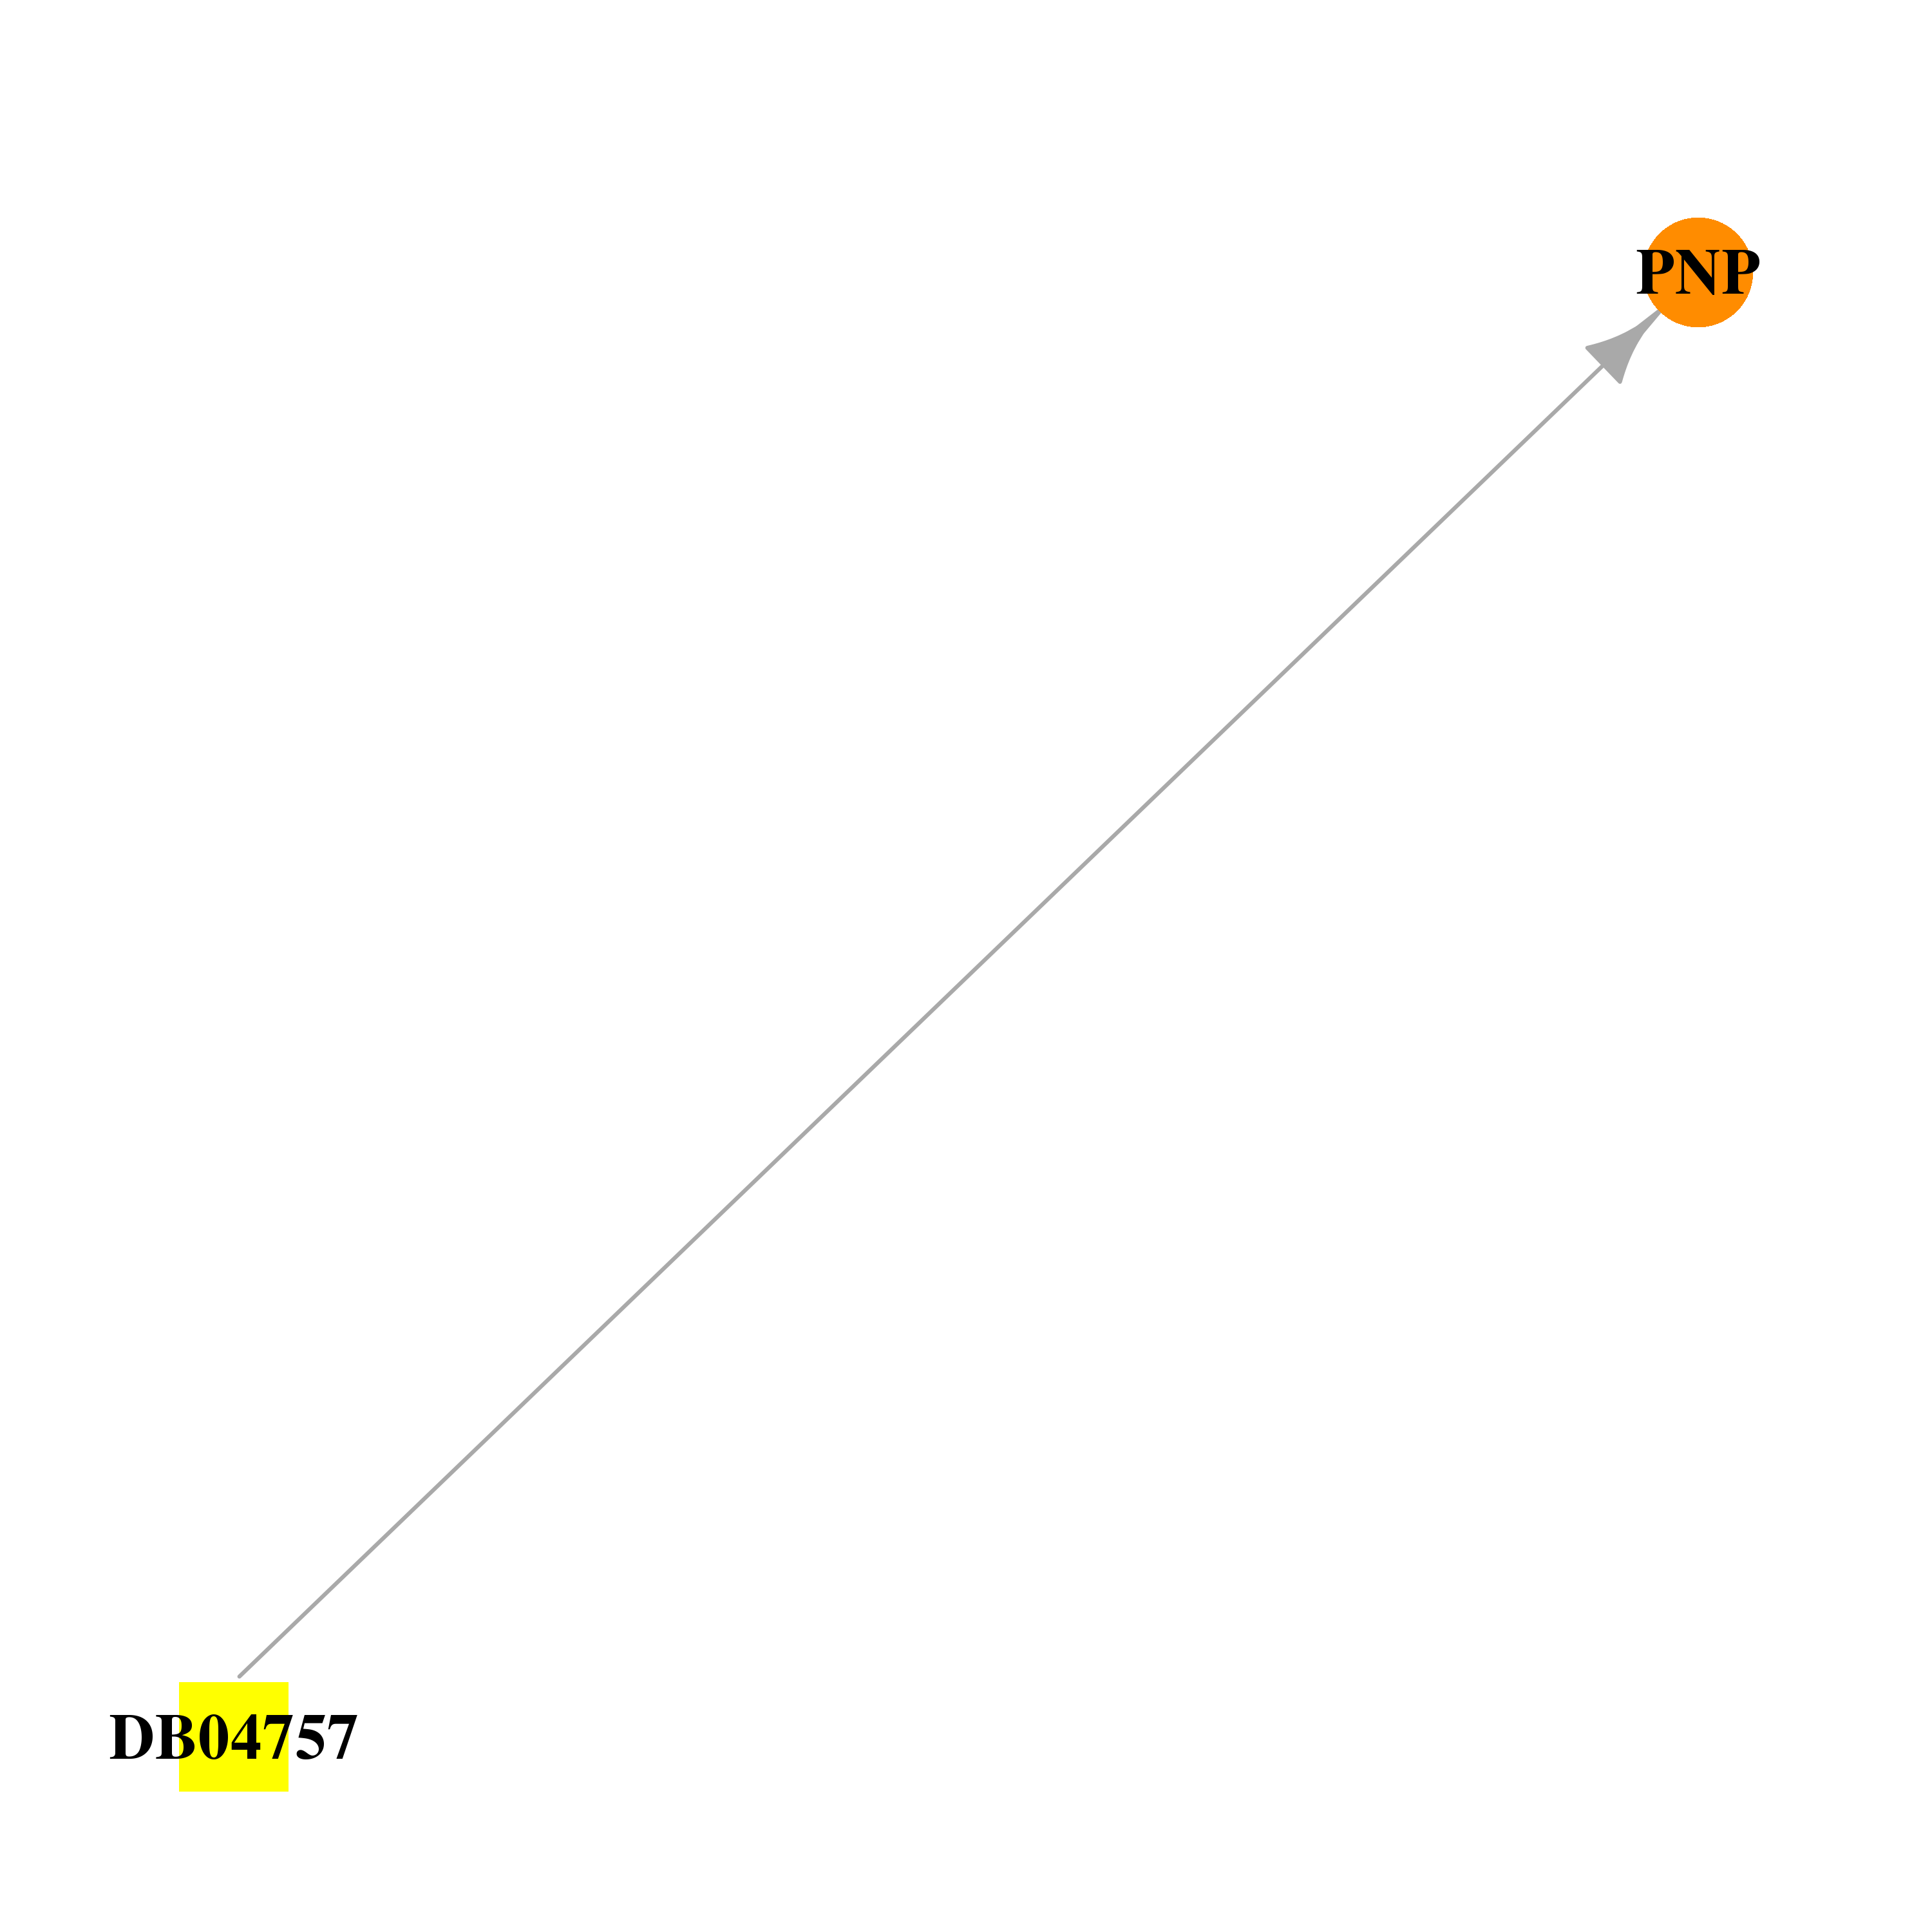 |  |
| DB03411 | purine nucleoside phosphorylase | experimental | 2-Hydroxymethyl-Pyrrolidine-3,4-Diol |  | 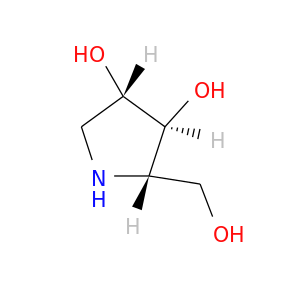 |
| DB04095 | purine nucleoside phosphorylase | experimental | 9-Deazahypoxanthine |  |  |
| DB02985 | purine nucleoside phosphorylase | experimental | 8-Iodo-Guanine |  |  |
| Top |
| Cross referenced IDs for PNP |
| * We obtained these cross-references from Uniprot database. It covers 150 different DBs, 18 categories. http://www.uniprot.org/help/cross_references_section |
: Open all cross reference information
|
Copyright © 2016-Present - The Univsersity of Texas Health Science Center at Houston @ |