|
||||||||||||||||||||||||||||||||||||||||||||||||||||||||||||||||||||||||||||||||||||||||||||||||||||||||||||||||||||||||||||||||||||||||||||||||||||||||||||||||||||||||||||||||||||||||||||||||||||||||||||||||||||||||||||||||||||||||||||||||||||||||||||||||||||||||||||||||||||||||||||||||||||||||||||||||||||||||||
| |
| Phenotypic Information (metabolism pathway, cancer, disease, phenome) |
| |
| |
| Gene-Gene Network Information: Co-Expression Network, Interacting Genes & KEGG |
| |
|


| Gene Summary for NPAS2 |
| Basic gene info. | Gene symbol | NPAS2 |
| Gene name | neuronal PAS domain protein 2 | |
| Synonyms | MOP4|PASD4|bHLHe9 | |
| Cytomap | UCSC genome browser: 2q11.2 | |
| Genomic location | chr2 :101436612-101613287 | |
| Type of gene | protein-coding | |
| RefGenes | NM_002518.3, | |
| Ensembl id | ENSG00000170485 | |
| Description | PAS domain-containing protein 4basic-helix-loop-helix-PAS protein MOP4class E basic helix-loop-helix protein 9member of PAS protein 4member of PAS superfamily 4neuronal PAS domain-containing protein 2neuronal PAS2 | |
| Modification date | 20141207 | |
| dbXrefs | MIM : 603347 | |
| HGNC : HGNC | ||
| Ensembl : ENSG00000170485 | ||
| HPRD : 09137 | ||
| Vega : OTTHUMG00000130675 | ||
| Protein | UniProt: go to UniProt's Cross Reference DB Table | |
| Expression | CleanEX: HS_NPAS2 | |
| BioGPS: 4862 | ||
| Gene Expression Atlas: ENSG00000170485 | ||
| The Human Protein Atlas: ENSG00000170485 | ||
| Pathway | NCI Pathway Interaction Database: NPAS2 | |
| KEGG: NPAS2 | ||
| REACTOME: NPAS2 | ||
| ConsensusPathDB | ||
| Pathway Commons: NPAS2 | ||
| Metabolism | MetaCyc: NPAS2 | |
| HUMANCyc: NPAS2 | ||
| Regulation | Ensembl's Regulation: ENSG00000170485 | |
| miRBase: chr2 :101,436,612-101,613,287 | ||
| TargetScan: NM_002518 | ||
| cisRED: ENSG00000170485 | ||
| Context | iHOP: NPAS2 | |
| cancer metabolism search in PubMed: NPAS2 | ||
| UCL Cancer Institute: NPAS2 | ||
| Assigned class in ccmGDB | C | |
| Top |
| Phenotypic Information for NPAS2(metabolism pathway, cancer, disease, phenome) |
| Cancer | CGAP: NPAS2 |
| Familial Cancer Database: NPAS2 | |
| * This gene is included in those cancer gene databases. |
|
|
|
|
|
| . | ||||||||||||||||||||||||||||||||||||||||||||||||||||||||||||||||||||||||||||||||||||||||||||||||||||||||||||||||||||||||||||||||||||||||||||||||||||||||||||||||||||||||||||||||||||||||||||||||||||||||||||||||||||||||||||||||||||||||||||||||||||||||||||||||||||||||||||||||||||||||||||||||||||||||||||||||||||
Oncogene 1 | Significant driver gene in | |||||||||||||||||||||||||||||||||||||||||||||||||||||||||||||||||||||||||||||||||||||||||||||||||||||||||||||||||||||||||||||||||||||||||||||||||||||||||||||||||||||||||||||||||||||||||||||||||||||||||||||||||||||||||||||||||||||||||||||||||||||||||||||||||||||||||||||||||||||||||||||||||||||||||||||||||||||||||
| cf) number; DB name 1 Oncogene; http://nar.oxfordjournals.org/content/35/suppl_1/D721.long, 2 Tumor Suppressor gene; https://bioinfo.uth.edu/TSGene/, 3 Cancer Gene Census; http://www.nature.com/nrc/journal/v4/n3/abs/nrc1299.html, 4 CancerGenes; http://nar.oxfordjournals.org/content/35/suppl_1/D721.long, 5 Network of Cancer Gene; http://ncg.kcl.ac.uk/index.php, 1Therapeutic Vulnerabilities in Cancer; http://cbio.mskcc.org/cancergenomics/statius/ |
| REACTOME_METABOLISM_OF_LIPIDS_AND_LIPOPROTEINS | |
| OMIM | |
| Orphanet | |
| Disease | KEGG Disease: NPAS2 |
| MedGen: NPAS2 (Human Medical Genetics with Condition) | |
| ClinVar: NPAS2 | |
| Phenotype | MGI: NPAS2 (International Mouse Phenotyping Consortium) |
| PhenomicDB: NPAS2 | |
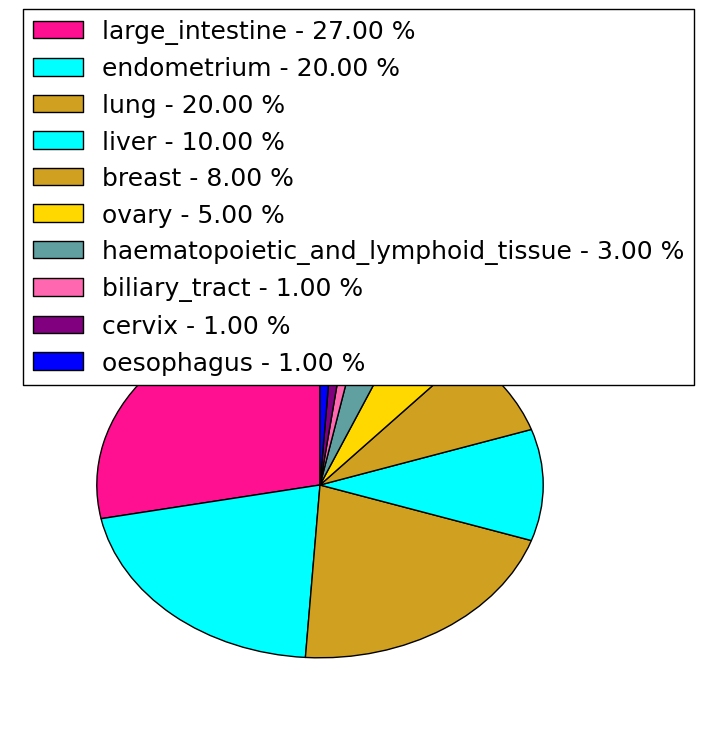
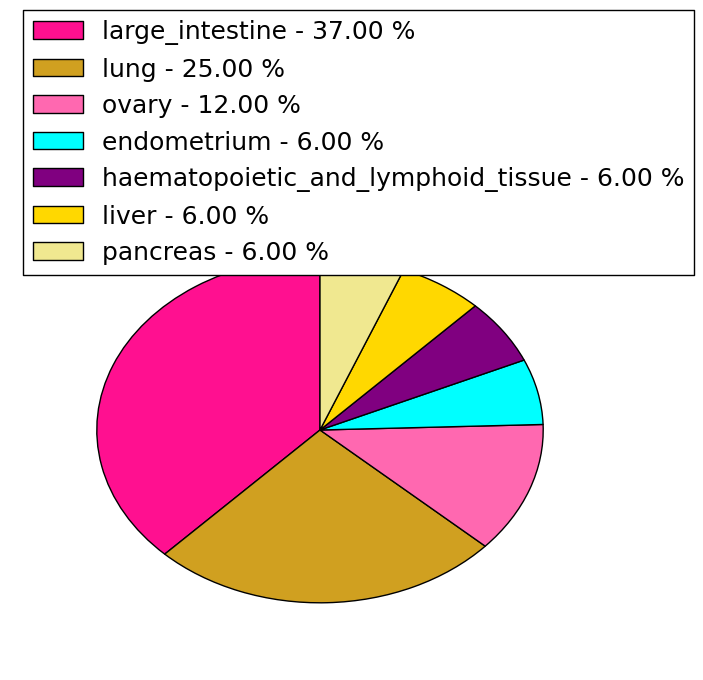
| Mutations for NPAS2 |
| * Under tables are showing count per each tissue to give us broad intuition about tissue specific mutation patterns.You can go to the detailed page for each mutation database's web site. |
| - Statistics for Tissue and Mutation type | Top |
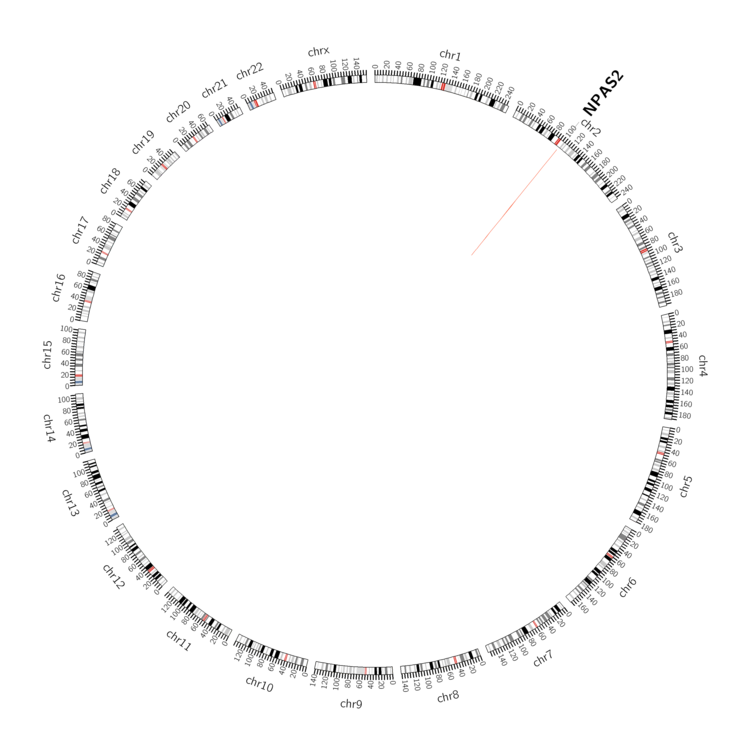 |
| - For Inter-chromosomal Variations |
| There's no inter-chromosomal structural variation. |
| - For Intra-chromosomal Variations |
| There's no intra-chromosomal structural variation. |
| Sample | Symbol_a | Chr_a | Start_a | End_a | Symbol_b | Chr_b | Start_b | End_b |
| ovary | NPAS2 | chr2 | 101448180 | 101448200 | chr2 | 101350594 | 101350614 | |
| ovary | NPAS2 | chr2 | 101480130 | 101480150 | NPAS2 | chr2 | 101480209 | 101480229 |
| cf) Tissue number; Tissue name (1;Breast, 2;Central_nervous_system, 3;Haematopoietic_and_lymphoid_tissue, 4;Large_intestine, 5;Liver, 6;Lung, 7;Ovary, 8;Pancreas, 9;Prostate, 10;Skin, 11;Soft_tissue, 12;Upper_aerodigestive_tract) |
| * From mRNA Sanger sequences, Chitars2.0 arranged chimeric transcripts. This table shows NPAS2 related fusion information. |
| ID | Head Gene | Tail Gene | Accession | Gene_a | qStart_a | qEnd_a | Chromosome_a | tStart_a | tEnd_a | Gene_a | qStart_a | qEnd_a | Chromosome_a | tStart_a | tEnd_a |
| AW973590 | RPS6 | 1 | 140 | 9 | 19376324 | 19376568 | NPAS2 | 139 | 462 | 2 | 101541622 | 101554305 | |
| CR991271 | NPAS2 | 55 | 84 | 2 | 101486976 | 101487005 | KIAA0319L | 77 | 816 | 1 | 35944604 | 35972739 | |
| AA553904 | RPS6 | 6 | 210 | 9 | 19376259 | 19376568 | NPAS2 | 209 | 435 | 2 | 101541622 | 101549457 | |
| BQ365509 | NPAS2 | 17 | 164 | 2 | 101486568 | 101486715 | NPAS2 | 158 | 311 | 2 | 101493443 | 101493596 | |
| Top |
| Mutation type/ Tissue ID | brca | cns | cerv | endome | haematopo | kidn | Lintest | liver | lung | ns | ovary | pancre | prost | skin | stoma | thyro | urina | |||
| Total # sample | 1 | 6 | 2 | 1 | ||||||||||||||||
| GAIN (# sample) | 1 | 2 | ||||||||||||||||||
| LOSS (# sample) | 6 | 1 |
| cf) Tissue ID; Tissue type (1; Breast, 2; Central_nervous_system, 3; Cervix, 4; Endometrium, 5; Haematopoietic_and_lymphoid_tissue, 6; Kidney, 7; Large_intestine, 8; Liver, 9; Lung, 10; NS, 11; Ovary, 12; Pancreas, 13; Prostate, 14; Skin, 15; Stomach, 16; Thyroid, 17; Urinary_tract) |
| Top |
|
 |
| Top |
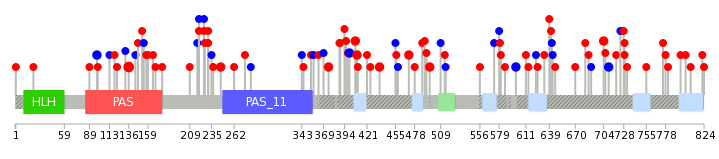
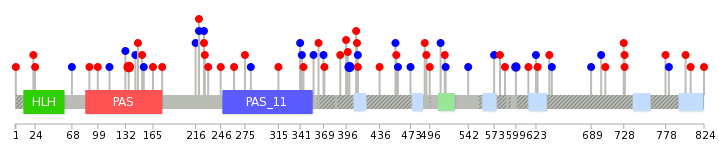
| Stat. for Non-Synonymous SNVs (# total SNVs=59) | (# total SNVs=16) |
 |  |
(# total SNVs=0) | (# total SNVs=0) |
| Top |
| * When you move the cursor on each content, you can see more deailed mutation information on the Tooltip. Those are primary_site,primary_histology,mutation(aa),pubmedID. |
| GRCh37 position | Mutation(aa) | Unique sampleID count |
| chr2:101564740-101564740 | p.Q136R | 4 |
| chr2:101549440-101549440 | p.E84* | 3 |
| chr2:101582121-101582121 | p.? | 2 |
| chr2:101587519-101587519 | p.H375Y | 2 |
| chr2:101598697-101598697 | p.S496L | 2 |
| chr2:101604708-101604708 | p.L599L | 2 |
| chr2:101609882-101609882 | p.V729F | 2 |
| chr2:101580599-101580599 | p.F226F | 2 |
| chr2:101591943-101591943 | p.E436K | 2 |
| chr2:101554235-101554235 | p.I98I | 2 |
| Top |
|
 |
| Point Mutation/ Tissue ID | 1 | 2 | 3 | 4 | 5 | 6 | 7 | 8 | 9 | 10 | 11 | 12 | 13 | 14 | 15 | 16 | 17 | 18 | 19 | 20 |
| # sample | 4 | 2 | 1 | 12 | 2 | 7 | 5 | 5 | 2 | 10 | 9 | 3 | 9 | |||||||
| # mutation | 4 | 2 | 1 | 12 | 2 | 8 | 5 | 4 | 2 | 11 | 10 | 3 | 11 | |||||||
| nonsynonymous SNV | 1 | 2 | 1 | 9 | 1 | 4 | 3 | 2 | 1 | 5 | 7 | 10 | ||||||||
| synonymous SNV | 3 | 3 | 1 | 4 | 2 | 2 | 1 | 6 | 3 | 3 | 1 |
| cf) Tissue ID; Tissue type (1; BLCA[Bladder Urothelial Carcinoma], 2; BRCA[Breast invasive carcinoma], 3; CESC[Cervical squamous cell carcinoma and endocervical adenocarcinoma], 4; COAD[Colon adenocarcinoma], 5; GBM[Glioblastoma multiforme], 6; Glioma Low Grade, 7; HNSC[Head and Neck squamous cell carcinoma], 8; KICH[Kidney Chromophobe], 9; KIRC[Kidney renal clear cell carcinoma], 10; KIRP[Kidney renal papillary cell carcinoma], 11; LAML[Acute Myeloid Leukemia], 12; LUAD[Lung adenocarcinoma], 13; LUSC[Lung squamous cell carcinoma], 14; OV[Ovarian serous cystadenocarcinoma ], 15; PAAD[Pancreatic adenocarcinoma], 16; PRAD[Prostate adenocarcinoma], 17; SKCM[Skin Cutaneous Melanoma], 18:STAD[Stomach adenocarcinoma], 19:THCA[Thyroid carcinoma], 20:UCEC[Uterine Corpus Endometrial Carcinoma]) |
| Top |
| * We represented just top 10 SNVs. When you move the cursor on each content, you can see more deailed mutation information on the Tooltip. Those are primary_site, primary_histology, mutation(aa), pubmedID. |
| Genomic Position | Mutation(aa) | Unique sampleID count |
| chr2:101564740 | p.Q136R | 4 |
| chr2:101591324 | p.S400S | 3 |
| chr2:101609882 | p.V729F | 2 |
| chr2:101604708 | p.F226F | 2 |
| chr2:101580599 | p.L599L | 2 |
| chr2:101564773 | p.R701R | 1 |
| chr2:101592002 | p.C216C | 1 |
| chr2:101581341 | p.P369P | 1 |
| chr2:101604630 | p.M492I | 1 |
| chr2:101521219 | p.A706V | 1 |
| * Copy number data were extracted from TCGA using R package TCGA-Assembler. The URLs of all public data files on TCGA DCC data server were gathered on Jan-05-2015. Function ProcessCNAData in TCGA-Assembler package was used to obtain gene-level copy number value which is calculated as the average copy number of the genomic region of a gene. |
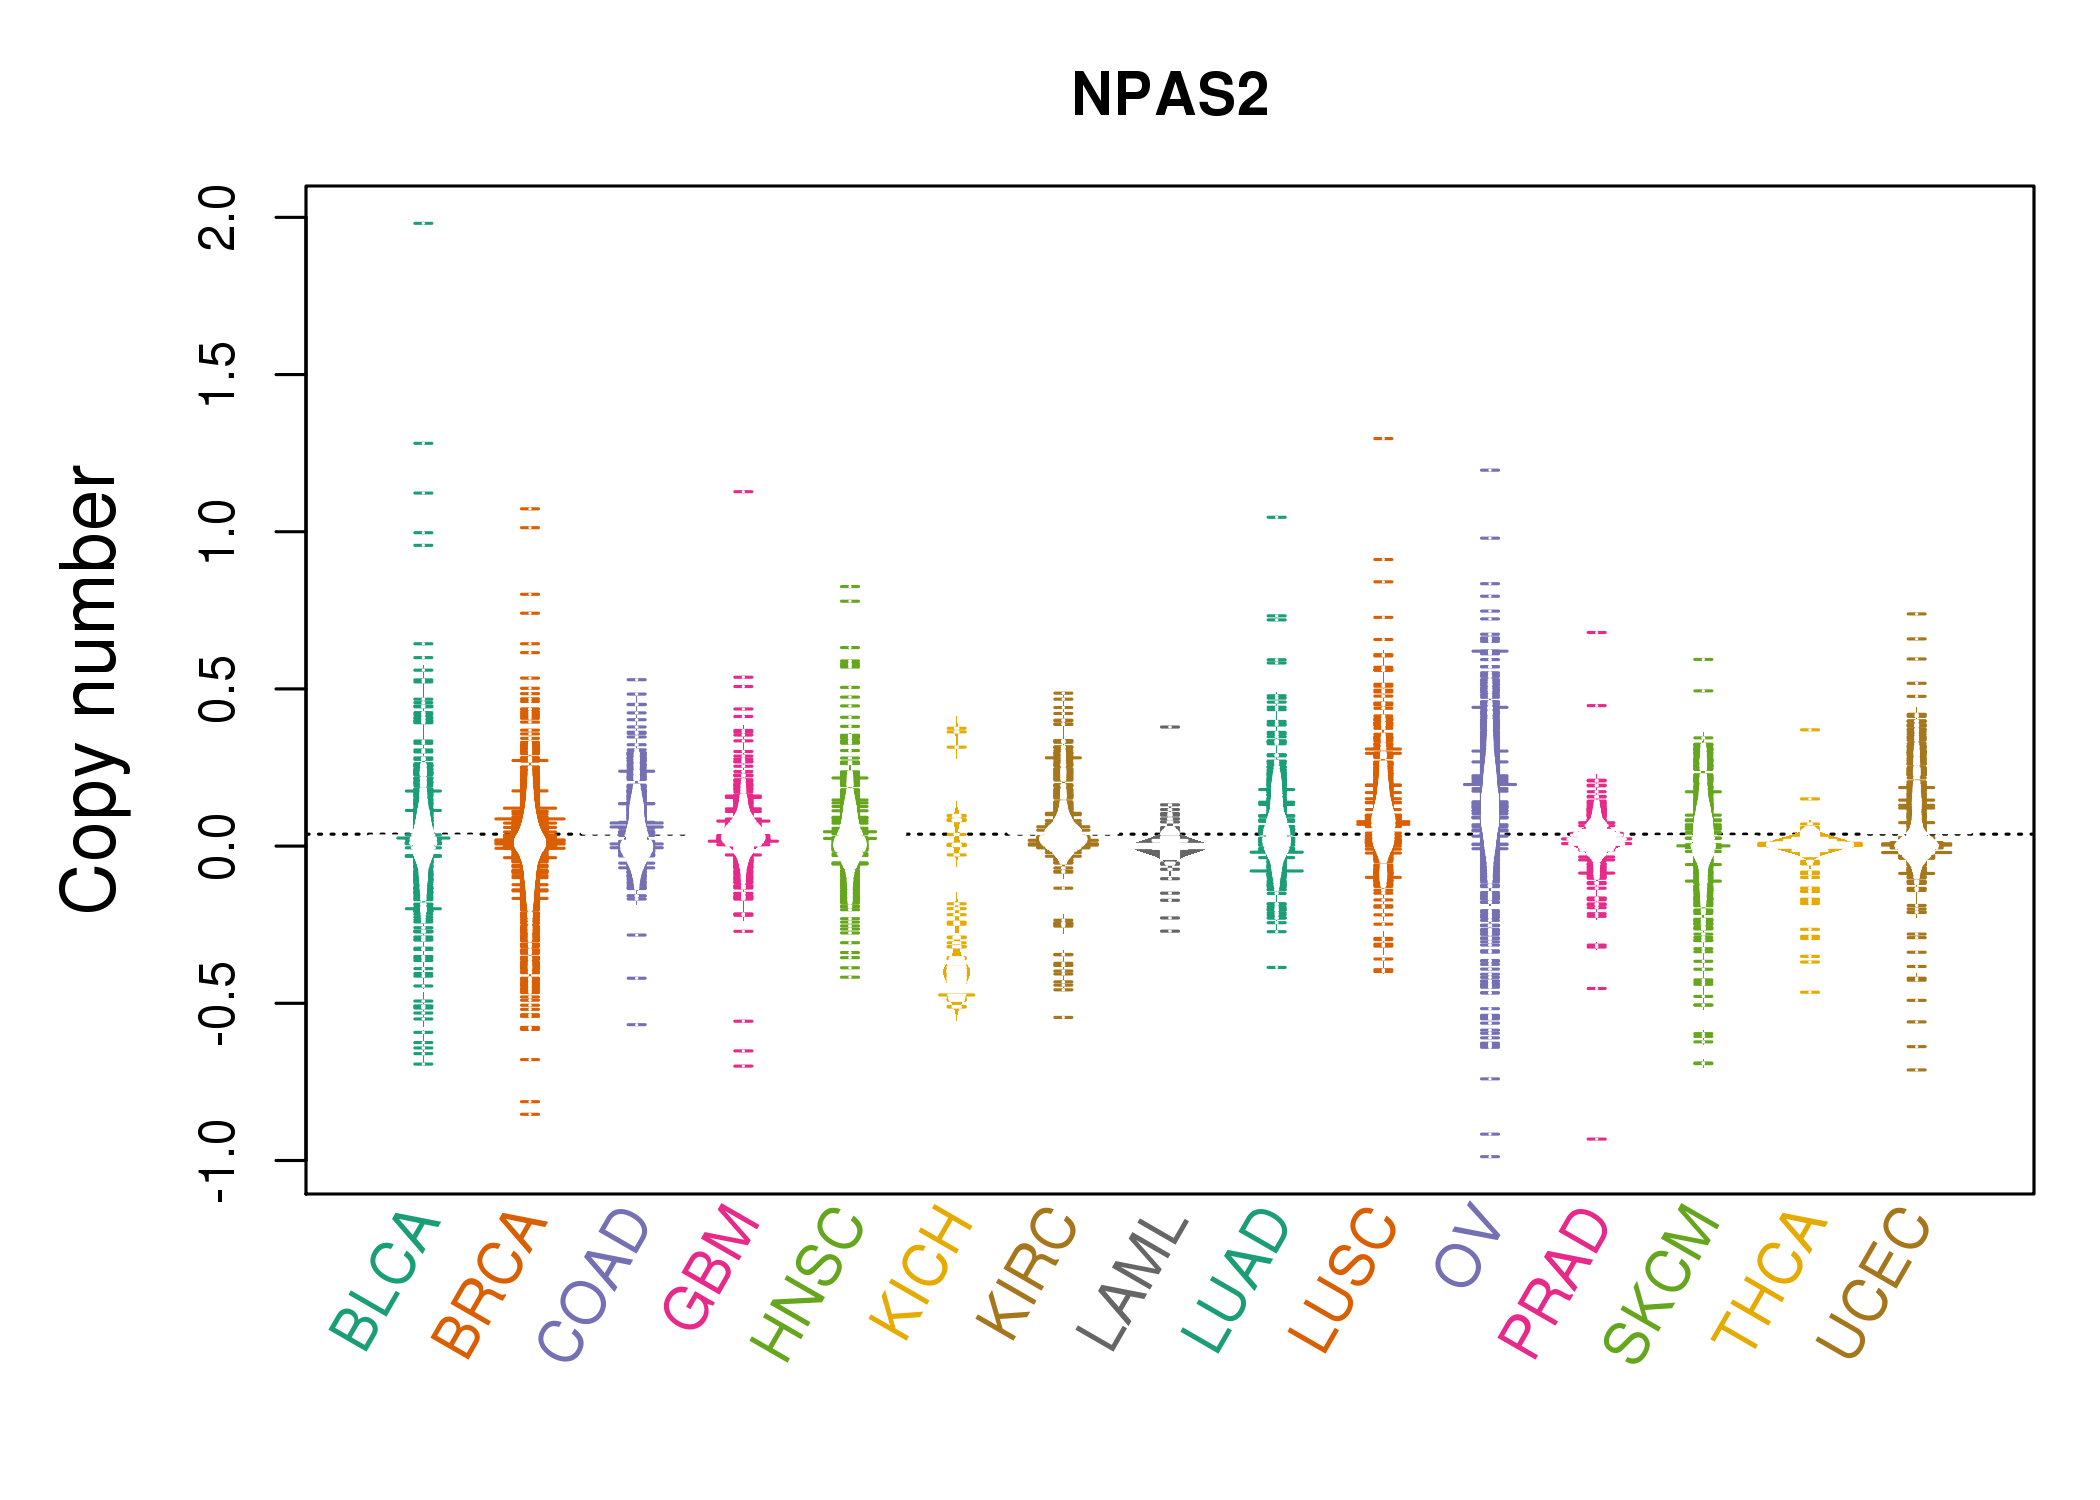 |
| cf) Tissue ID[Tissue type]: BLCA[Bladder Urothelial Carcinoma], BRCA[Breast invasive carcinoma], CESC[Cervical squamous cell carcinoma and endocervical adenocarcinoma], COAD[Colon adenocarcinoma], GBM[Glioblastoma multiforme], Glioma Low Grade, HNSC[Head and Neck squamous cell carcinoma], KICH[Kidney Chromophobe], KIRC[Kidney renal clear cell carcinoma], KIRP[Kidney renal papillary cell carcinoma], LAML[Acute Myeloid Leukemia], LUAD[Lung adenocarcinoma], LUSC[Lung squamous cell carcinoma], OV[Ovarian serous cystadenocarcinoma ], PAAD[Pancreatic adenocarcinoma], PRAD[Prostate adenocarcinoma], SKCM[Skin Cutaneous Melanoma], STAD[Stomach adenocarcinoma], THCA[Thyroid carcinoma], UCEC[Uterine Corpus Endometrial Carcinoma] |
| Top |
| Gene Expression for NPAS2 |
| * CCLE gene expression data were extracted from CCLE_Expression_Entrez_2012-10-18.res: Gene-centric RMA-normalized mRNA expression data. |
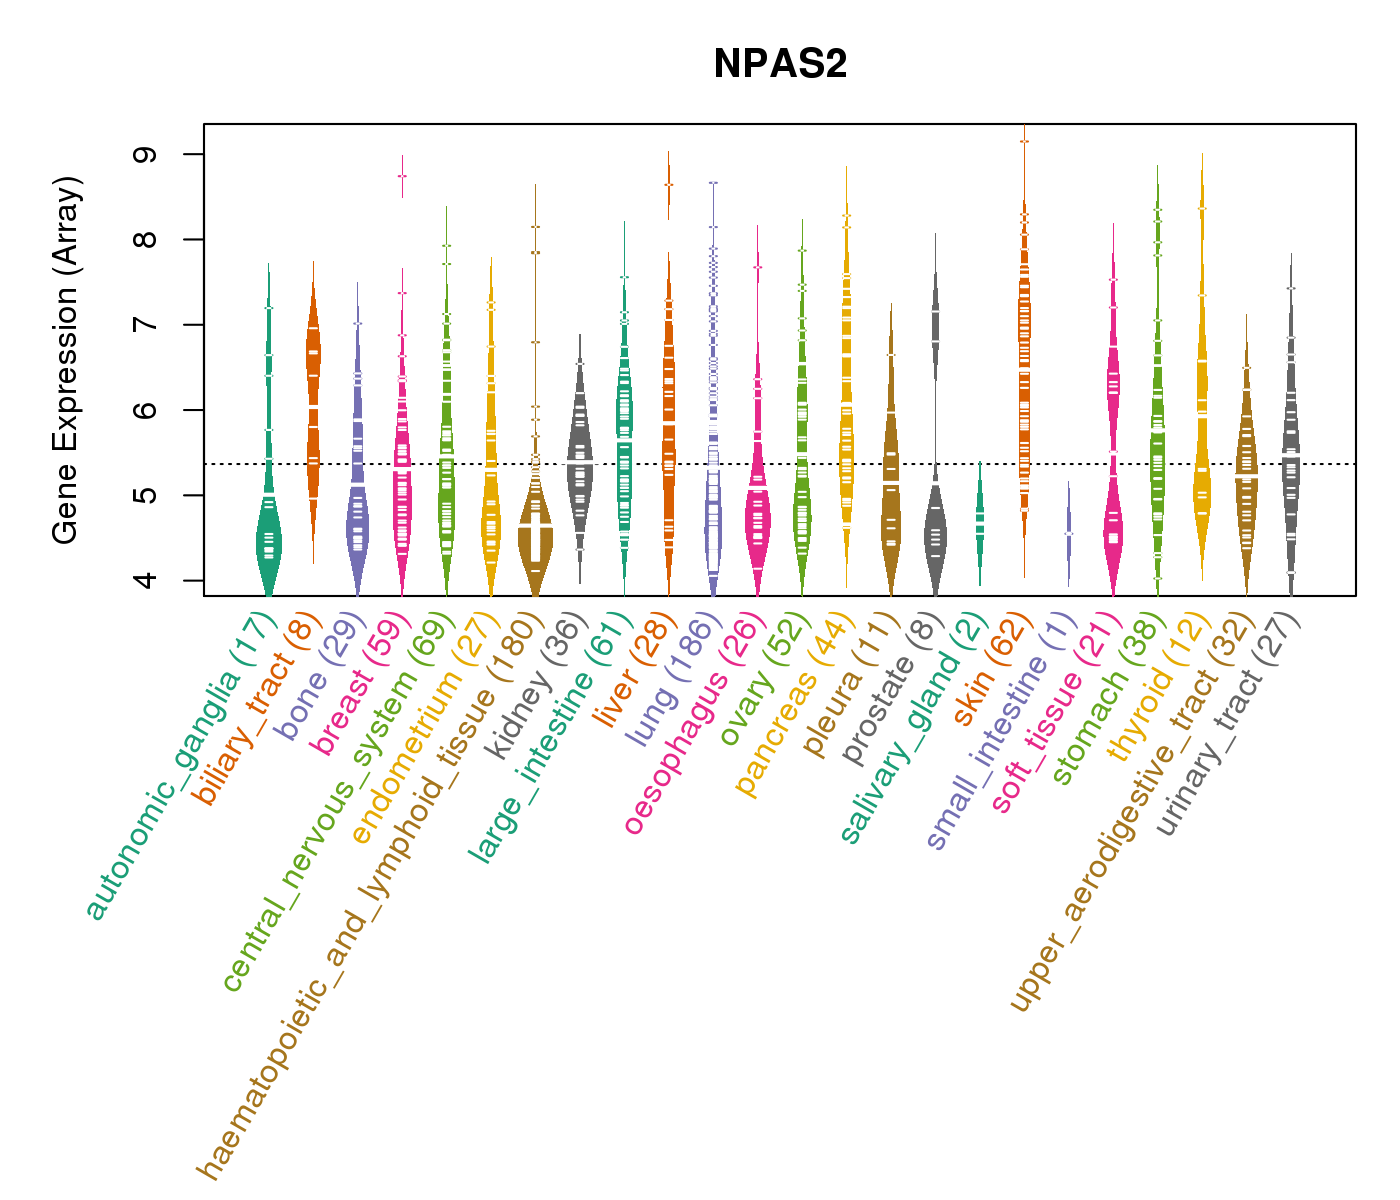 |
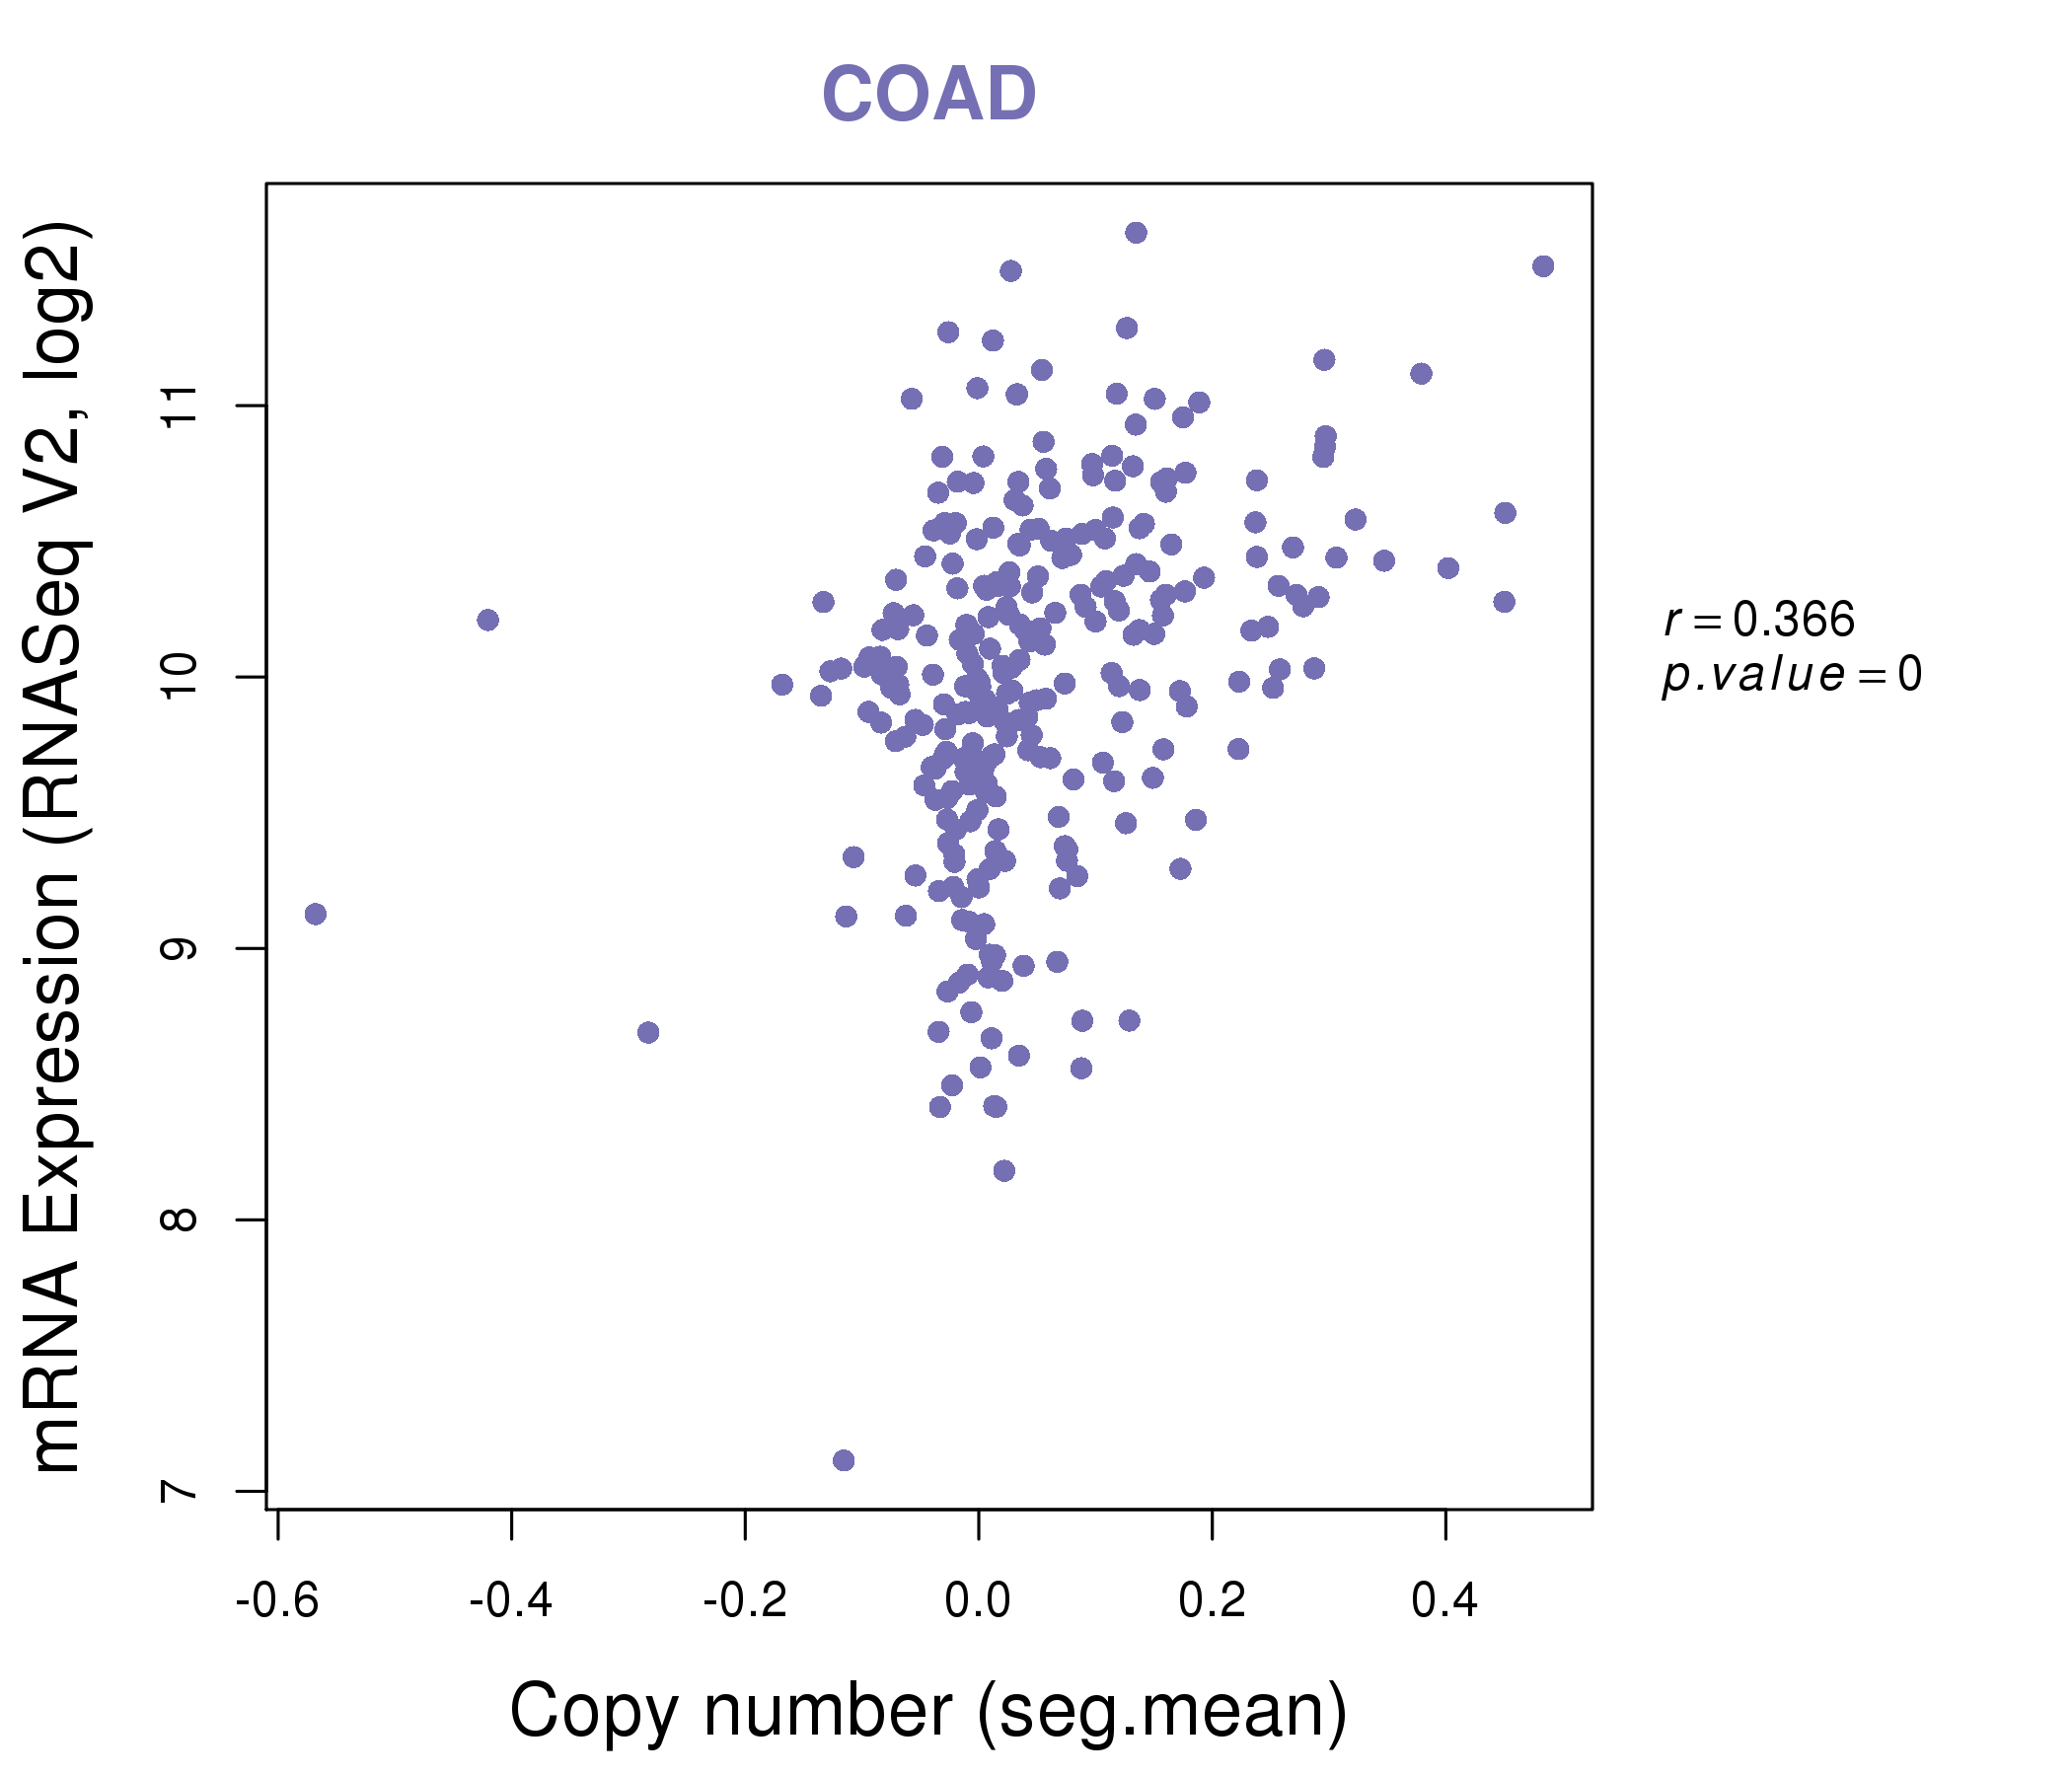
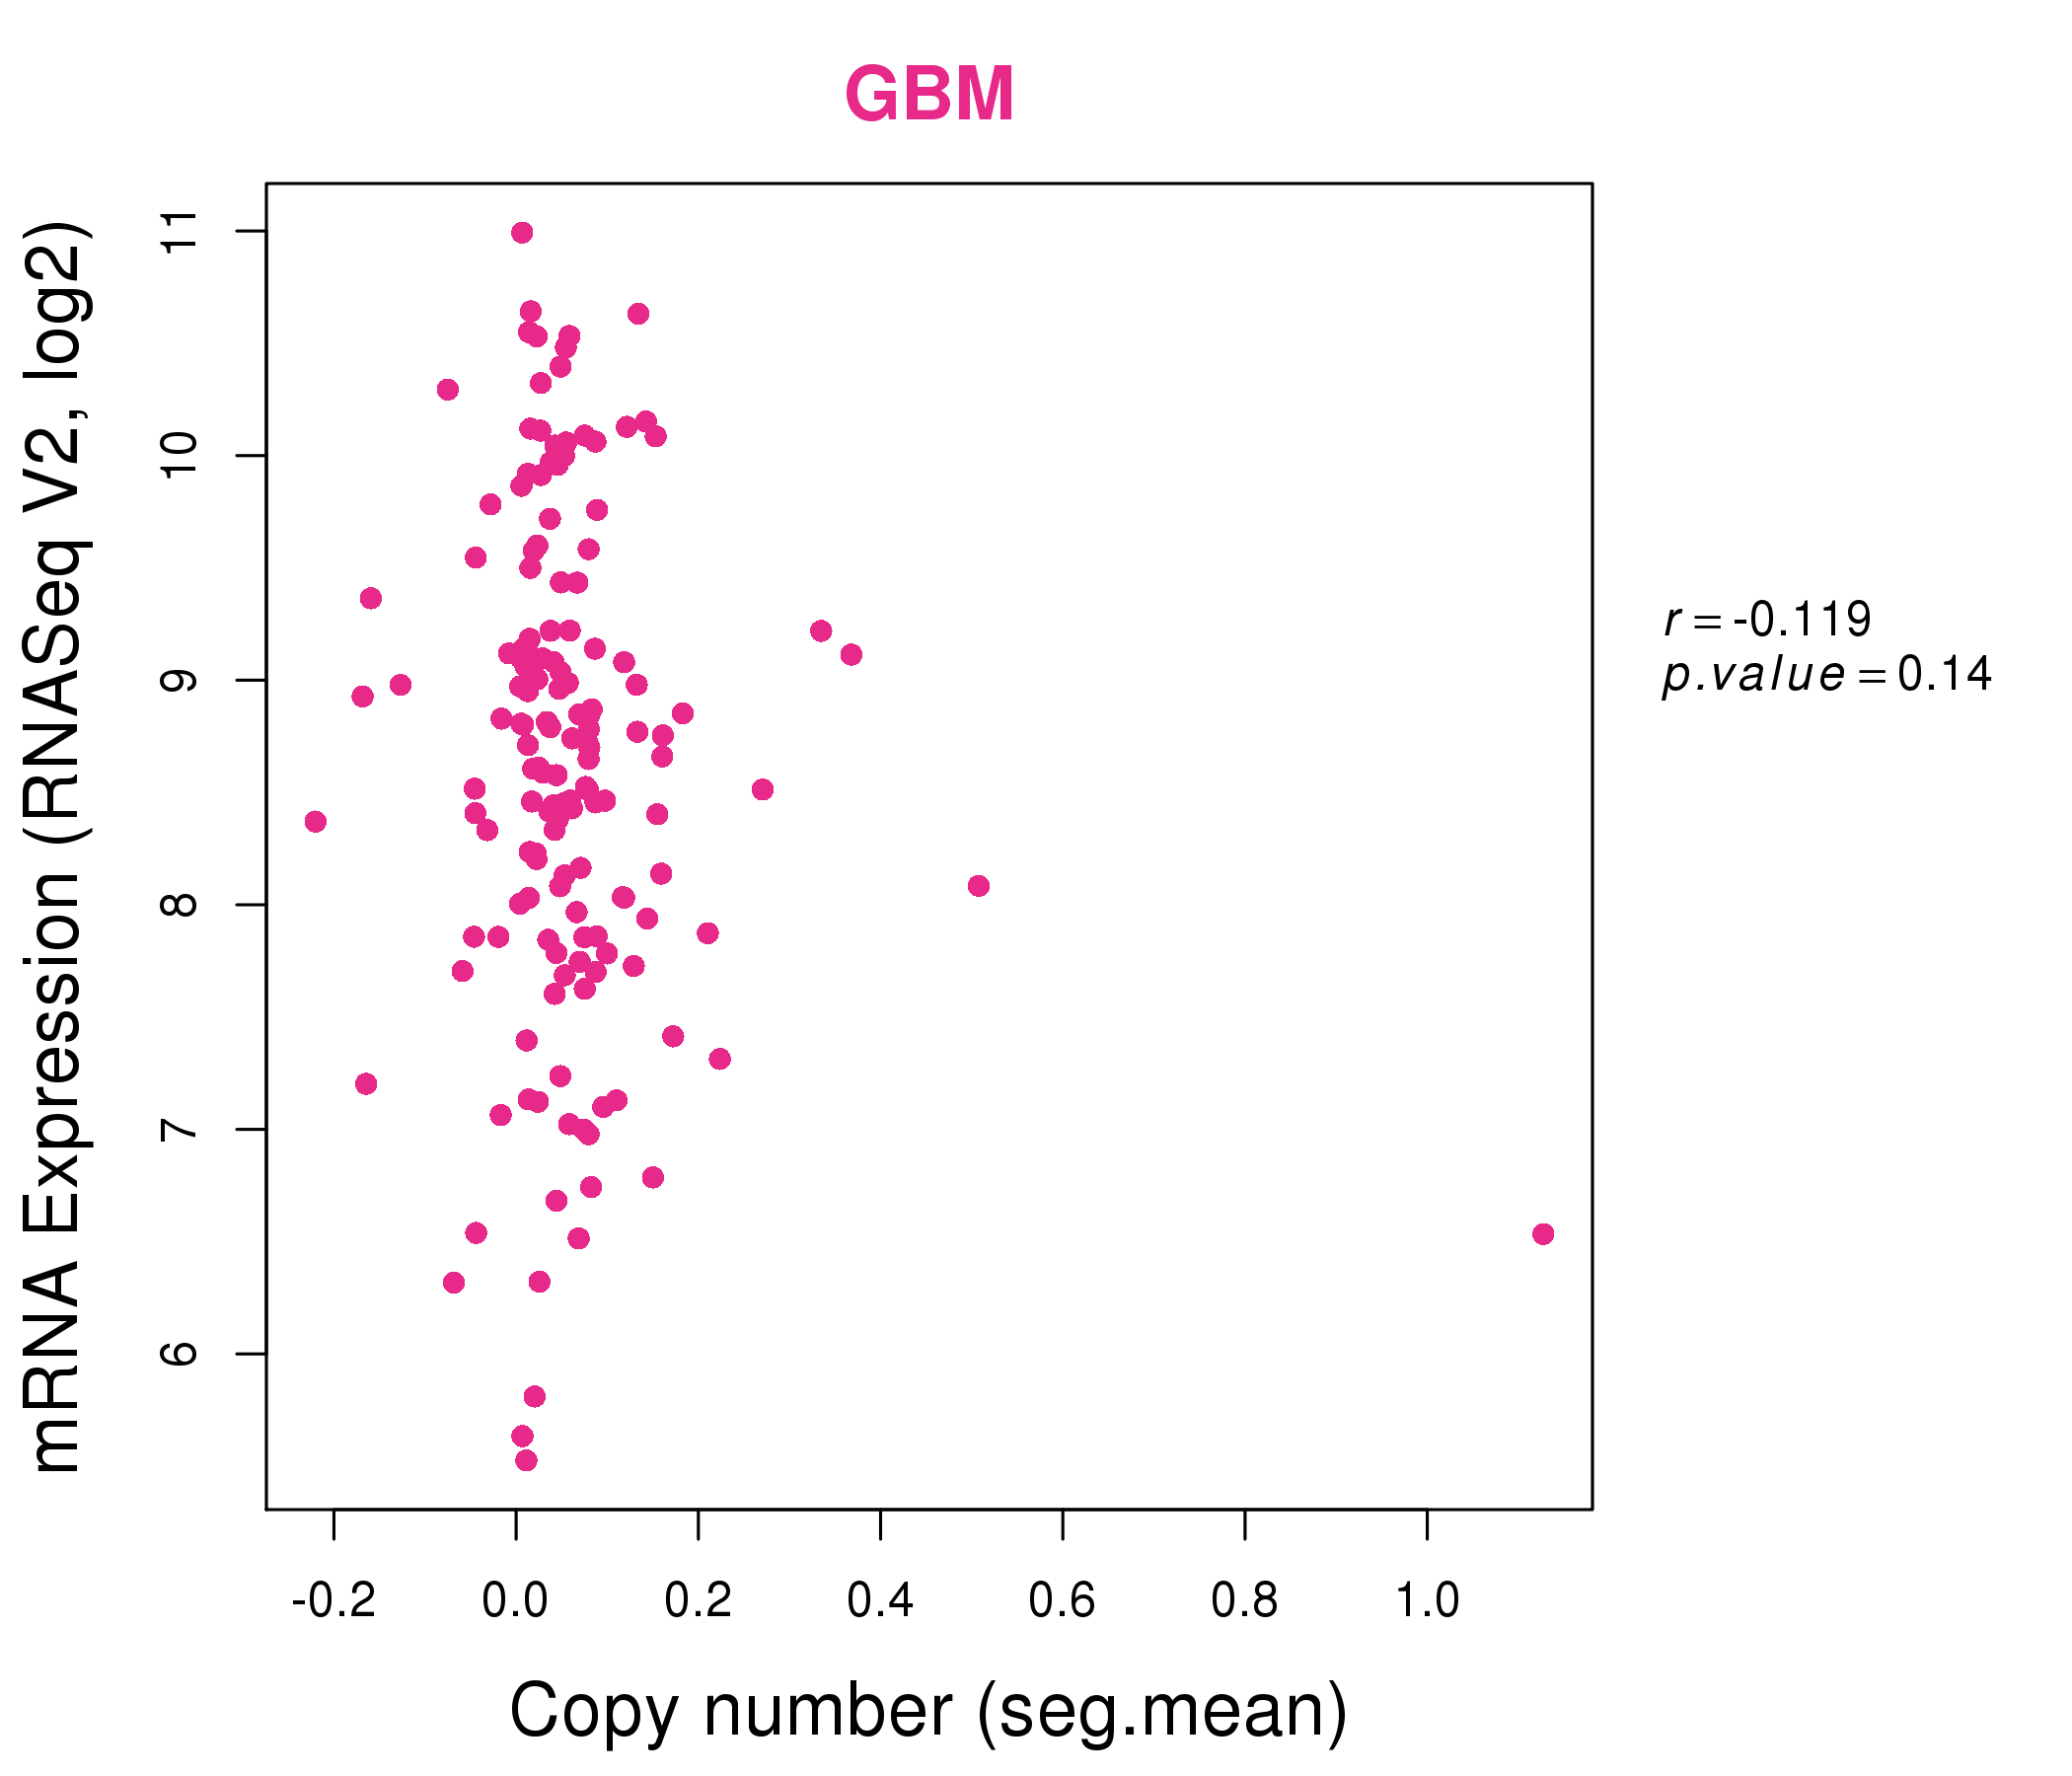
| * Normalized gene expression data of RNASeqV2 was extracted from TCGA using R package TCGA-Assembler. The URLs of all public data files on TCGA DCC data server were gathered at Jan-05-2015. Only eight cancer types have enough normal control samples for differential expression analysis. (t test, adjusted p<0.05 (using Benjamini-Hochberg FDR)) |
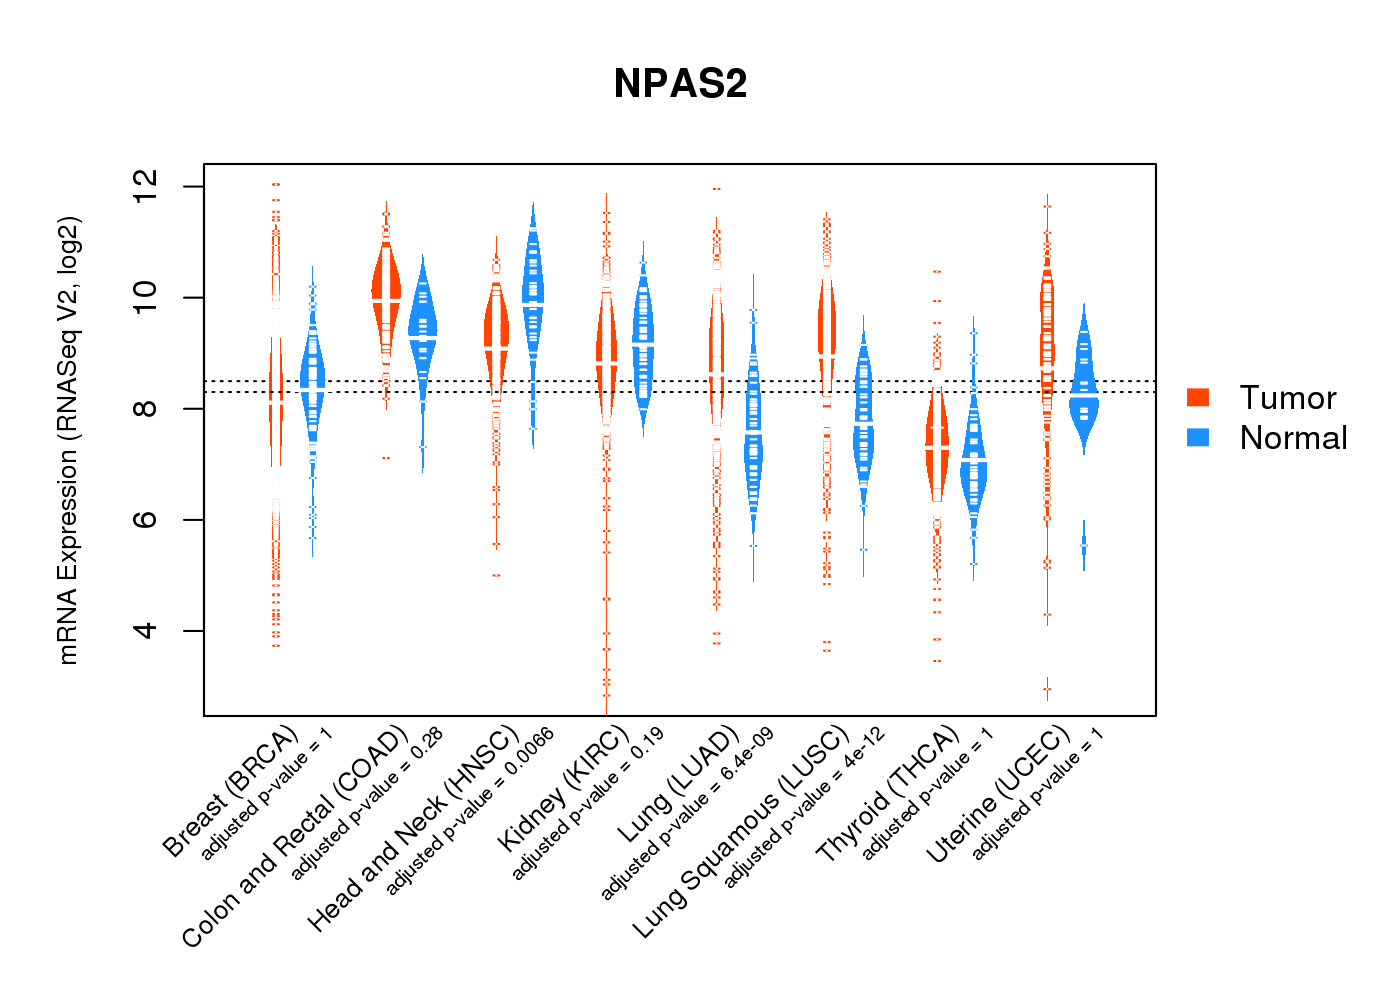 |
| Top |
| * This plots show the correlation between CNV and gene expression. |
: Open all plots for all cancer types
 |
|
 |
|

| Top |
| Gene-Gene Network Information |
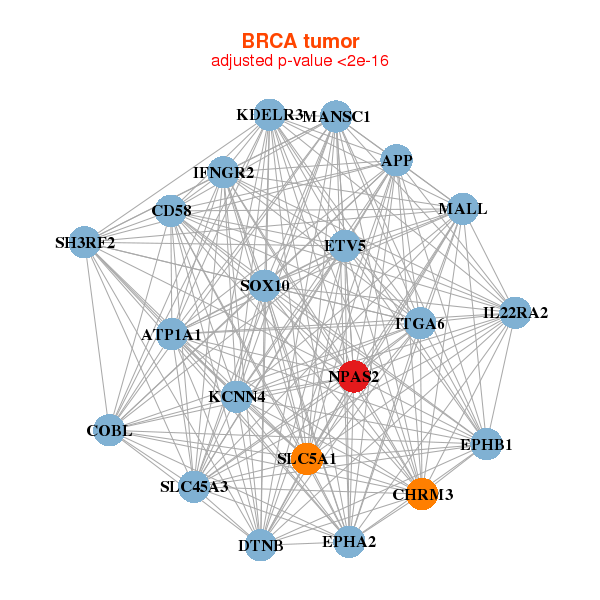
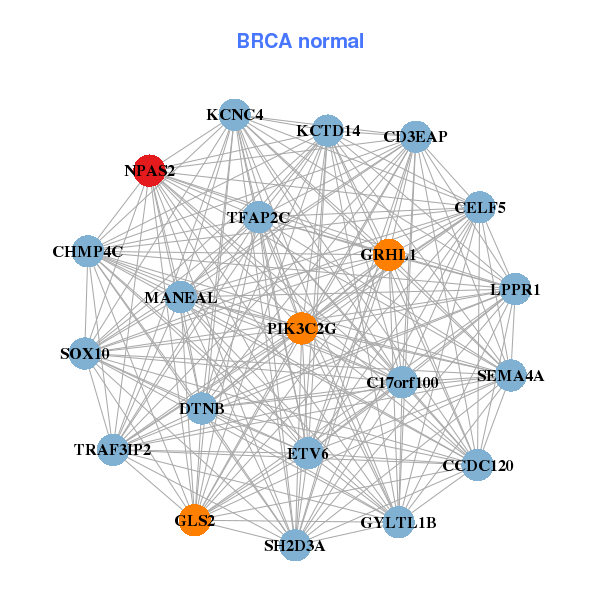
| * Co-Expression network figures were drawn using R package igraph. Only the top 20 genes with the highest correlations were shown. Red circle: input gene, orange circle: cell metabolism gene, sky circle: other gene |
: Open all plots for all cancer types
 |
|
| APP,ATP1A1,CD58,CHRM3,COBL,DTNB,EPHA2, EPHB1,ETV5,IFNGR2,IL22RA2,ITGA6,KCNN4,KDELR3, MALL,MANSC1,NPAS2,SH3RF2,SLC45A3,SLC5A1,SOX10 | C17orf100,CCDC120,CD3EAP,CELF5,CHMP4C,DTNB,ETV6, GLS2,GRHL1,GYLTL1B,KCNC4,KCTD14,LPPR1,MANEAL, NPAS2,PIK3C2G,SEMA4A,SH2D3A,SOX10,TFAP2C,TRAF3IP2 |
 |
|
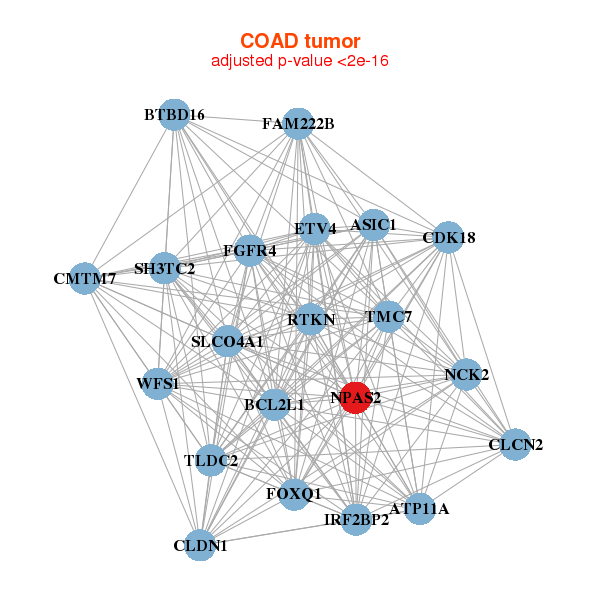
| ASIC1,ATP11A,BCL2L1,BTBD16,FAM222B,TLDC2,CDK18, CLCN2,CLDN1,CMTM7,ETV4,FGFR4,FOXQ1,IRF2BP2, NCK2,NPAS2,RTKN,SH3TC2,SLCO4A1,TMC7,WFS1 | CXorf23,ERBB3,FHDC1,HNF4A,KIAA1522,MTMR11,NPAS2, NR3C2,OSBPL2,PDE8A,PHACTR2,RAB11FIP1,RAVER2,SLC8B1, SLC26A6,TMEM164,TMEM170A,TMEM63B,TMUB2,VDR,WASL |
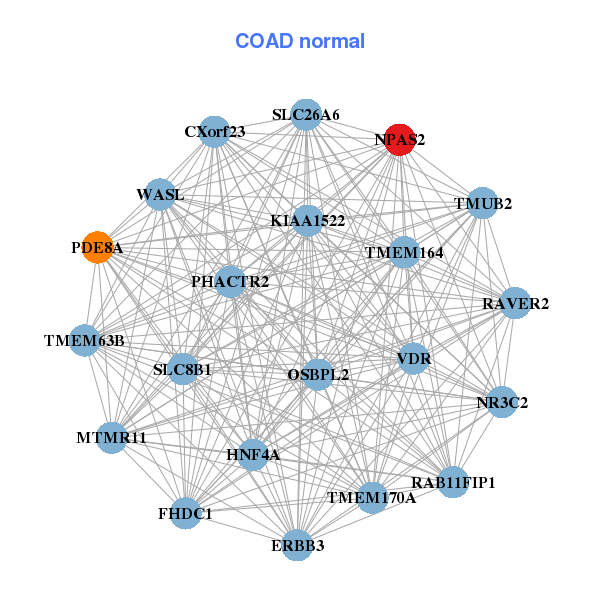
| * Co-Expression network figures were drawn using R package igraph. Only the top 20 genes with the highest correlations were shown. Red circle: input gene, orange circle: cell metabolism gene, sky circle: other gene |
: Open all plots for all cancer types
| Top |
: Open all interacting genes' information including KEGG pathway for all interacting genes from DAVID
| Top |
| Pharmacological Information for NPAS2 |
| There's no related Drug. |
| Top |
| Cross referenced IDs for NPAS2 |
| * We obtained these cross-references from Uniprot database. It covers 150 different DBs, 18 categories. http://www.uniprot.org/help/cross_references_section |
: Open all cross reference information
|
Copyright © 2016-Present - The Univsersity of Texas Health Science Center at Houston @ |