|
||||||||||||||||||||||||||||||||||||||||||||||||||||||||||||||||||||||||||||||||||||||||||||||||||||||||||||||||||||||||||||||||||||||||||||||||||||||||||||||||||||||||||||||||||||||||||||||||||||||||||||||||||||||||||||||||||||||||||||||||||||||||||||||||||||||||||||||||||||||||||||||||||||||||||||||||||||||||||
| |
| Phenotypic Information (metabolism pathway, cancer, disease, phenome) |
| |
| |
| Gene-Gene Network Information: Co-Expression Network, Interacting Genes & KEGG |
| |
|


| Gene Summary for NPR2 |
| Basic gene info. | Gene symbol | NPR2 |
| Gene name | natriuretic peptide receptor 2 | |
| Synonyms | AMDM|ANPRB|ANPb|ECDM|GUC2B|GUCY2B|NPRB|NPRBi | |
| Cytomap | UCSC genome browser: 9p21-p12 | |
| Genomic location | chr9 :35792405-35809728 | |
| Type of gene | protein-coding | |
| RefGenes | NM_003995.3, NM_000907.2, | |
| Ensembl id | ENSG00000159899 | |
| Description | ANP-BANPR-BGC-BNPR-Batrial natriuretic peptide B-type receptoratrial natriuretic peptide receptor 2atrial natriuretic peptide receptor type Bguanylate cyclase Bnatriuretic peptide receptor B/guanylate cyclase B (atrionatriuretic peptide receptor B | |
| Modification date | 20141207 | |
| dbXrefs | MIM : 108961 | |
| HGNC : HGNC | ||
| Ensembl : ENSG00000159899 | ||
| HPRD : 00166 | ||
| Vega : OTTHUMG00000019871 | ||
| Protein | UniProt: P20594 go to UniProt's Cross Reference DB Table | |
| Expression | CleanEX: HS_NPR2 | |
| BioGPS: 4882 | ||
| Gene Expression Atlas: ENSG00000159899 | ||
| The Human Protein Atlas: ENSG00000159899 | ||
| Pathway | NCI Pathway Interaction Database: NPR2 | |
| KEGG: NPR2 | ||
| REACTOME: NPR2 | ||
| ConsensusPathDB | ||
| Pathway Commons: NPR2 | ||
| Metabolism | MetaCyc: NPR2 | |
| HUMANCyc: NPR2 | ||
| Regulation | Ensembl's Regulation: ENSG00000159899 | |
| miRBase: chr9 :35,792,405-35,809,728 | ||
| TargetScan: NM_003995 | ||
| cisRED: ENSG00000159899 | ||
| Context | iHOP: NPR2 | |
| cancer metabolism search in PubMed: NPR2 | ||
| UCL Cancer Institute: NPR2 | ||
| Assigned class in ccmGDB | B - This gene belongs to cancer gene. | |
| Top |
| Phenotypic Information for NPR2(metabolism pathway, cancer, disease, phenome) |
| Cancer | CGAP: NPR2 |
| Familial Cancer Database: NPR2 | |
| * This gene is included in those cancer gene databases. |
|
|
|
|
|
| . | ||||||||||||||||||||||||||||||||||||||||||||||||||||||||||||||||||||||||||||||||||||||||||||||||||||||||||||||||||||||||||||||||||||||||||||||||||||||||||||||||||||||||||||||||||||||||||||||||||||||||||||||||||||||||||||||||||||||||||||||||||||||||||||||||||||||||||||||||||||||||||||||||||||||||||||||||||||
Oncogene 1 | Significant driver gene in | |||||||||||||||||||||||||||||||||||||||||||||||||||||||||||||||||||||||||||||||||||||||||||||||||||||||||||||||||||||||||||||||||||||||||||||||||||||||||||||||||||||||||||||||||||||||||||||||||||||||||||||||||||||||||||||||||||||||||||||||||||||||||||||||||||||||||||||||||||||||||||||||||||||||||||||||||||||||||
| cf) number; DB name 1 Oncogene; http://nar.oxfordjournals.org/content/35/suppl_1/D721.long, 2 Tumor Suppressor gene; https://bioinfo.uth.edu/TSGene/, 3 Cancer Gene Census; http://www.nature.com/nrc/journal/v4/n3/abs/nrc1299.html, 4 CancerGenes; http://nar.oxfordjournals.org/content/35/suppl_1/D721.long, 5 Network of Cancer Gene; http://ncg.kcl.ac.uk/index.php, 1Therapeutic Vulnerabilities in Cancer; http://cbio.mskcc.org/cancergenomics/statius/ |
| KEGG_PURINE_METABOLISM | |
| OMIM | 108961; gene. 108961; gene. 602875; phenotype. 602875; phenotype. |
| Orphanet | 329191; Tall stature - scoliosis - macrodactyly of the great toes. 329191; Tall stature - scoliosis - macrodactyly of the great toes. 40; Acromesomelic dysplasia, Maroteaux type. 40; Acromesomelic dysplasia, Maroteaux type. |
| Disease | KEGG Disease: NPR2 |
| MedGen: NPR2 (Human Medical Genetics with Condition) | |
| ClinVar: NPR2 | |
| Phenotype | MGI: NPR2 (International Mouse Phenotyping Consortium) |
| PhenomicDB: NPR2 | |
| Mutations for NPR2 |
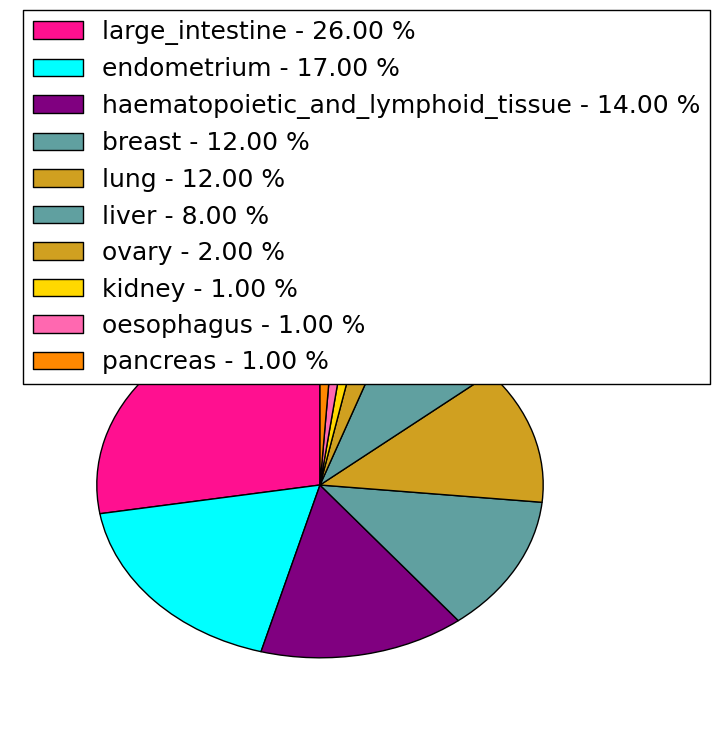
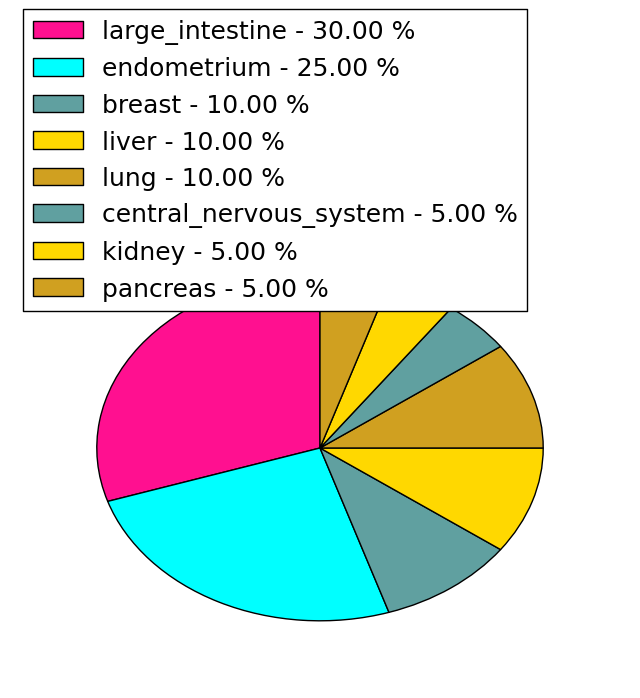
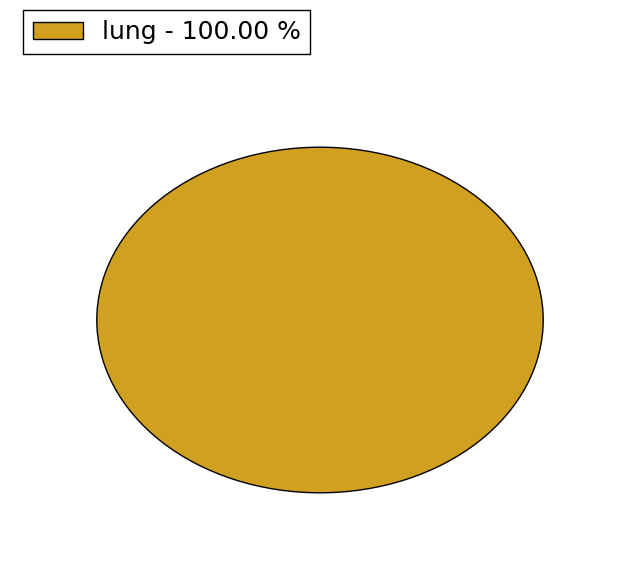
| * Under tables are showing count per each tissue to give us broad intuition about tissue specific mutation patterns.You can go to the detailed page for each mutation database's web site. |
| - Statistics for Tissue and Mutation type | Top |
 |
| - For Inter-chromosomal Variations |
| * Inter-chromosomal variantions includes 'interchromosomal amplicon to amplicon', 'interchromosomal amplicon to non-amplified dna', 'interchromosomal insertion', 'Interchromosomal unknown type'. |
 |
| - For Intra-chromosomal Variations |
| There's no intra-chromosomal structural variation. |
| Sample | Symbol_a | Chr_a | Start_a | End_a | Symbol_b | Chr_b | Start_b | End_b |
| cf) Tissue number; Tissue name (1;Breast, 2;Central_nervous_system, 3;Haematopoietic_and_lymphoid_tissue, 4;Large_intestine, 5;Liver, 6;Lung, 7;Ovary, 8;Pancreas, 9;Prostate, 10;Skin, 11;Soft_tissue, 12;Upper_aerodigestive_tract) |
| * From mRNA Sanger sequences, Chitars2.0 arranged chimeric transcripts. This table shows NPR2 related fusion information. |
| ID | Head Gene | Tail Gene | Accession | Gene_a | qStart_a | qEnd_a | Chromosome_a | tStart_a | tEnd_a | Gene_a | qStart_a | qEnd_a | Chromosome_a | tStart_a | tEnd_a |
| BQ771511 | NPR2 | 12 | 297 | 9 | 35809431 | 35809716 | ATHL1 | 294 | 642 | 11 | 290940 | 292602 | |
| L13436 | CASK | 4 | 416 | X | 41441029 | 41441441 | NPR2 | 398 | 4081 | 9 | 35792152 | 35809729 | |
| BF369934 | NPR2 | 17 | 94 | 9 | 35794913 | 35794991 | RASAL2 | 91 | 669 | 1 | 178371899 | 178372478 | |
| Top |
| Mutation type/ Tissue ID | brca | cns | cerv | endome | haematopo | kidn | Lintest | liver | lung | ns | ovary | pancre | prost | skin | stoma | thyro | urina | |||
| Total # sample | 1 | 1 | ||||||||||||||||||
| GAIN (# sample) | ||||||||||||||||||||
| LOSS (# sample) | 1 | 1 |
| cf) Tissue ID; Tissue type (1; Breast, 2; Central_nervous_system, 3; Cervix, 4; Endometrium, 5; Haematopoietic_and_lymphoid_tissue, 6; Kidney, 7; Large_intestine, 8; Liver, 9; Lung, 10; NS, 11; Ovary, 12; Pancreas, 13; Prostate, 14; Skin, 15; Stomach, 16; Thyroid, 17; Urinary_tract) |
| Top |
|
 |
| Top |
| Stat. for Non-Synonymous SNVs (# total SNVs=78) | (# total SNVs=20) |
 |  |
(# total SNVs=1) | (# total SNVs=0) |
 |
| Top |
| * When you move the cursor on each content, you can see more deailed mutation information on the Tooltip. Those are primary_site,primary_histology,mutation(aa),pubmedID. |
| GRCh37 position | Mutation(aa) | Unique sampleID count |
| chr9:35805667-35805667 | p.K683Q | 9 |
| chr9:35802269-35802269 | p.E567K | 3 |
| chr9:35808513-35808513 | p.T907M | 3 |
| chr9:35809413-35809413 | p.E1039Q | 3 |
| chr9:35802771-35802771 | p.R620C | 3 |
| chr9:35807326-35807326 | p.? | 3 |
| chr9:35792534-35792534 | p.P43P | 2 |
| chr9:35809392-35809392 | p.R1032* | 2 |
| chr9:35802590-35802590 | p.R601C | 2 |
| chr9:35800819-35800819 | p.D444D | 2 |
| Top |
|
 |
| Point Mutation/ Tissue ID | 1 | 2 | 3 | 4 | 5 | 6 | 7 | 8 | 9 | 10 | 11 | 12 | 13 | 14 | 15 | 16 | 17 | 18 | 19 | 20 |
| # sample | 3 | 3 | 18 | 1 | 5 | 2 | 7 | 3 | 2 | 1 | 14 | 15 | 14 | |||||||
| # mutation | 5 | 3 | 20 | 1 | 5 | 2 | 10 | 4 | 2 | 1 | 18 | 16 | 16 | |||||||
| nonsynonymous SNV | 3 | 2 | 14 | 5 | 1 | 3 | 4 | 2 | 1 | 13 | 10 | 12 | ||||||||
| synonymous SNV | 2 | 1 | 6 | 1 | 1 | 7 | 5 | 6 | 4 |
| cf) Tissue ID; Tissue type (1; BLCA[Bladder Urothelial Carcinoma], 2; BRCA[Breast invasive carcinoma], 3; CESC[Cervical squamous cell carcinoma and endocervical adenocarcinoma], 4; COAD[Colon adenocarcinoma], 5; GBM[Glioblastoma multiforme], 6; Glioma Low Grade, 7; HNSC[Head and Neck squamous cell carcinoma], 8; KICH[Kidney Chromophobe], 9; KIRC[Kidney renal clear cell carcinoma], 10; KIRP[Kidney renal papillary cell carcinoma], 11; LAML[Acute Myeloid Leukemia], 12; LUAD[Lung adenocarcinoma], 13; LUSC[Lung squamous cell carcinoma], 14; OV[Ovarian serous cystadenocarcinoma ], 15; PAAD[Pancreatic adenocarcinoma], 16; PRAD[Prostate adenocarcinoma], 17; SKCM[Skin Cutaneous Melanoma], 18:STAD[Stomach adenocarcinoma], 19:THCA[Thyroid carcinoma], 20:UCEC[Uterine Corpus Endometrial Carcinoma]) |
| Top |
| * We represented just top 10 SNVs. When you move the cursor on each content, you can see more deailed mutation information on the Tooltip. Those are primary_site, primary_histology, mutation(aa), pubmedID. |
| Genomic Position | Mutation(aa) | Unique sampleID count |
| chr9:35792877 | p.R745W | 2 |
| chr9:35792411 | p.A2A | 2 |
| chr9:35807348 | p.R557H | 2 |
| chr9:35802240 | p.G158W | 2 |
| chr9:35806091 | p.L889M | 2 |
| chr9:35793935 | p.R218Q | 1 |
| chr9:35801716 | p.Q353P | 1 |
| chr9:35808587 | p.E486K | 1 |
| chr9:35799693 | p.R620H | 1 |
| chr9:35802590 | p.I896T | 1 |
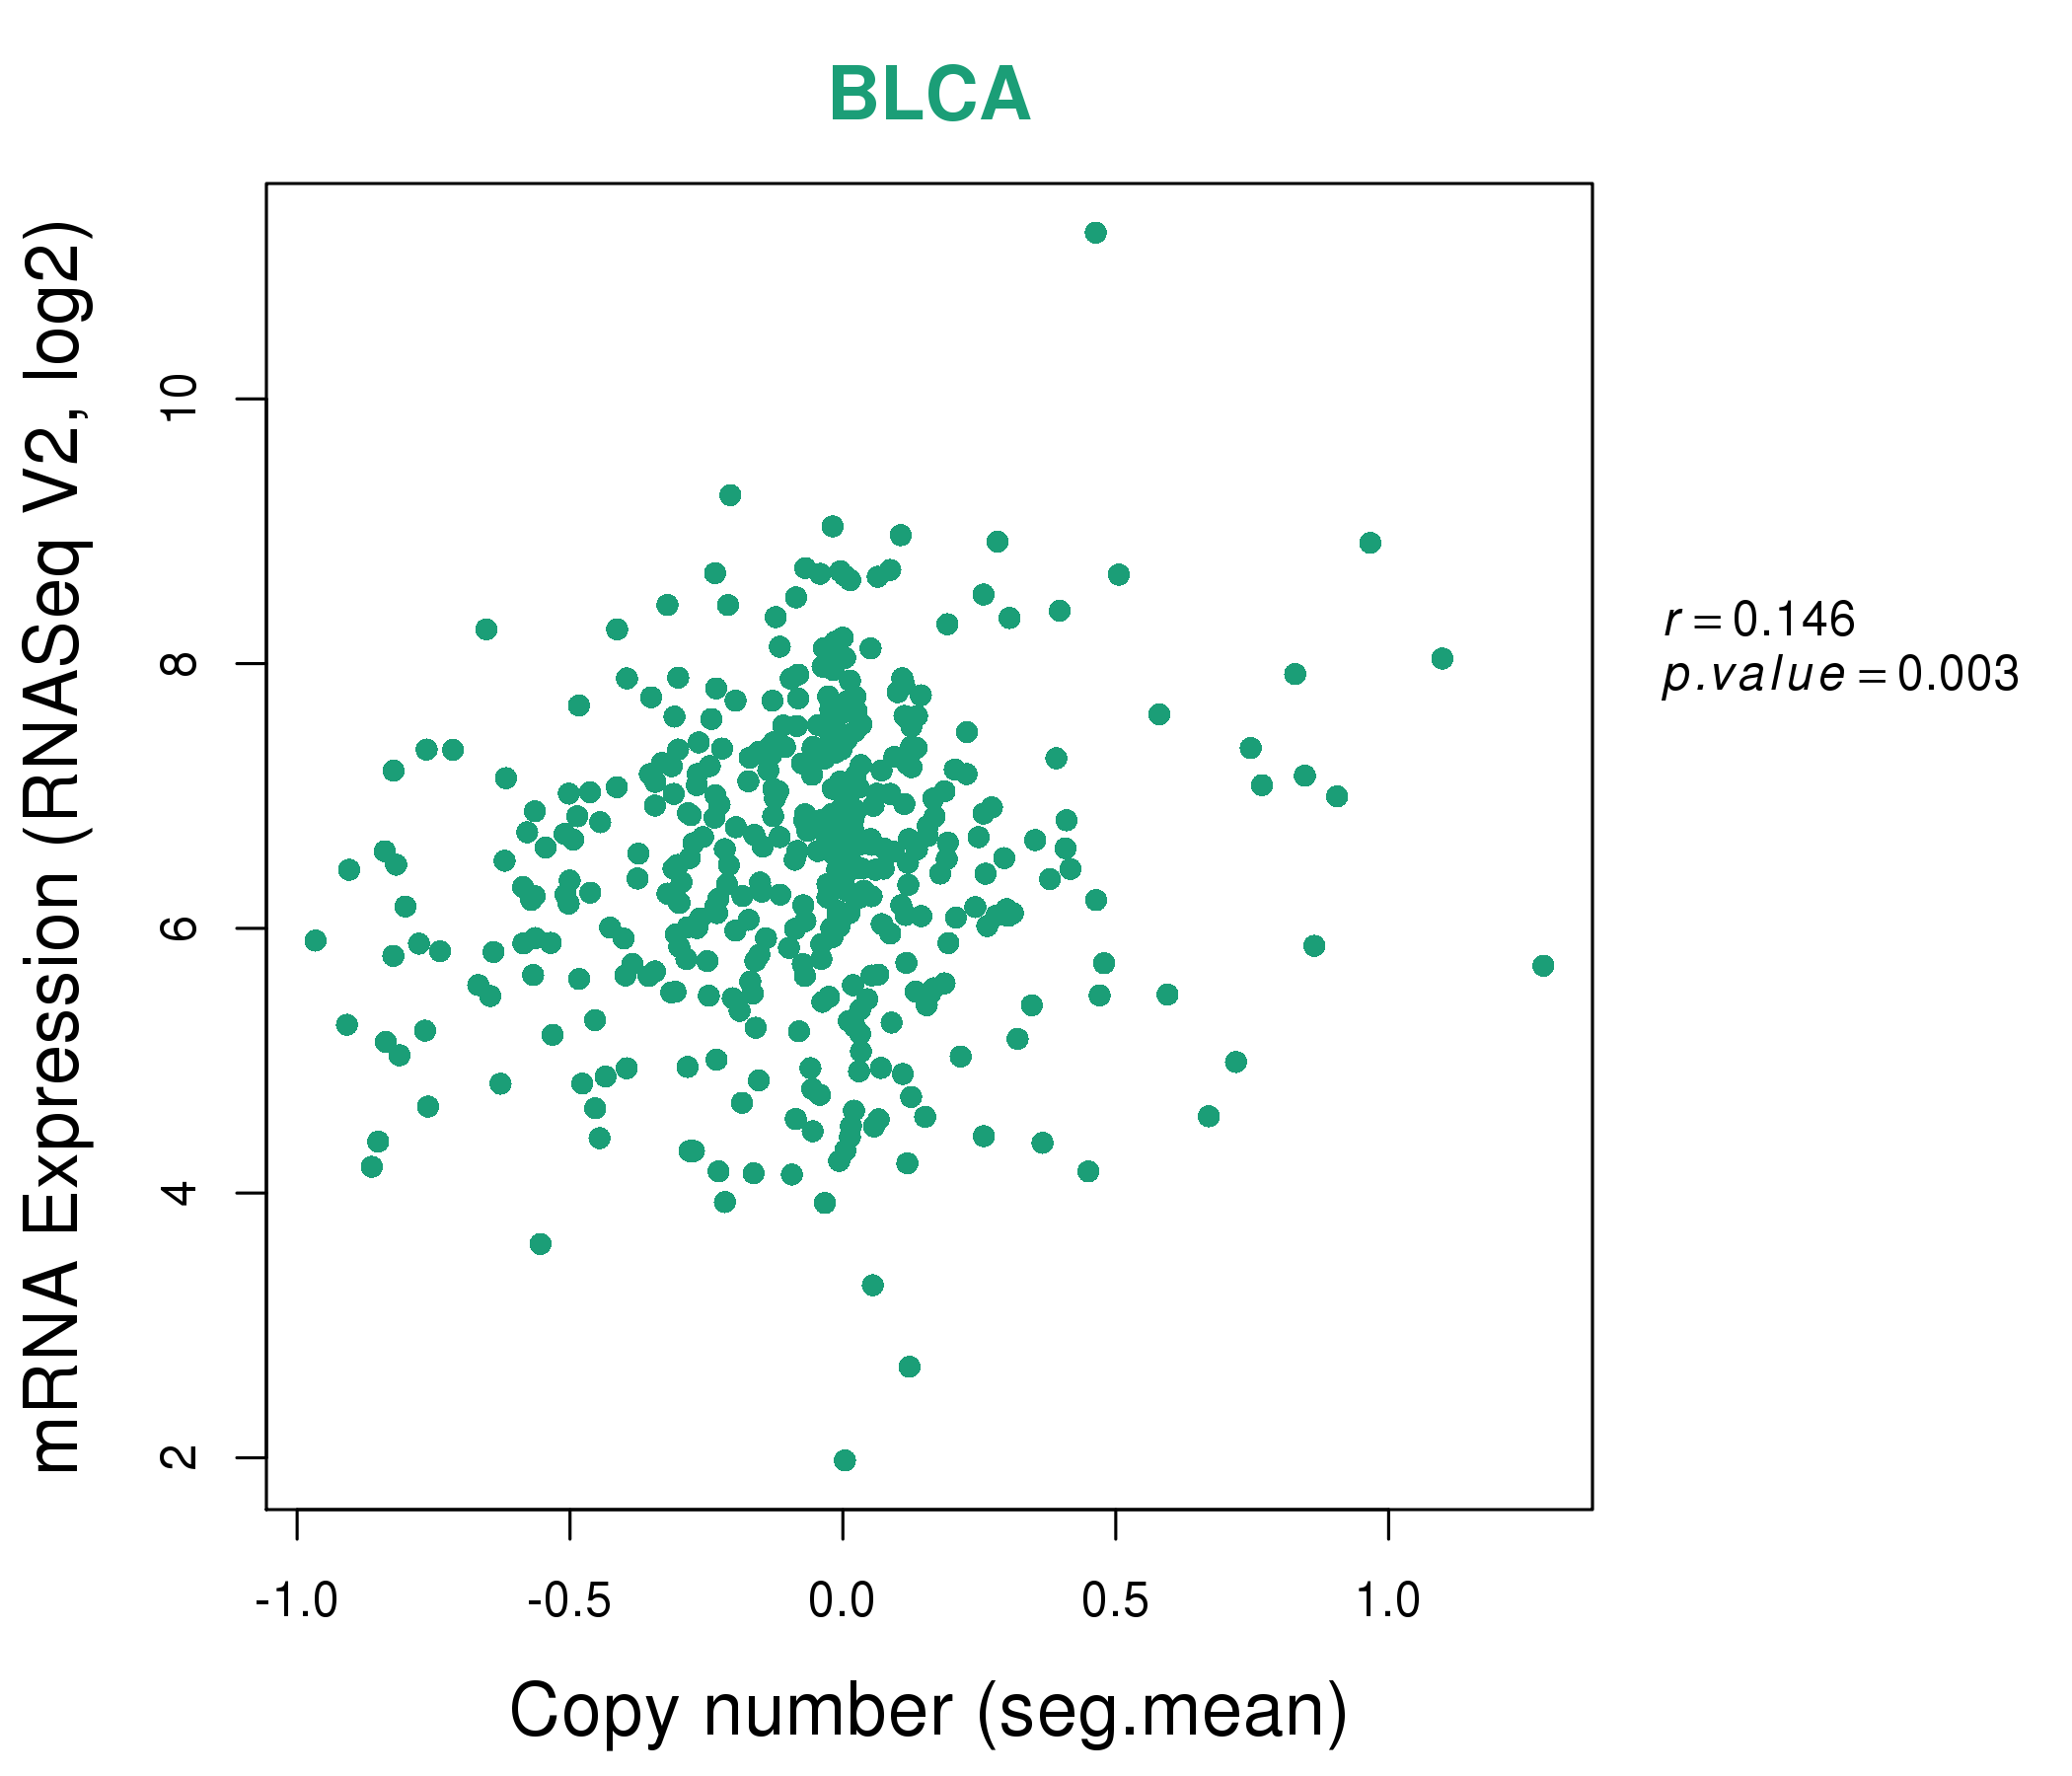
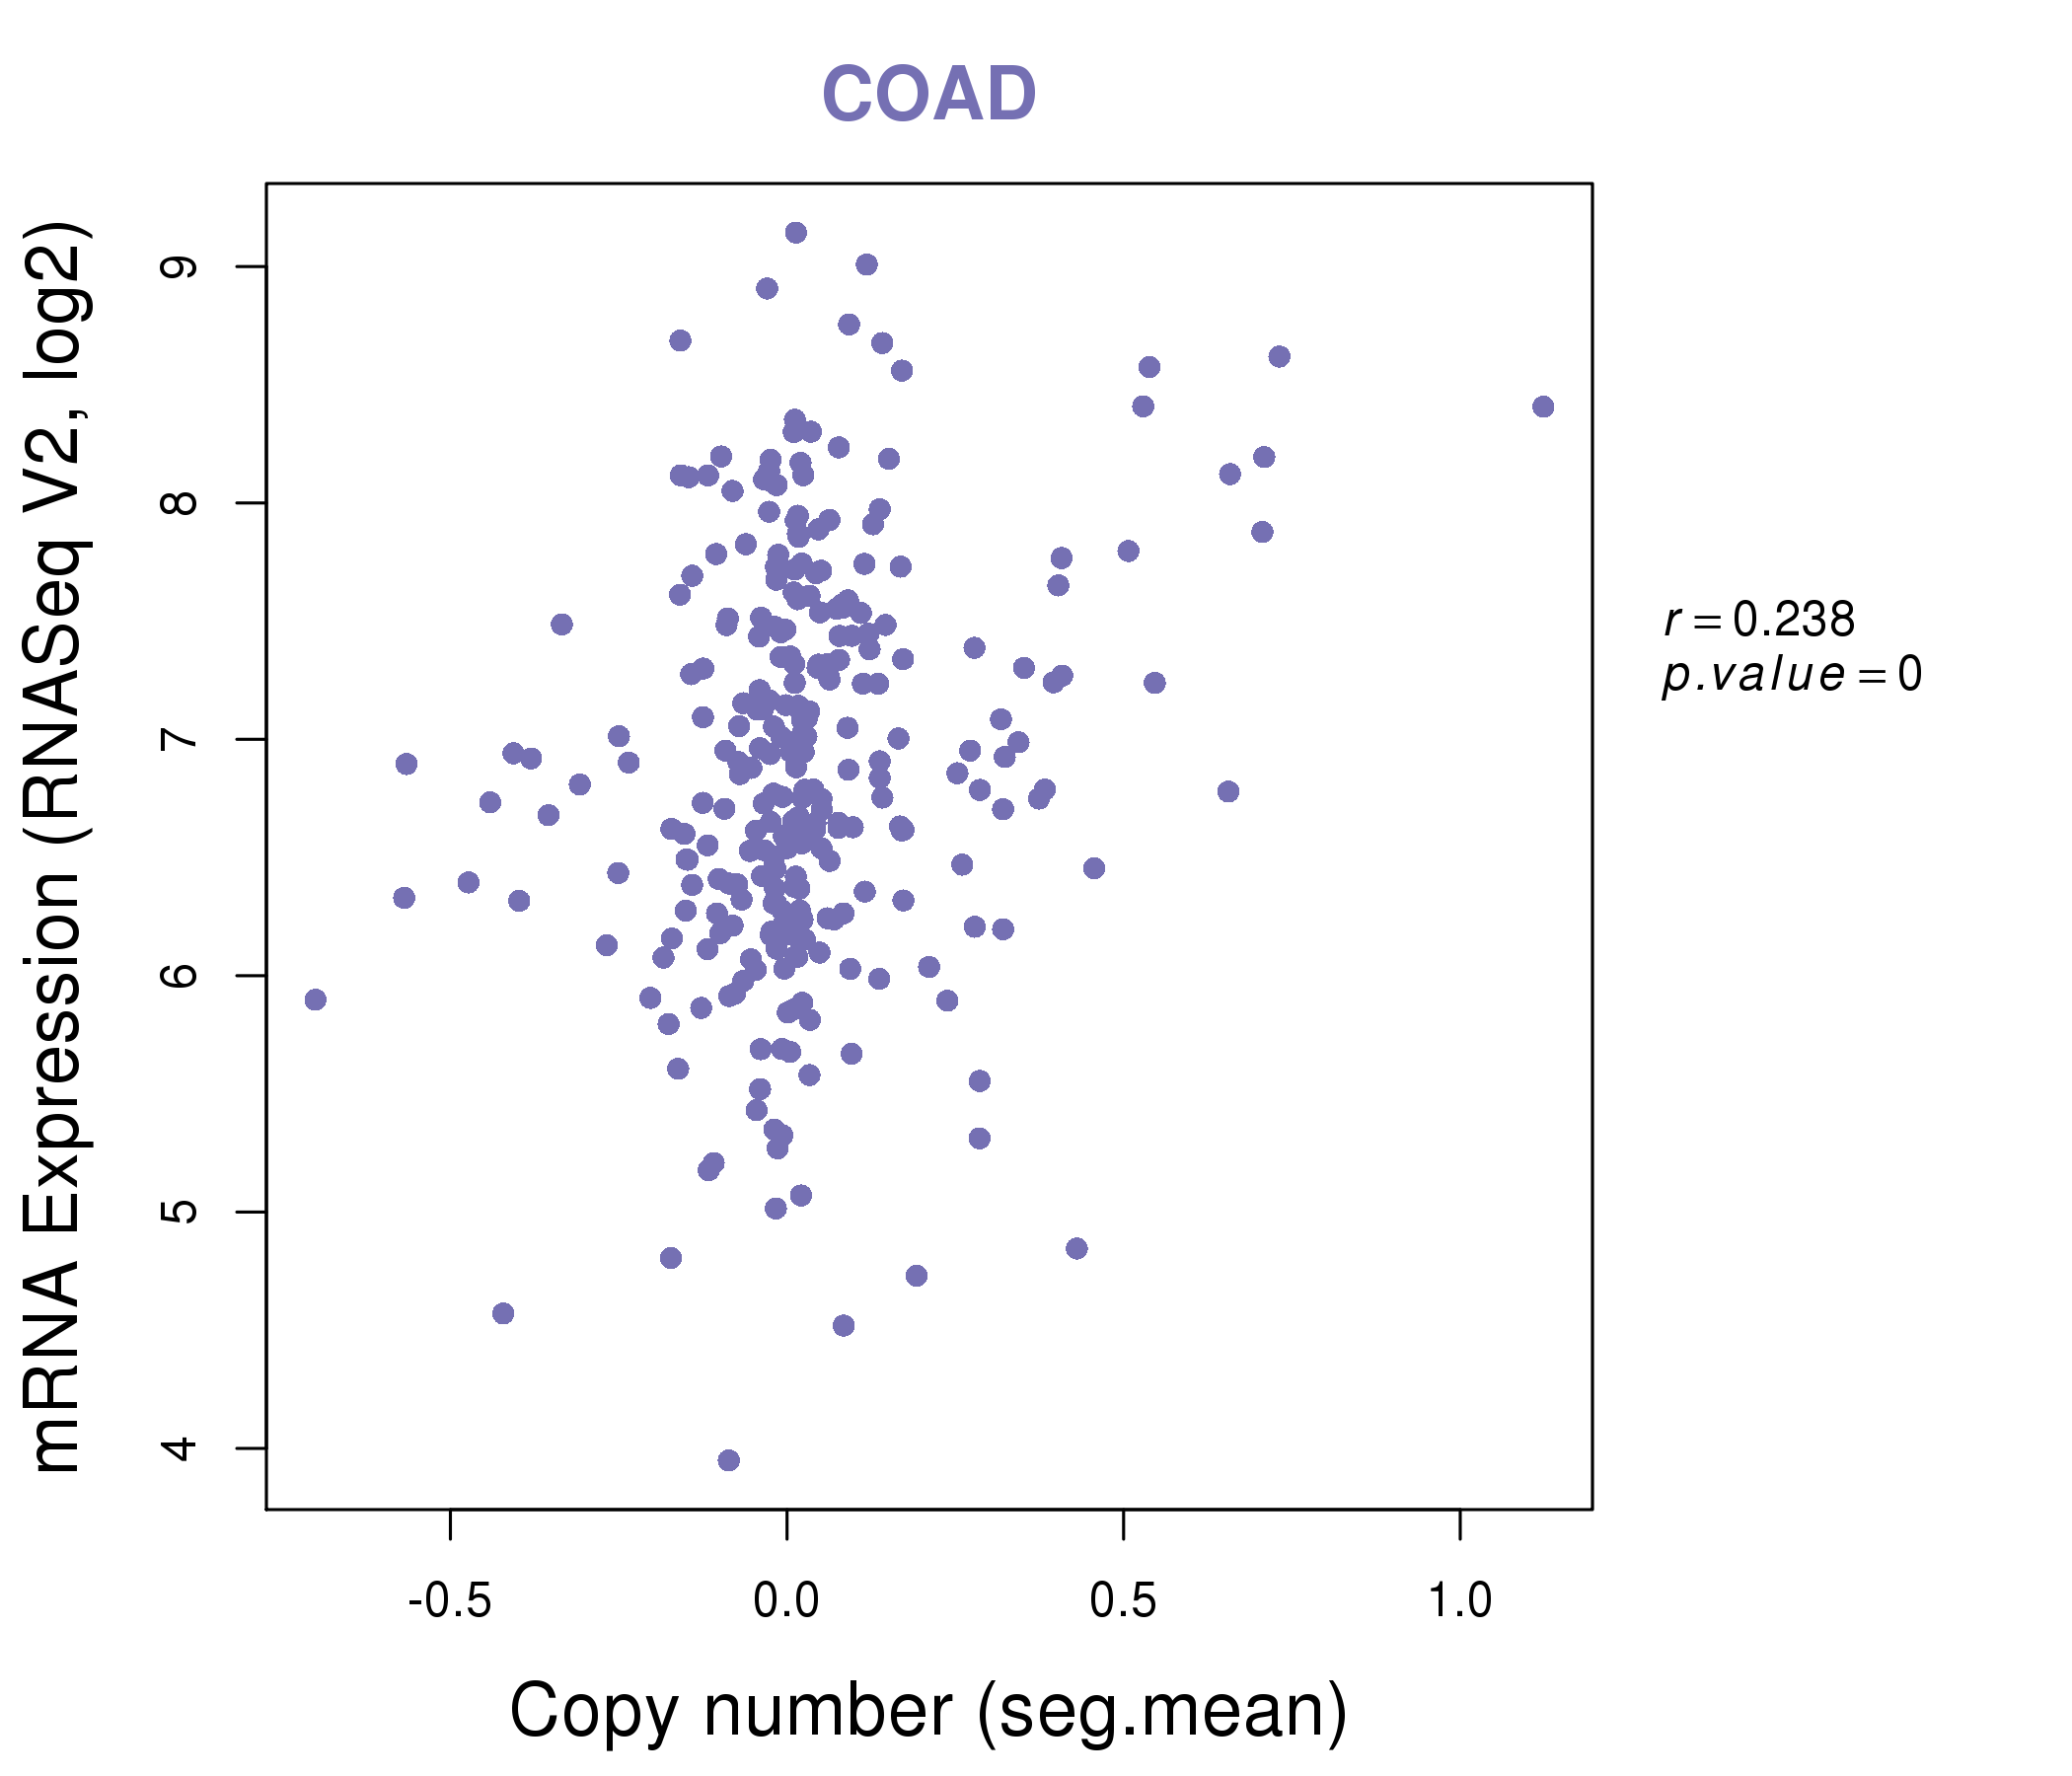
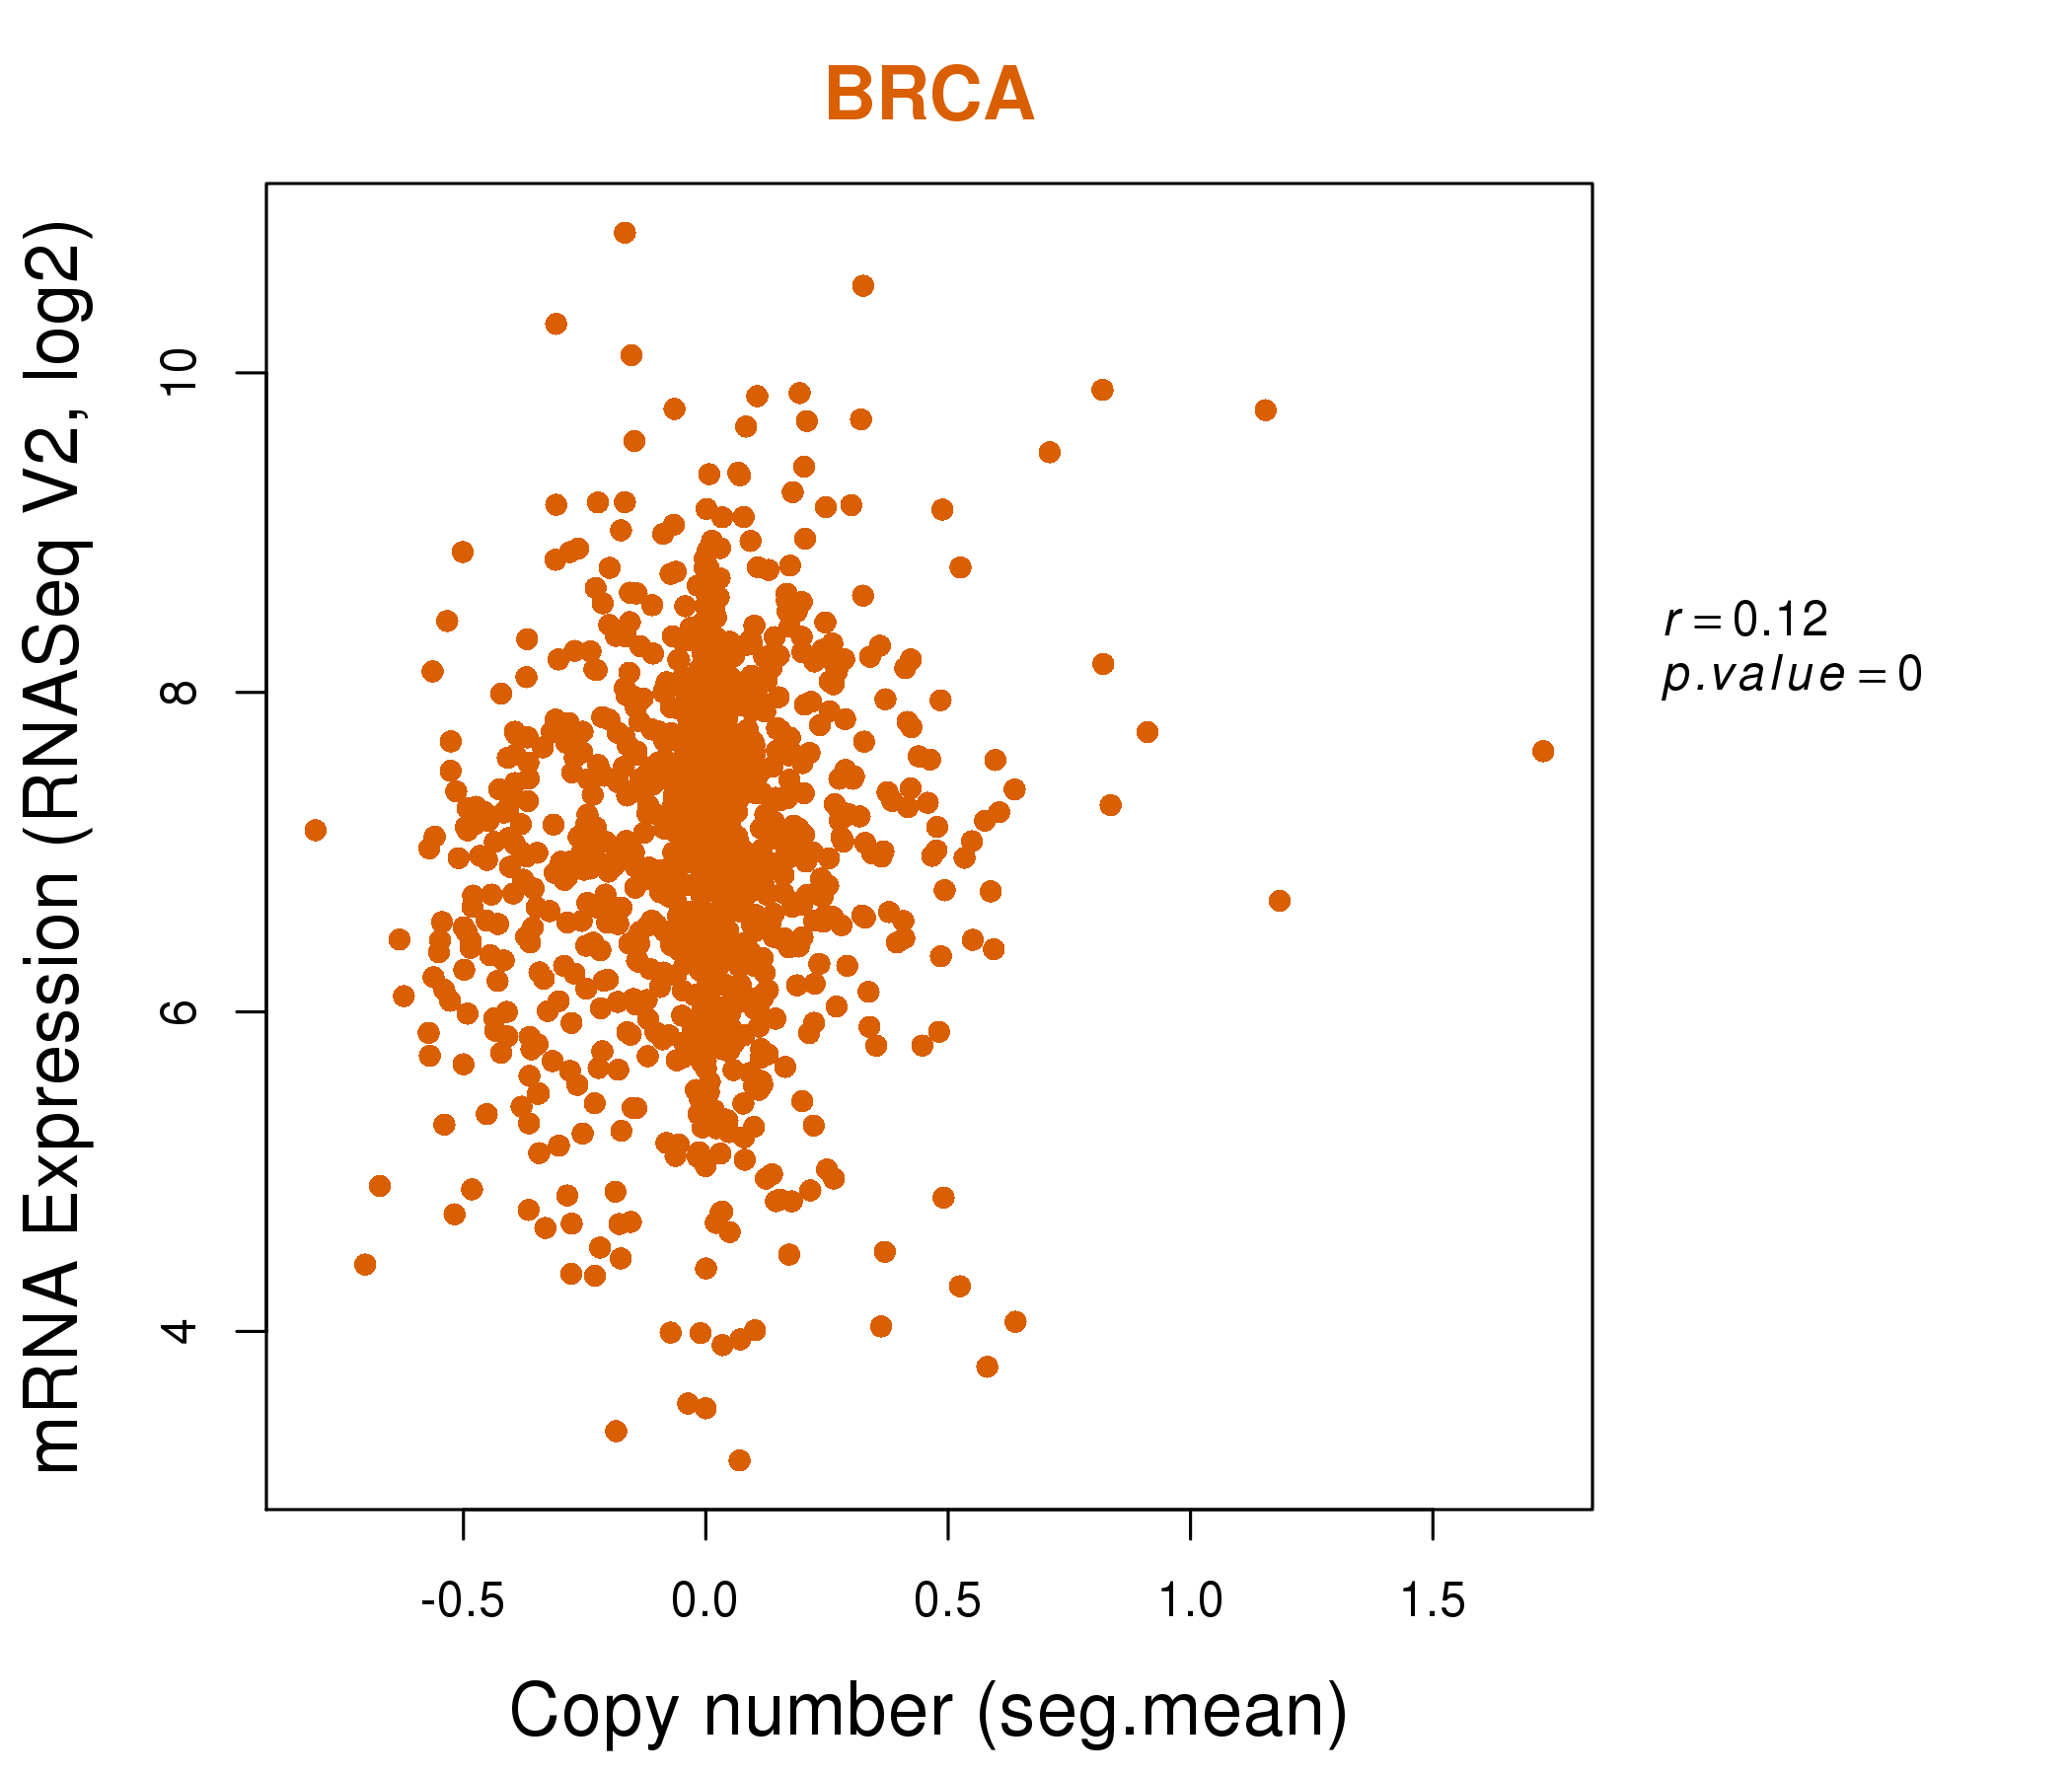
| * Copy number data were extracted from TCGA using R package TCGA-Assembler. The URLs of all public data files on TCGA DCC data server were gathered on Jan-05-2015. Function ProcessCNAData in TCGA-Assembler package was used to obtain gene-level copy number value which is calculated as the average copy number of the genomic region of a gene. |
 |
| cf) Tissue ID[Tissue type]: BLCA[Bladder Urothelial Carcinoma], BRCA[Breast invasive carcinoma], CESC[Cervical squamous cell carcinoma and endocervical adenocarcinoma], COAD[Colon adenocarcinoma], GBM[Glioblastoma multiforme], Glioma Low Grade, HNSC[Head and Neck squamous cell carcinoma], KICH[Kidney Chromophobe], KIRC[Kidney renal clear cell carcinoma], KIRP[Kidney renal papillary cell carcinoma], LAML[Acute Myeloid Leukemia], LUAD[Lung adenocarcinoma], LUSC[Lung squamous cell carcinoma], OV[Ovarian serous cystadenocarcinoma ], PAAD[Pancreatic adenocarcinoma], PRAD[Prostate adenocarcinoma], SKCM[Skin Cutaneous Melanoma], STAD[Stomach adenocarcinoma], THCA[Thyroid carcinoma], UCEC[Uterine Corpus Endometrial Carcinoma] |
| Top |
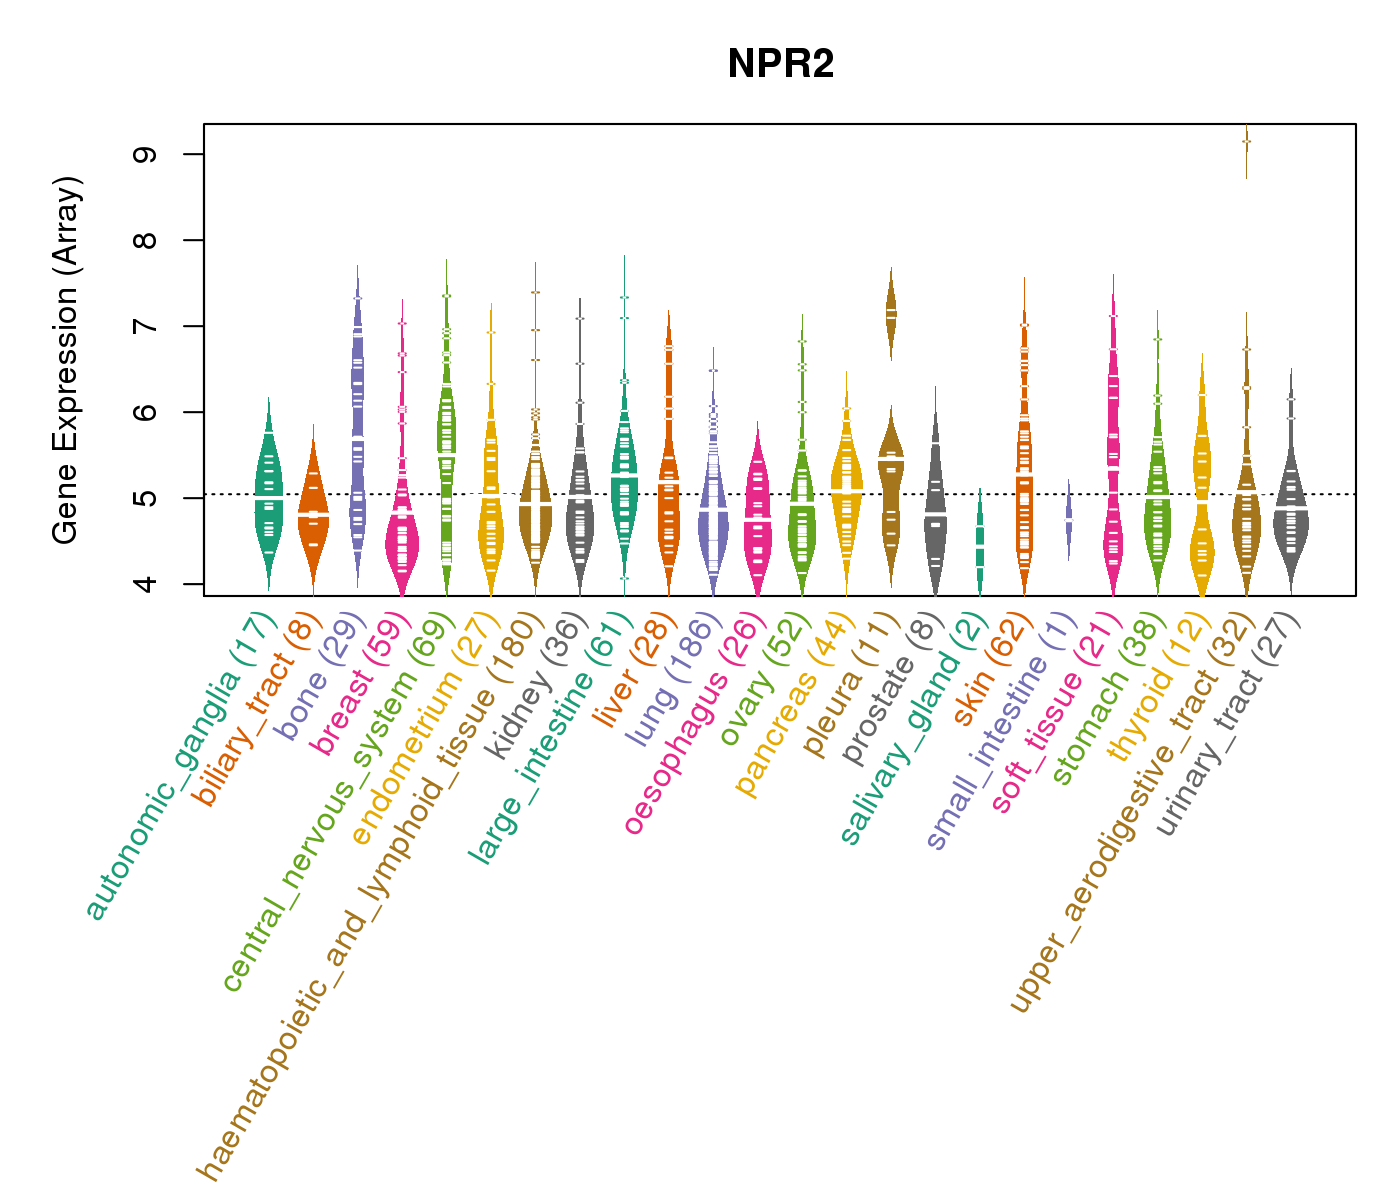
| Gene Expression for NPR2 |
| * CCLE gene expression data were extracted from CCLE_Expression_Entrez_2012-10-18.res: Gene-centric RMA-normalized mRNA expression data. |
 |
| * Normalized gene expression data of RNASeqV2 was extracted from TCGA using R package TCGA-Assembler. The URLs of all public data files on TCGA DCC data server were gathered at Jan-05-2015. Only eight cancer types have enough normal control samples for differential expression analysis. (t test, adjusted p<0.05 (using Benjamini-Hochberg FDR)) |
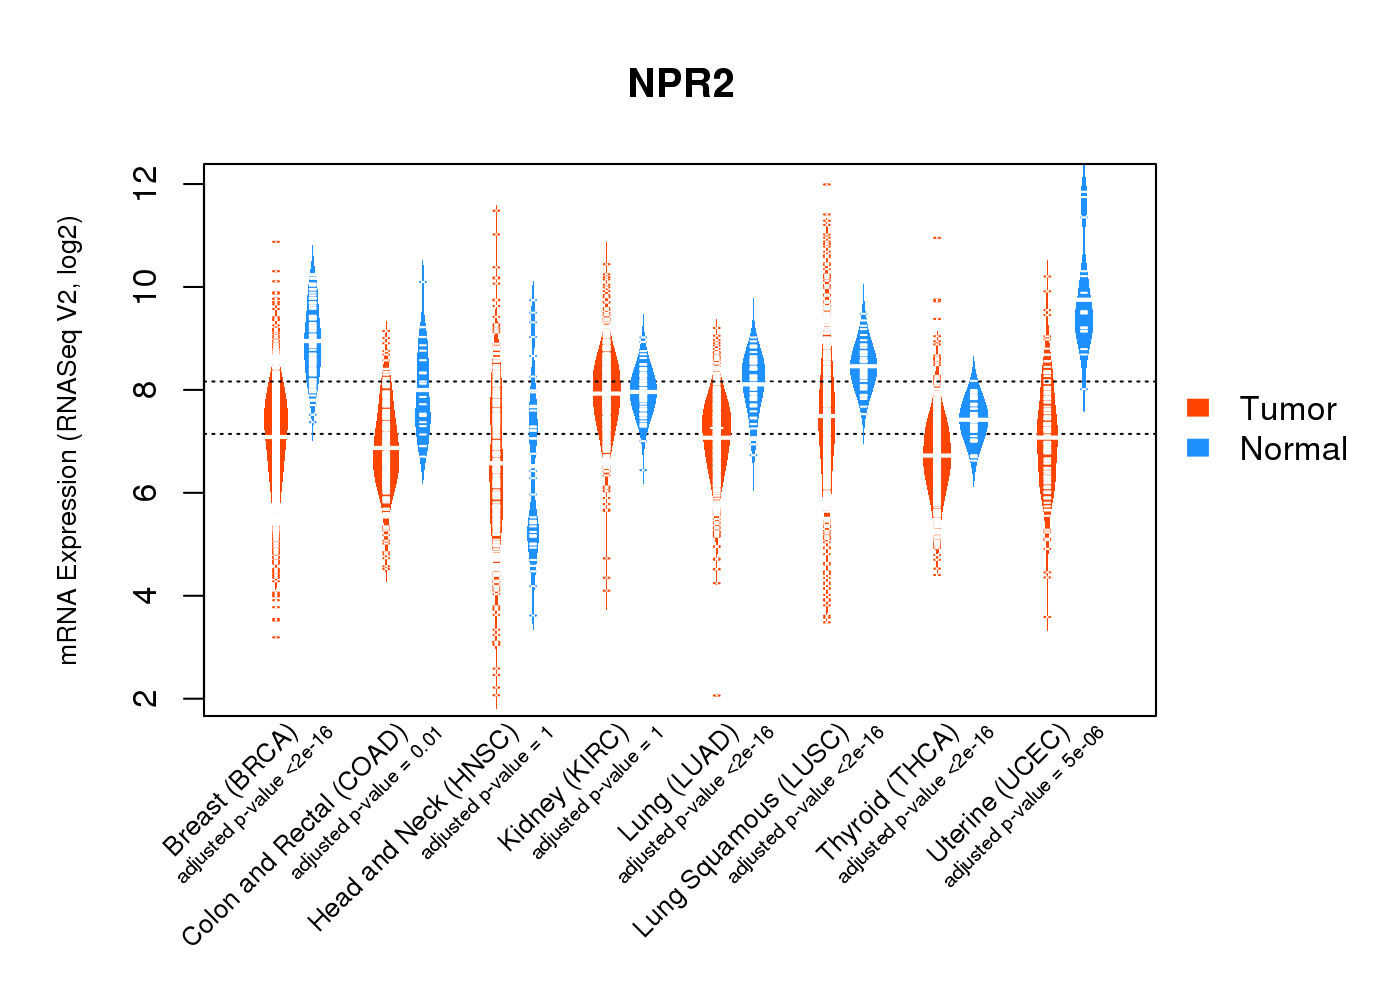 |
| Top |
| * This plots show the correlation between CNV and gene expression. |
: Open all plots for all cancer types
 |
|
 |
|

| Top |
| Gene-Gene Network Information |
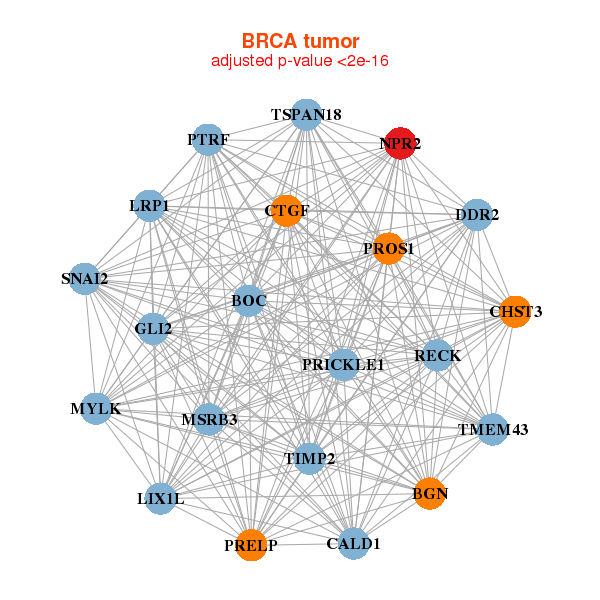
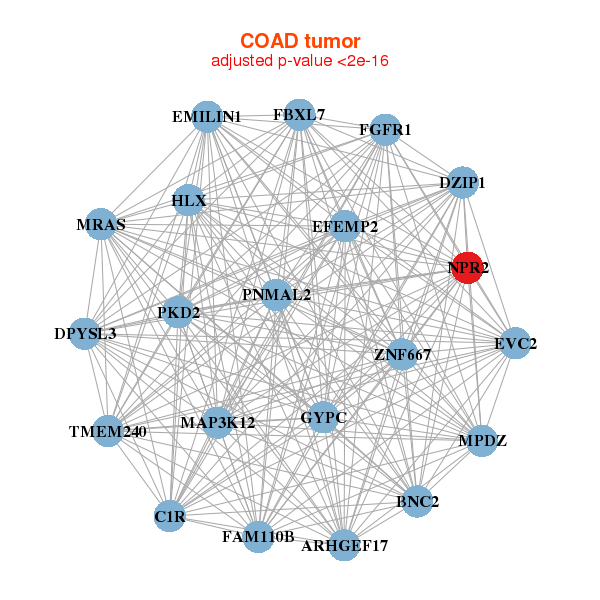
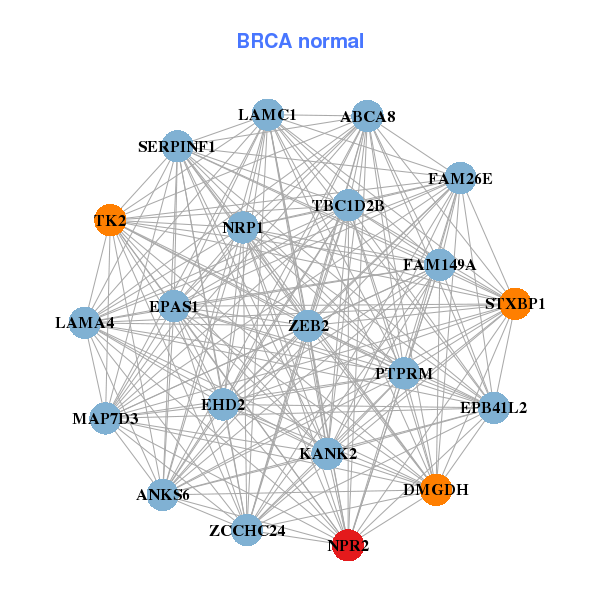
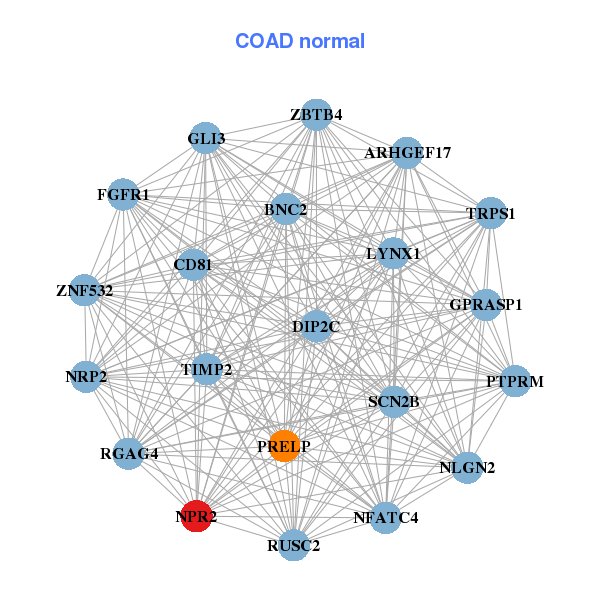
| * Co-Expression network figures were drawn using R package igraph. Only the top 20 genes with the highest correlations were shown. Red circle: input gene, orange circle: cell metabolism gene, sky circle: other gene |
: Open all plots for all cancer types
 |
|
| BGN,BOC,CALD1,CHST3,CTGF,DDR2,GLI2, LIX1L,LRP1,MSRB3,MYLK,NPR2,PRELP,PRICKLE1, PROS1,PTRF,RECK,SNAI2,TIMP2,TMEM43,TSPAN18 | ABCA8,ANKS6,DMGDH,EHD2,EPAS1,EPB41L2,FAM149A, FAM26E,KANK2,LAMA4,LAMC1,MAP7D3,NPR2,NRP1, PTPRM,SERPINF1,STXBP1,TBC1D2B,TK2,ZCCHC24,ZEB2 |
 |
|
| ARHGEF17,BNC2,TMEM240,C1R,DPYSL3,DZIP1,EFEMP2, EMILIN1,EVC2,FAM110B,FBXL7,FGFR1,GYPC,HLX, MAP3K12,MPDZ,MRAS,NPR2,PKD2,PNMAL2,ZNF667 | ARHGEF17,BNC2,CD81,DIP2C,FGFR1,GLI3,GPRASP1, LYNX1,NFATC4,NLGN2,NPR2,NRP2,PRELP,PTPRM, RGAG4,RUSC2,SCN2B,TIMP2,TRPS1,ZBTB4,ZNF532 |
| * Co-Expression network figures were drawn using R package igraph. Only the top 20 genes with the highest correlations were shown. Red circle: input gene, orange circle: cell metabolism gene, sky circle: other gene |
: Open all plots for all cancer types
| Top |
: Open all interacting genes' information including KEGG pathway for all interacting genes from DAVID
| Top |
| Pharmacological Information for NPR2 |
| There's no related Drug. |
| Top |
| Cross referenced IDs for NPR2 |
| * We obtained these cross-references from Uniprot database. It covers 150 different DBs, 18 categories. http://www.uniprot.org/help/cross_references_section |
: Open all cross reference information
|
Copyright © 2016-Present - The Univsersity of Texas Health Science Center at Houston @ |