|
||||||||||||||||||||||||||||||||||||||||||||||||||||||||||||||||||||||||||||||||||||||||||||||||||||||||||||||||||||||||||||||||||||||||||||||||||||||||||||||||||||||||||||||||||||||||||||||||||||||||||||||||||||||||||||||||||||||||||||||||||||||||||||||||||||||||||||||||||||||||||||||||||||||||||||||||||||||||||
| |
| Phenotypic Information (metabolism pathway, cancer, disease, phenome) |
| |
| |
| Gene-Gene Network Information: Co-Expression Network, Interacting Genes & KEGG |
| |
|


| Gene Summary for NUP88 |
| Top |
| Phenotypic Information for NUP88(metabolism pathway, cancer, disease, phenome) |
| Cancer | CGAP: NUP88 |
| Familial Cancer Database: NUP88 | |
| * This gene is included in those cancer gene databases. |
|
|
|
|
|
| . | ||||||||||||||||||||||||||||||||||||||||||||||||||||||||||||||||||||||||||||||||||||||||||||||||||||||||||||||||||||||||||||||||||||||||||||||||||||||||||||||||||||||||||||||||||||||||||||||||||||||||||||||||||||||||||||||||||||||||||||||||||||||||||||||||||||||||||||||||||||||||||||||||||||||||||||||||||||
Oncogene 1 | Significant driver gene in | |||||||||||||||||||||||||||||||||||||||||||||||||||||||||||||||||||||||||||||||||||||||||||||||||||||||||||||||||||||||||||||||||||||||||||||||||||||||||||||||||||||||||||||||||||||||||||||||||||||||||||||||||||||||||||||||||||||||||||||||||||||||||||||||||||||||||||||||||||||||||||||||||||||||||||||||||||||||||
| cf) number; DB name 1 Oncogene; http://nar.oxfordjournals.org/content/35/suppl_1/D721.long, 2 Tumor Suppressor gene; https://bioinfo.uth.edu/TSGene/, 3 Cancer Gene Census; http://www.nature.com/nrc/journal/v4/n3/abs/nrc1299.html, 4 CancerGenes; http://nar.oxfordjournals.org/content/35/suppl_1/D721.long, 5 Network of Cancer Gene; http://ncg.kcl.ac.uk/index.php, 1Therapeutic Vulnerabilities in Cancer; http://cbio.mskcc.org/cancergenomics/statius/ |
| REACTOME_METABOLISM_OF_NON_CODING_RNA REACTOME_METABOLISM_OF_RNA REACTOME_METABOLISM_OF_CARBOHYDRATES | |
| OMIM | 602552; gene. |
| Orphanet | |
| Disease | KEGG Disease: NUP88 |
| MedGen: NUP88 (Human Medical Genetics with Condition) | |
| ClinVar: NUP88 | |
| Phenotype | MGI: NUP88 (International Mouse Phenotyping Consortium) |
| PhenomicDB: NUP88 | |
| Mutations for NUP88 |
| * Under tables are showing count per each tissue to give us broad intuition about tissue specific mutation patterns.You can go to the detailed page for each mutation database's web site. |
| There's no structural variation information in COSMIC data for this gene. |
| * From mRNA Sanger sequences, Chitars2.0 arranged chimeric transcripts. This table shows NUP88 related fusion information. |
| ID | Head Gene | Tail Gene | Accession | Gene_a | qStart_a | qEnd_a | Chromosome_a | tStart_a | tEnd_a | Gene_a | qStart_a | qEnd_a | Chromosome_a | tStart_a | tEnd_a |
| DA165761 | FRMD4B | 1 | 126 | 3 | 69268374 | 69268499 | NUP88 | 127 | 577 | 17 | 5319873 | 5322994 | |
| BE706779 | SF3B3 | 44 | 157 | 16 | 70582572 | 70582685 | NUP88 | 155 | 228 | 17 | 5319833 | 5319906 | |
| Top |
| Mutation type/ Tissue ID | brca | cns | cerv | endome | haematopo | kidn | Lintest | liver | lung | ns | ovary | pancre | prost | skin | stoma | thyro | urina | |||
| Total # sample | 1 | 1 | ||||||||||||||||||
| GAIN (# sample) | ||||||||||||||||||||
| LOSS (# sample) | 1 | 1 |
| cf) Tissue ID; Tissue type (1; Breast, 2; Central_nervous_system, 3; Cervix, 4; Endometrium, 5; Haematopoietic_and_lymphoid_tissue, 6; Kidney, 7; Large_intestine, 8; Liver, 9; Lung, 10; NS, 11; Ovary, 12; Pancreas, 13; Prostate, 14; Skin, 15; Stomach, 16; Thyroid, 17; Urinary_tract) |
| Top |
|
 |
| Top |
| Stat. for Non-Synonymous SNVs (# total SNVs=45) | (# total SNVs=14) |
 |  |
(# total SNVs=0) | (# total SNVs=0) |
| Top |
| * When you move the cursor on each content, you can see more deailed mutation information on the Tooltip. Those are primary_site,primary_histology,mutation(aa),pubmedID. |
| GRCh37 position | Mutation(aa) | Unique sampleID count |
| chr17:5294927-5294927 | p.M480V | 2 |
| chr17:5302963-5302963 | p.K400N | 2 |
| chr17:5322727-5322727 | p.R82C | 2 |
| chr17:5307457-5307457 | p.F385Y | 2 |
| chr17:5322741-5322741 | p.S77Y | 2 |
| chr17:5294966-5294966 | p.R467* | 2 |
| chr17:5289552-5289552 | p.D734H | 2 |
| chr17:5289580-5289580 | p.H724H | 2 |
| chr17:5290033-5290033 | p.K719K | 2 |
| chr17:5308488-5308488 | p.A311A | 2 |
| Top |
|
 |
| Point Mutation/ Tissue ID | 1 | 2 | 3 | 4 | 5 | 6 | 7 | 8 | 9 | 10 | 11 | 12 | 13 | 14 | 15 | 16 | 17 | 18 | 19 | 20 |
| # sample | 2 | 1 | 11 | 1 | 2 | 3 | 1 | 5 | 4 | 8 | 8 | |||||||||
| # mutation | 3 | 1 | 10 | 1 | 2 | 3 | 1 | 5 | 4 | 8 | 9 | |||||||||
| nonsynonymous SNV | 3 | 1 | 8 | 1 | 1 | 1 | 1 | 4 | 2 | 5 | 7 | |||||||||
| synonymous SNV | 2 | 1 | 2 | 1 | 2 | 3 | 2 |
| cf) Tissue ID; Tissue type (1; BLCA[Bladder Urothelial Carcinoma], 2; BRCA[Breast invasive carcinoma], 3; CESC[Cervical squamous cell carcinoma and endocervical adenocarcinoma], 4; COAD[Colon adenocarcinoma], 5; GBM[Glioblastoma multiforme], 6; Glioma Low Grade, 7; HNSC[Head and Neck squamous cell carcinoma], 8; KICH[Kidney Chromophobe], 9; KIRC[Kidney renal clear cell carcinoma], 10; KIRP[Kidney renal papillary cell carcinoma], 11; LAML[Acute Myeloid Leukemia], 12; LUAD[Lung adenocarcinoma], 13; LUSC[Lung squamous cell carcinoma], 14; OV[Ovarian serous cystadenocarcinoma ], 15; PAAD[Pancreatic adenocarcinoma], 16; PRAD[Prostate adenocarcinoma], 17; SKCM[Skin Cutaneous Melanoma], 18:STAD[Stomach adenocarcinoma], 19:THCA[Thyroid carcinoma], 20:UCEC[Uterine Corpus Endometrial Carcinoma]) |
| Top |
| * We represented just top 10 SNVs. When you move the cursor on each content, you can see more deailed mutation information on the Tooltip. Those are primary_site, primary_histology, mutation(aa), pubmedID. |
| Genomic Position | Mutation(aa) | Unique sampleID count |
| chr17:5289552 | p.D734N | 2 |
| chr17:5308516 | p.A302V | 2 |
| chr17:5308443 | p.A411S | 1 |
| chr17:5314095 | p.R203H | 1 |
| chr17:5294909 | p.A43V | 1 |
| chr17:5322749 | p.I735V | 1 |
| chr17:5308489 | p.F385S | 1 |
| chr17:5289549 | p.R203C | 1 |
| chr17:5314096 | p.Y364Y | 1 |
| chr17:5294939 | p.A177A | 1 |
| * Copy number data were extracted from TCGA using R package TCGA-Assembler. The URLs of all public data files on TCGA DCC data server were gathered on Jan-05-2015. Function ProcessCNAData in TCGA-Assembler package was used to obtain gene-level copy number value which is calculated as the average copy number of the genomic region of a gene. |
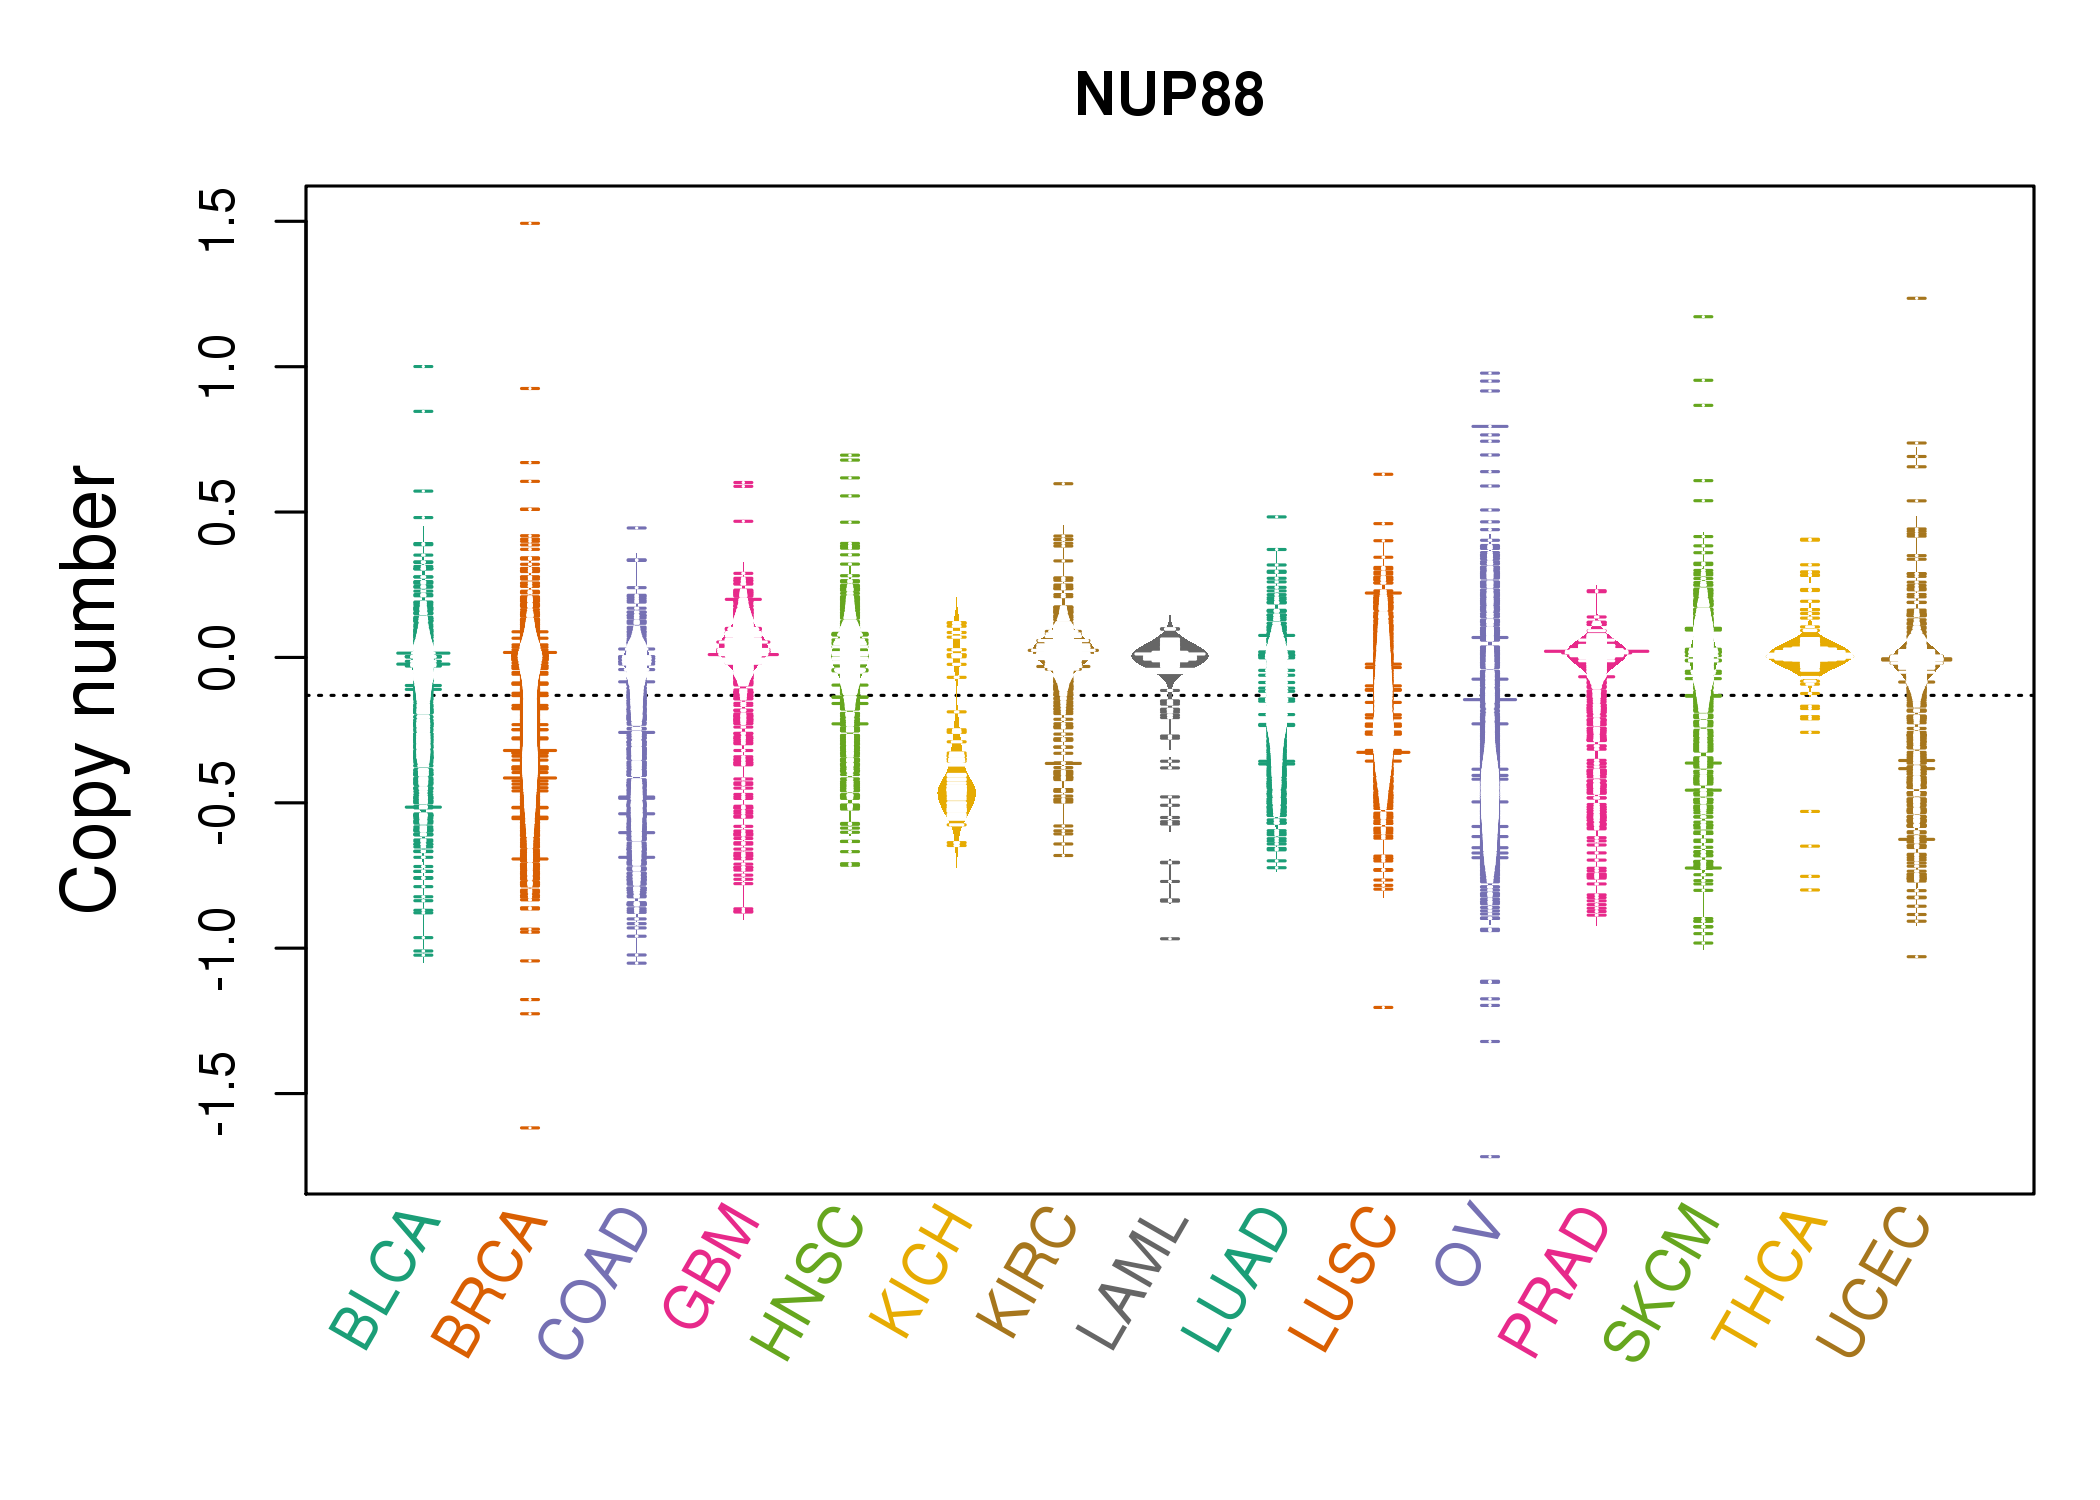 |
| cf) Tissue ID[Tissue type]: BLCA[Bladder Urothelial Carcinoma], BRCA[Breast invasive carcinoma], CESC[Cervical squamous cell carcinoma and endocervical adenocarcinoma], COAD[Colon adenocarcinoma], GBM[Glioblastoma multiforme], Glioma Low Grade, HNSC[Head and Neck squamous cell carcinoma], KICH[Kidney Chromophobe], KIRC[Kidney renal clear cell carcinoma], KIRP[Kidney renal papillary cell carcinoma], LAML[Acute Myeloid Leukemia], LUAD[Lung adenocarcinoma], LUSC[Lung squamous cell carcinoma], OV[Ovarian serous cystadenocarcinoma ], PAAD[Pancreatic adenocarcinoma], PRAD[Prostate adenocarcinoma], SKCM[Skin Cutaneous Melanoma], STAD[Stomach adenocarcinoma], THCA[Thyroid carcinoma], UCEC[Uterine Corpus Endometrial Carcinoma] |
| Top |
| Gene Expression for NUP88 |
| * CCLE gene expression data were extracted from CCLE_Expression_Entrez_2012-10-18.res: Gene-centric RMA-normalized mRNA expression data. |
 |
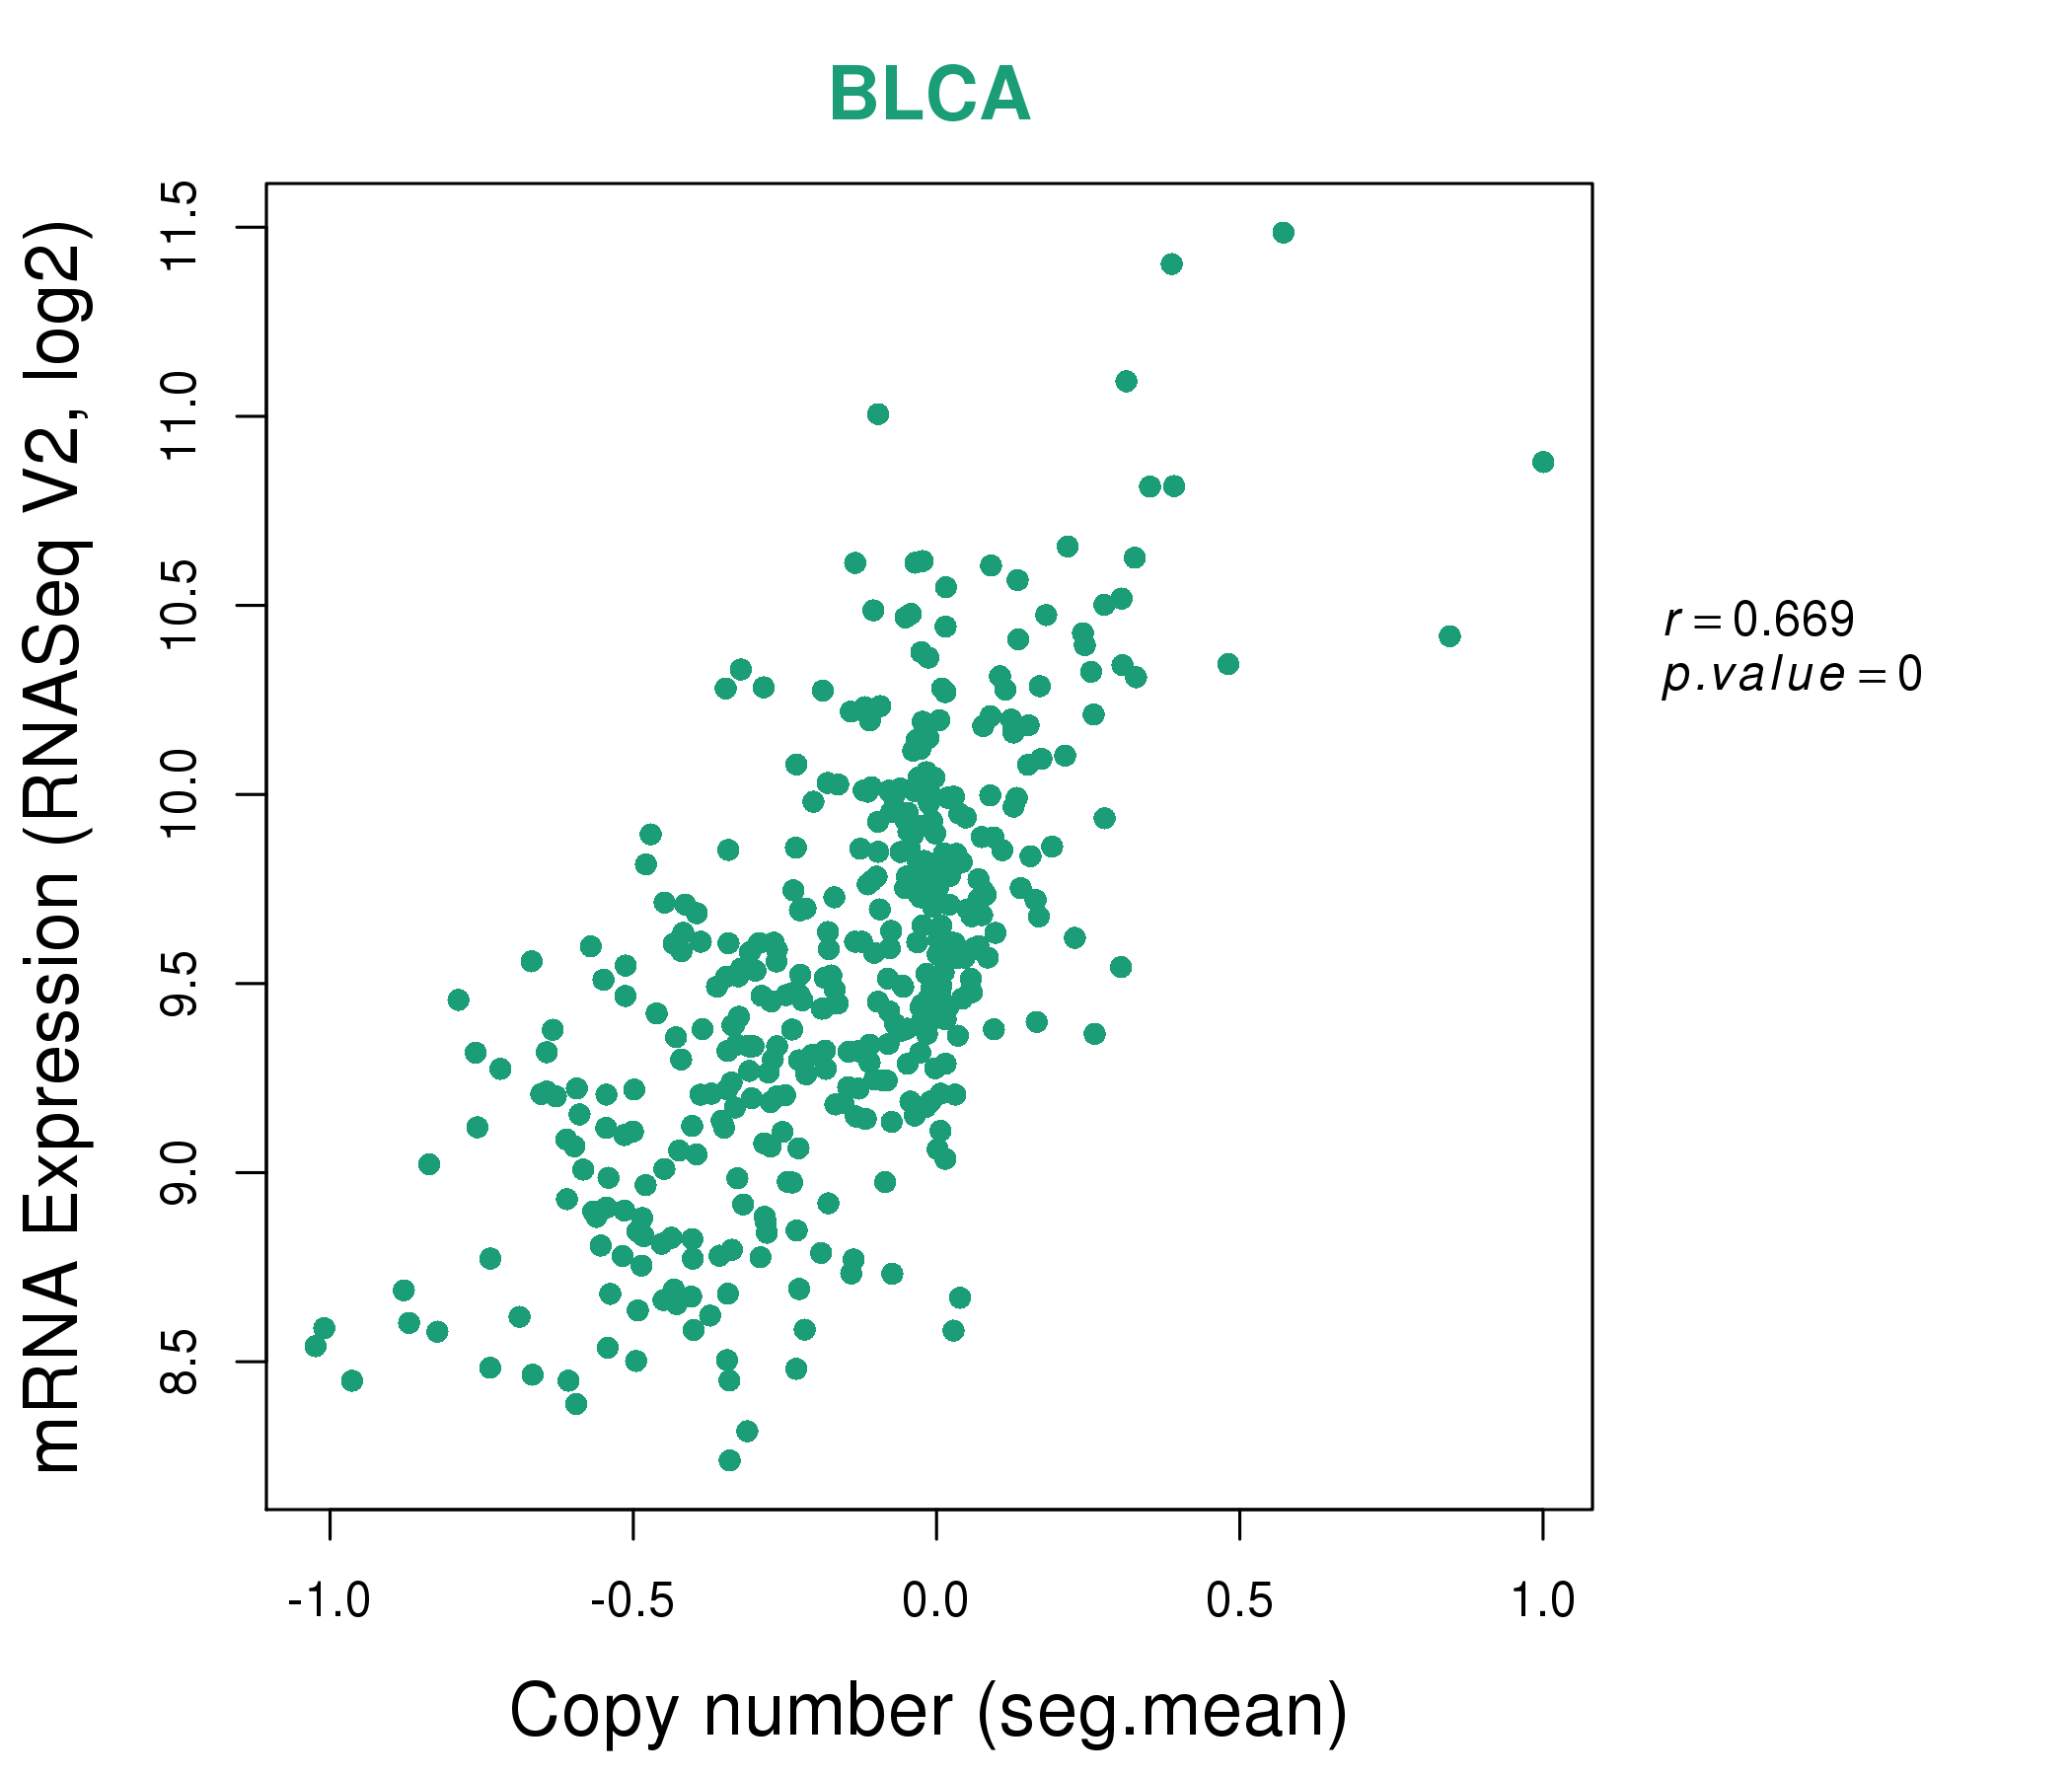
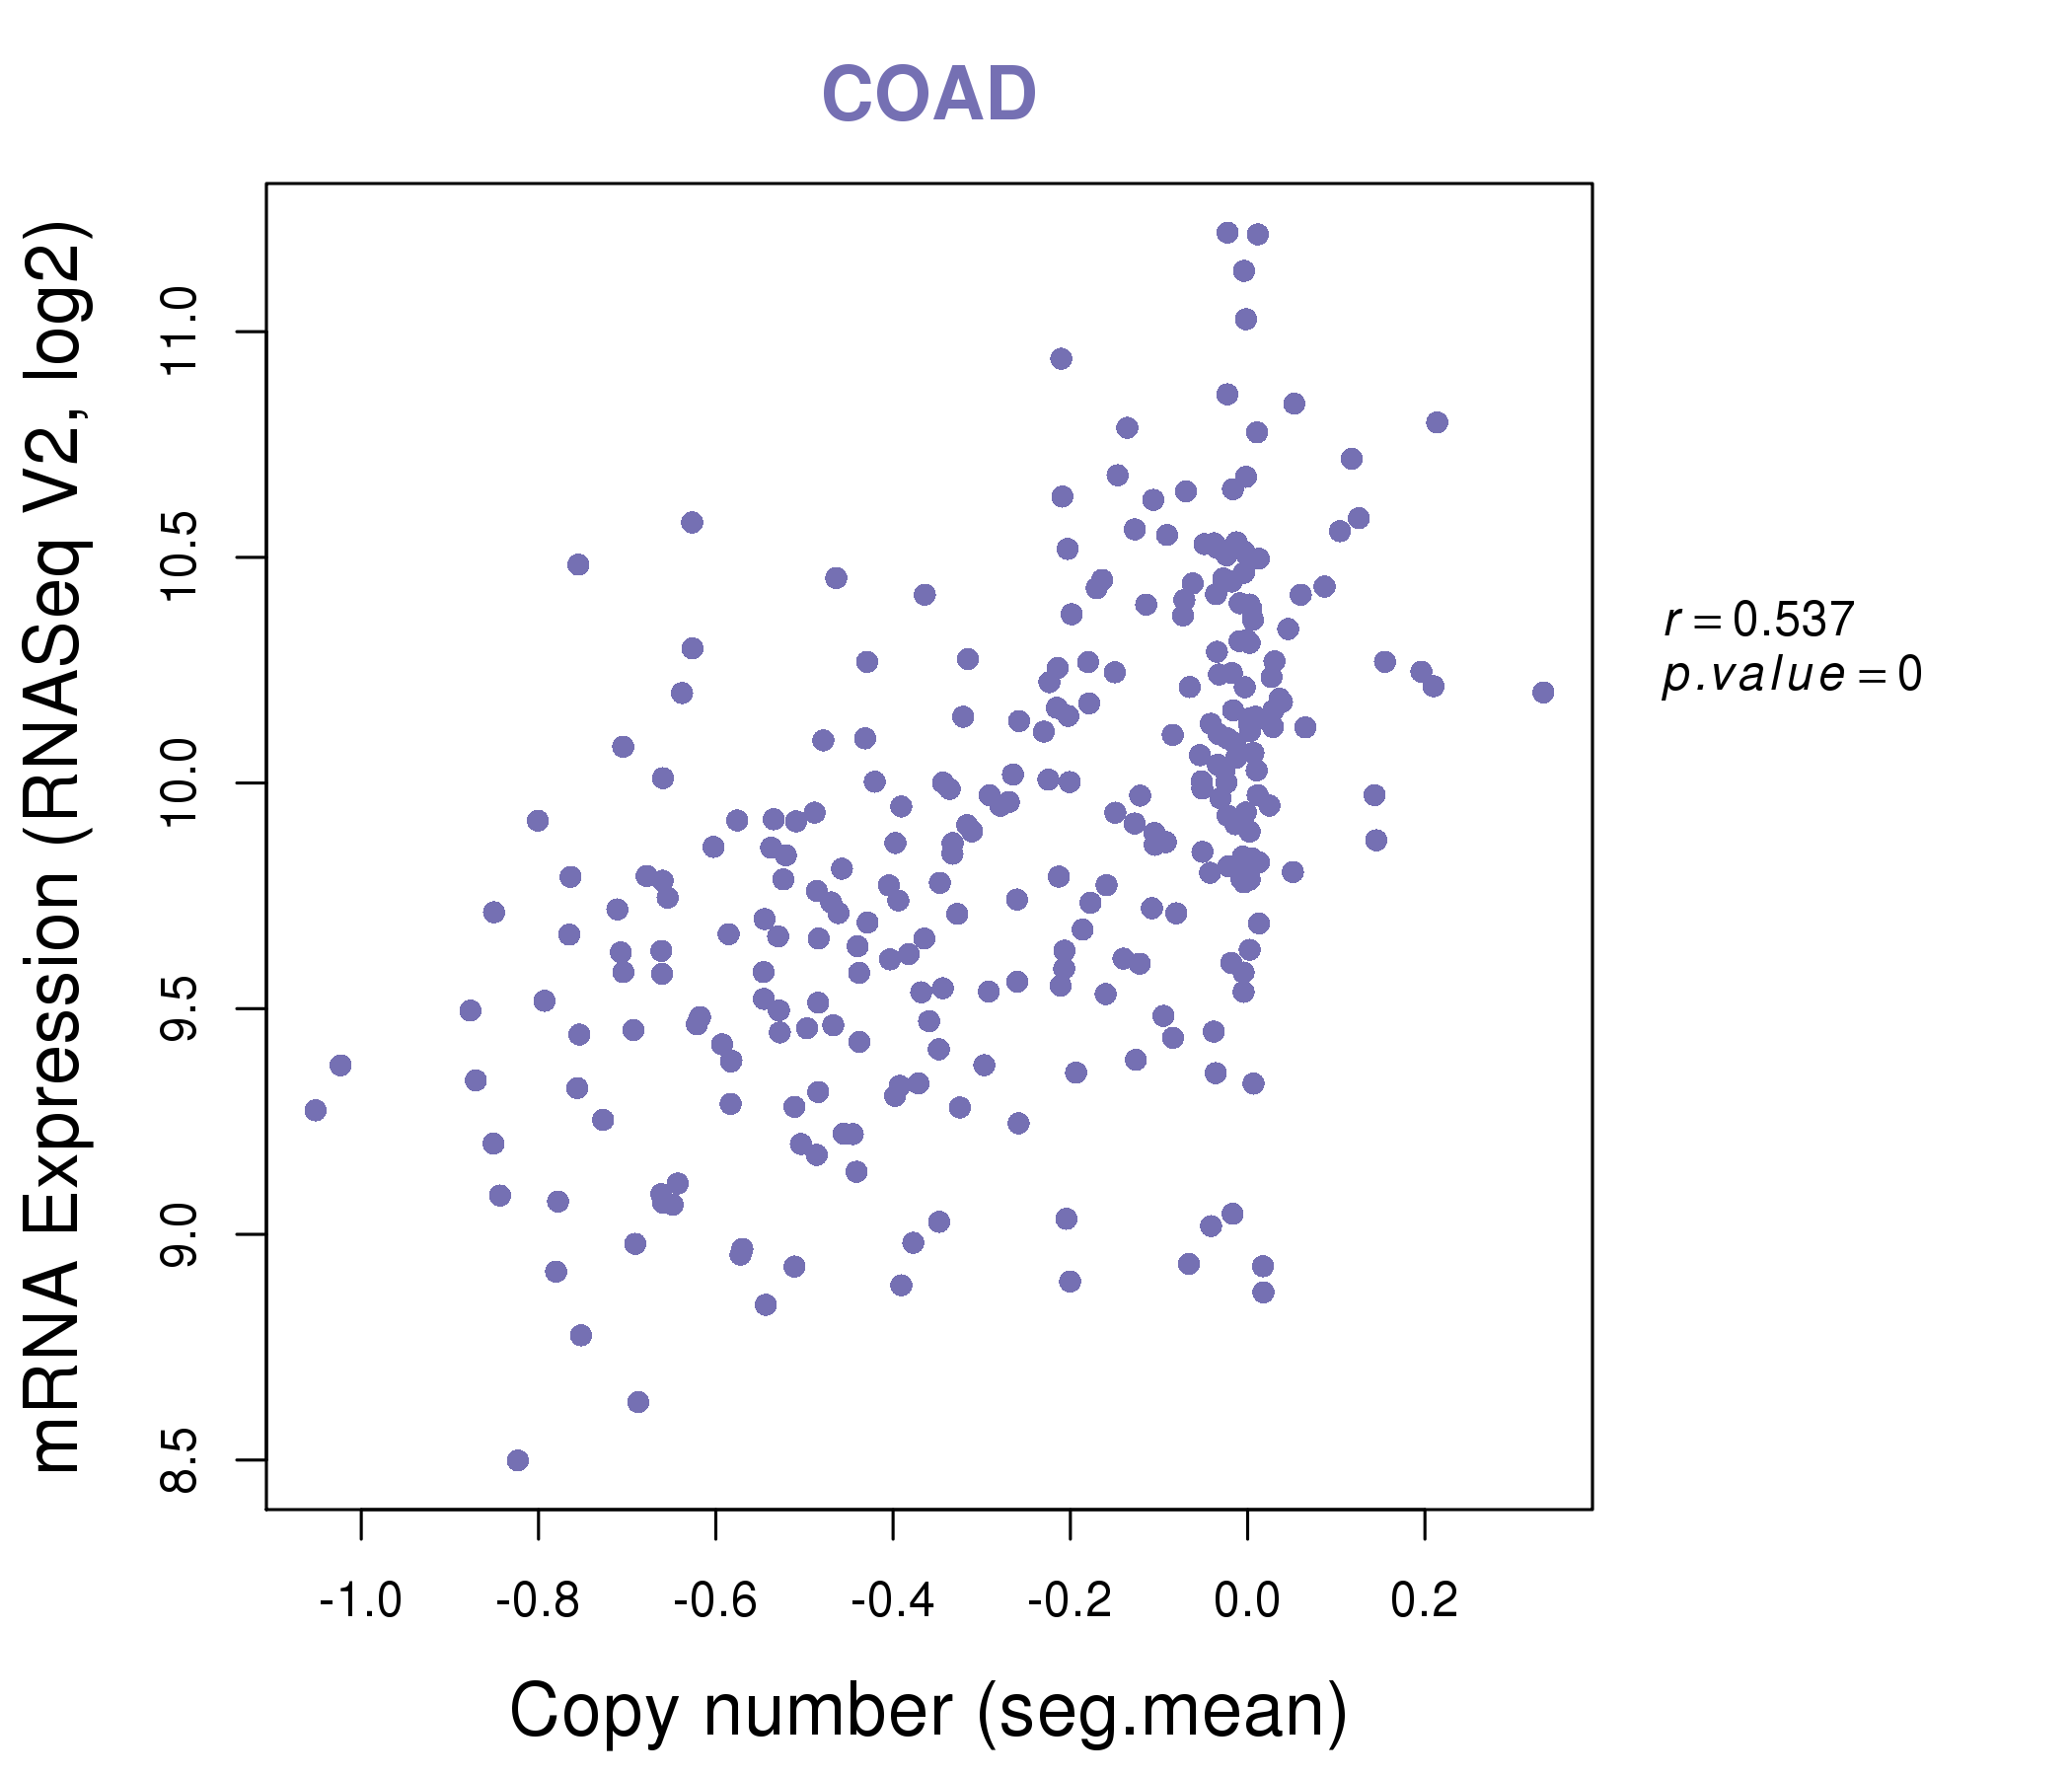
| * Normalized gene expression data of RNASeqV2 was extracted from TCGA using R package TCGA-Assembler. The URLs of all public data files on TCGA DCC data server were gathered at Jan-05-2015. Only eight cancer types have enough normal control samples for differential expression analysis. (t test, adjusted p<0.05 (using Benjamini-Hochberg FDR)) |
 |
| Top |
| * This plots show the correlation between CNV and gene expression. |
: Open all plots for all cancer types
 |
|
 |
|


| Top |
| Gene-Gene Network Information |
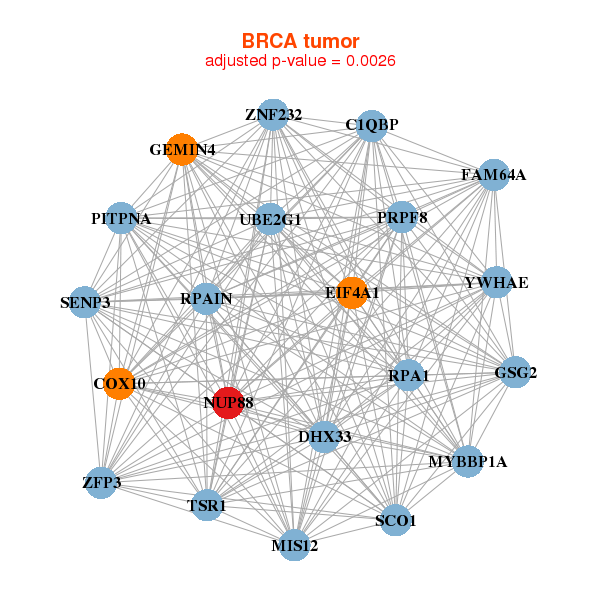
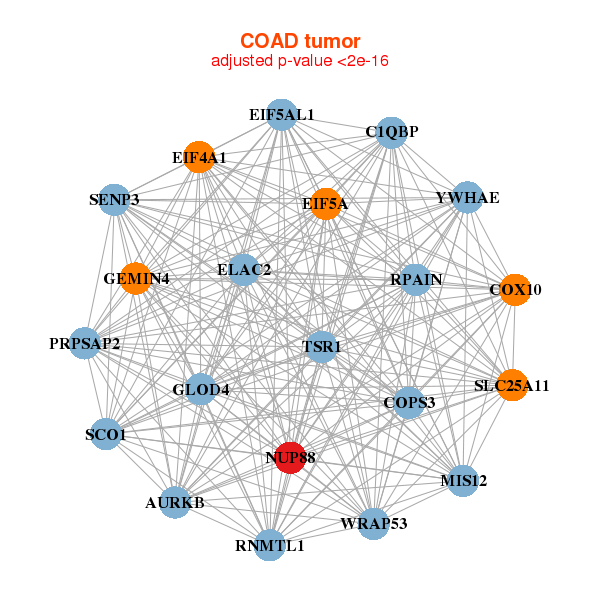
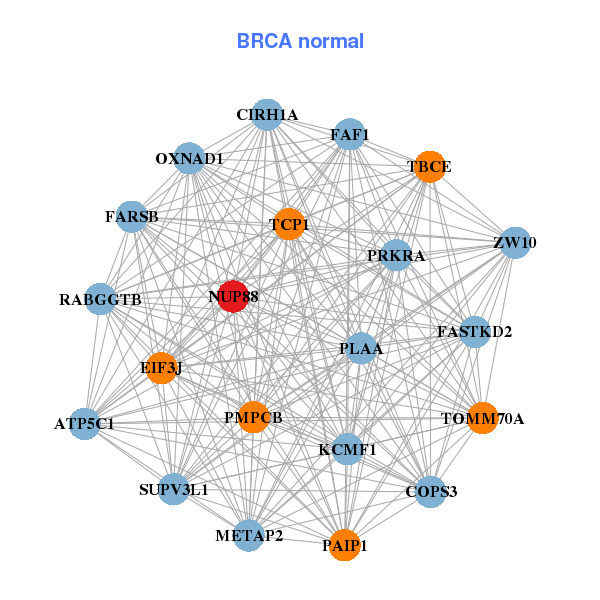
| * Co-Expression network figures were drawn using R package igraph. Only the top 20 genes with the highest correlations were shown. Red circle: input gene, orange circle: cell metabolism gene, sky circle: other gene |
: Open all plots for all cancer types
 |
|
| C1QBP,COX10,DHX33,EIF4A1,FAM64A,GEMIN4,GSG2, MIS12,MYBBP1A,NUP88,PITPNA,PRPF8,RPA1,RPAIN, SCO1,SENP3,TSR1,UBE2G1,YWHAE,ZFP3,ZNF232 | ATP5C1,CIRH1A,COPS3,EIF3J,FAF1,FARSB,FASTKD2, KCMF1,METAP2,NUP88,OXNAD1,PAIP1,PLAA,PMPCB, PRKRA,RABGGTB,SUPV3L1,TBCE,TCP1,TOMM70A,ZW10 |
 |
|
| AURKB,C1QBP,COPS3,COX10,EIF4A1,EIF5A,EIF5AL1, ELAC2,GEMIN4,GLOD4,MIS12,NUP88,PRPSAP2,RNMTL1, RPAIN,SCO1,SENP3,SLC25A11,TSR1,WRAP53,YWHAE | APOO,CCT2,DCAF13,EBNA1BP2,GNL3,HEATR3,HMBS, HSPA14,HSPE1,ILF2,MRPL3,NUP37,NUP88,PCNA, RAN,SLBP,TFDP1,TMX2,UBE2T,UTP6,VRK1 |
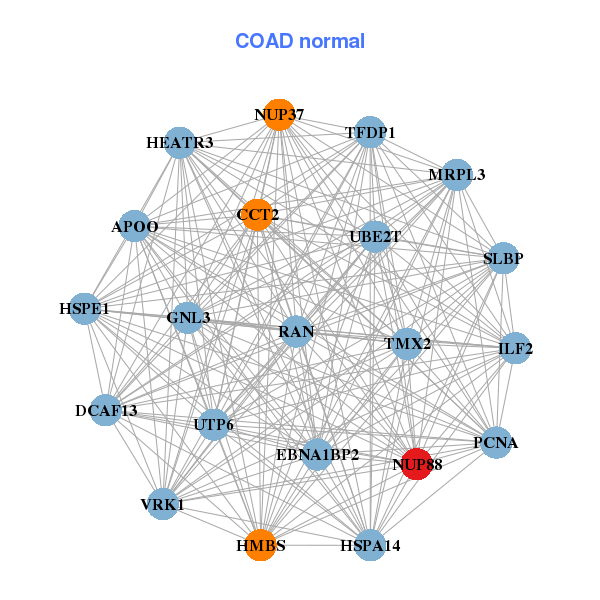
| * Co-Expression network figures were drawn using R package igraph. Only the top 20 genes with the highest correlations were shown. Red circle: input gene, orange circle: cell metabolism gene, sky circle: other gene |
: Open all plots for all cancer types
| Top |
: Open all interacting genes' information including KEGG pathway for all interacting genes from DAVID
| Top |
| Pharmacological Information for NUP88 |
| There's no related Drug. |
| Top |
| Cross referenced IDs for NUP88 |
| * We obtained these cross-references from Uniprot database. It covers 150 different DBs, 18 categories. http://www.uniprot.org/help/cross_references_section |
: Open all cross reference information
|
Copyright © 2016-Present - The Univsersity of Texas Health Science Center at Houston @ |