|
|||||||||||||||||||||||||||||||||||||||||||||||||||||||||||||||||||||||||||||||||||||||||||||||||||||||||||||||||||||||||||||||||||||||||||||||||||||||||||||||||||||||||||||||||||||||||||||||||||||||||||||||||||||||||||||||||||||||||||||||||||||||||||||||||||||||||||||||||||||||||||||||||||||||||||||||
| |
| Phenotypic Information (metabolism pathway, cancer, disease, phenome) |
| |
| |
| Gene-Gene Network Information: Co-Expression Network, Interacting Genes & KEGG |
| |
|


| Gene Summary for OAZ2 |
| Basic gene info. | Gene symbol | OAZ2 |
| Gene name | ornithine decarboxylase antizyme 2 | |
| Synonyms | AZ2 | |
| Cytomap | UCSC genome browser: 15q22.31 | |
| Genomic location | chr15 :64979772-64995462 | |
| Type of gene | protein-coding | |
| RefGenes | NM_001301302.1, NM_002537.3, | |
| Ensembl id | ENSG00000180304 | |
| Description | ODC-Az 2 | |
| Modification date | 20141216 | |
| dbXrefs | MIM : 604152 | |
| HGNC : HGNC | ||
| Ensembl : ENSG00000180304 | ||
| HPRD : 11966 | ||
| Vega : OTTHUMG00000172473 | ||
| Protein | UniProt: go to UniProt's Cross Reference DB Table | |
| Expression | CleanEX: HS_OAZ2 | |
| BioGPS: 4947 | ||
| Gene Expression Atlas: ENSG00000180304 | ||
| The Human Protein Atlas: ENSG00000180304 | ||
| Pathway | NCI Pathway Interaction Database: OAZ2 | |
| KEGG: OAZ2 | ||
| REACTOME: OAZ2 | ||
| ConsensusPathDB | ||
| Pathway Commons: OAZ2 | ||
| Metabolism | MetaCyc: OAZ2 | |
| HUMANCyc: OAZ2 | ||
| Regulation | Ensembl's Regulation: ENSG00000180304 | |
| miRBase: chr15 :64,979,772-64,995,462 | ||
| TargetScan: NM_001301302 | ||
| cisRED: ENSG00000180304 | ||
| Context | iHOP: OAZ2 | |
| cancer metabolism search in PubMed: OAZ2 | ||
| UCL Cancer Institute: OAZ2 | ||
| Assigned class in ccmGDB | C | |
| Top |
| Phenotypic Information for OAZ2(metabolism pathway, cancer, disease, phenome) |
| Cancer | CGAP: OAZ2 |
| Familial Cancer Database: OAZ2 | |
| * This gene is included in those cancer gene databases. |
|
|
|
|
|
| . | |||||||||||||||||||||||||||||||||||||||||||||||||||||||||||||||||||||||||||||||||||||||||||||||||||||||||||||||||||||||||||||||||||||||||||||||||||||||||||||||||||||||||||||||||||||||||||||||||||||||||||||||||||||||||||||||||||||||||||||||||||||||||||||||||||||||||||||||||||||||||||||||||||||||||
Oncogene 1 | Significant driver gene in | ||||||||||||||||||||||||||||||||||||||||||||||||||||||||||||||||||||||||||||||||||||||||||||||||||||||||||||||||||||||||||||||||||||||||||||||||||||||||||||||||||||||||||||||||||||||||||||||||||||||||||||||||||||||||||||||||||||||||||||||||||||||||||||||||||||||||||||||||||||||||||||||||||||||||||||||
| cf) number; DB name 1 Oncogene; http://nar.oxfordjournals.org/content/35/suppl_1/D721.long, 2 Tumor Suppressor gene; https://bioinfo.uth.edu/TSGene/, 3 Cancer Gene Census; http://www.nature.com/nrc/journal/v4/n3/abs/nrc1299.html, 4 CancerGenes; http://nar.oxfordjournals.org/content/35/suppl_1/D721.long, 5 Network of Cancer Gene; http://ncg.kcl.ac.uk/index.php, 1Therapeutic Vulnerabilities in Cancer; http://cbio.mskcc.org/cancergenomics/statius/ |
| REACTOME_METABOLISM_OF_AMINO_ACIDS_AND_DERIVATIVES | |
| OMIM | |
| Orphanet | |
| Disease | KEGG Disease: OAZ2 |
| MedGen: OAZ2 (Human Medical Genetics with Condition) | |
| ClinVar: OAZ2 | |
| Phenotype | MGI: OAZ2 (International Mouse Phenotyping Consortium) |
| PhenomicDB: OAZ2 | |
| Mutations for OAZ2 |
| * Under tables are showing count per each tissue to give us broad intuition about tissue specific mutation patterns.You can go to the detailed page for each mutation database's web site. |
| There's no structural variation information in COSMIC data for this gene. |
| * From mRNA Sanger sequences, Chitars2.0 arranged chimeric transcripts. This table shows OAZ2 related fusion information. |
| ID | Head Gene | Tail Gene | Accession | Gene_a | qStart_a | qEnd_a | Chromosome_a | tStart_a | tEnd_a | Gene_a | qStart_a | qEnd_a | Chromosome_a | tStart_a | tEnd_a |
| W51772 | OAZ2 | 2 | 464 | 15 | 64980835 | 64982750 | LOC100499227 | 460 | 648 | 11 | 119288891 | 119289085 | |
| DA674180 | OAZ2 | 1 | 187 | 15 | 64995228 | 64995414 | SMARCC1 | 186 | 589 | 3 | 47663756 | 47680272 | |
| AI090341 | LOC100499227 | 31 | 224 | 11 | 119288891 | 119289085 | OAZ2 | 220 | 485 | 15 | 64980835 | 64981349 | |
| W26817 | OAZ2 | 13 | 184 | 15 | 64980752 | 64980923 | OAZ2 | 182 | 450 | 15 | 64980482 | 64980750 | |
| Top |
| Mutation type/ Tissue ID | brca | cns | cerv | endome | haematopo | kidn | Lintest | liver | lung | ns | ovary | pancre | prost | skin | stoma | thyro | urina | |||
| Total # sample | 1 | |||||||||||||||||||
| GAIN (# sample) | 1 | |||||||||||||||||||
| LOSS (# sample) |
| cf) Tissue ID; Tissue type (1; Breast, 2; Central_nervous_system, 3; Cervix, 4; Endometrium, 5; Haematopoietic_and_lymphoid_tissue, 6; Kidney, 7; Large_intestine, 8; Liver, 9; Lung, 10; NS, 11; Ovary, 12; Pancreas, 13; Prostate, 14; Skin, 15; Stomach, 16; Thyroid, 17; Urinary_tract) |
| Top |
|
 |
| Top |
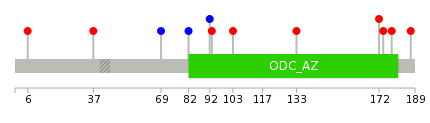
| Stat. for Non-Synonymous SNVs (# total SNVs=7) | (# total SNVs=2) |
 |  |
(# total SNVs=1) | (# total SNVs=0) |
 |
| Top |
| * When you move the cursor on each content, you can see more deailed mutation information on the Tooltip. Those are primary_site,primary_histology,mutation(aa),pubmedID. |
| GRCh37 position | Mutation(aa) | Unique sampleID count |
| chr15:64982648-64982648 | p.W93L | 1 |
| chr15:64982650-64982650 | p.S92S | 1 |
| chr15:64982680-64982680 | p.Q82Q | 1 |
| chr15:64982719-64982719 | p.L69L | 1 |
| chr15:64983649-64983649 | p.S54* | 1 |
| chr15:64980914-64980914 | p.D187N | 1 |
| chr15:64983649-64983650 | p.A55fs*4 | 1 |
| chr15:64980940-64980940 | p.V178G | 1 |
| chr15:64983701-64983701 | p.P37S | 1 |
| chr15:64980952-64980952 | p.V174A | 1 |
| Top |
|
 |
| Point Mutation/ Tissue ID | 1 | 2 | 3 | 4 | 5 | 6 | 7 | 8 | 9 | 10 | 11 | 12 | 13 | 14 | 15 | 16 | 17 | 18 | 19 | 20 |
| # sample | ||||||||||||||||||||
| # mutation | ||||||||||||||||||||
| nonsynonymous SNV | ||||||||||||||||||||
| synonymous SNV |
| cf) Tissue ID; Tissue type (1; BLCA[Bladder Urothelial Carcinoma], 2; BRCA[Breast invasive carcinoma], 3; CESC[Cervical squamous cell carcinoma and endocervical adenocarcinoma], 4; COAD[Colon adenocarcinoma], 5; GBM[Glioblastoma multiforme], 6; Glioma Low Grade, 7; HNSC[Head and Neck squamous cell carcinoma], 8; KICH[Kidney Chromophobe], 9; KIRC[Kidney renal clear cell carcinoma], 10; KIRP[Kidney renal papillary cell carcinoma], 11; LAML[Acute Myeloid Leukemia], 12; LUAD[Lung adenocarcinoma], 13; LUSC[Lung squamous cell carcinoma], 14; OV[Ovarian serous cystadenocarcinoma ], 15; PAAD[Pancreatic adenocarcinoma], 16; PRAD[Prostate adenocarcinoma], 17; SKCM[Skin Cutaneous Melanoma], 18:STAD[Stomach adenocarcinoma], 19:THCA[Thyroid carcinoma], 20:UCEC[Uterine Corpus Endometrial Carcinoma]) |
| Top |
| * We represented just top 10 SNVs. When you move the cursor on each content, you can see more deailed mutation information on the Tooltip. Those are primary_site, primary_histology, mutation(aa), pubmedID. |
| Genomic Position | Mutation(aa) | Unique sampleID count |
| * Copy number data were extracted from TCGA using R package TCGA-Assembler. The URLs of all public data files on TCGA DCC data server were gathered on Jan-05-2015. Function ProcessCNAData in TCGA-Assembler package was used to obtain gene-level copy number value which is calculated as the average copy number of the genomic region of a gene. |
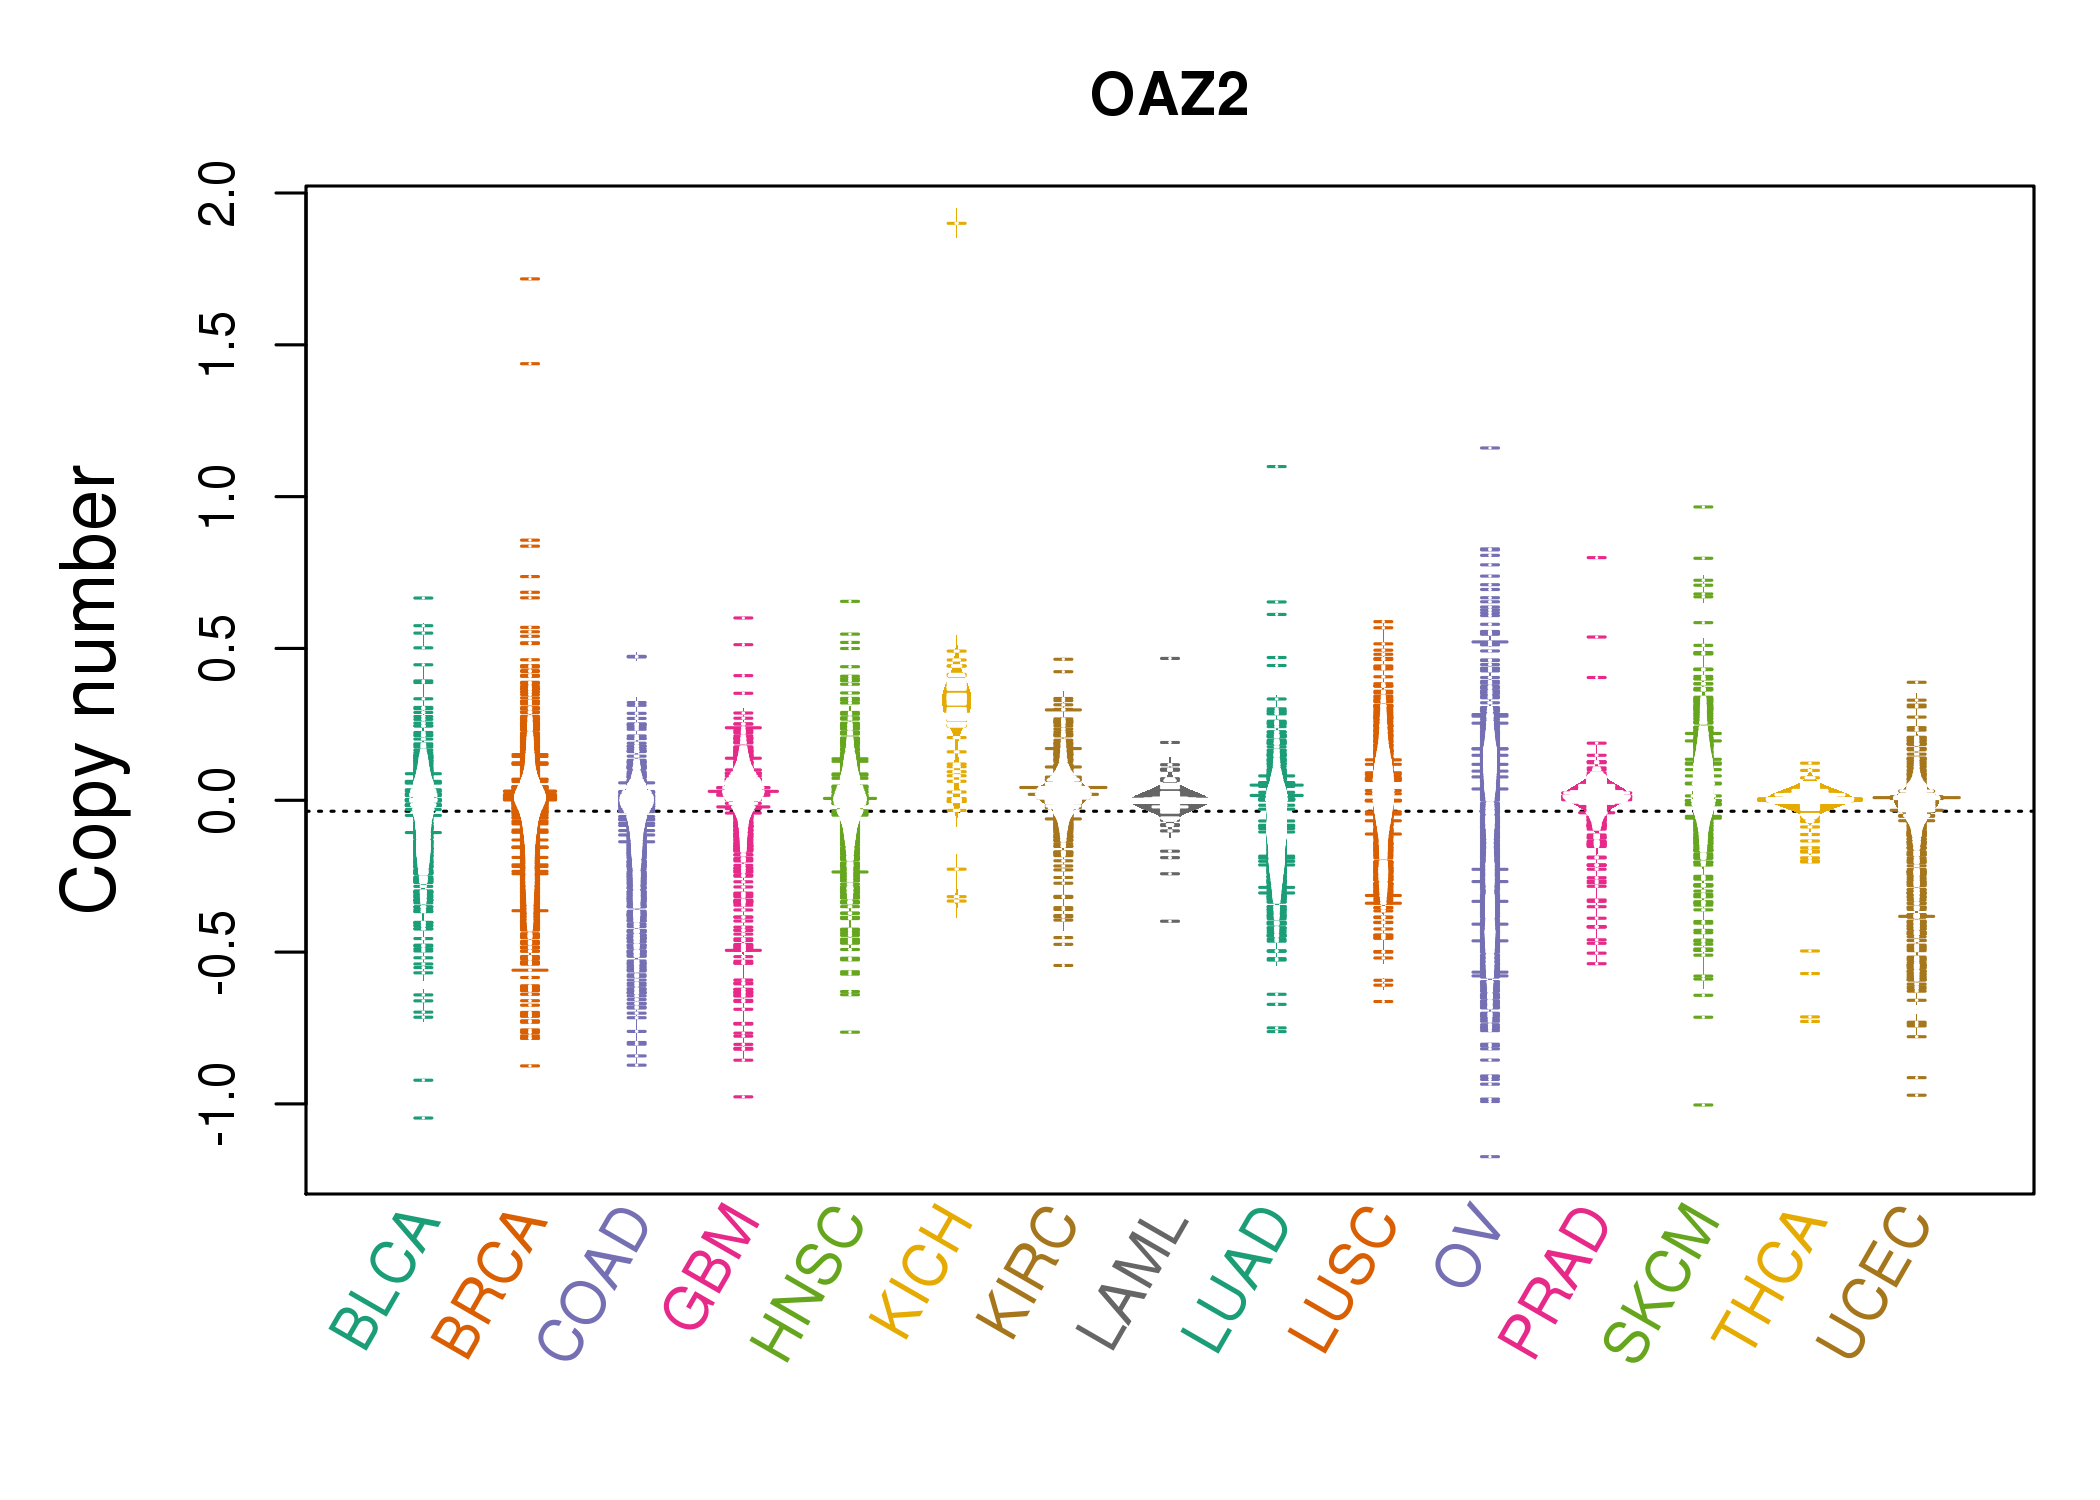 |
| cf) Tissue ID[Tissue type]: BLCA[Bladder Urothelial Carcinoma], BRCA[Breast invasive carcinoma], CESC[Cervical squamous cell carcinoma and endocervical adenocarcinoma], COAD[Colon adenocarcinoma], GBM[Glioblastoma multiforme], Glioma Low Grade, HNSC[Head and Neck squamous cell carcinoma], KICH[Kidney Chromophobe], KIRC[Kidney renal clear cell carcinoma], KIRP[Kidney renal papillary cell carcinoma], LAML[Acute Myeloid Leukemia], LUAD[Lung adenocarcinoma], LUSC[Lung squamous cell carcinoma], OV[Ovarian serous cystadenocarcinoma ], PAAD[Pancreatic adenocarcinoma], PRAD[Prostate adenocarcinoma], SKCM[Skin Cutaneous Melanoma], STAD[Stomach adenocarcinoma], THCA[Thyroid carcinoma], UCEC[Uterine Corpus Endometrial Carcinoma] |
| Top |
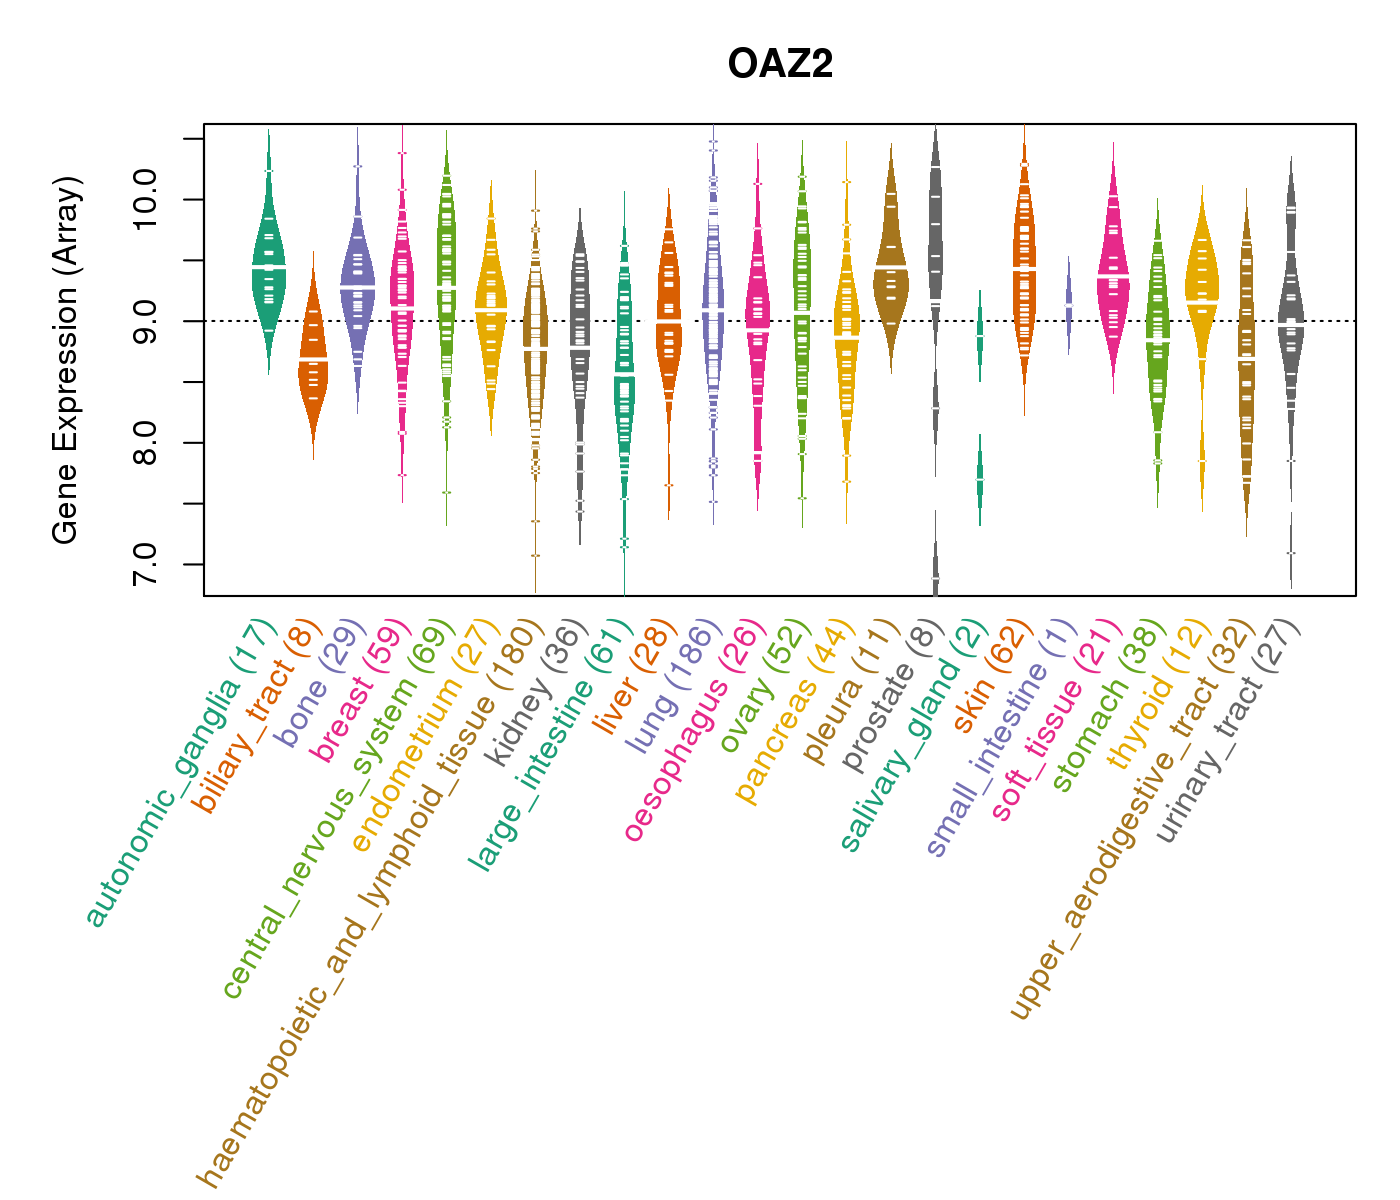
| Gene Expression for OAZ2 |
| * CCLE gene expression data were extracted from CCLE_Expression_Entrez_2012-10-18.res: Gene-centric RMA-normalized mRNA expression data. |
 |
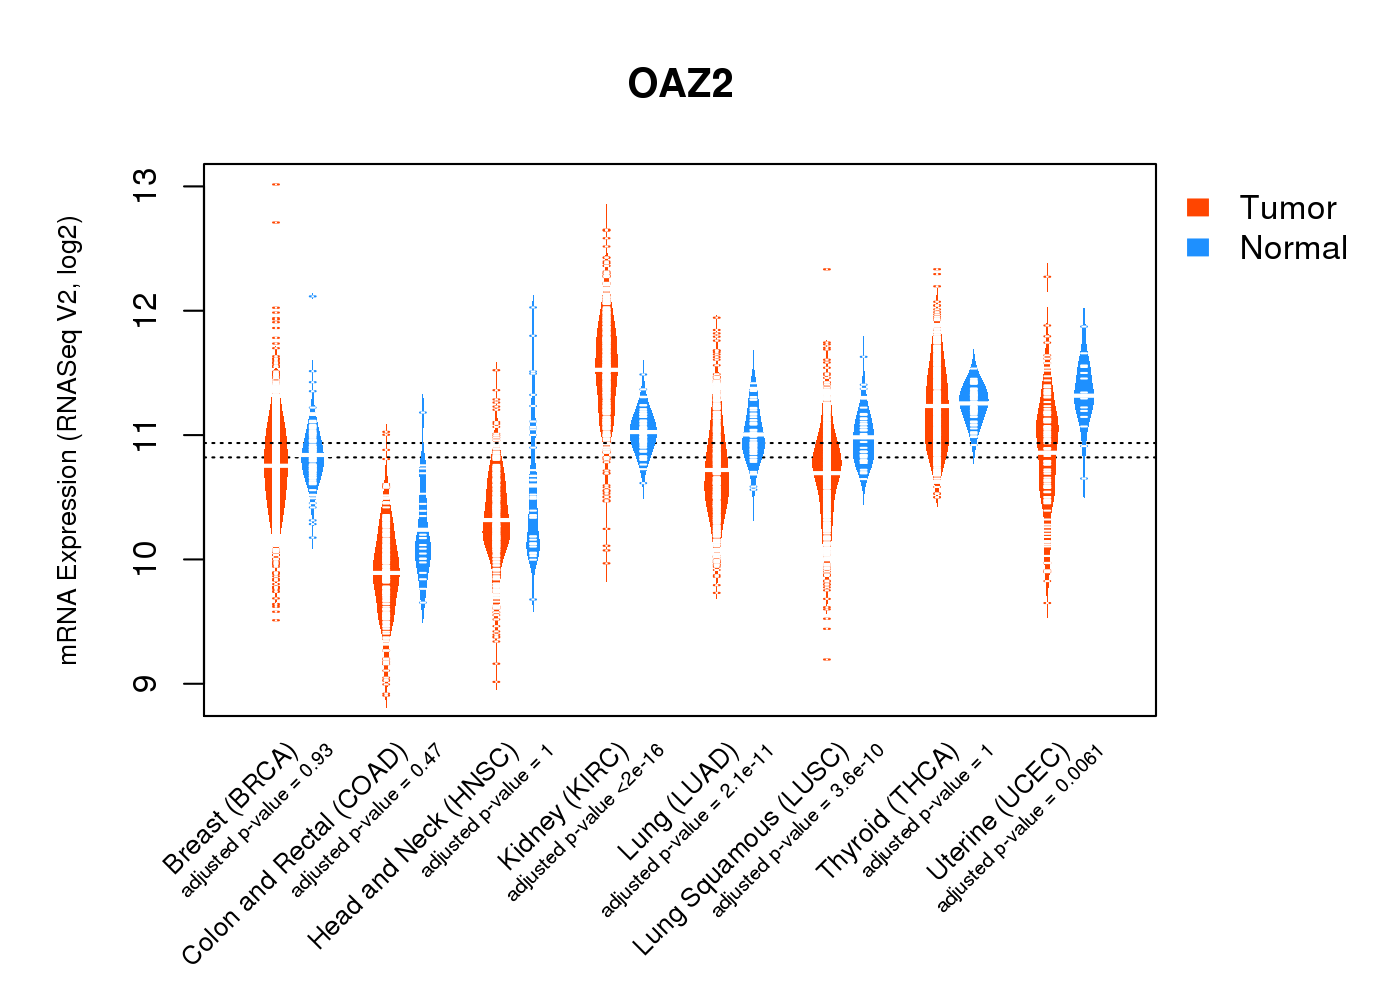
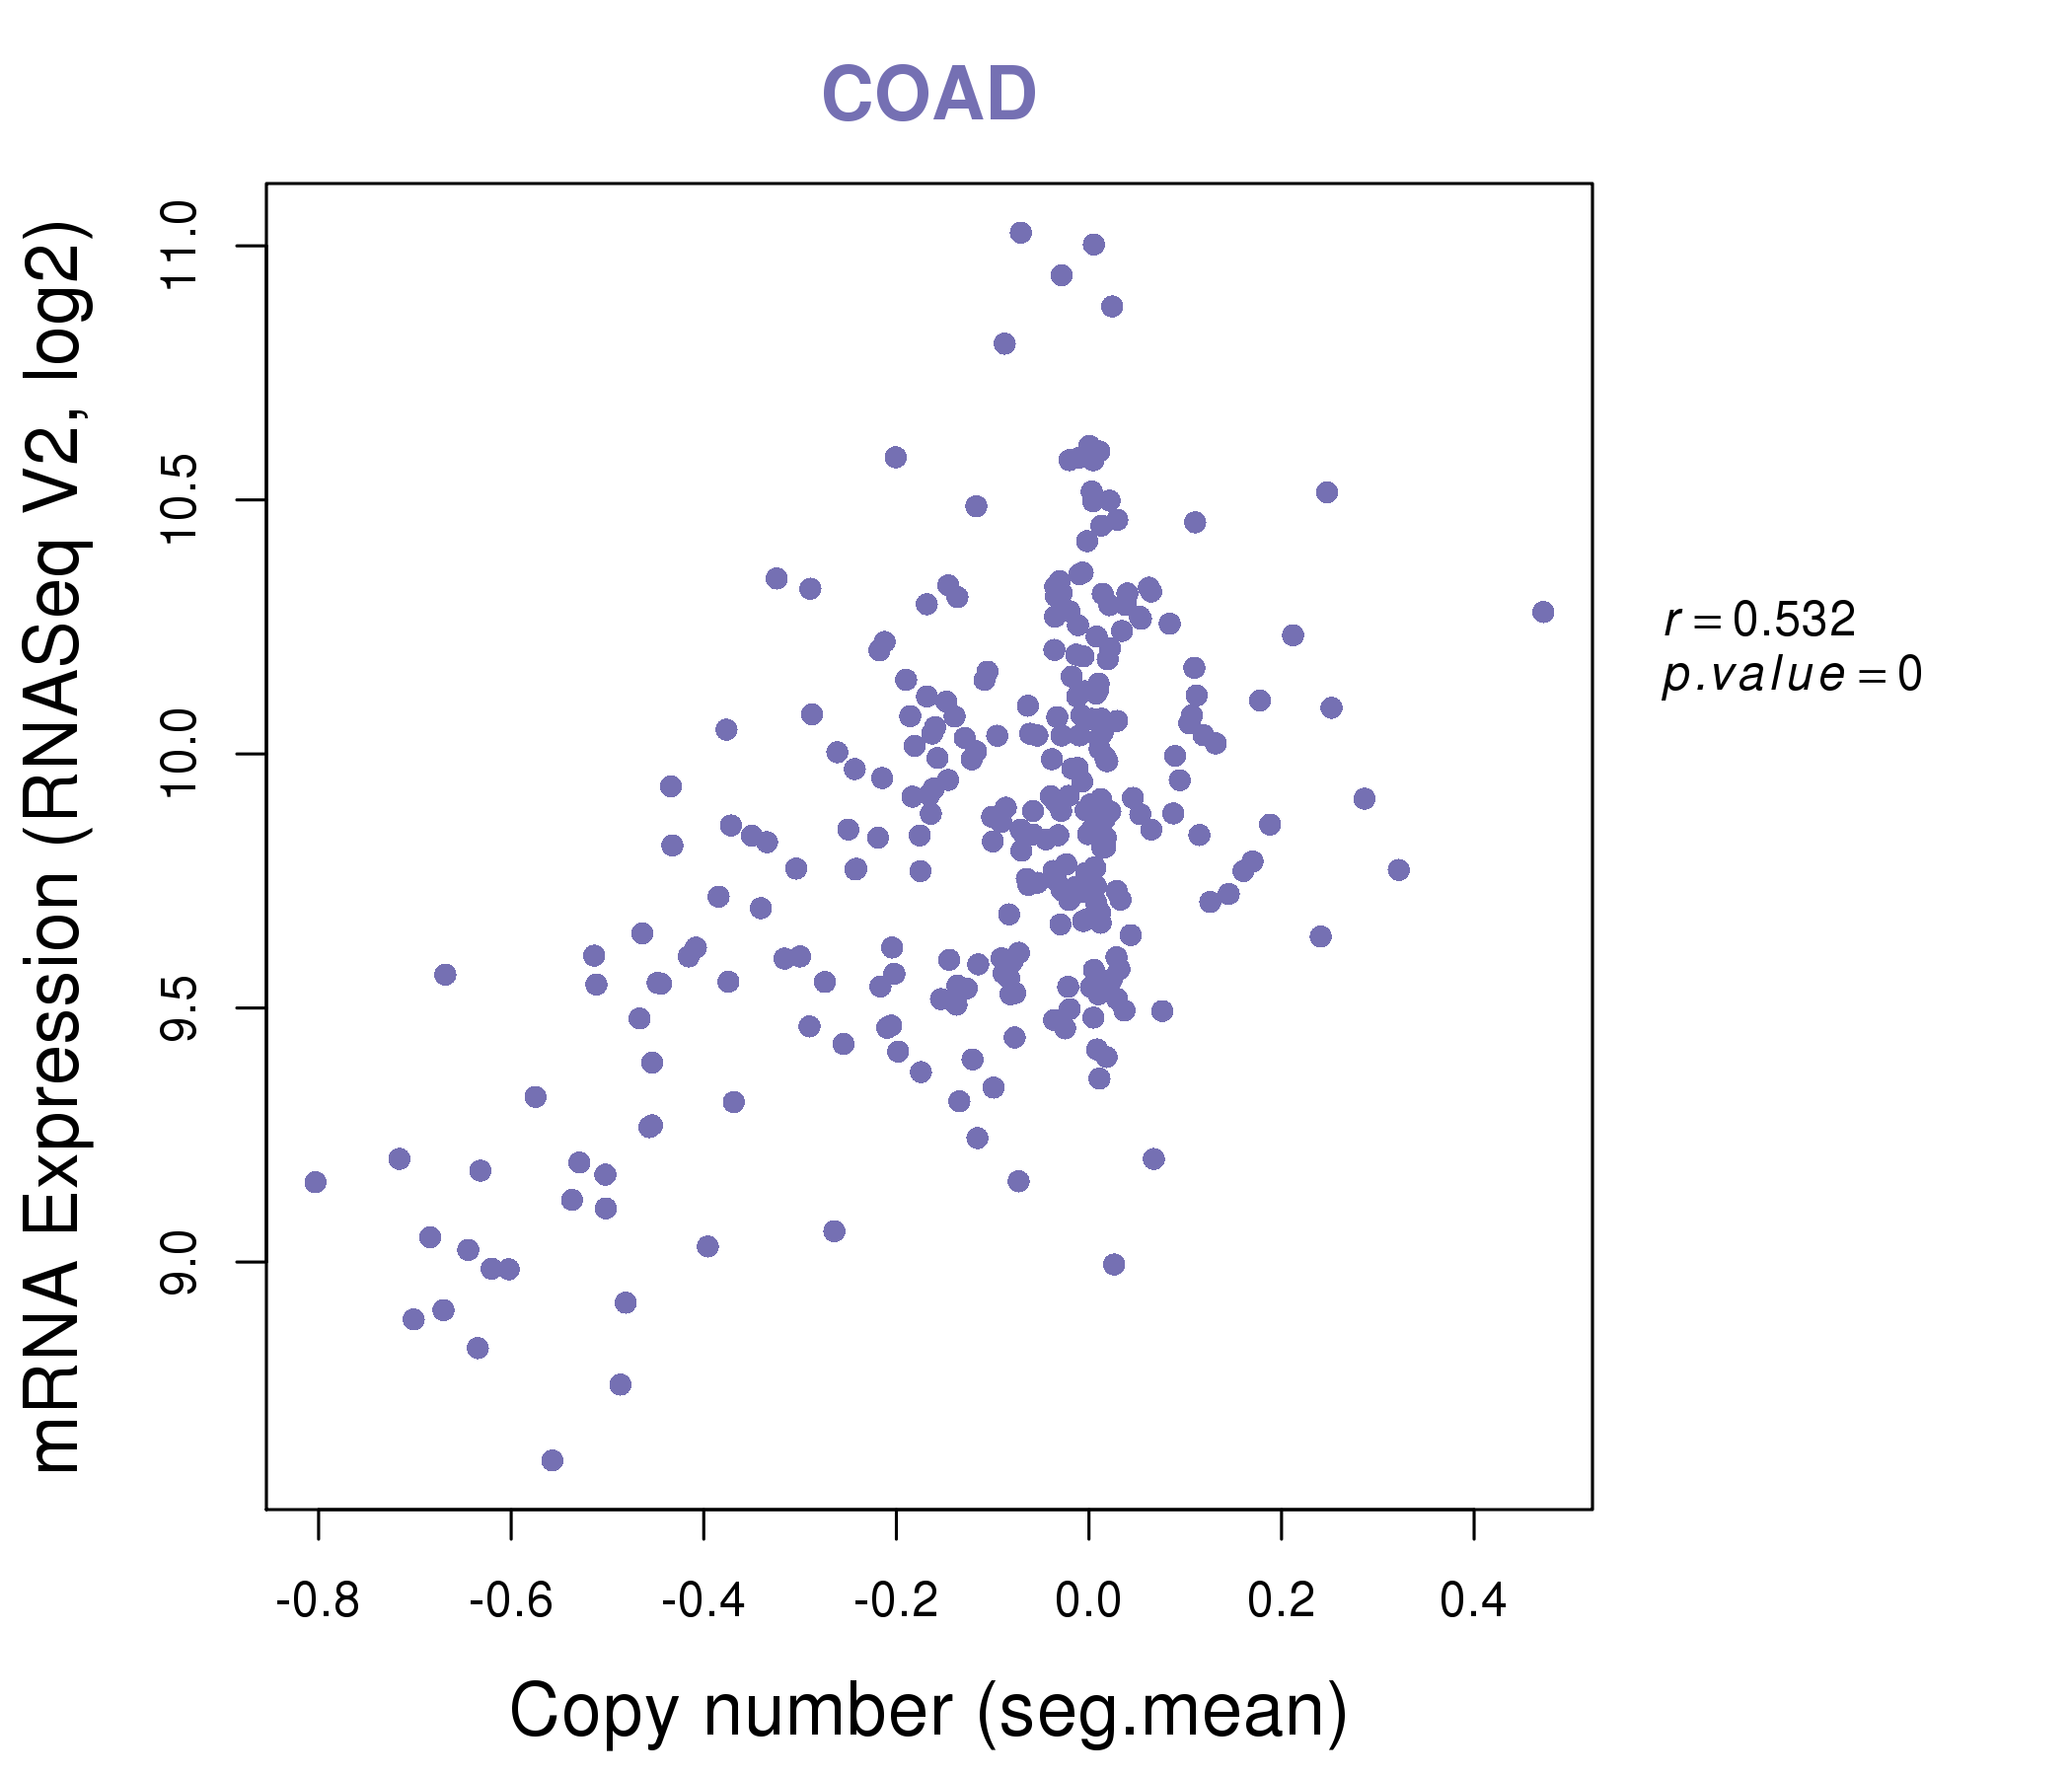
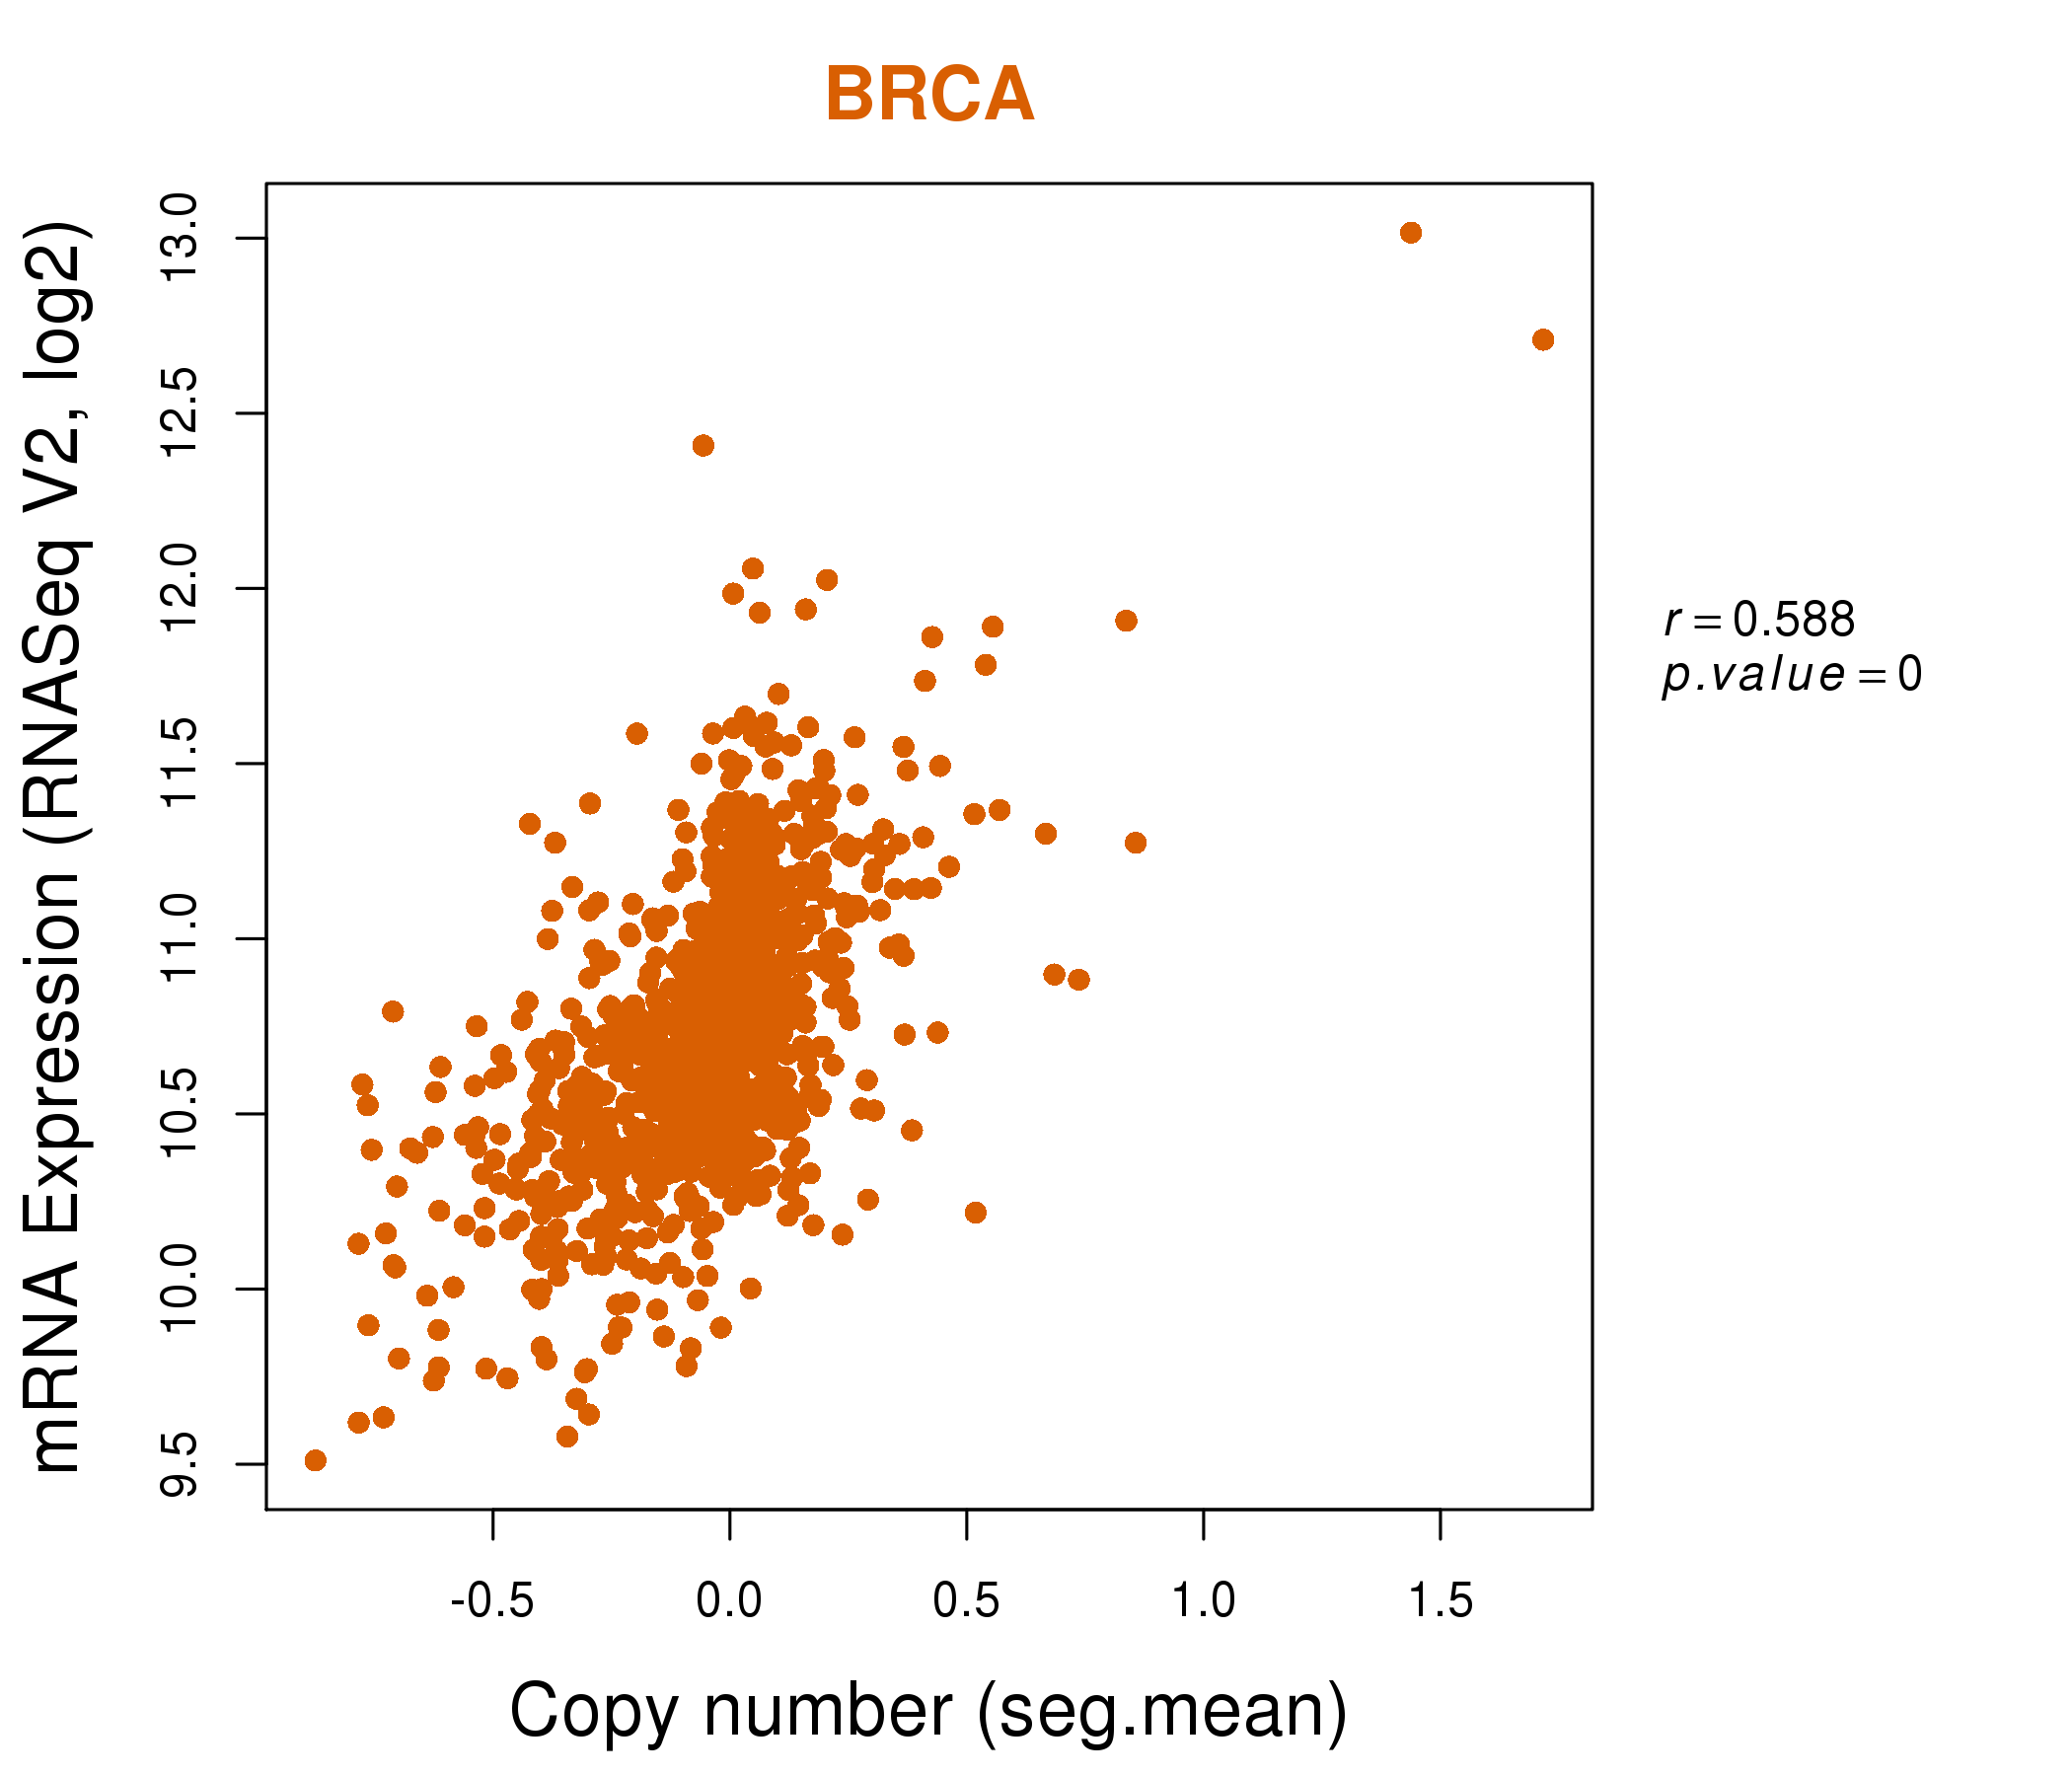
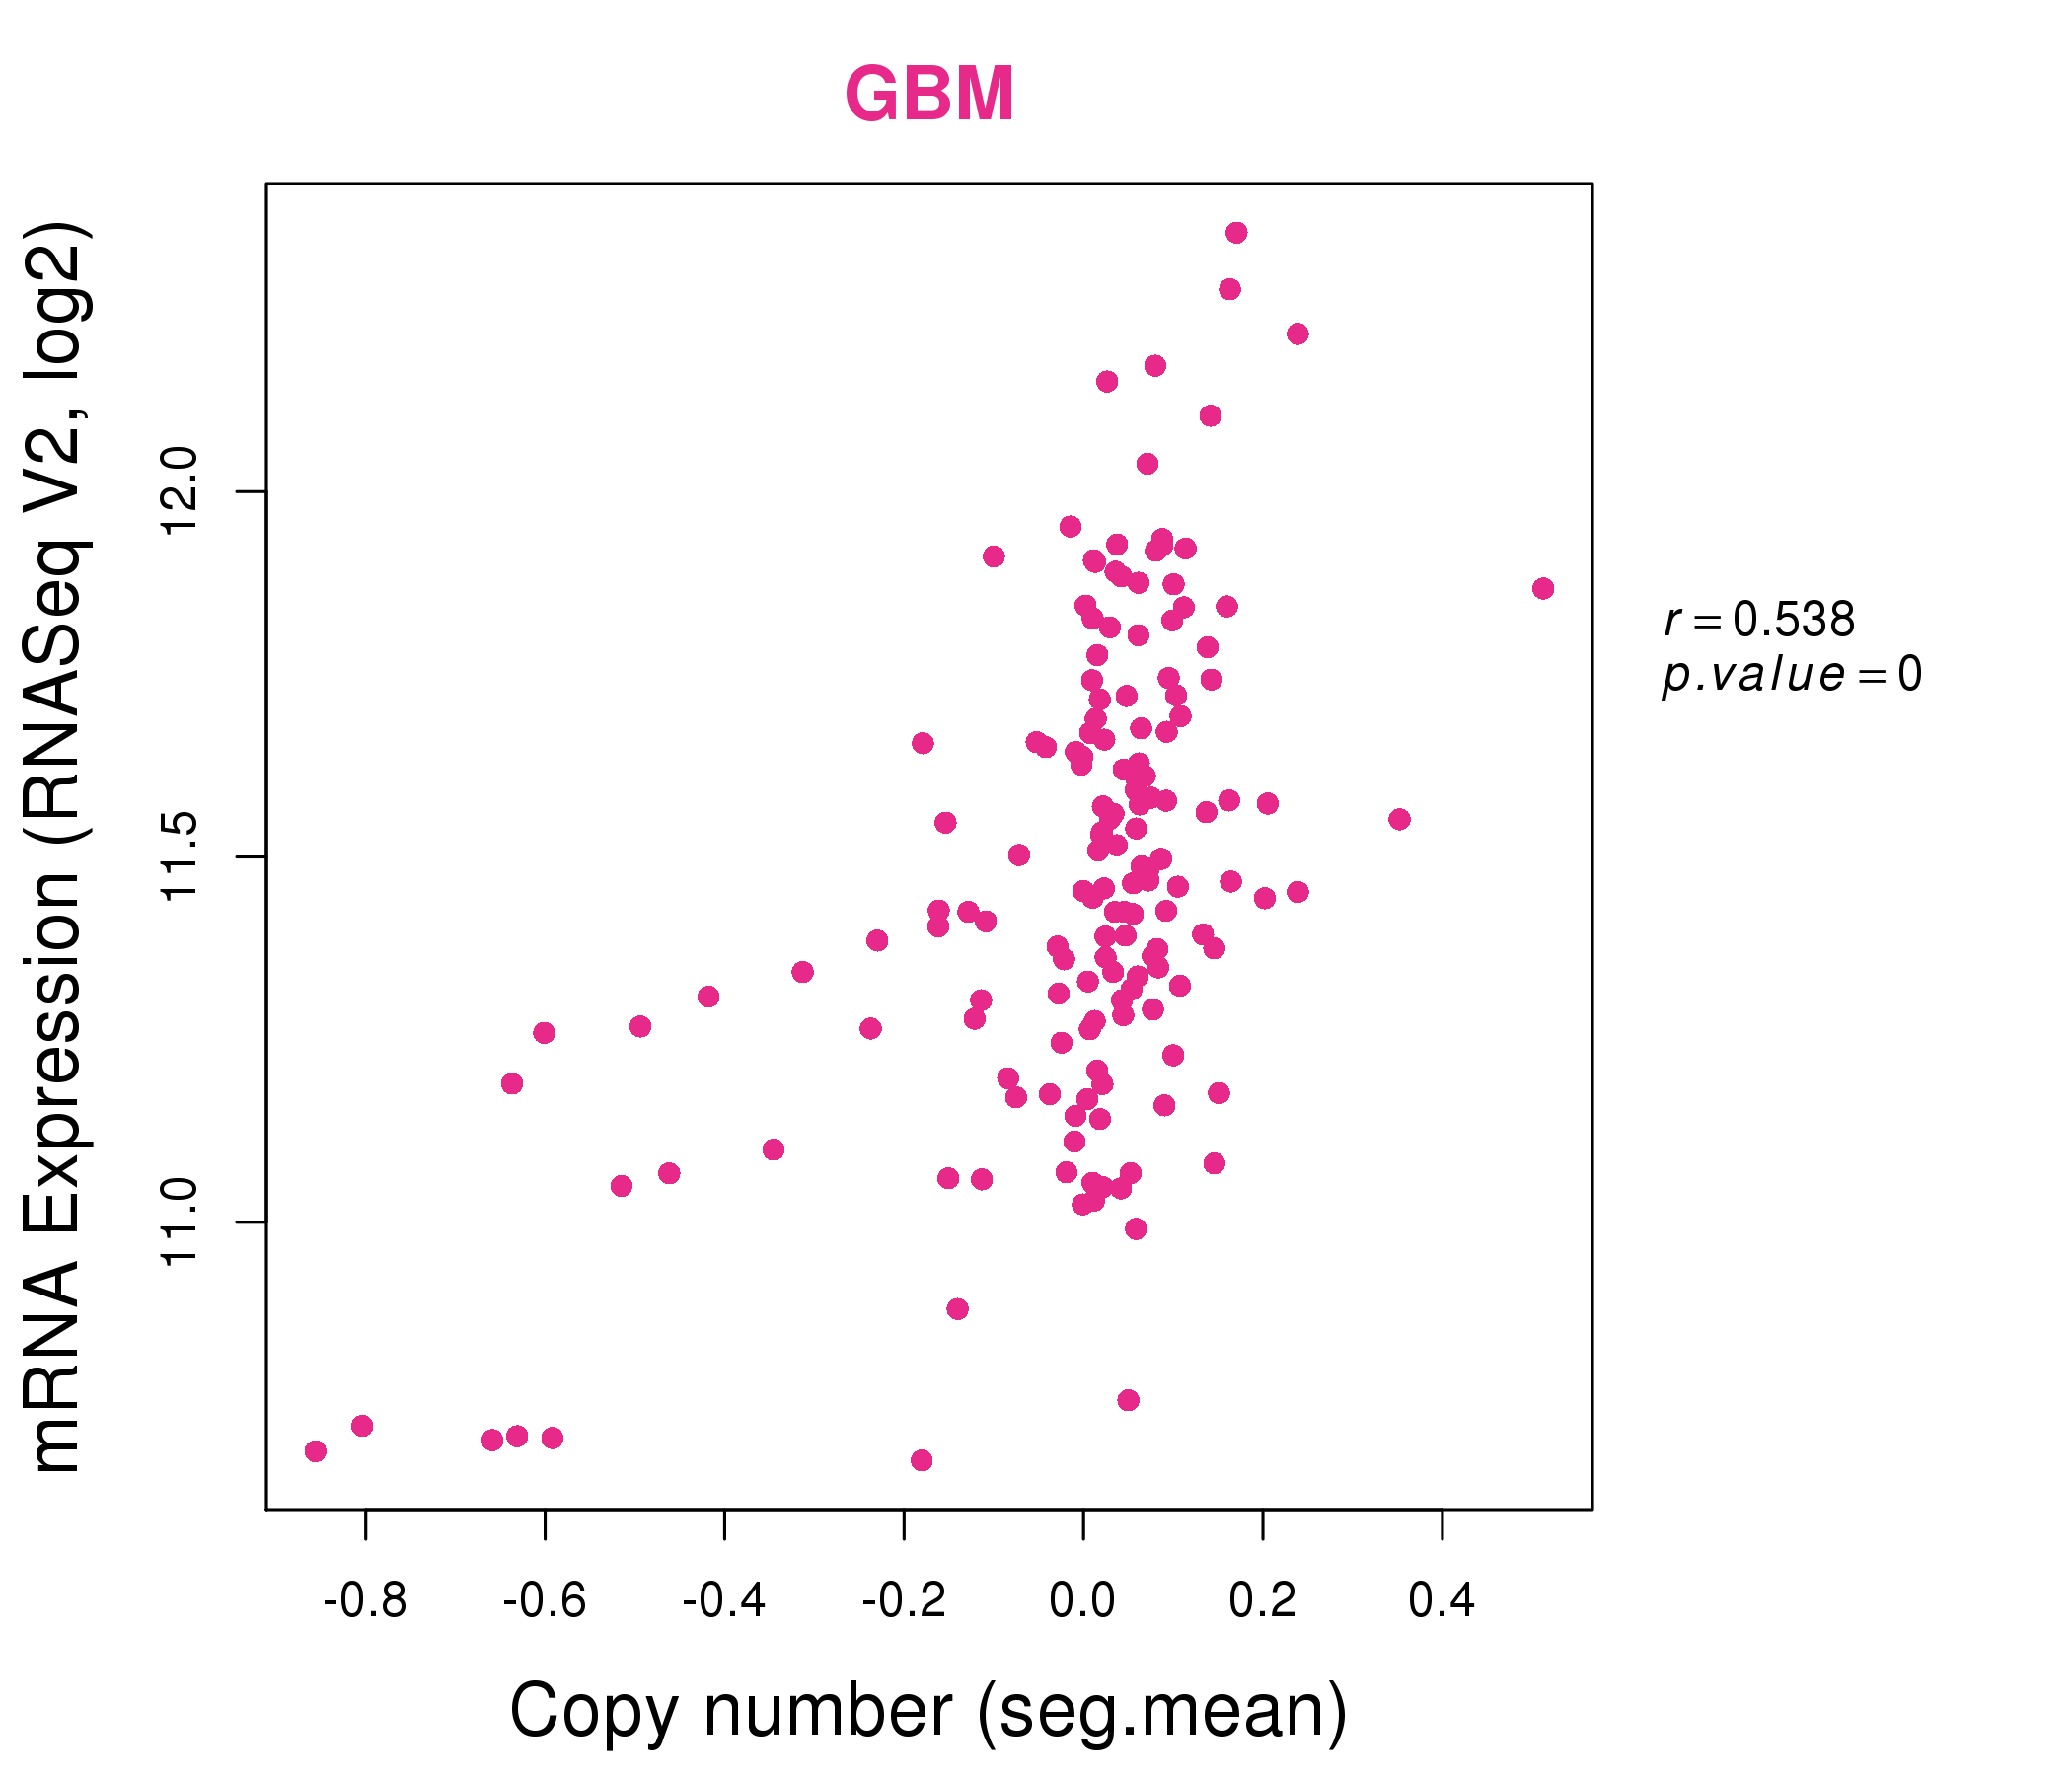
| * Normalized gene expression data of RNASeqV2 was extracted from TCGA using R package TCGA-Assembler. The URLs of all public data files on TCGA DCC data server were gathered at Jan-05-2015. Only eight cancer types have enough normal control samples for differential expression analysis. (t test, adjusted p<0.05 (using Benjamini-Hochberg FDR)) |
 |
| Top |
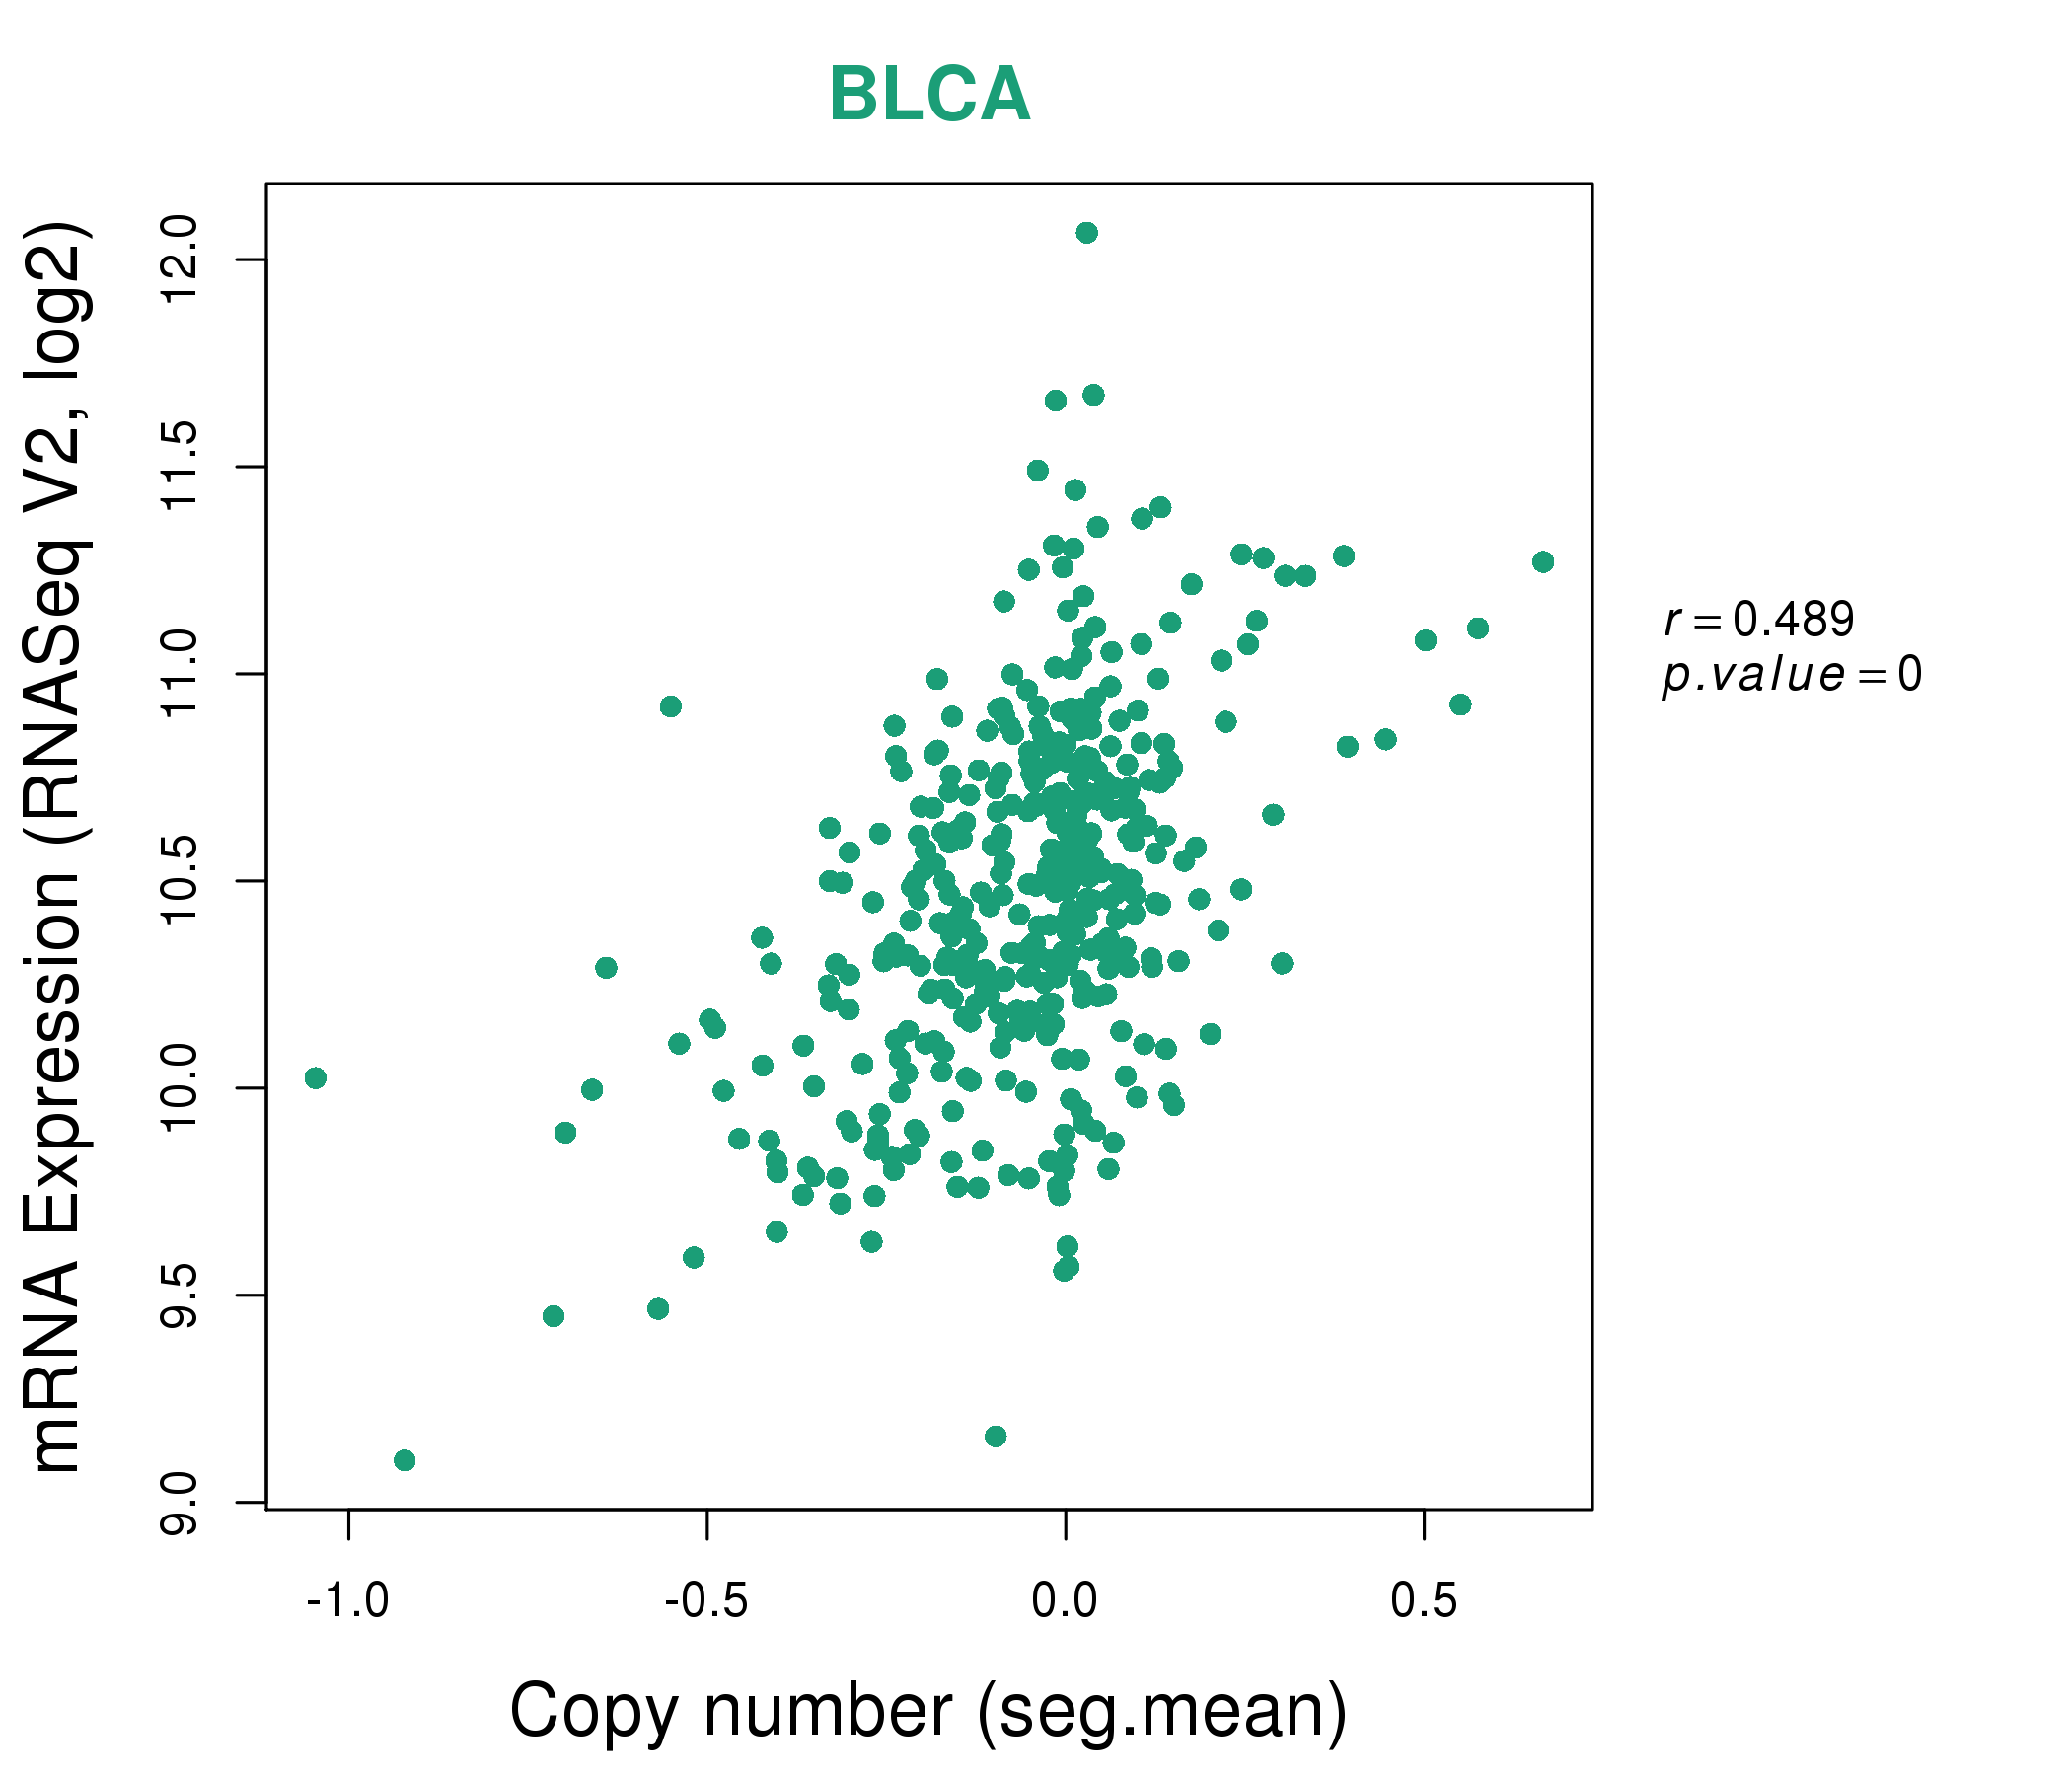
| * This plots show the correlation between CNV and gene expression. |
: Open all plots for all cancer types
 |
|
 |
|
| Top |
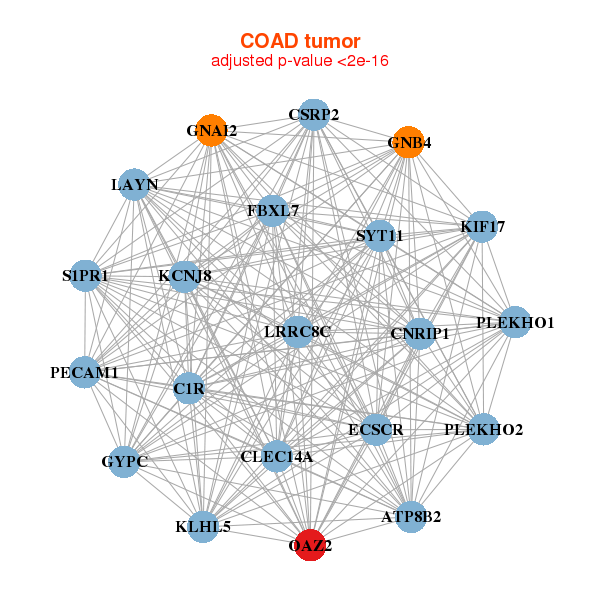
| Gene-Gene Network Information |
| * Co-Expression network figures were drawn using R package igraph. Only the top 20 genes with the highest correlations were shown. Red circle: input gene, orange circle: cell metabolism gene, sky circle: other gene |
: Open all plots for all cancer types
 |
| ||||
| ANP32A,APH1B,FAM219B,VWA9,DIS3L,FAM96A,IMP3, MAP2K5,MTFMT,OAZ2,PARP16,PDCD7,PPIB,RAB11A, RPL4,SNAPC5,SNX1,SPG21,SRP14,TRIP4,UBL7 | CARM1,DBNDD2,DEXI,CTDNEP1,FAM89B,HCFC1R1,HOMER3, KEAP1,MRPL14,NOSIP,NXN,OAZ2,PDLIM2,PKM, RILPL1,SEPW1,SLC35E4,TFEB,TOMM40L,UBAC1,UBL4A | ||||
 |
| ||||
| ATP8B2,C1R,CLEC14A,CNRIP1,CSRP2,ECSCR,FBXL7, GNAI2,GNB4,GYPC,KCNJ8,KIF17,KLHL5,LAYN, LRRC8C,OAZ2,PECAM1,PLEKHO1,PLEKHO2,S1PR1,SYT11 | BEX4,C9orf9,CLUAP1,CNRIP1,CRTAP,DNAJC18,DPF2, GYPC,OAZ2,PJA1,PLSCR3,PRDM8,RAB34,RGS10, RPL23AP82,SH3BGRL,SMARCD3,TMEM55A,TNFSF12,TRAM1L1,TRIM23 |

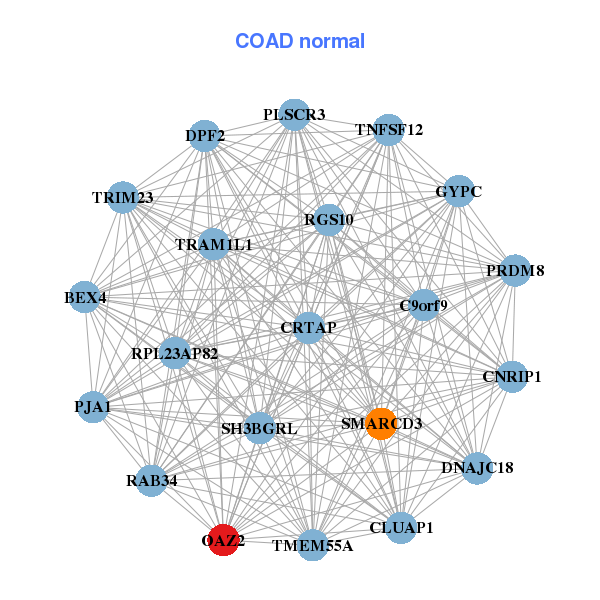
| * Co-Expression network figures were drawn using R package igraph. Only the top 20 genes with the highest correlations were shown. Red circle: input gene, orange circle: cell metabolism gene, sky circle: other gene |
: Open all plots for all cancer types
| Top |
: Open all interacting genes' information including KEGG pathway for all interacting genes from DAVID
| Top |
| Pharmacological Information for OAZ2 |
| DB Category | DB Name | DB's ID and Url link |
| * Gene Centered Interaction Network. |
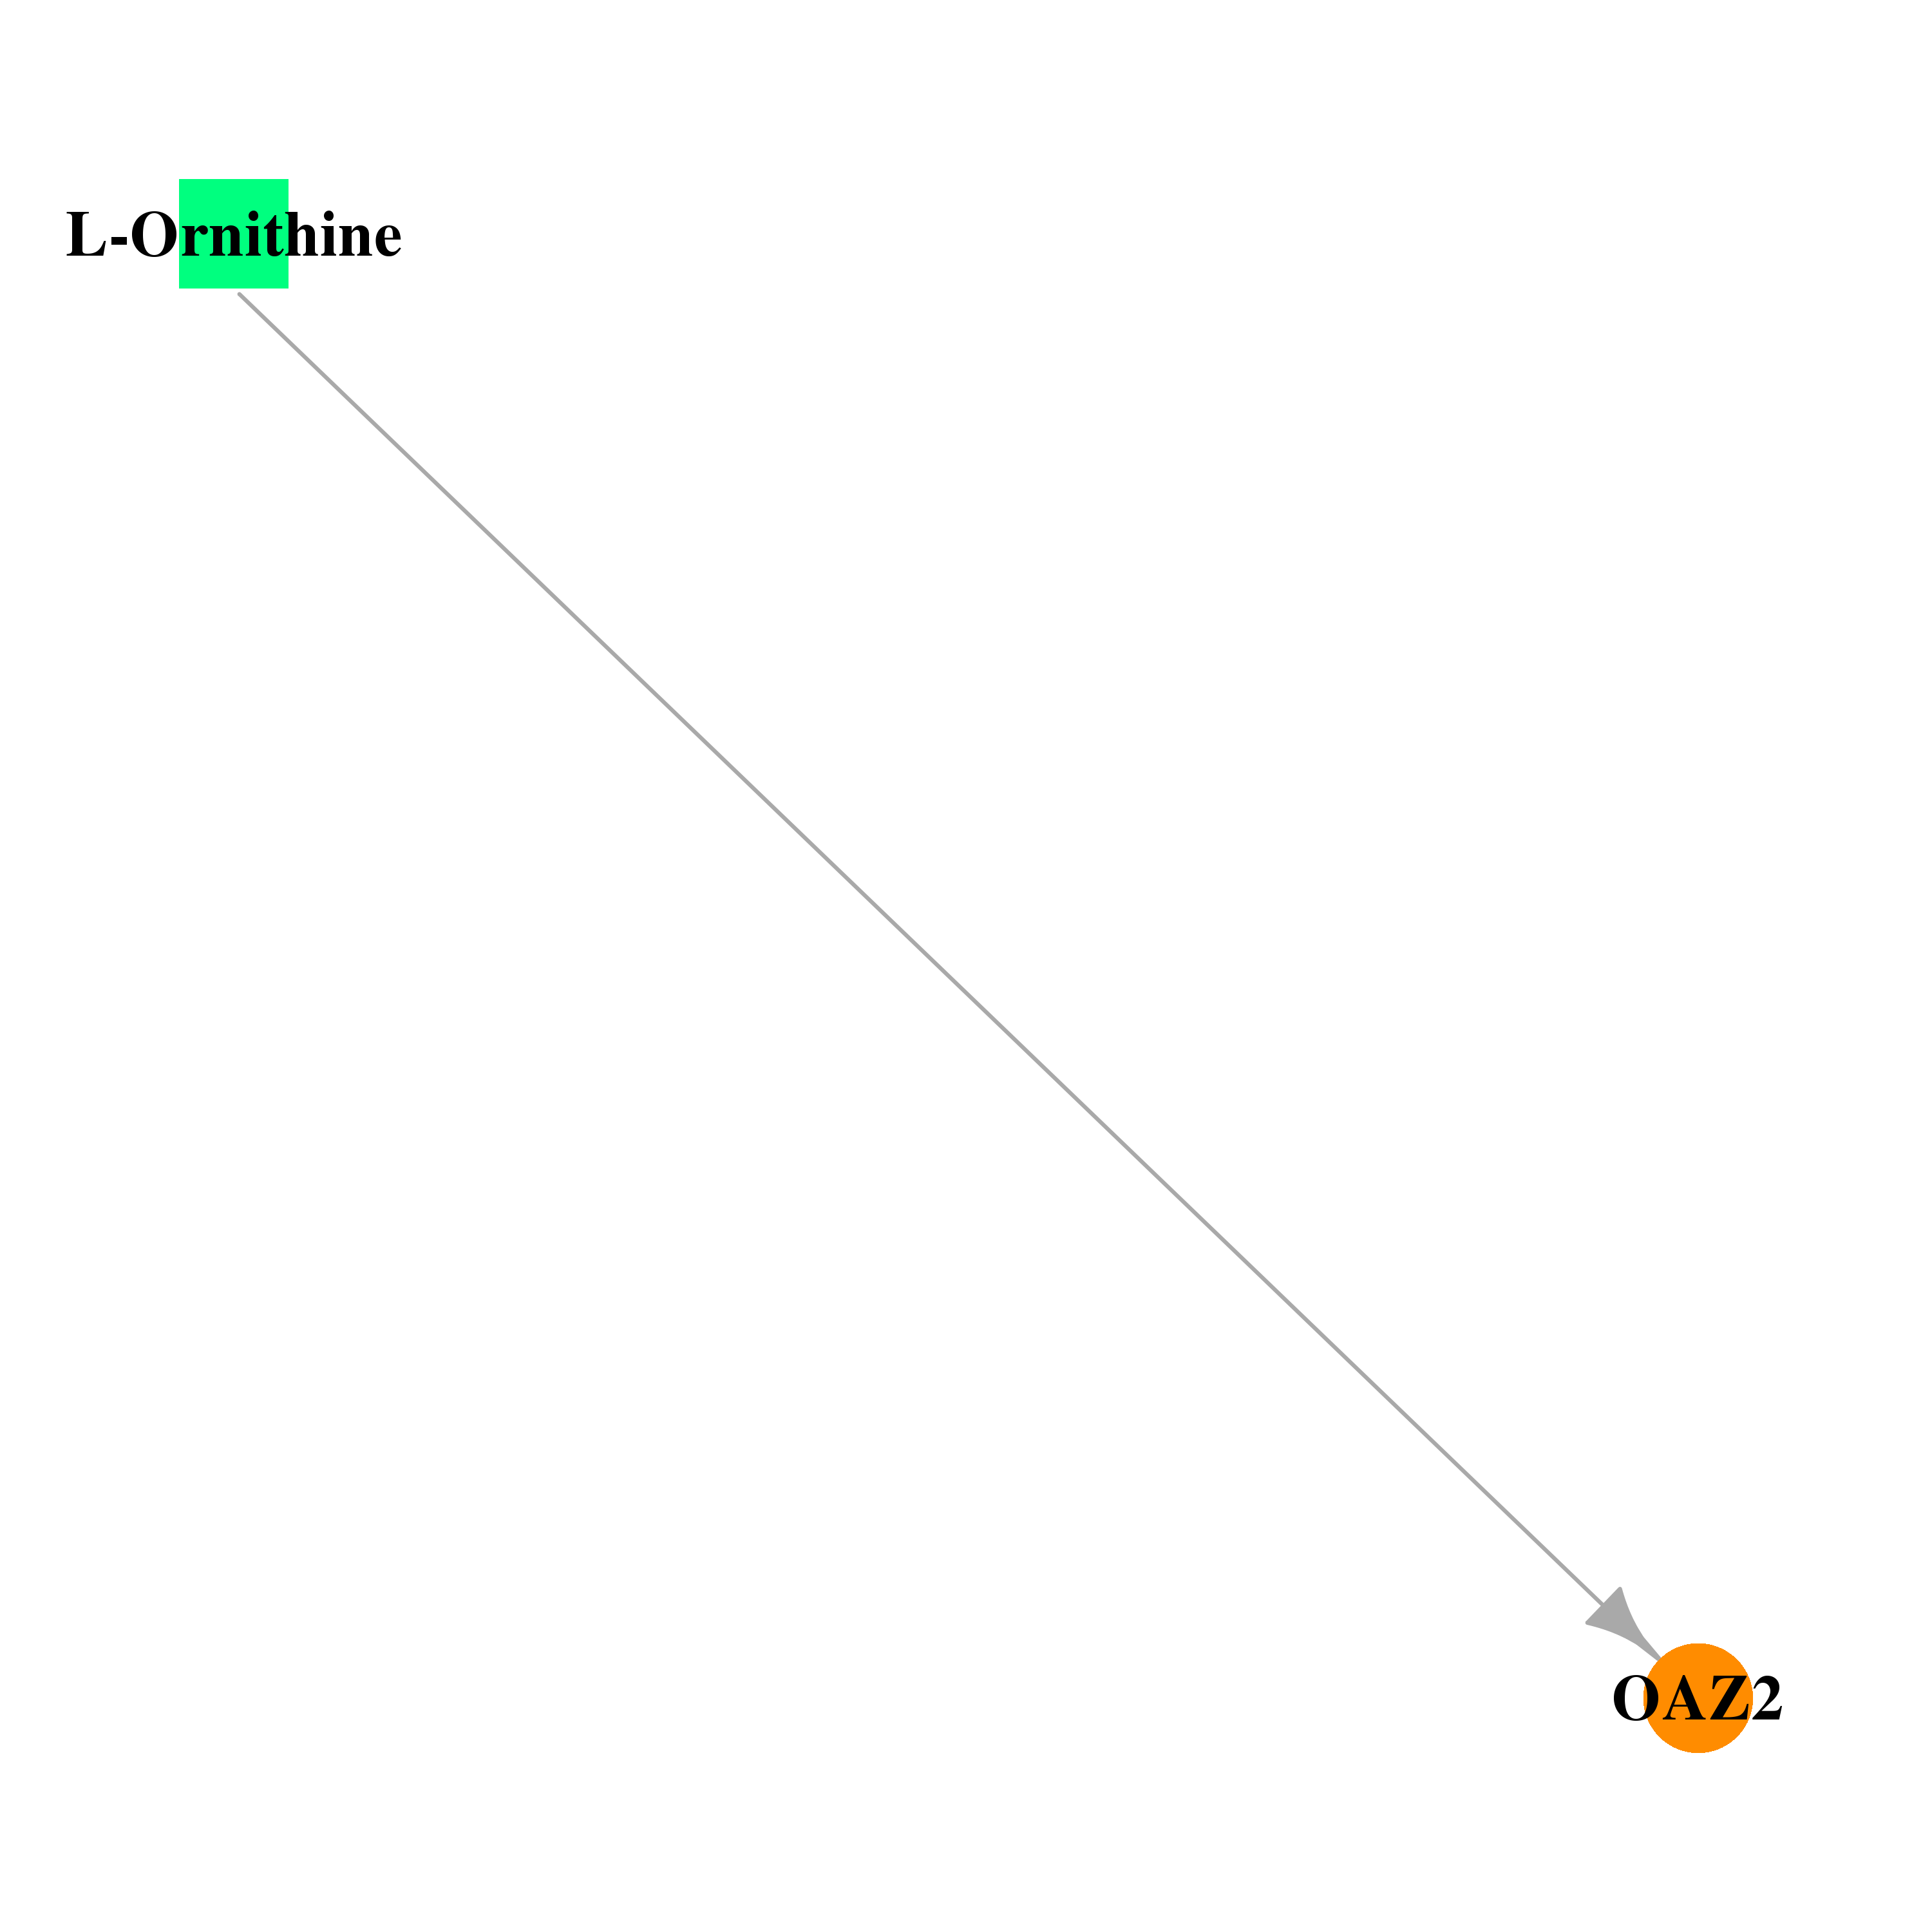 |
| * Drug Centered Interaction Network. |
| DrugBank ID | Target Name | Drug Groups | Generic Name | Drug Centered Network | Drug Structure |
| DB00129 | ornithine decarboxylase antizyme 2 | approved; nutraceutical | L-Ornithine | 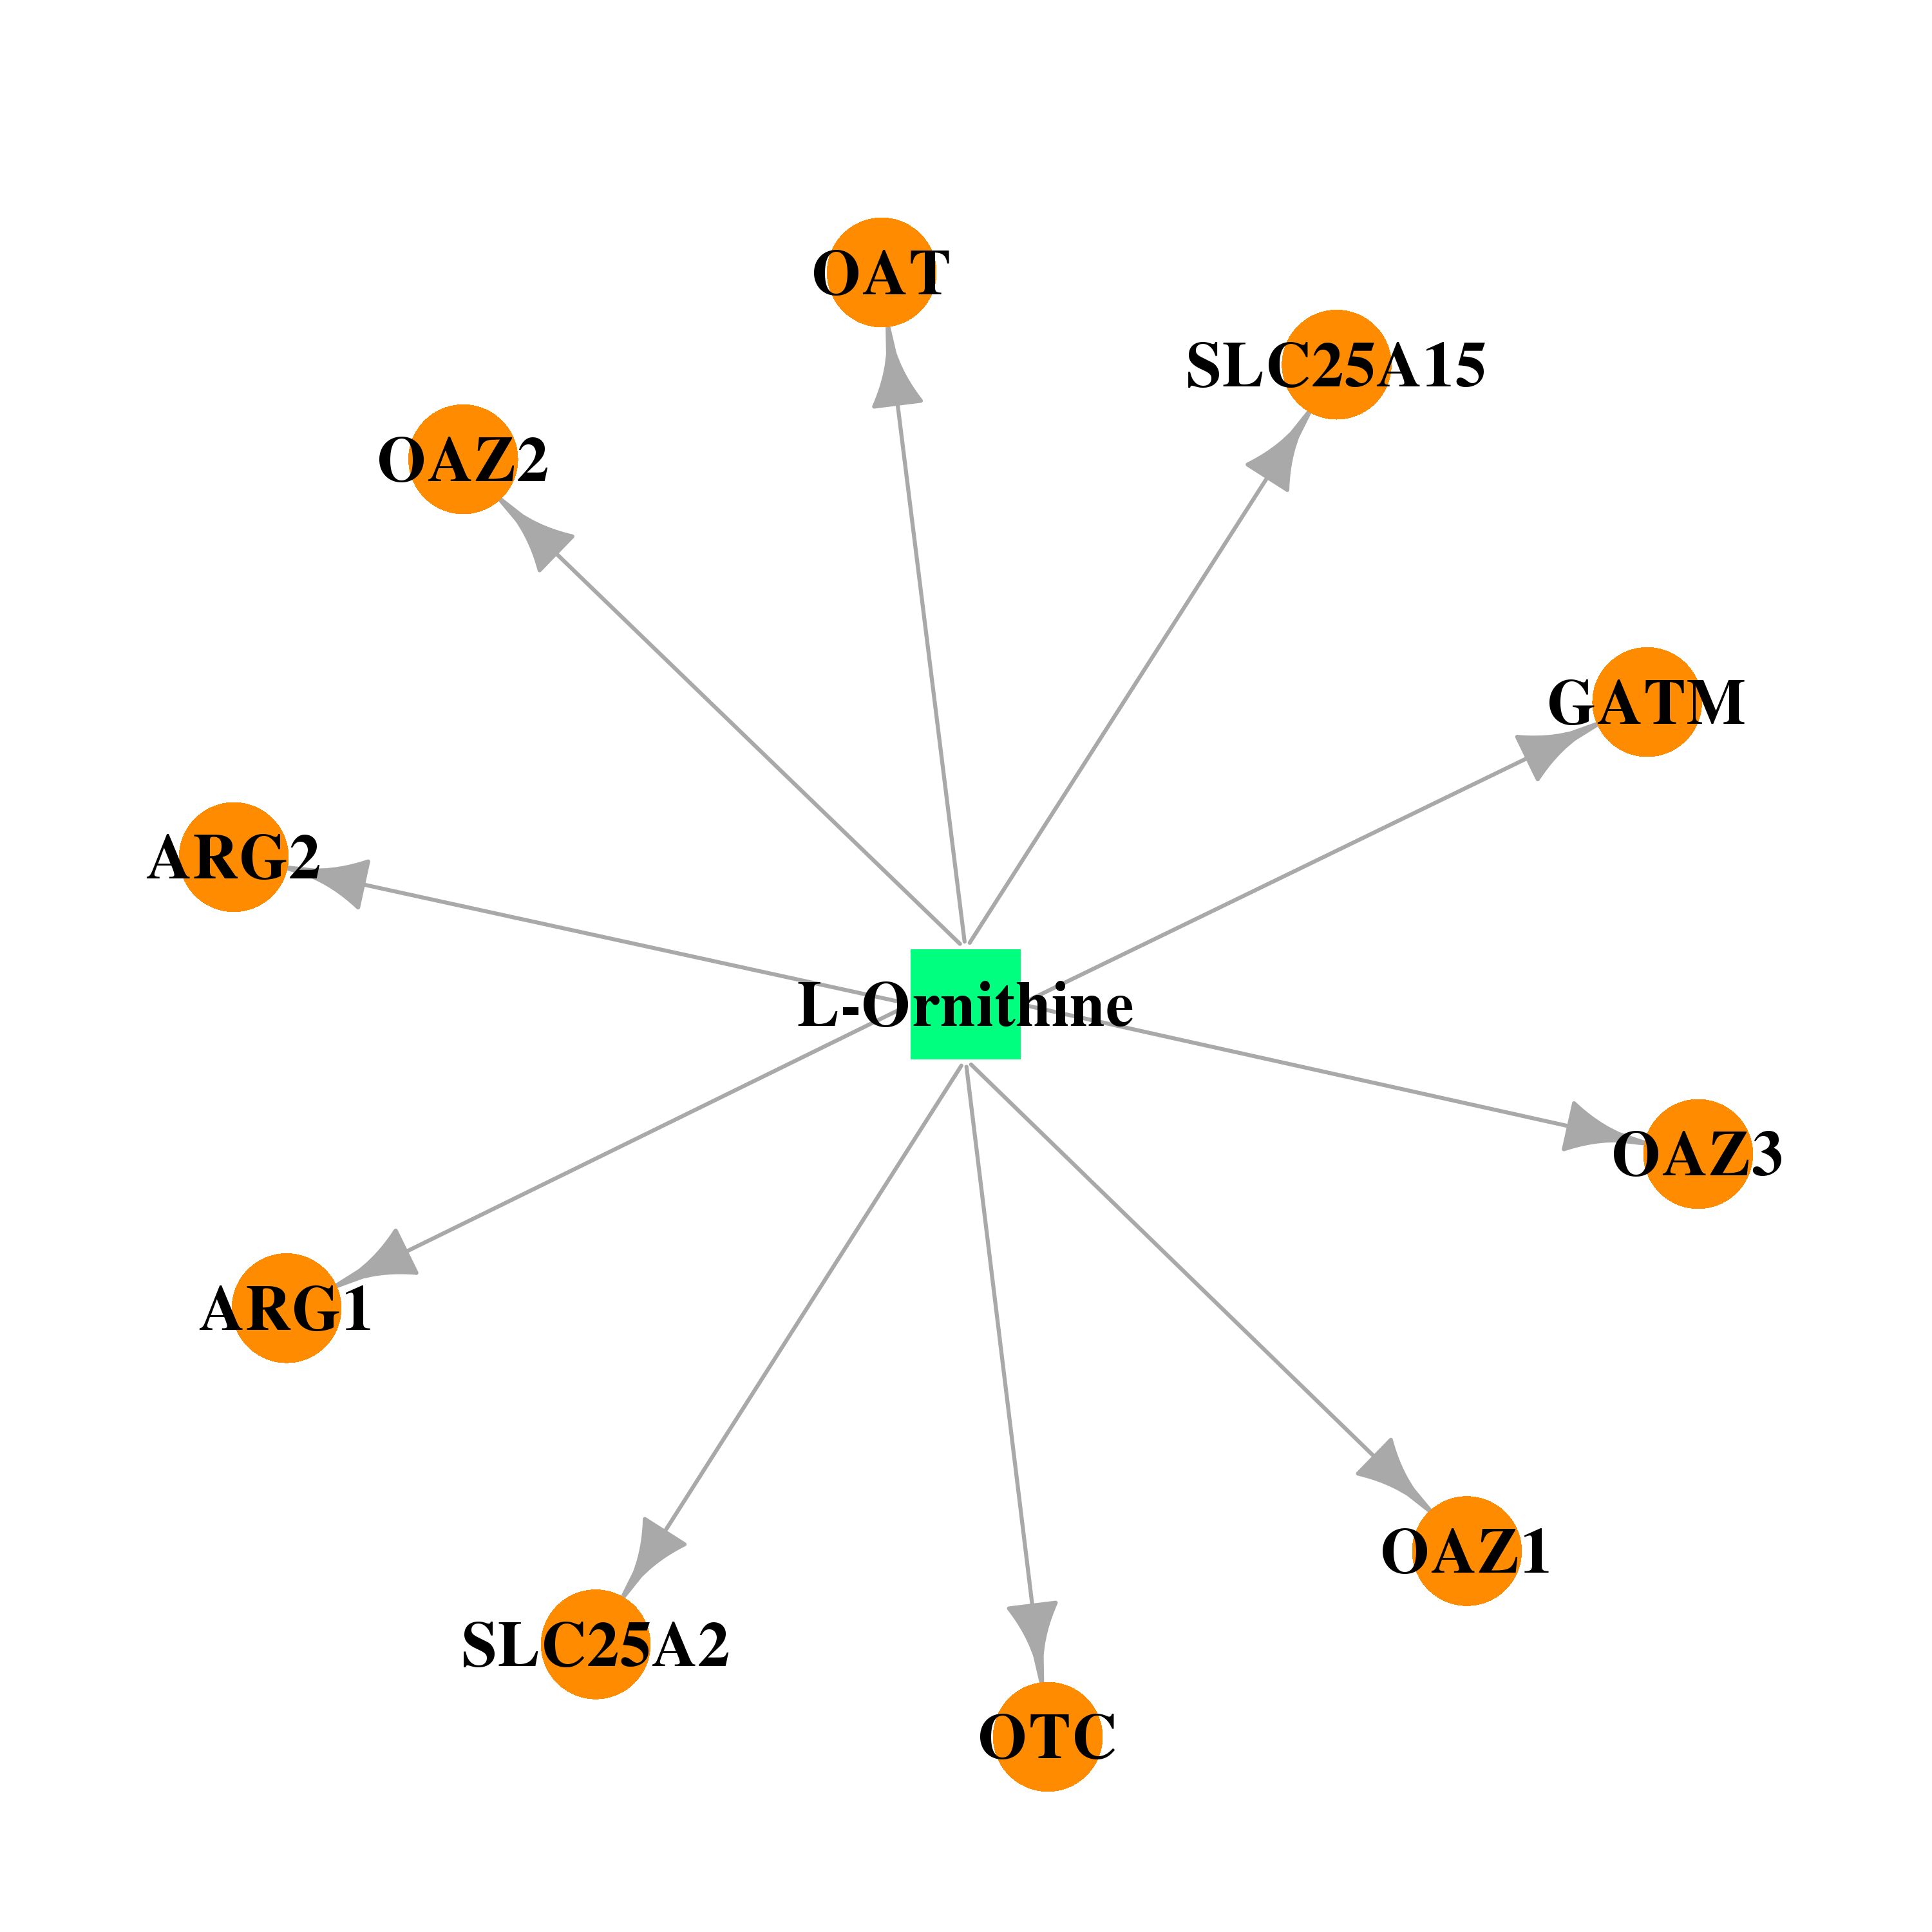 | 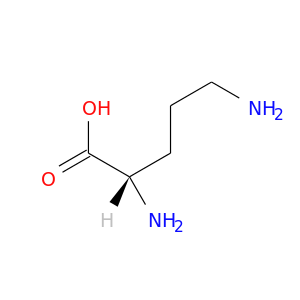 |
| Top |
| Cross referenced IDs for OAZ2 |
| * We obtained these cross-references from Uniprot database. It covers 150 different DBs, 18 categories. http://www.uniprot.org/help/cross_references_section |
: Open all cross reference information
|
Copyright © 2016-Present - The Univsersity of Texas Health Science Center at Houston @ |