|
||||||||||||||||||||
| |
| Phenotypic Information (metabolism pathway, cancer, disease, phenome) |
| |
| |
| Gene-Gene Network Information: Co-Expression Network, Interacting Genes & KEGG |
| |
|


| Gene Summary for OCRL |
| Basic gene info. | Gene symbol | OCRL |
| Gene name | oculocerebrorenal syndrome of Lowe | |
| Synonyms | INPP5F|LOCR|NPHL2|OCRL-1|OCRL1 | |
| Cytomap | UCSC genome browser: Xq25 | |
| Genomic location | chrX :128674251-128726530 | |
| Type of gene | protein-coding | |
| RefGenes | NM_000276.3, NM_001587.3, | |
| Ensembl id | ENSG00000122126 | |
| Description | Lowe oculocerebrorenal syndrome proteininositol polyphosphate 5-phosphatase OCRL-1phosphatidylinositol polyphosphate 5-phosphatase | |
| Modification date | 20141219 | |
| dbXrefs | MIM : 300535 | |
| HGNC : HGNC | ||
| Ensembl : ENSG00000122126 | ||
| HPRD : 02395 | ||
| Vega : OTTHUMG00000022706 | ||
| Protein | UniProt: go to UniProt's Cross Reference DB Table | |
| Expression | CleanEX: HS_OCRL | |
| BioGPS: 4952 | ||
| Gene Expression Atlas: ENSG00000122126 | ||
| The Human Protein Atlas: ENSG00000122126 | ||
| Pathway | NCI Pathway Interaction Database: OCRL | |
| KEGG: OCRL | ||
| REACTOME: OCRL | ||
| ConsensusPathDB | ||
| Pathway Commons: OCRL | ||
| Metabolism | MetaCyc: OCRL | |
| HUMANCyc: OCRL | ||
| Regulation | Ensembl's Regulation: ENSG00000122126 | |
| miRBase: chrX :128,674,251-128,726,530 | ||
| TargetScan: NM_000276 | ||
| cisRED: ENSG00000122126 | ||
| Context | iHOP: OCRL | |
| cancer metabolism search in PubMed: OCRL | ||
| UCL Cancer Institute: OCRL | ||
| Assigned class in ccmGDB | C | |
| Top |
| Phenotypic Information for OCRL(metabolism pathway, cancer, disease, phenome) |
| Cancer | CGAP: OCRL |
| Familial Cancer Database: OCRL | |
| * This gene is included in those cancer gene databases. |
|
|
|
|
|
|
| ||||||||||||||
Oncogene 1 | Significant driver gene in | |||||||||||||||||||
| cf) number; DB name 1 Oncogene; http://nar.oxfordjournals.org/content/35/suppl_1/D721.long, 2 Tumor Suppressor gene; https://bioinfo.uth.edu/TSGene/, 3 Cancer Gene Census; http://www.nature.com/nrc/journal/v4/n3/abs/nrc1299.html, 4 CancerGenes; http://nar.oxfordjournals.org/content/35/suppl_1/D721.long, 5 Network of Cancer Gene; http://ncg.kcl.ac.uk/index.php, 1Therapeutic Vulnerabilities in Cancer; http://cbio.mskcc.org/cancergenomics/statius/ |
| KEGG_INOSITOL_PHOSPHATE_METABOLISM REACTOME_PHOSPHOLIPID_METABOLISM REACTOME_PI_METABOLISM REACTOME_METABOLISM_OF_LIPIDS_AND_LIPOPROTEINS | |
| OMIM | |
| Orphanet | |
| Disease | KEGG Disease: OCRL |
| MedGen: OCRL (Human Medical Genetics with Condition) | |
| ClinVar: OCRL | |
| Phenotype | MGI: OCRL (International Mouse Phenotyping Consortium) |
| PhenomicDB: OCRL | |
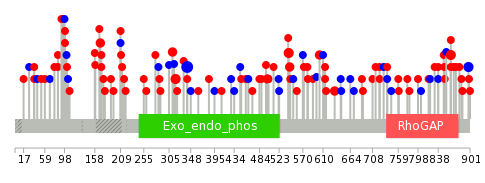
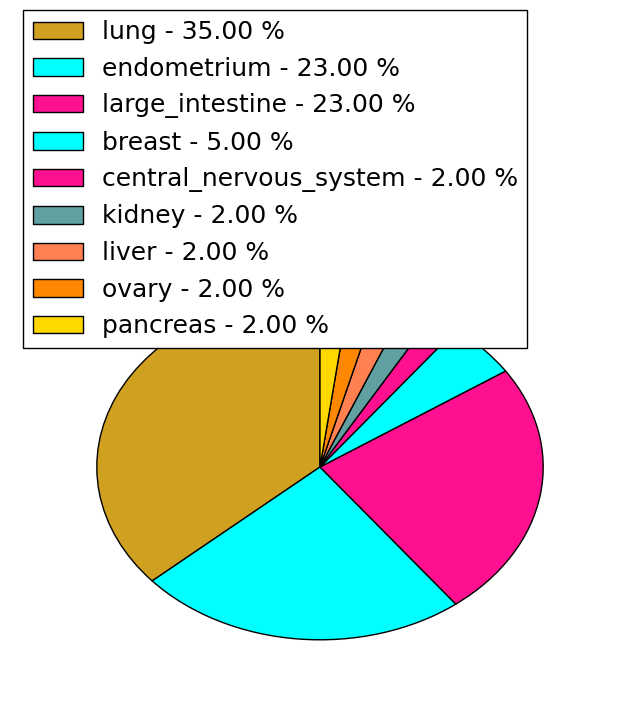
| Mutations for OCRL |
| * Under tables are showing count per each tissue to give us broad intuition about tissue specific mutation patterns.You can go to the detailed page for each mutation database's web site. |
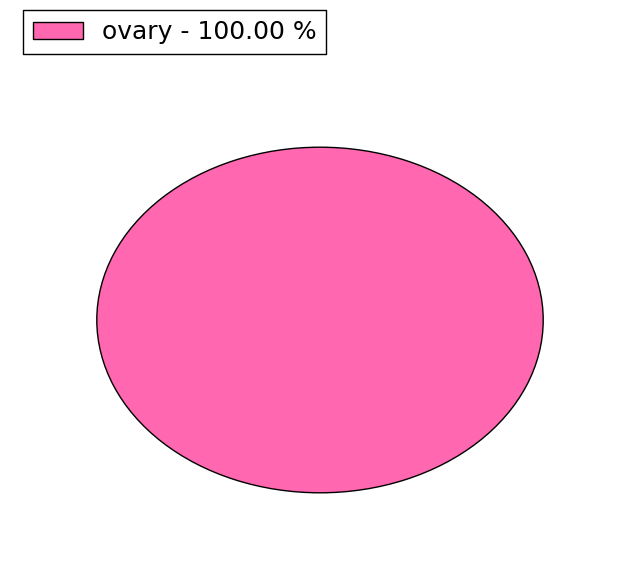
| There's no structural variation information in COSMIC data for this gene. |
| * From mRNA Sanger sequences, Chitars2.0 arranged chimeric transcripts. This table shows OCRL related fusion information. |
| ID | Head Gene | Tail Gene | Accession | Gene_a | qStart_a | qEnd_a | Chromosome_a | tStart_a | tEnd_a | Gene_a | qStart_a | qEnd_a | Chromosome_a | tStart_a | tEnd_a |
| Top |
| There's no copy number variation information in COSMIC data for this gene. |
| Top |
|
 |
| Top |
| Stat. for Non-Synonymous SNVs (# total SNVs=88) | (# total SNVs=39) |
 |  |
(# total SNVs=1) | (# total SNVs=0) |
 |
| Top |
| * When you move the cursor on each content, you can see more deailed mutation information on the Tooltip. Those are primary_site,primary_histology,mutation(aa),pubmedID. |
| GRCh37 position | Mutation(aa) | Unique sampleID count |
| chr23:128696444-128696444 | p.T341T | 5 |
| chr23:128724129-128724129 | p.L863P | 4 |
| chr23:128696373-128696373 | p.R318C | 3 |
| chr23:128724235-128724235 | p.S898S | 3 |
| chr23:128696421-128696421 | p.R334* | 3 |
| chr23:128709967-128709967 | p.P603S | 2 |
| chr23:128709144-128709144 | p.R544W | 2 |
| chr23:128674794-128674794 | p.Q38R | 2 |
| chr23:128692676-128692676 | p.Q169L | 2 |
| chr23:128674799-128674799 | p.E40* | 2 |
| Top |
|
 |
| Point Mutation/ Tissue ID | 1 | 2 | 3 | 4 | 5 | 6 | 7 | 8 | 9 | 10 | 11 | 12 | 13 | 14 | 15 | 16 | 17 | 18 | 19 | 20 |
| # sample | 7 | 2 | 25 | 3 | 3 | 2 | 13 | 11 | 2 | 1 | 4 | 4 | 1 | 14 | ||||||
| # mutation | 7 | 2 | 22 | 3 | 3 | 2 | 13 | 12 | 2 | 1 | 6 | 5 | 2 | 20 | ||||||
| nonsynonymous SNV | 6 | 2 | 17 | 2 | 3 | 1 | 10 | 6 | 1 | 3 | 5 | 2 | 12 | |||||||
| synonymous SNV | 1 | 5 | 1 | 1 | 3 | 6 | 1 | 1 | 3 | 8 |
| cf) Tissue ID; Tissue type (1; BLCA[Bladder Urothelial Carcinoma], 2; BRCA[Breast invasive carcinoma], 3; CESC[Cervical squamous cell carcinoma and endocervical adenocarcinoma], 4; COAD[Colon adenocarcinoma], 5; GBM[Glioblastoma multiforme], 6; Glioma Low Grade, 7; HNSC[Head and Neck squamous cell carcinoma], 8; KICH[Kidney Chromophobe], 9; KIRC[Kidney renal clear cell carcinoma], 10; KIRP[Kidney renal papillary cell carcinoma], 11; LAML[Acute Myeloid Leukemia], 12; LUAD[Lung adenocarcinoma], 13; LUSC[Lung squamous cell carcinoma], 14; OV[Ovarian serous cystadenocarcinoma ], 15; PAAD[Pancreatic adenocarcinoma], 16; PRAD[Prostate adenocarcinoma], 17; SKCM[Skin Cutaneous Melanoma], 18:STAD[Stomach adenocarcinoma], 19:THCA[Thyroid carcinoma], 20:UCEC[Uterine Corpus Endometrial Carcinoma]) |
| Top |
| * We represented just top 10 SNVs. When you move the cursor on each content, you can see more deailed mutation information on the Tooltip. Those are primary_site, primary_histology, mutation(aa), pubmedID. |
| Genomic Position | Mutation(aa) | Unique sampleID count |
| chrX:128696444 | p.T341T,OCRL | 4 |
| chrX:128724129 | p.L855P,OCRL | 4 |
| chrX:128709136 | p.S633Y,OCRL | 2 |
| chrX:128710312 | p.R541Q,OCRL | 2 |
| chrX:128709967 | p.P603S,OCRL | 2 |
| chrX:128724235 | p.S890S,OCRL | 2 |
| chrX:128691385 | p.W614C,OCRL | 1 |
| chrX:128699816 | p.P769T,OCRL | 1 |
| chrX:128721003 | p.Q38L,OCRL | 1 |
| chrX:128722987 | p.D893N,OCRL | 1 |
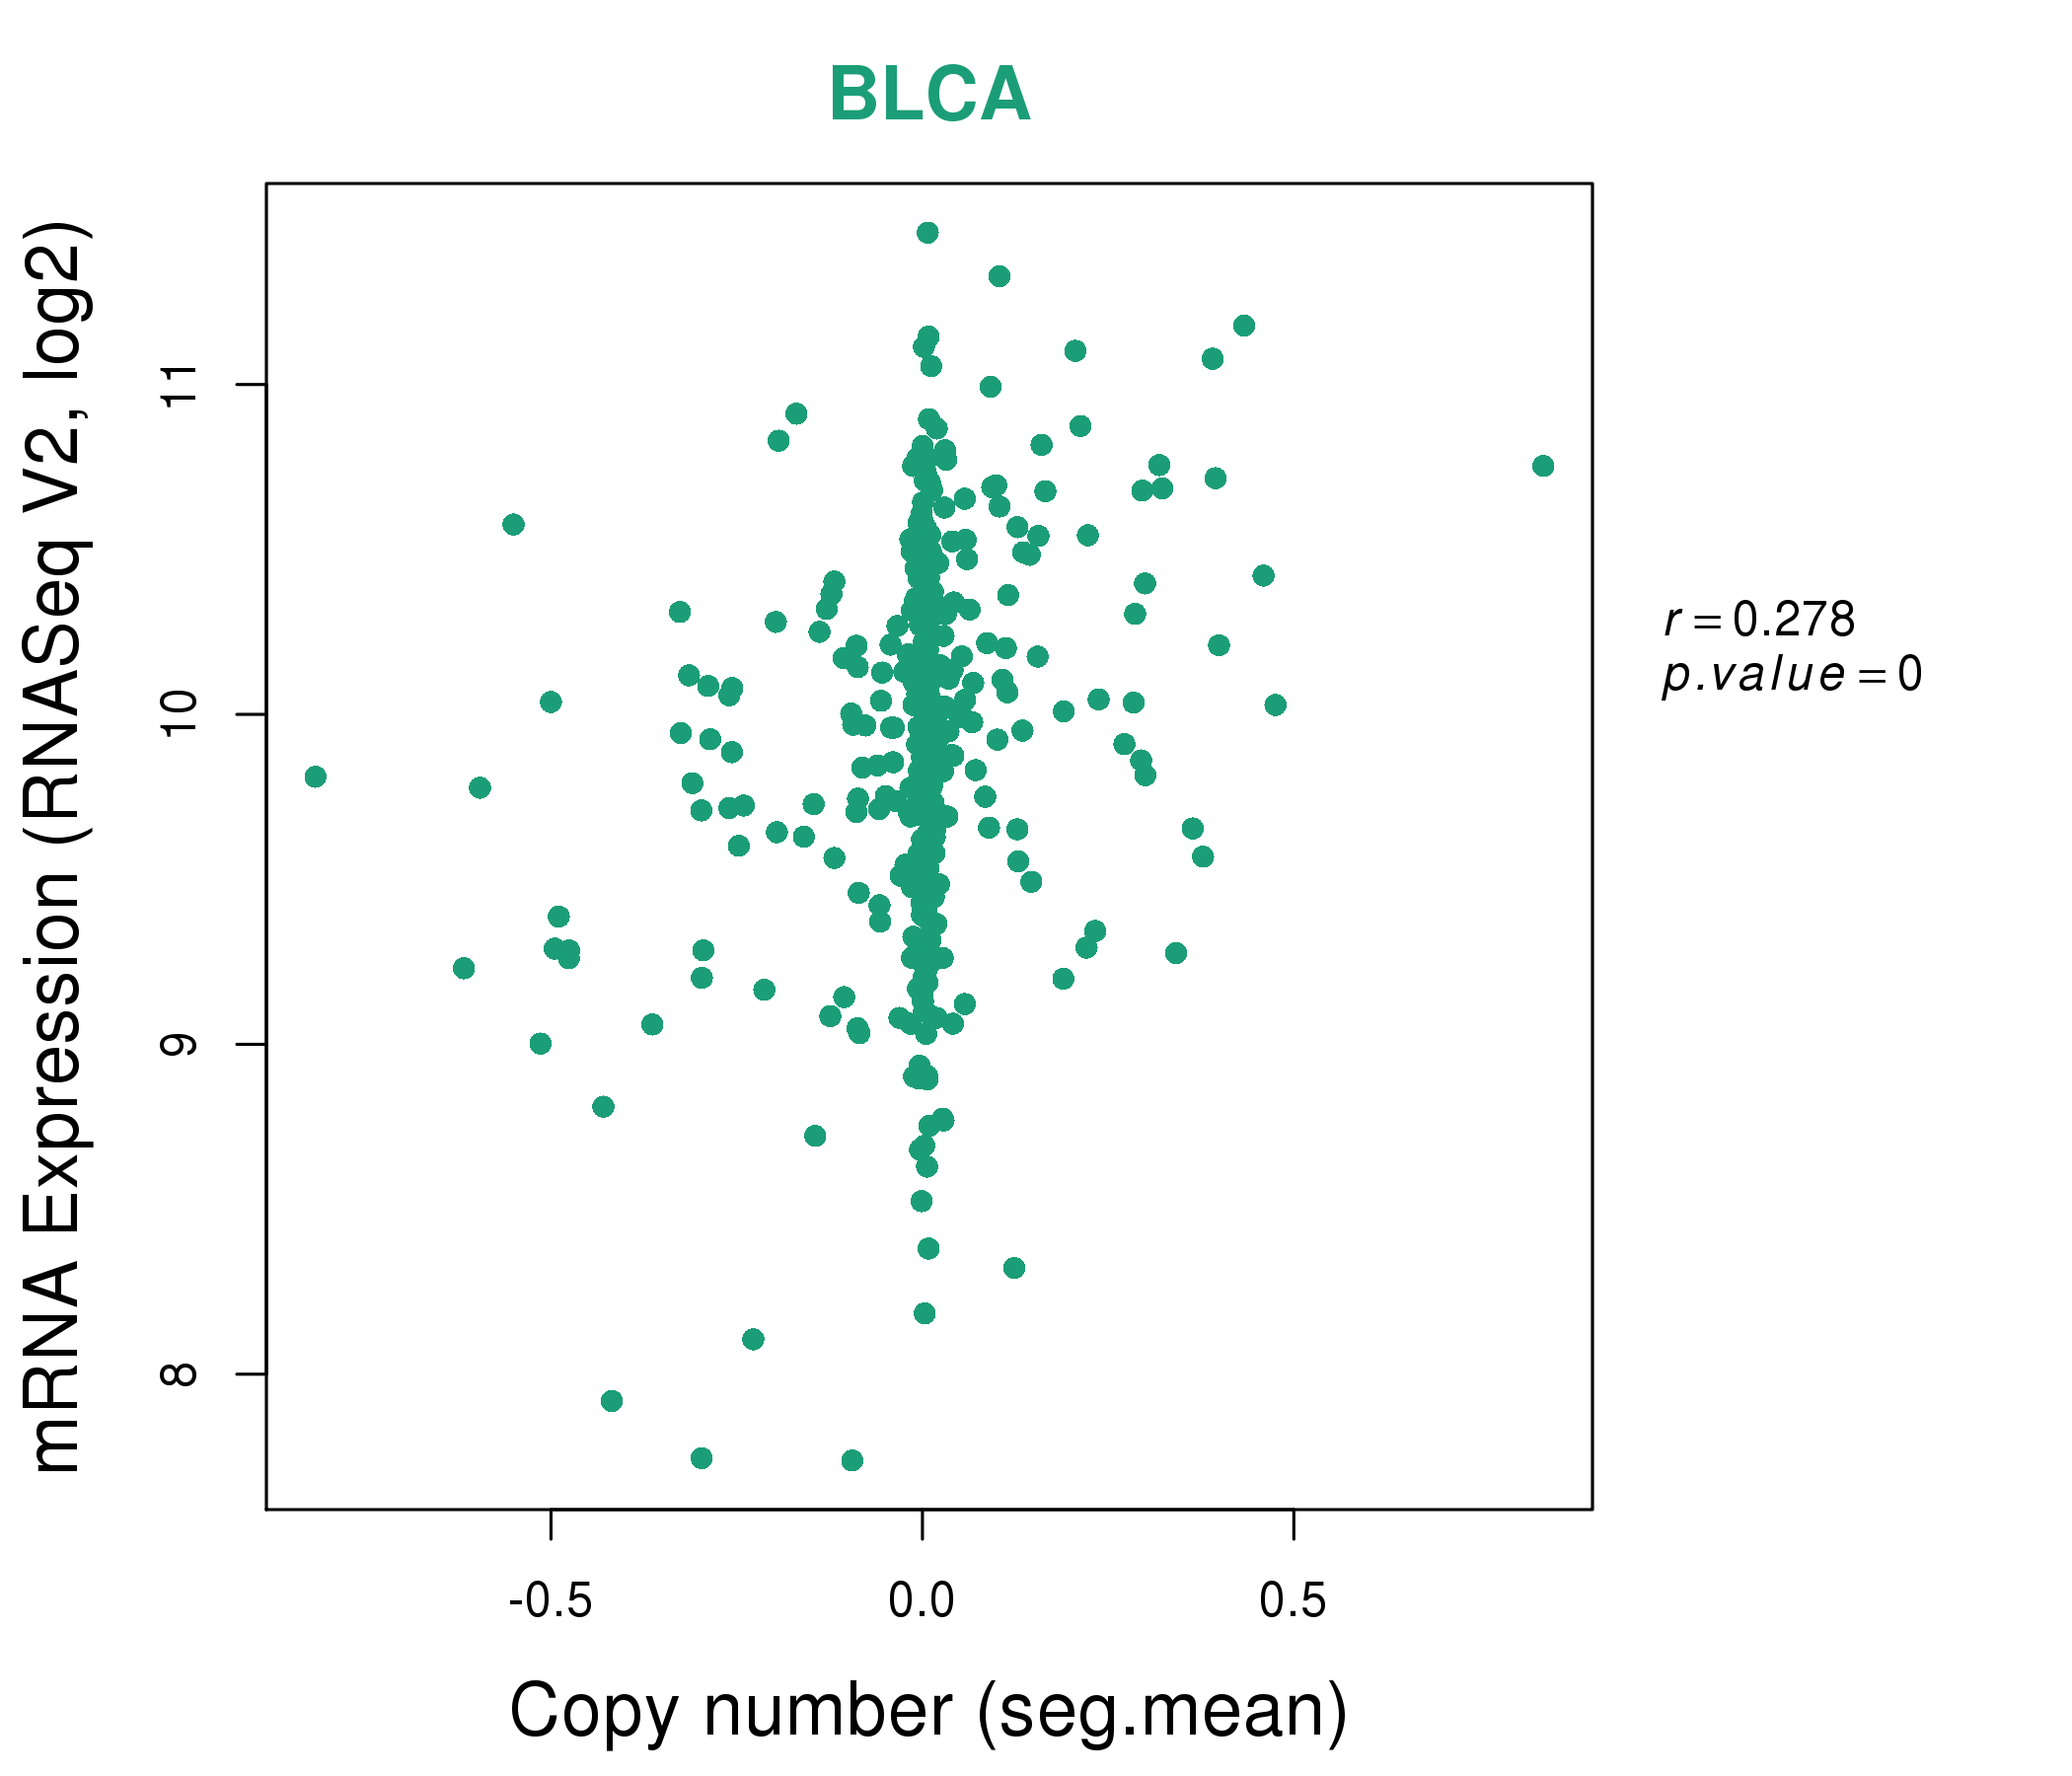
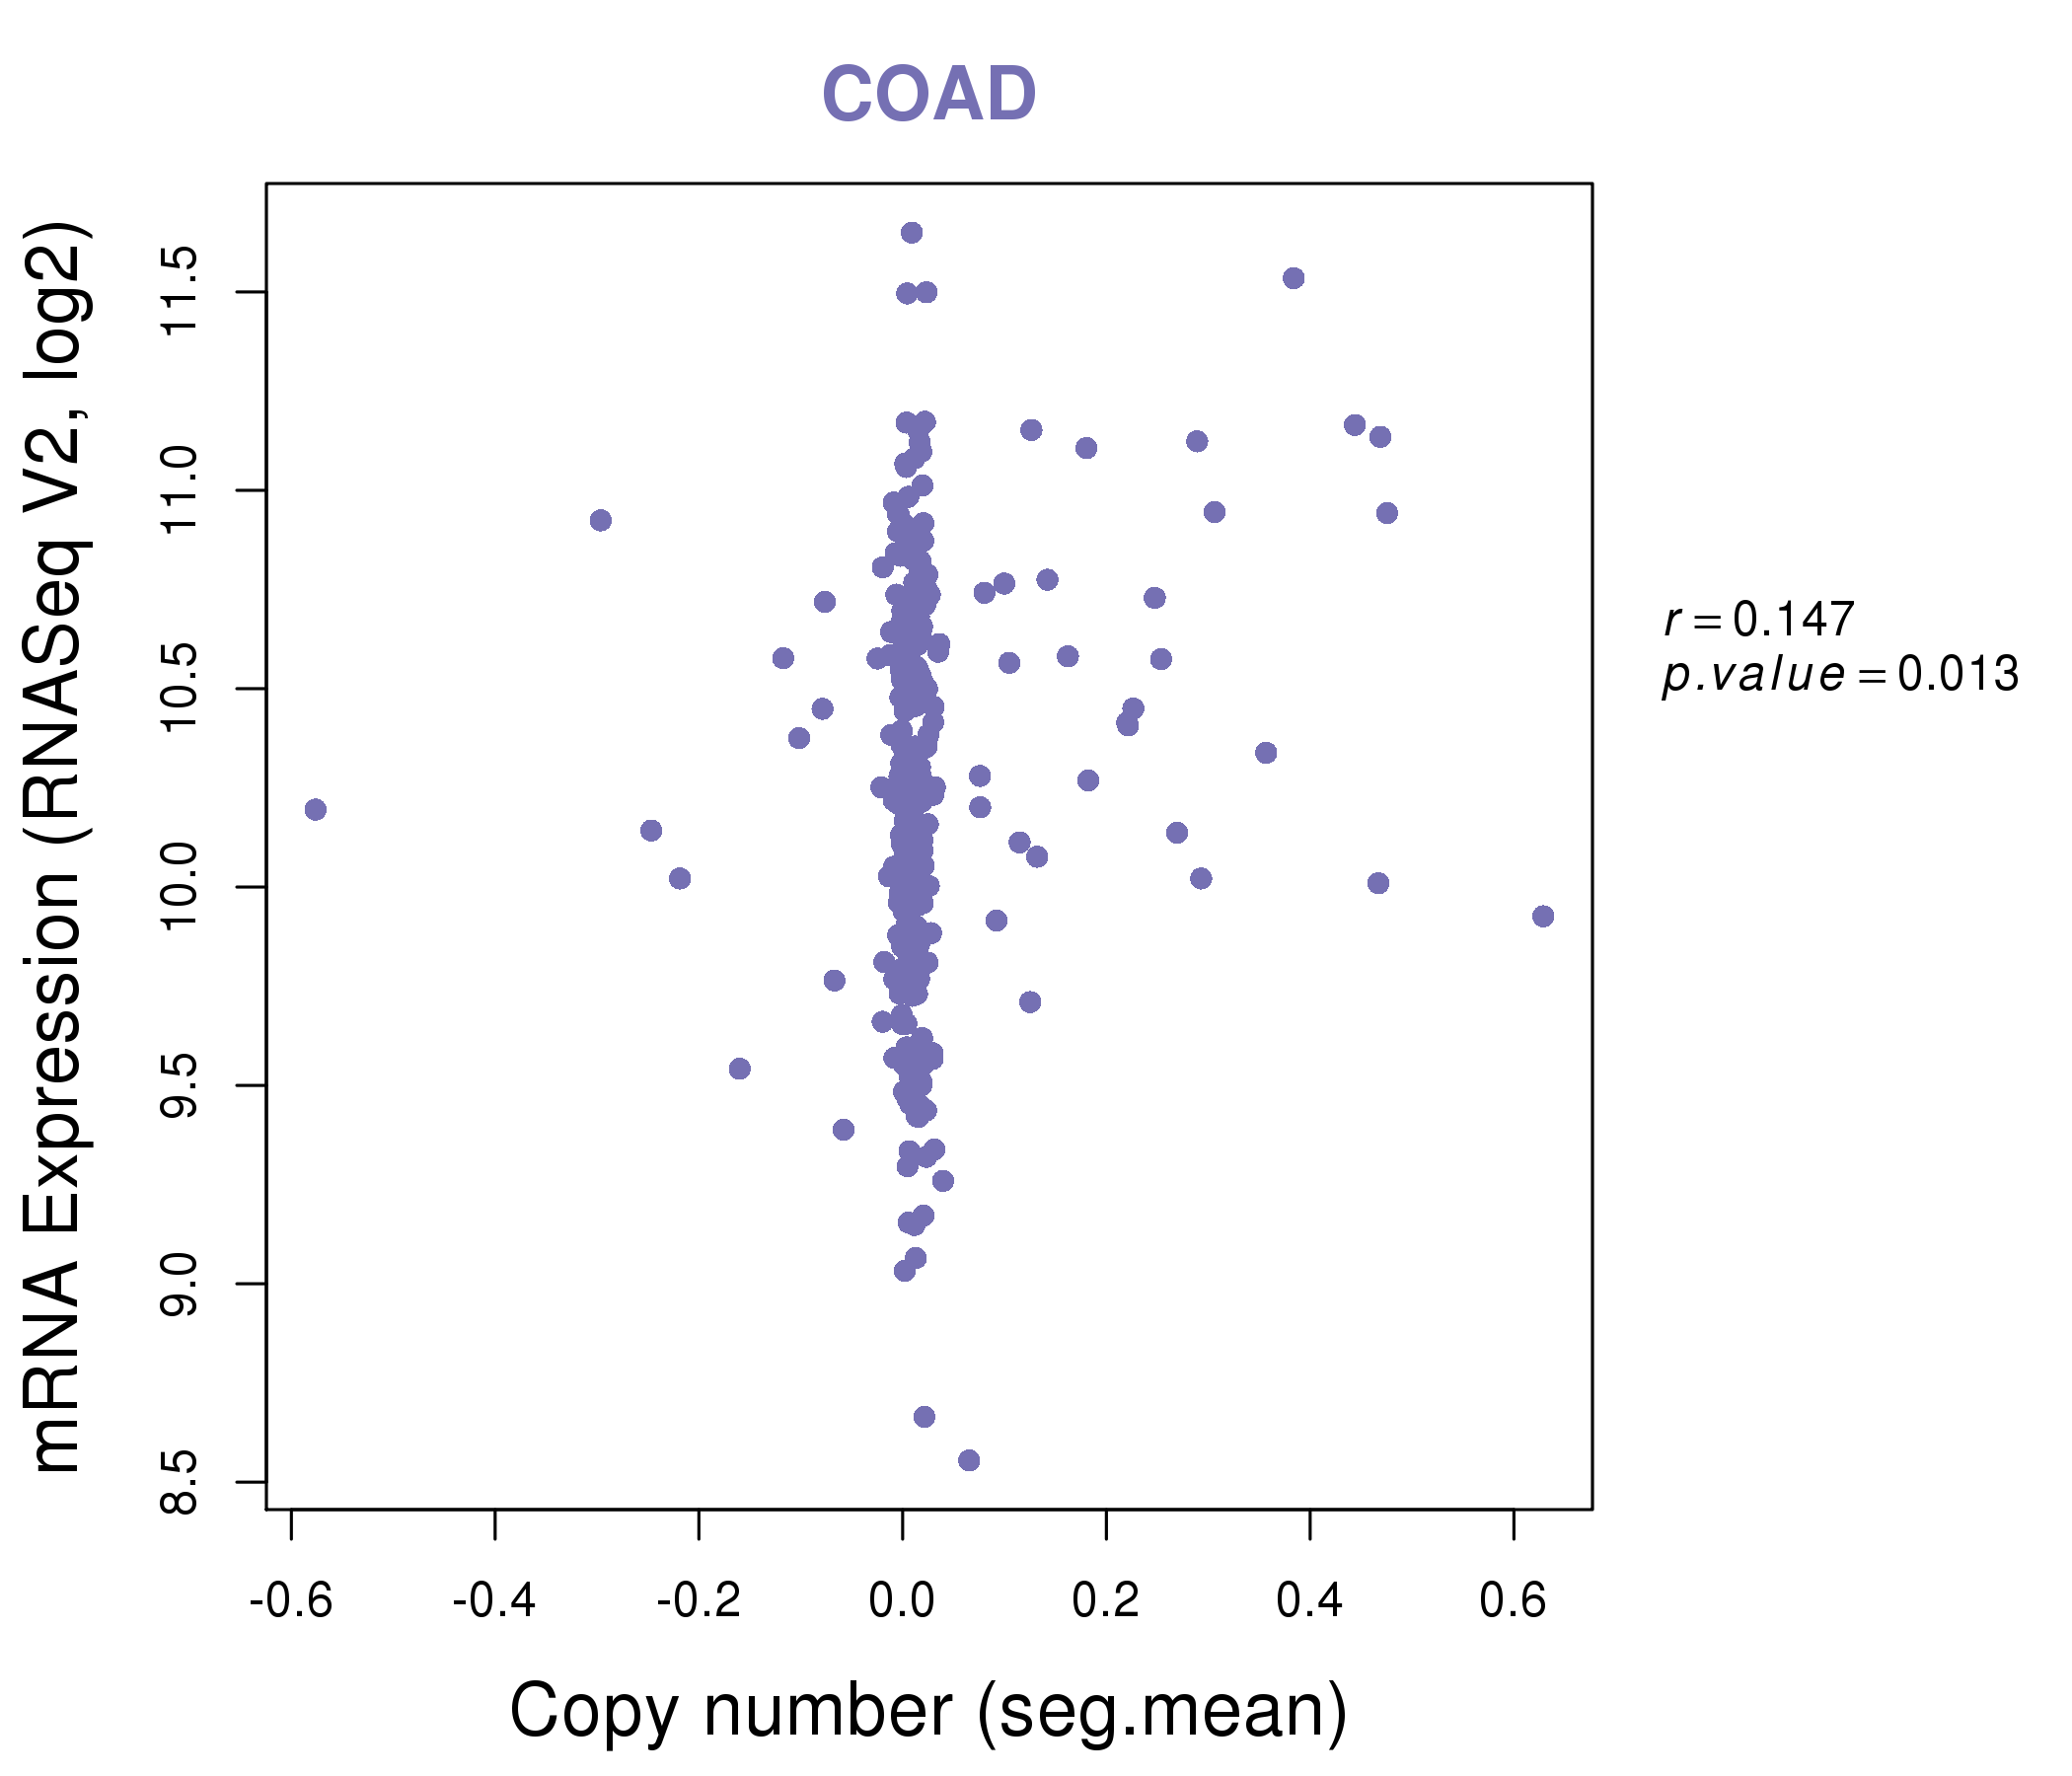
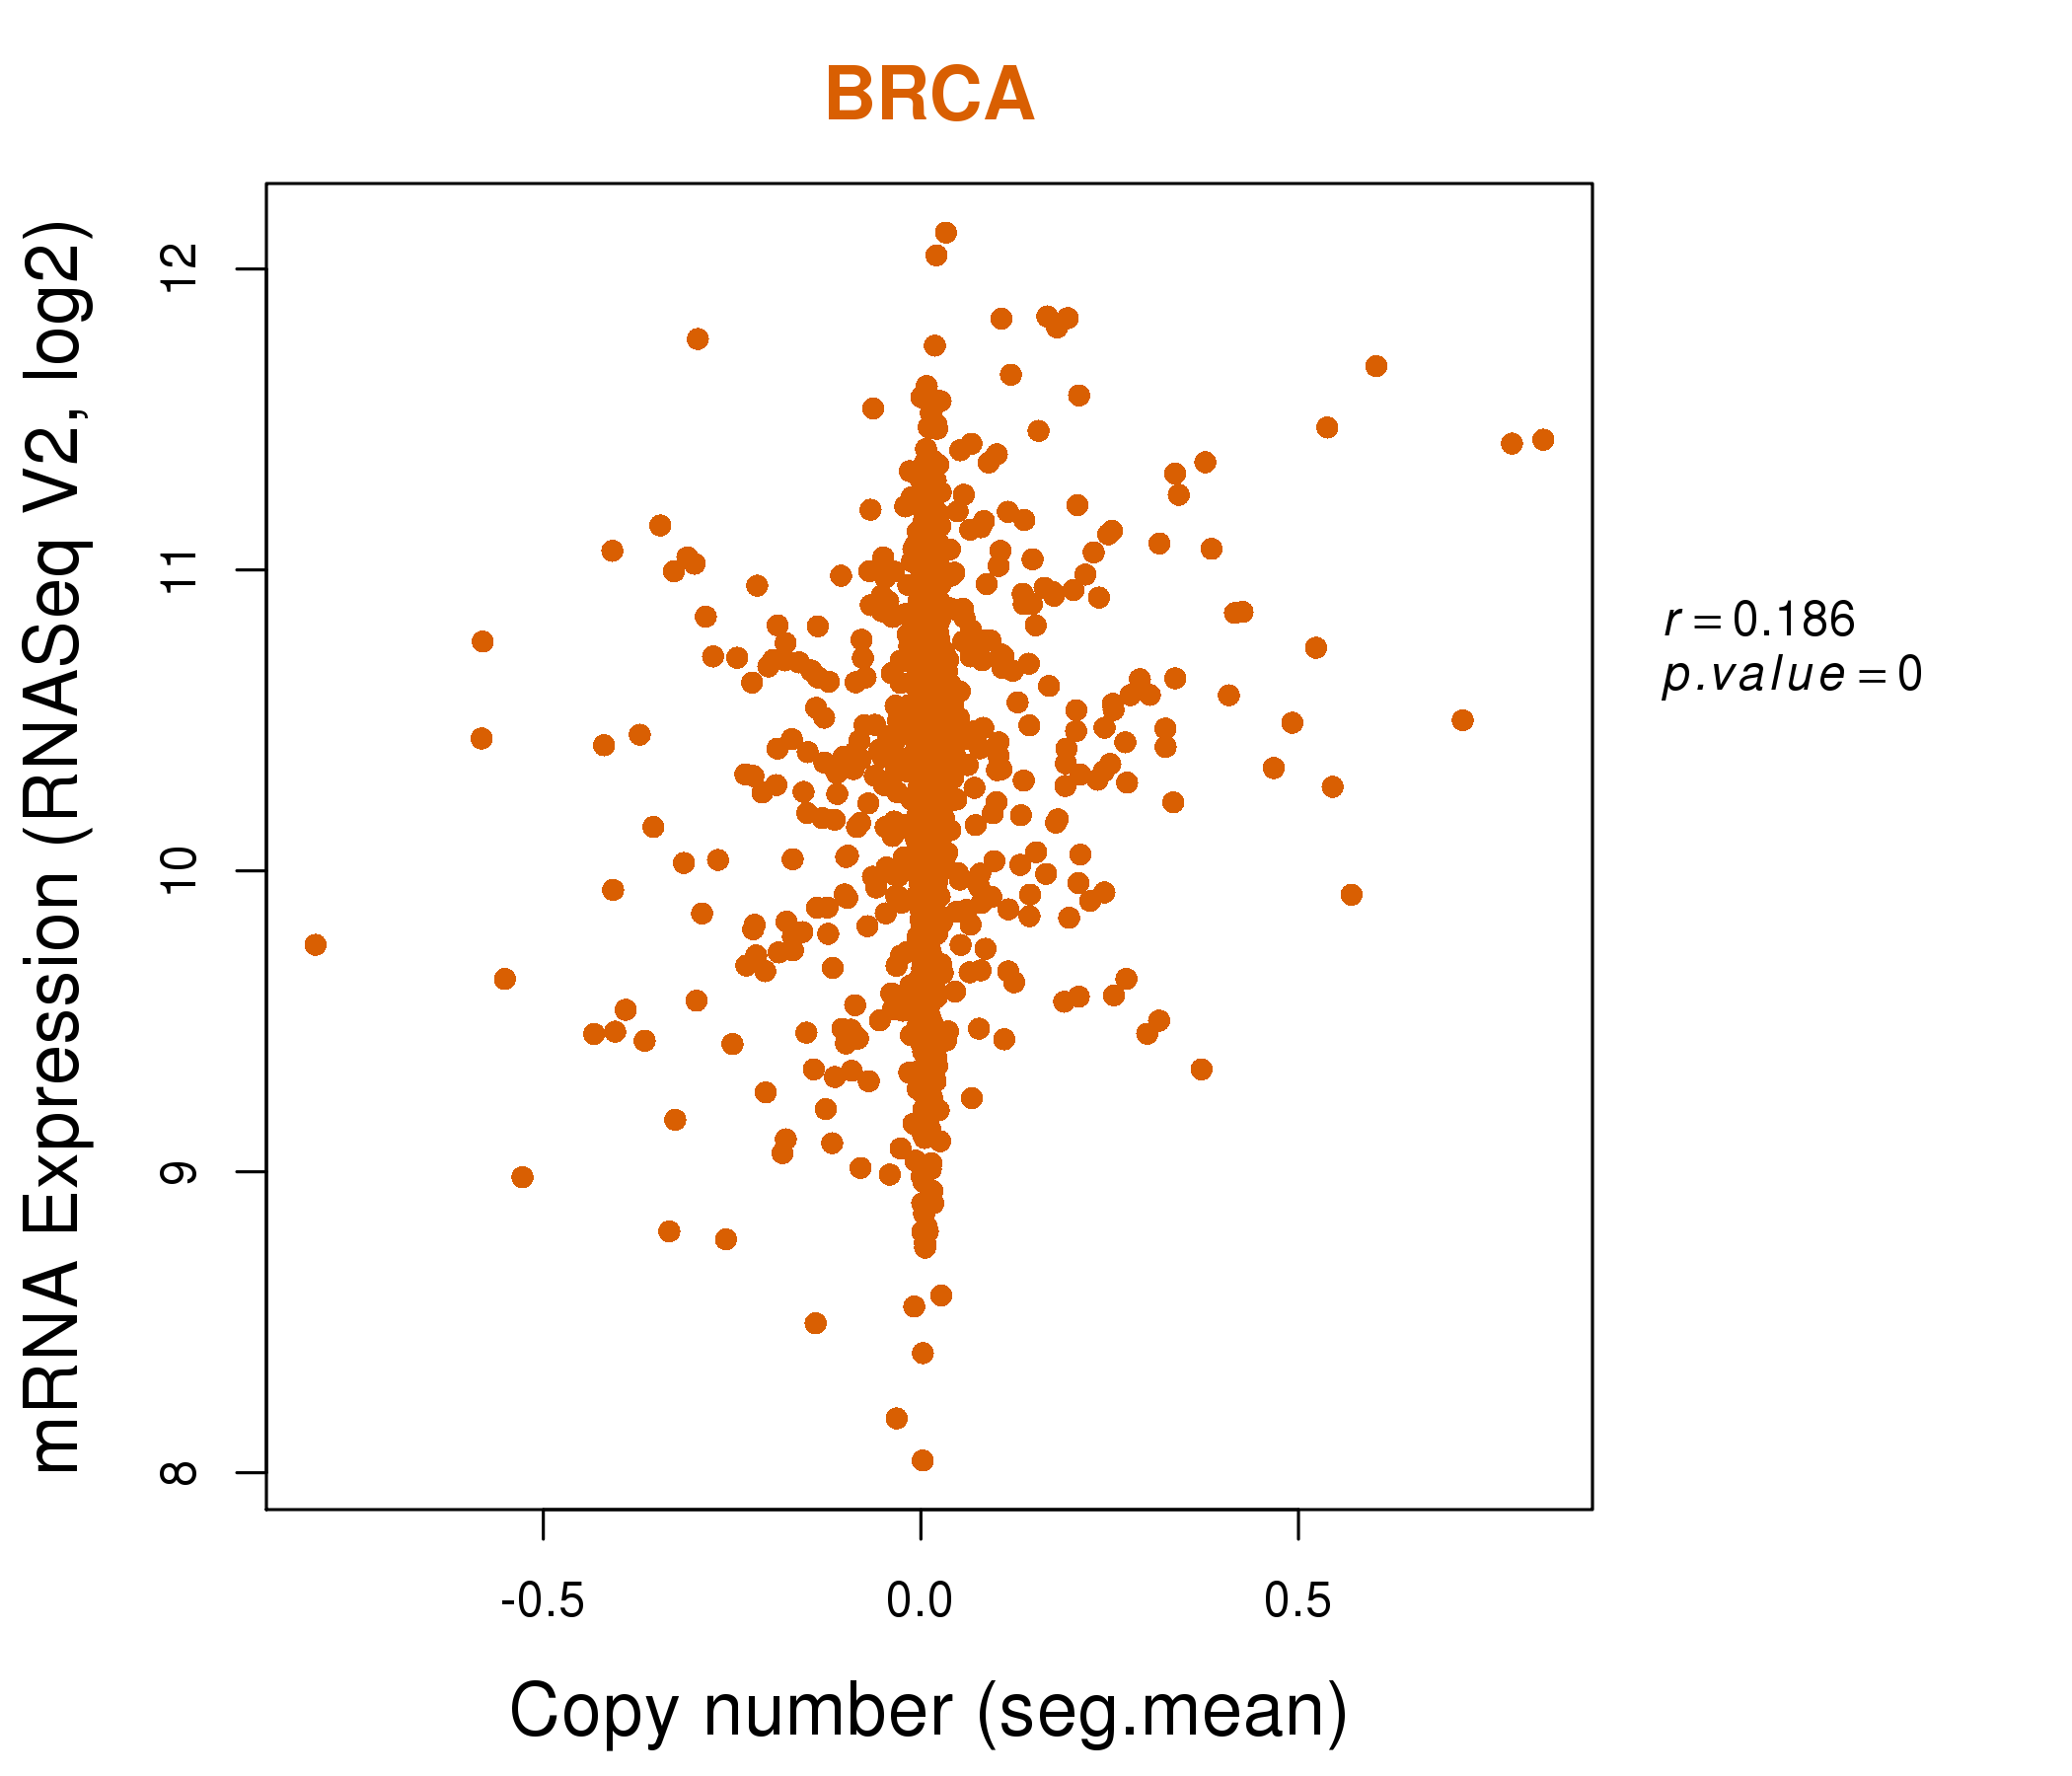
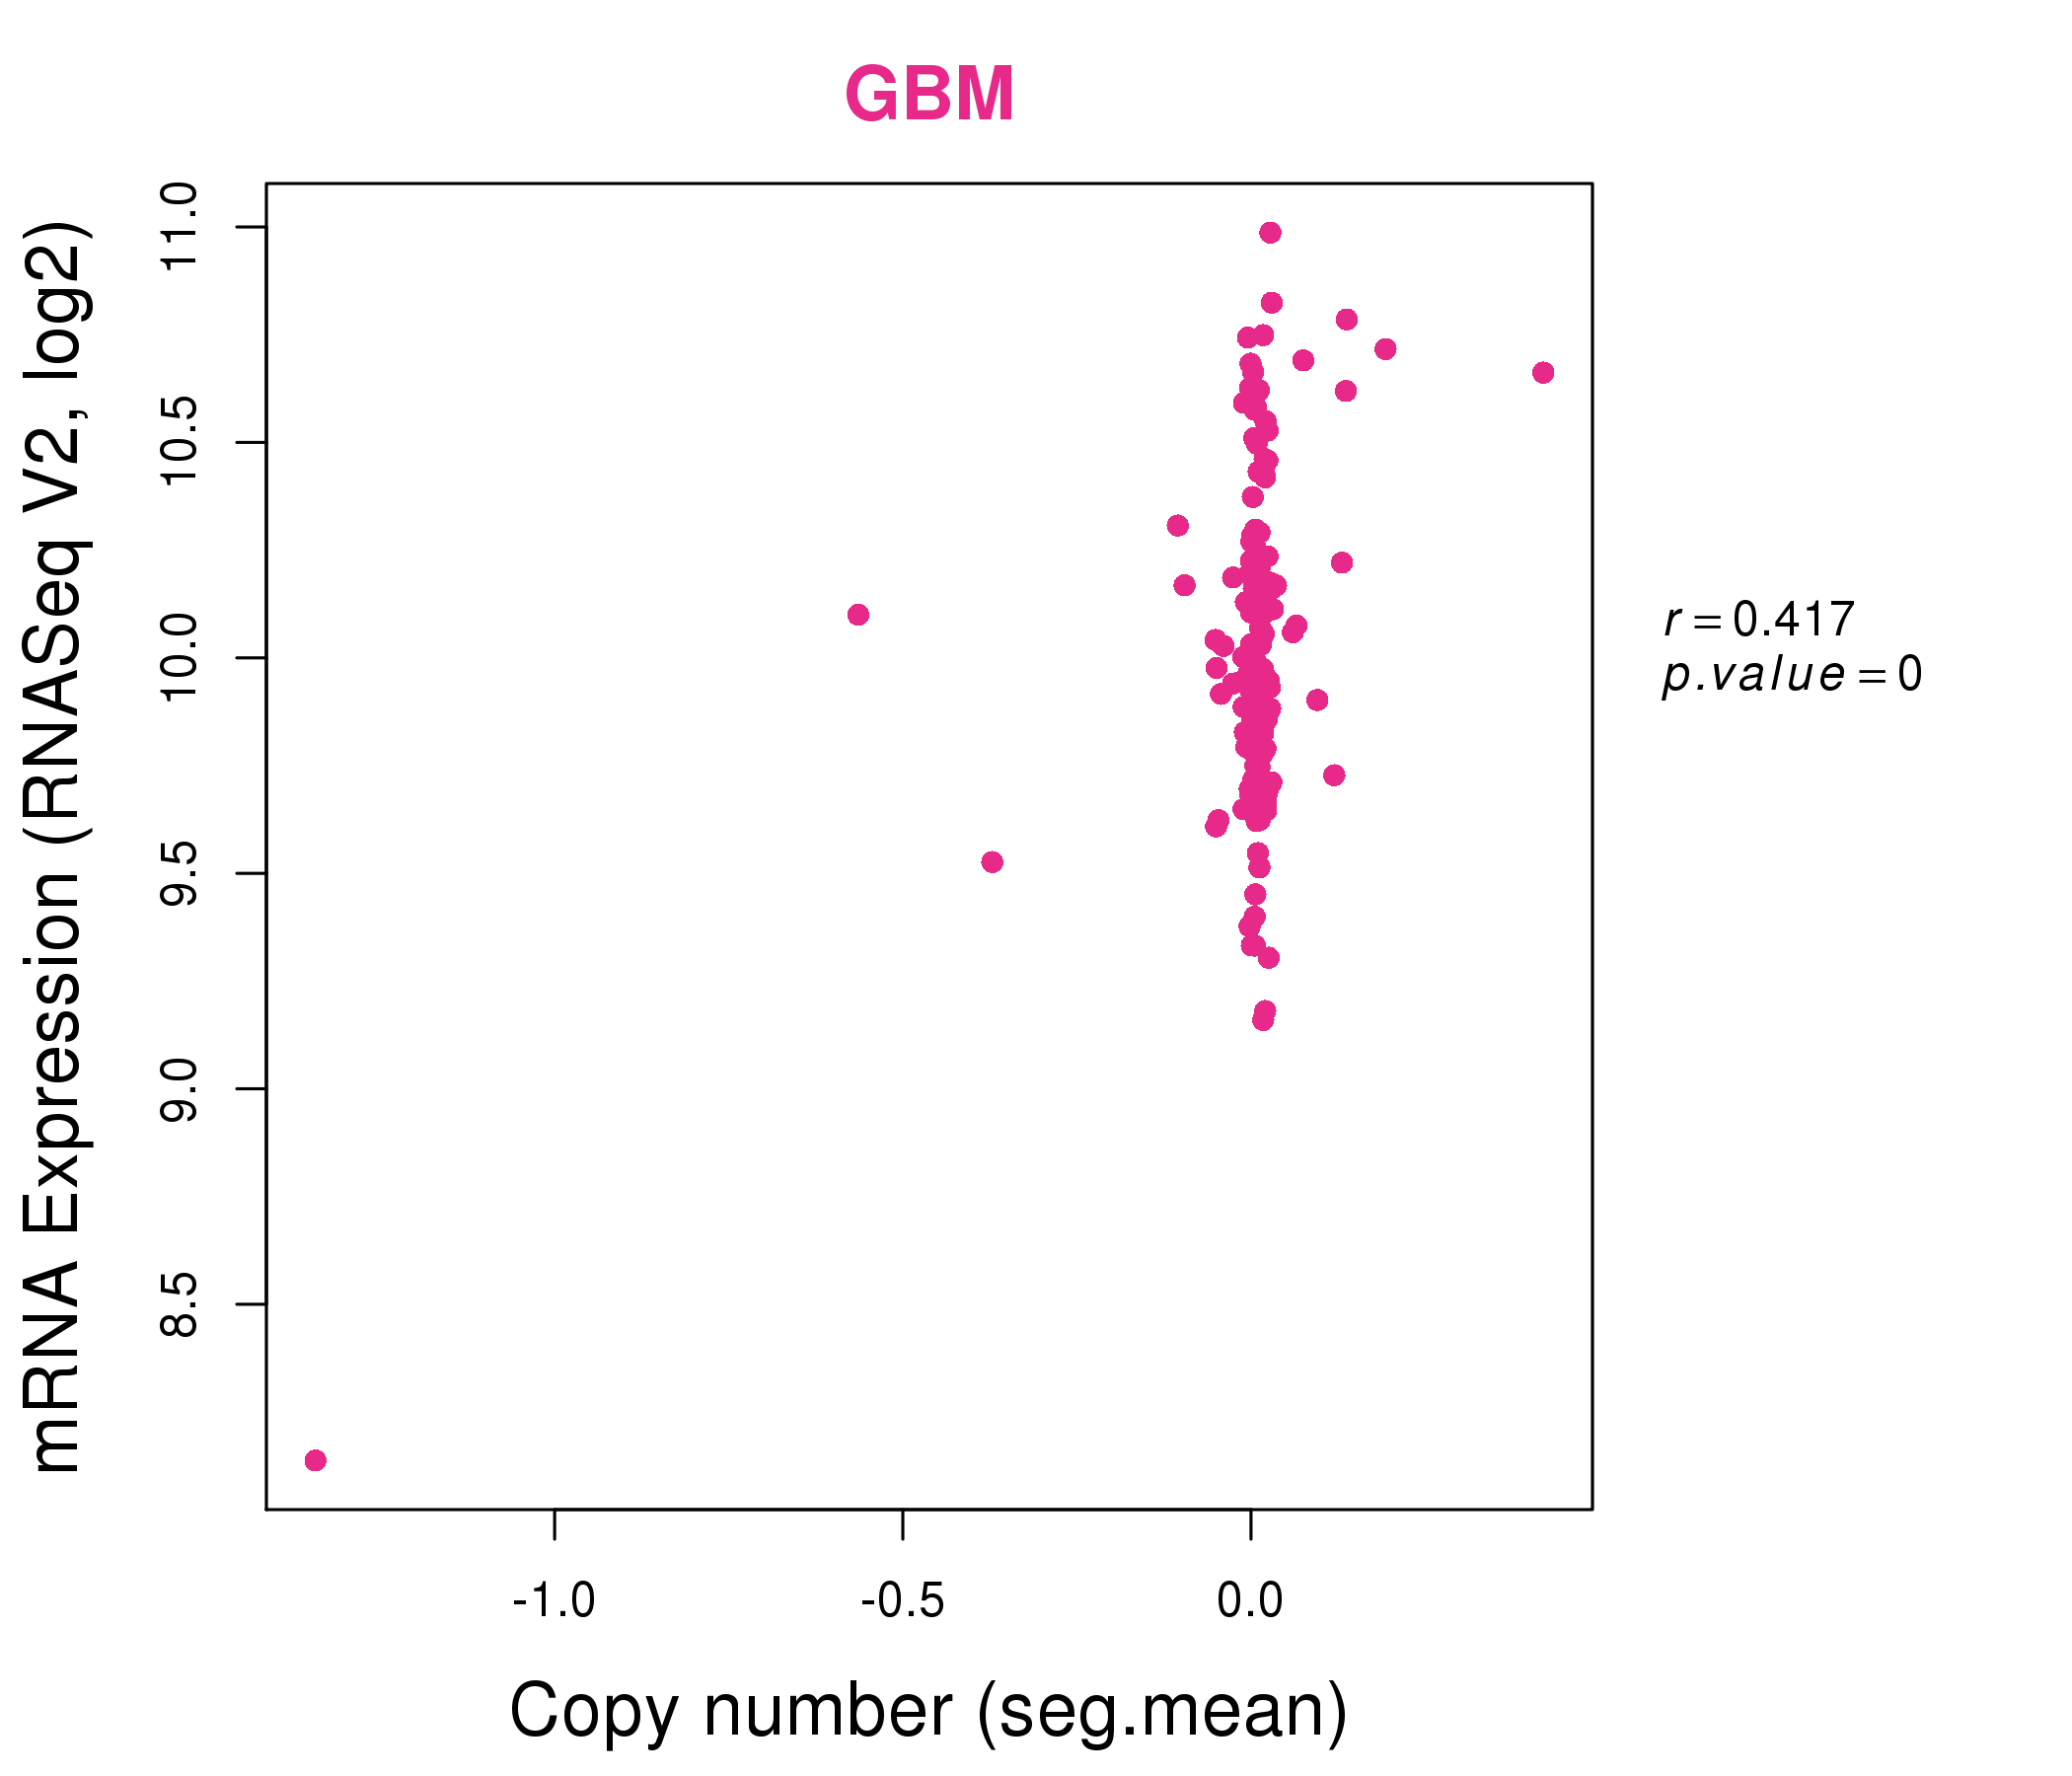
| * Copy number data were extracted from TCGA using R package TCGA-Assembler. The URLs of all public data files on TCGA DCC data server were gathered on Jan-05-2015. Function ProcessCNAData in TCGA-Assembler package was used to obtain gene-level copy number value which is calculated as the average copy number of the genomic region of a gene. |
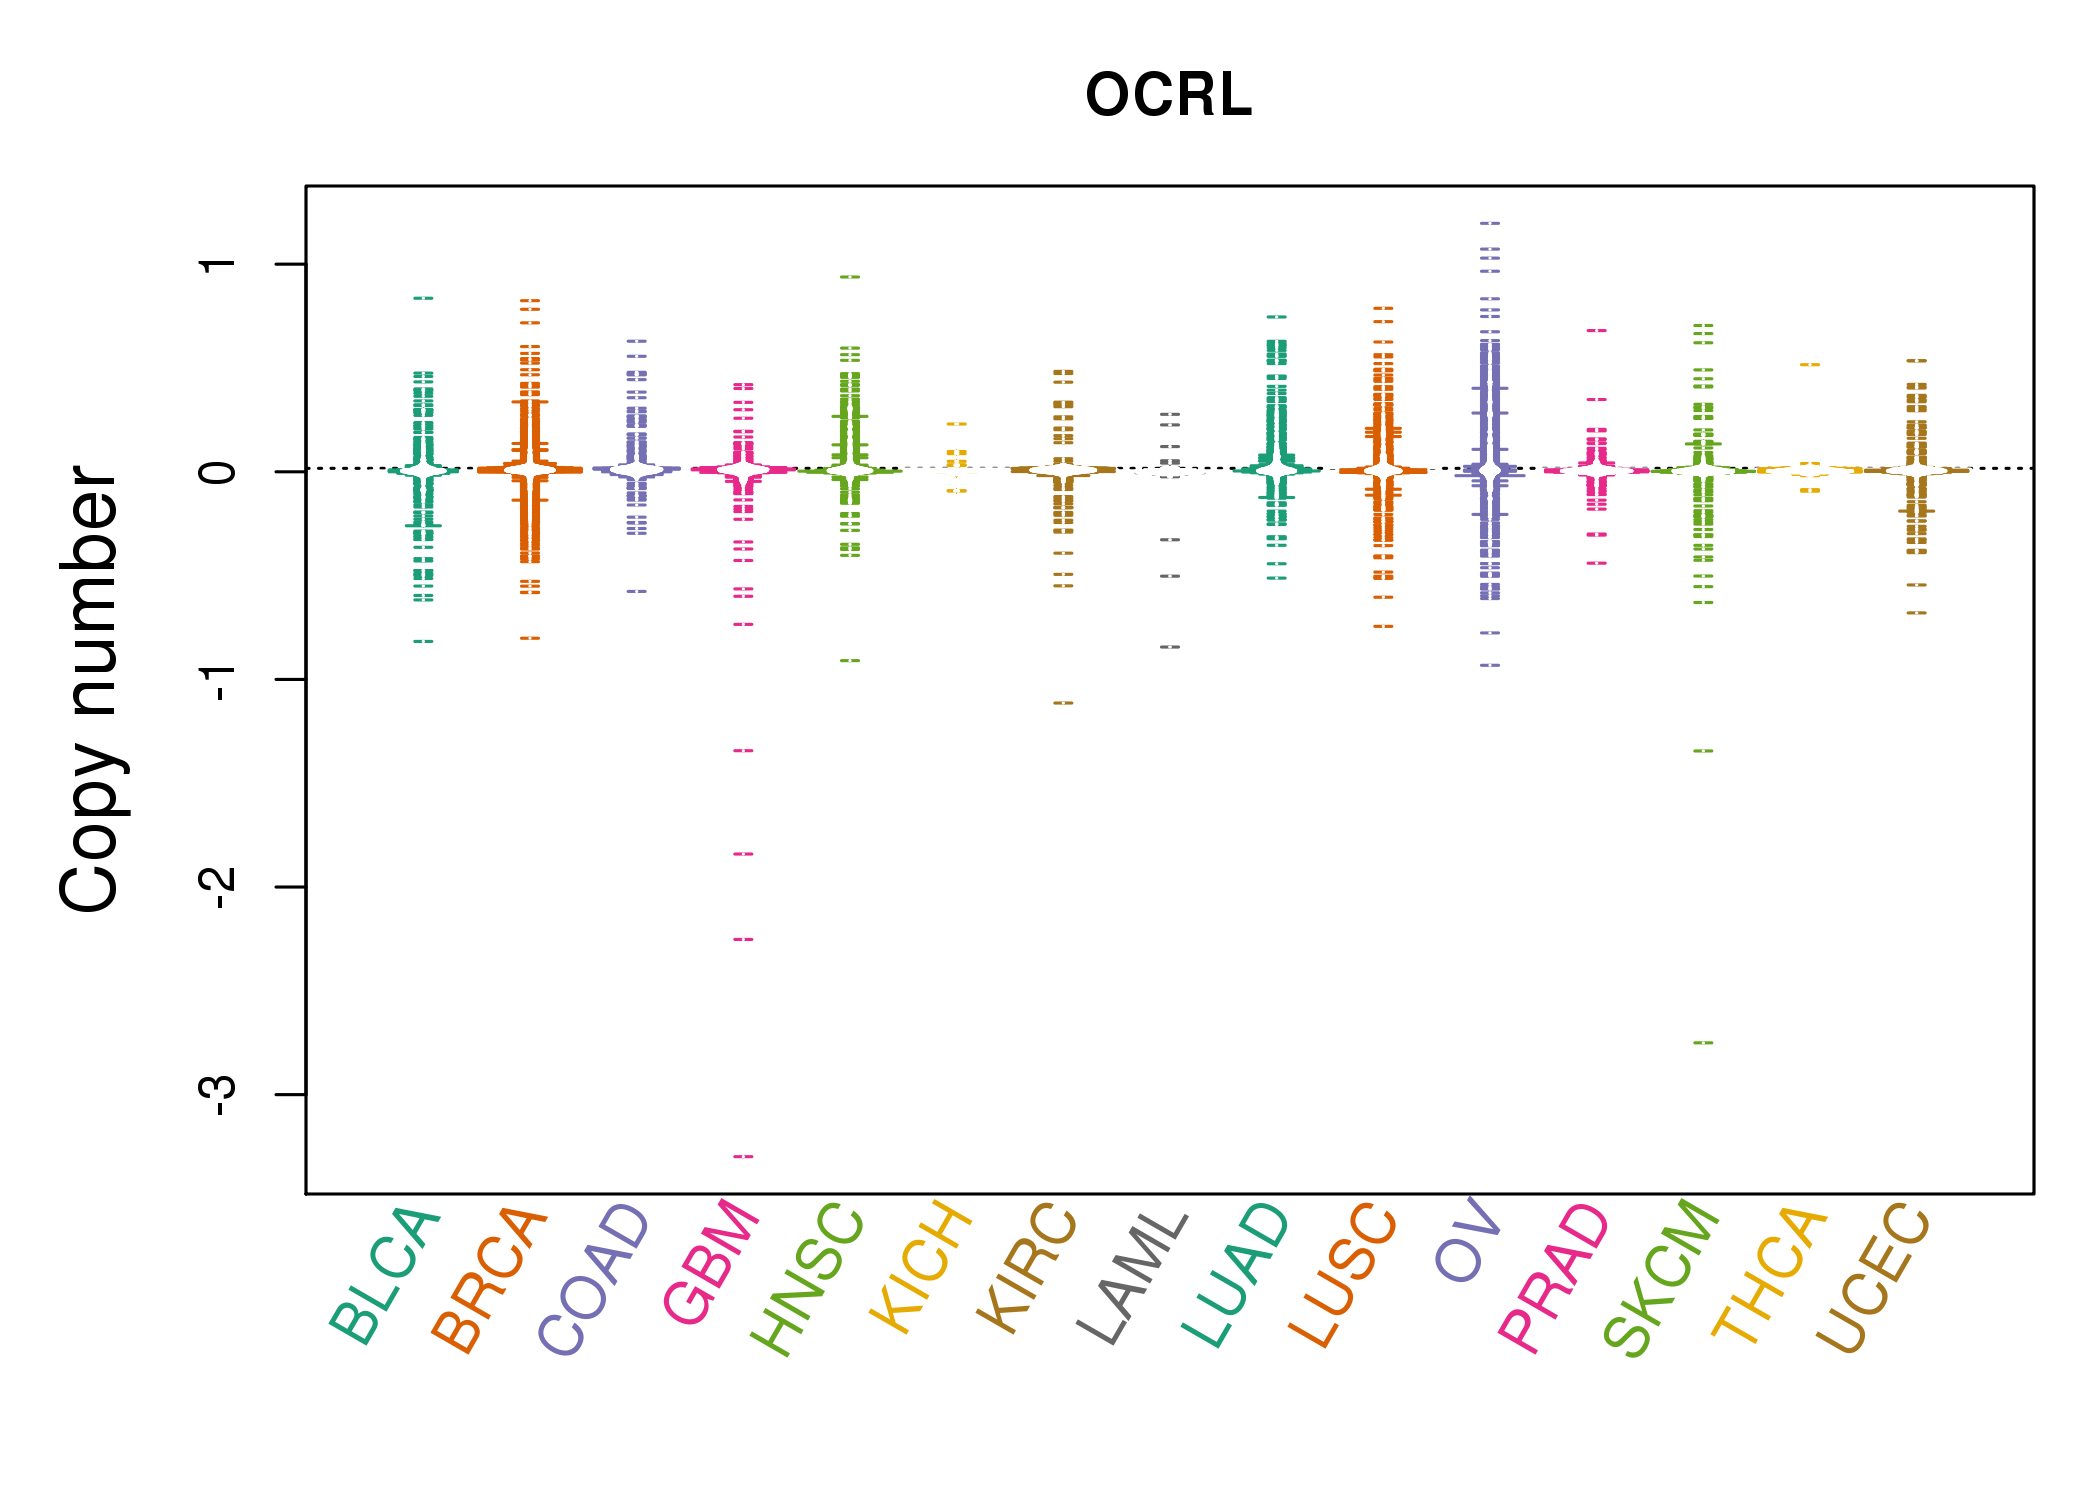 |
| cf) Tissue ID[Tissue type]: BLCA[Bladder Urothelial Carcinoma], BRCA[Breast invasive carcinoma], CESC[Cervical squamous cell carcinoma and endocervical adenocarcinoma], COAD[Colon adenocarcinoma], GBM[Glioblastoma multiforme], Glioma Low Grade, HNSC[Head and Neck squamous cell carcinoma], KICH[Kidney Chromophobe], KIRC[Kidney renal clear cell carcinoma], KIRP[Kidney renal papillary cell carcinoma], LAML[Acute Myeloid Leukemia], LUAD[Lung adenocarcinoma], LUSC[Lung squamous cell carcinoma], OV[Ovarian serous cystadenocarcinoma ], PAAD[Pancreatic adenocarcinoma], PRAD[Prostate adenocarcinoma], SKCM[Skin Cutaneous Melanoma], STAD[Stomach adenocarcinoma], THCA[Thyroid carcinoma], UCEC[Uterine Corpus Endometrial Carcinoma] |
| Top |
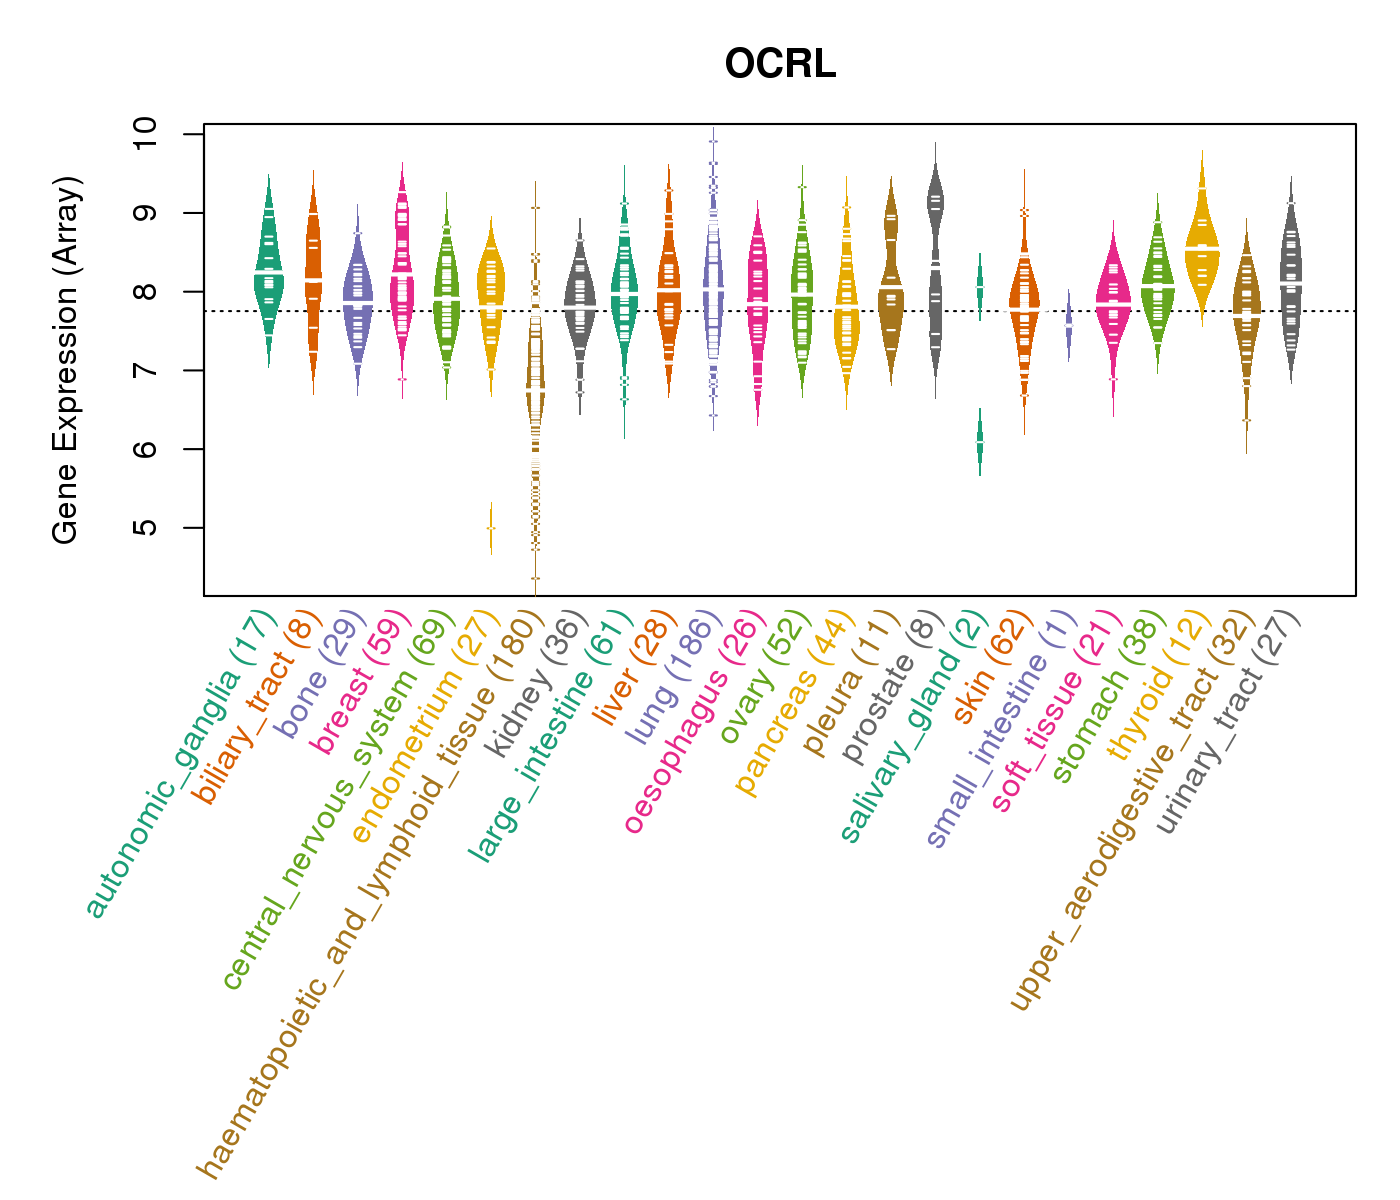
| Gene Expression for OCRL |
| * CCLE gene expression data were extracted from CCLE_Expression_Entrez_2012-10-18.res: Gene-centric RMA-normalized mRNA expression data. |
 |
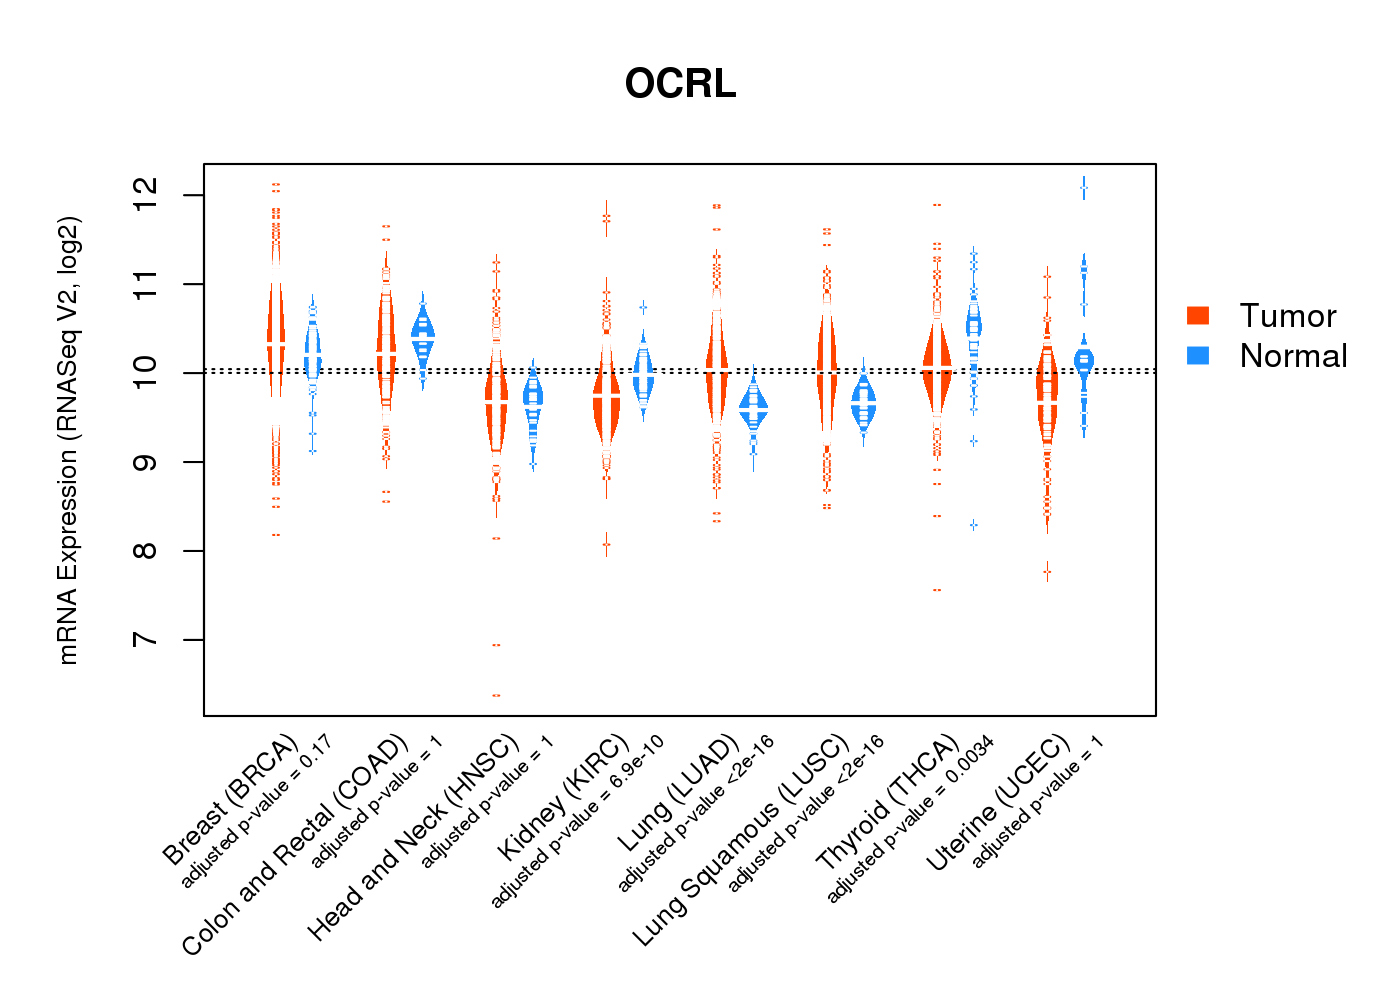
| * Normalized gene expression data of RNASeqV2 was extracted from TCGA using R package TCGA-Assembler. The URLs of all public data files on TCGA DCC data server were gathered at Jan-05-2015. Only eight cancer types have enough normal control samples for differential expression analysis. (t test, adjusted p<0.05 (using Benjamini-Hochberg FDR)) |
 |
| Top |
| * This plots show the correlation between CNV and gene expression. |
: Open all plots for all cancer types
 |
|
 |
|
| Top |
| Gene-Gene Network Information |
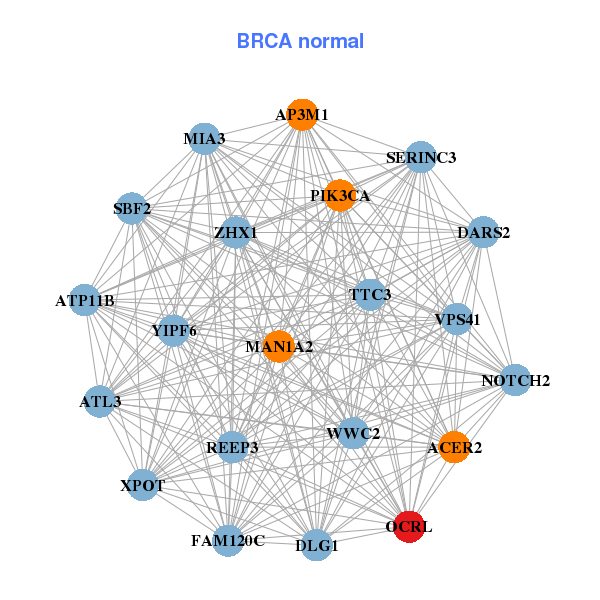
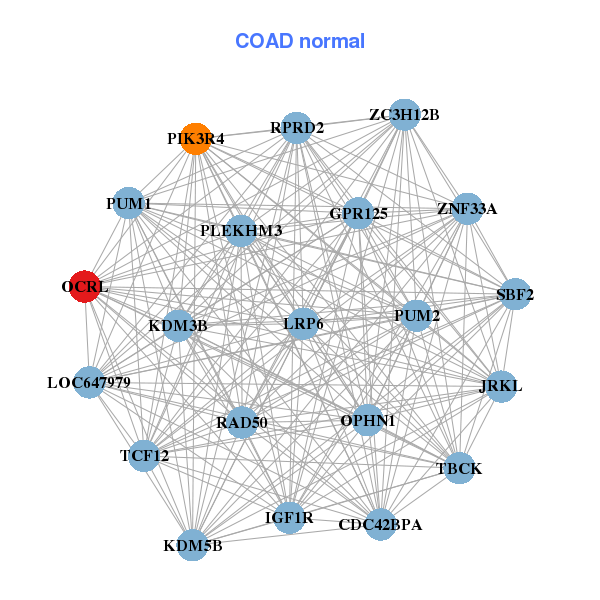
| * Co-Expression network figures were drawn using R package igraph. Only the top 20 genes with the highest correlations were shown. Red circle: input gene, orange circle: cell metabolism gene, sky circle: other gene |
: Open all plots for all cancer types
 |
|
| ANKIB1,APOOL,CUL4B,FAM122B,FAM199X,FBXW11,FMR1, KIF3B,LARP4,OCRL,PANK3,PEX1,PHF6,RBM41, RLIM,SMARCA1,STAG2,THOC2,XIAP,YIPF6,ZNF449 | ACER2,AP3M1,ATL3,ATP11B,DARS2,DLG1,FAM120C, MAN1A2,MIA3,NOTCH2,OCRL,PIK3CA,REEP3,SBF2, SERINC3,TTC3,VPS41,WWC2,XPOT,YIPF6,ZHX1 |
 |
|
| ARMCX5,BRCC3,CXorf56,ENOX2,FAM199X,MTMR1,OCRL, PHF6,PHF8,RBM41,RLIM,TAB3,THOC2,TMLHE, TRMT2B,XIAP,ZBTB33,ZDHHC9,ZNF275,ZNF41,ZNF75D | CDC42BPA,GPR125,IGF1R,JRKL,KDM3B,KDM5B,LOC647979, LRP6,OCRL,OPHN1,PIK3R4,PLEKHM3,PUM1,PUM2, RAD50,RPRD2,SBF2,TBCK,TCF12,ZC3H12B,ZNF33A |
| * Co-Expression network figures were drawn using R package igraph. Only the top 20 genes with the highest correlations were shown. Red circle: input gene, orange circle: cell metabolism gene, sky circle: other gene |
: Open all plots for all cancer types
| Top |
: Open all interacting genes' information including KEGG pathway for all interacting genes from DAVID
| Top |
| Pharmacological Information for OCRL |
| There's no related Drug. |
| Top |
| Cross referenced IDs for OCRL |
| * We obtained these cross-references from Uniprot database. It covers 150 different DBs, 18 categories. http://www.uniprot.org/help/cross_references_section |
: Open all cross reference information
|
Copyright © 2016-Present - The Univsersity of Texas Health Science Center at Houston @ |