|
||||||||||||||||||||
| |
| Phenotypic Information (metabolism pathway, cancer, disease, phenome) |
| |
| |
| Gene-Gene Network Information: Co-Expression Network, Interacting Genes & KEGG |
| |
|


| Gene Summary for OSBP |
| Basic gene info. | Gene symbol | OSBP |
| Gene name | oxysterol binding protein | |
| Synonyms | OSBP1 | |
| Cytomap | UCSC genome browser: 11q12-q13 | |
| Genomic location | chr11 :59341870-59383617 | |
| Type of gene | protein-coding | |
| RefGenes | NM_002556.2, | |
| Ensembl id | ENSG00000110048 | |
| Description | oxysterol-binding protein 1 | |
| Modification date | 20141207 | |
| dbXrefs | MIM : 167040 | |
| HGNC : HGNC | ||
| Ensembl : ENSG00000110048 | ||
| HPRD : 01327 | ||
| Vega : OTTHUMG00000167422 | ||
| Protein | UniProt: go to UniProt's Cross Reference DB Table | |
| Expression | CleanEX: HS_OSBP | |
| BioGPS: 5007 | ||
| Gene Expression Atlas: ENSG00000110048 | ||
| The Human Protein Atlas: ENSG00000110048 | ||
| Pathway | NCI Pathway Interaction Database: OSBP | |
| KEGG: OSBP | ||
| REACTOME: OSBP | ||
| ConsensusPathDB | ||
| Pathway Commons: OSBP | ||
| Metabolism | MetaCyc: OSBP | |
| HUMANCyc: OSBP | ||
| Regulation | Ensembl's Regulation: ENSG00000110048 | |
| miRBase: chr11 :59,341,870-59,383,617 | ||
| TargetScan: NM_002556 | ||
| cisRED: ENSG00000110048 | ||
| Context | iHOP: OSBP | |
| cancer metabolism search in PubMed: OSBP | ||
| UCL Cancer Institute: OSBP | ||
| Assigned class in ccmGDB | C | |
| Top |
| Phenotypic Information for OSBP(metabolism pathway, cancer, disease, phenome) |
| Cancer | CGAP: OSBP |
| Familial Cancer Database: OSBP | |
| * This gene is included in those cancer gene databases. |
|
|
|
|
|
| . | ||||||||||||||
Oncogene 1 | Significant driver gene in | |||||||||||||||||||
| cf) number; DB name 1 Oncogene; http://nar.oxfordjournals.org/content/35/suppl_1/D721.long, 2 Tumor Suppressor gene; https://bioinfo.uth.edu/TSGene/, 3 Cancer Gene Census; http://www.nature.com/nrc/journal/v4/n3/abs/nrc1299.html, 4 CancerGenes; http://nar.oxfordjournals.org/content/35/suppl_1/D721.long, 5 Network of Cancer Gene; http://ncg.kcl.ac.uk/index.php, 1Therapeutic Vulnerabilities in Cancer; http://cbio.mskcc.org/cancergenomics/statius/ |
| REACTOME_PHOSPHOLIPID_METABOLISM REACTOME_SPHINGOLIPID_METABOLISM REACTOME_METABOLISM_OF_LIPIDS_AND_LIPOPROTEINS | |
| OMIM | |
| Orphanet | |
| Disease | KEGG Disease: OSBP |
| MedGen: OSBP (Human Medical Genetics with Condition) | |
| ClinVar: OSBP | |
| Phenotype | MGI: OSBP (International Mouse Phenotyping Consortium) |
| PhenomicDB: OSBP | |
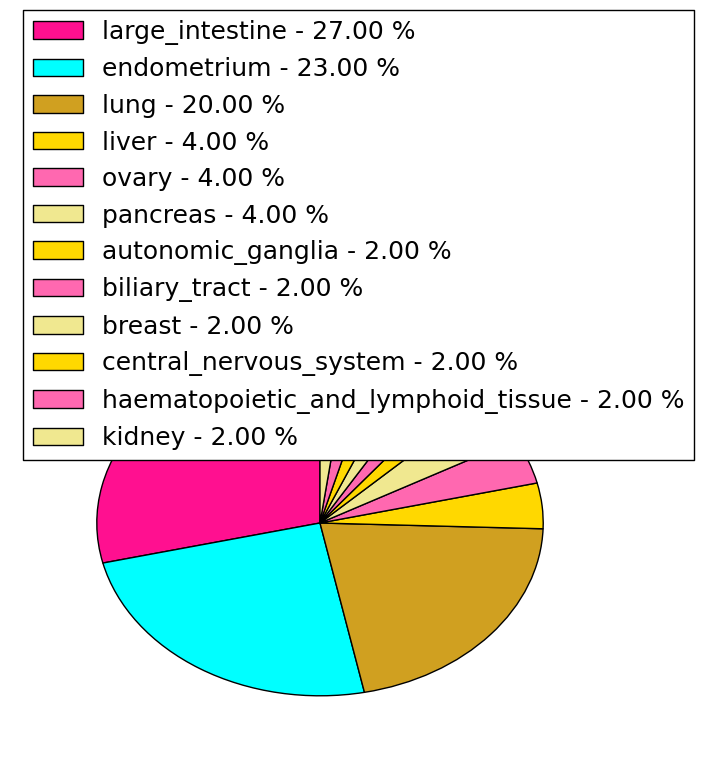
| Mutations for OSBP |
| * Under tables are showing count per each tissue to give us broad intuition about tissue specific mutation patterns.You can go to the detailed page for each mutation database's web site. |
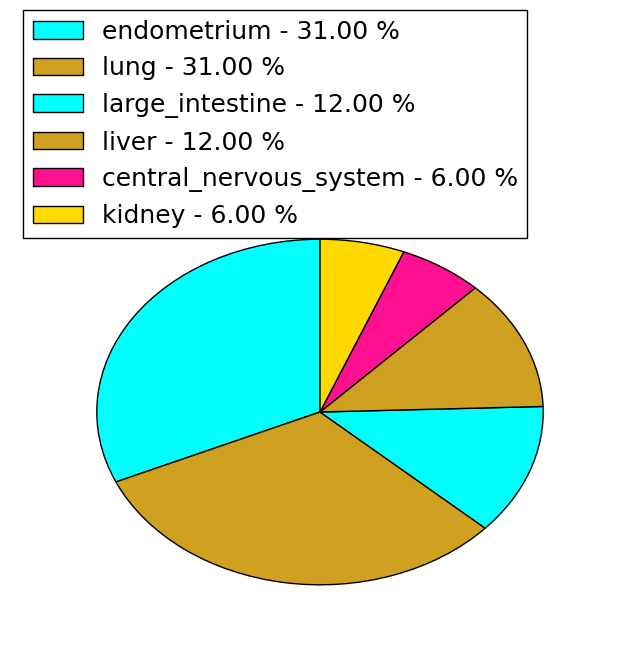
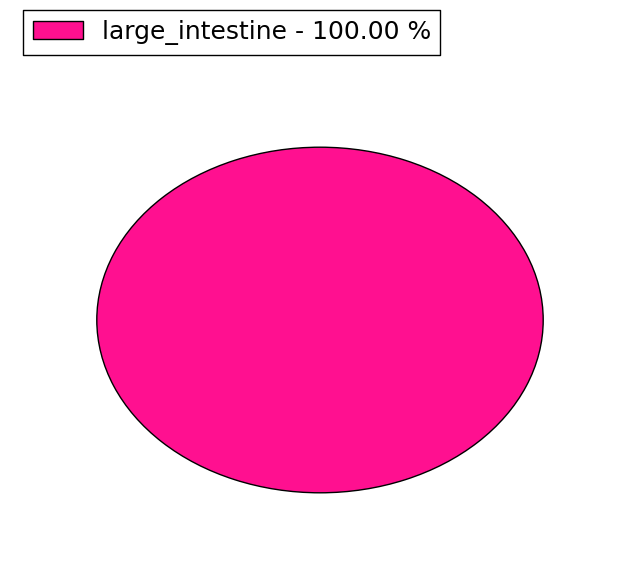
| - Statistics for Tissue and Mutation type | Top |
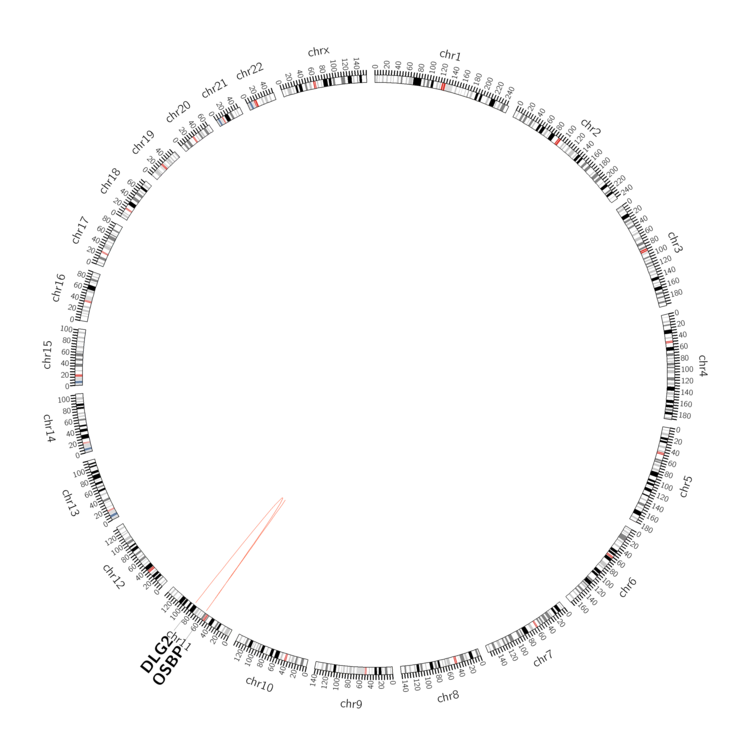 |
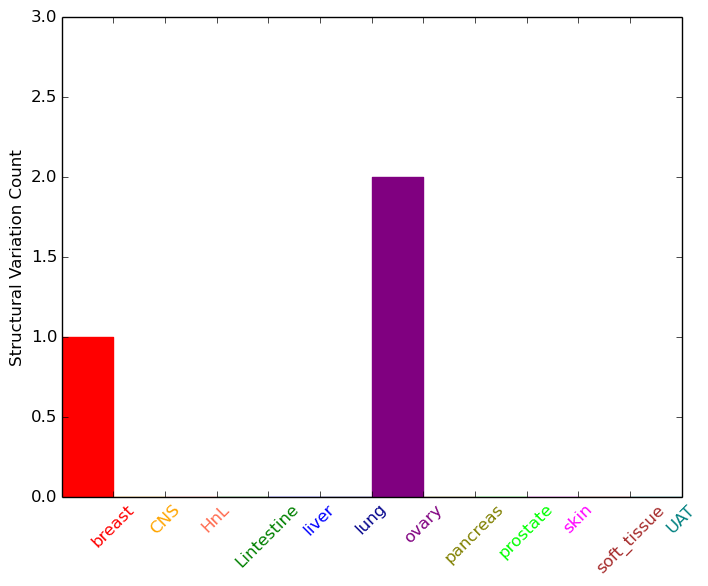
| - For Inter-chromosomal Variations |
| There's no inter-chromosomal structural variation. |
| - For Intra-chromosomal Variations |
| * Intra-chromosomal variantions includes 'intrachromosomal amplicon to amplicon', 'intrachromosomal amplicon to non-amplified dna', 'intrachromosomal deletion', 'intrachromosomal fold-back inversion', 'intrachromosomal inversion', 'intrachromosomal tandem duplication', 'Intrachromosomal unknown type', 'intrachromosomal with inverted orientation', 'intrachromosomal with non-inverted orientation'. |
 |
| Sample | Symbol_a | Chr_a | Start_a | End_a | Symbol_b | Chr_b | Start_b | End_b |
| breast | OSBP | chr11 | 59377827 | 59377827 | chr11 | 59393938 | 59393938 | |
| ovary | OSBP | chr11 | 59359166 | 59359186 | OSBP | chr11 | 59362180 | 59362200 |
| ovary | OSBP | chr11 | 59378380 | 59378400 | DLG2 | chr11 | 84200925 | 84200945 |
| cf) Tissue number; Tissue name (1;Breast, 2;Central_nervous_system, 3;Haematopoietic_and_lymphoid_tissue, 4;Large_intestine, 5;Liver, 6;Lung, 7;Ovary, 8;Pancreas, 9;Prostate, 10;Skin, 11;Soft_tissue, 12;Upper_aerodigestive_tract) |
| * From mRNA Sanger sequences, Chitars2.0 arranged chimeric transcripts. This table shows OSBP related fusion information. |
| ID | Head Gene | Tail Gene | Accession | Gene_a | qStart_a | qEnd_a | Chromosome_a | tStart_a | tEnd_a | Gene_a | qStart_a | qEnd_a | Chromosome_a | tStart_a | tEnd_a |
| BP420837 | OSBP | 25 | 146 | 11 | 59382724 | 59382845 | SRRM1 | 142 | 499 | 1 | 24996771 | 24998784 | |
| Top |
| There's no copy number variation information in COSMIC data for this gene. |
| Top |
|
 |
| Top |
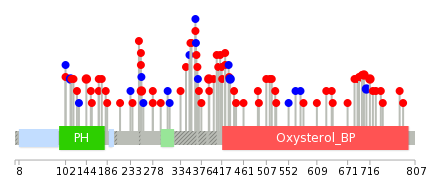
| Stat. for Non-Synonymous SNVs (# total SNVs=43) | (# total SNVs=16) |
 |  |
(# total SNVs=1) | (# total SNVs=0) |
 |
| Top |
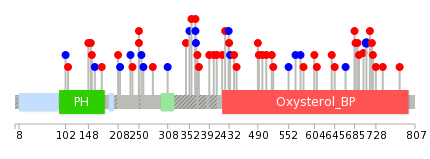
| * When you move the cursor on each content, you can see more deailed mutation information on the Tooltip. Those are primary_site,primary_histology,mutation(aa),pubmedID. |
| GRCh37 position | Mutation(aa) | Unique sampleID count |
| chr11:59376014-59376014 | p.I255I | 3 |
| chr11:59367978-59367978 | p.I434I | 2 |
| chr11:59368300-59368300 | p.D391N | 2 |
| chr11:59377994-59377994 | p.E144V | 2 |
| chr11:59344413-59344413 | p.R716W | 2 |
| chr11:59344432-59344432 | p.G709G | 2 |
| chr11:59344448-59344448 | p.N704S | 2 |
| chr11:59382804-59382804 | p.L112L | 2 |
| chr11:59369301-59369301 | p.D278G | 2 |
| chr11:59382832-59382832 | p.I102I | 2 |
| Top |
|
 |
| Point Mutation/ Tissue ID | 1 | 2 | 3 | 4 | 5 | 6 | 7 | 8 | 9 | 10 | 11 | 12 | 13 | 14 | 15 | 16 | 17 | 18 | 19 | 20 |
| # sample | 4 | 1 | 6 | 2 | 4 | 1 | 11 | 3 | 1 | 7 | 5 | 1 | 10 | |||||||
| # mutation | 4 | 1 | 6 | 2 | 4 | 1 | 12 | 4 | 1 | 7 | 6 | 1 | 13 | |||||||
| nonsynonymous SNV | 3 | 1 | 5 | 1 | 3 | 1 | 8 | 4 | 1 | 5 | 3 | 1 | 9 | |||||||
| synonymous SNV | 1 | 1 | 1 | 1 | 4 | 2 | 3 | 4 |
| cf) Tissue ID; Tissue type (1; BLCA[Bladder Urothelial Carcinoma], 2; BRCA[Breast invasive carcinoma], 3; CESC[Cervical squamous cell carcinoma and endocervical adenocarcinoma], 4; COAD[Colon adenocarcinoma], 5; GBM[Glioblastoma multiforme], 6; Glioma Low Grade, 7; HNSC[Head and Neck squamous cell carcinoma], 8; KICH[Kidney Chromophobe], 9; KIRC[Kidney renal clear cell carcinoma], 10; KIRP[Kidney renal papillary cell carcinoma], 11; LAML[Acute Myeloid Leukemia], 12; LUAD[Lung adenocarcinoma], 13; LUSC[Lung squamous cell carcinoma], 14; OV[Ovarian serous cystadenocarcinoma ], 15; PAAD[Pancreatic adenocarcinoma], 16; PRAD[Prostate adenocarcinoma], 17; SKCM[Skin Cutaneous Melanoma], 18:STAD[Stomach adenocarcinoma], 19:THCA[Thyroid carcinoma], 20:UCEC[Uterine Corpus Endometrial Carcinoma]) |
| Top |
| * We represented just top 10 SNVs. When you move the cursor on each content, you can see more deailed mutation information on the Tooltip. Those are primary_site, primary_histology, mutation(aa), pubmedID. |
| Genomic Position | Mutation(aa) | Unique sampleID count |
| chr11:59344432 | p.G709G | 2 |
| chr11:59376031 | p.E250K | 2 |
| chr11:59361545 | p.D720H | 1 |
| chr11:59377962 | p.K552K | 1 |
| chr11:59344394 | p.E392K | 1 |
| chr11:59368079 | p.R212R | 1 |
| chr11:59345766 | p.R716W | 1 |
| chr11:59369301 | p.S521N | 1 |
| chr11:59361566 | p.N371H | 1 |
| chr11:59377967 | p.Q208H | 1 |
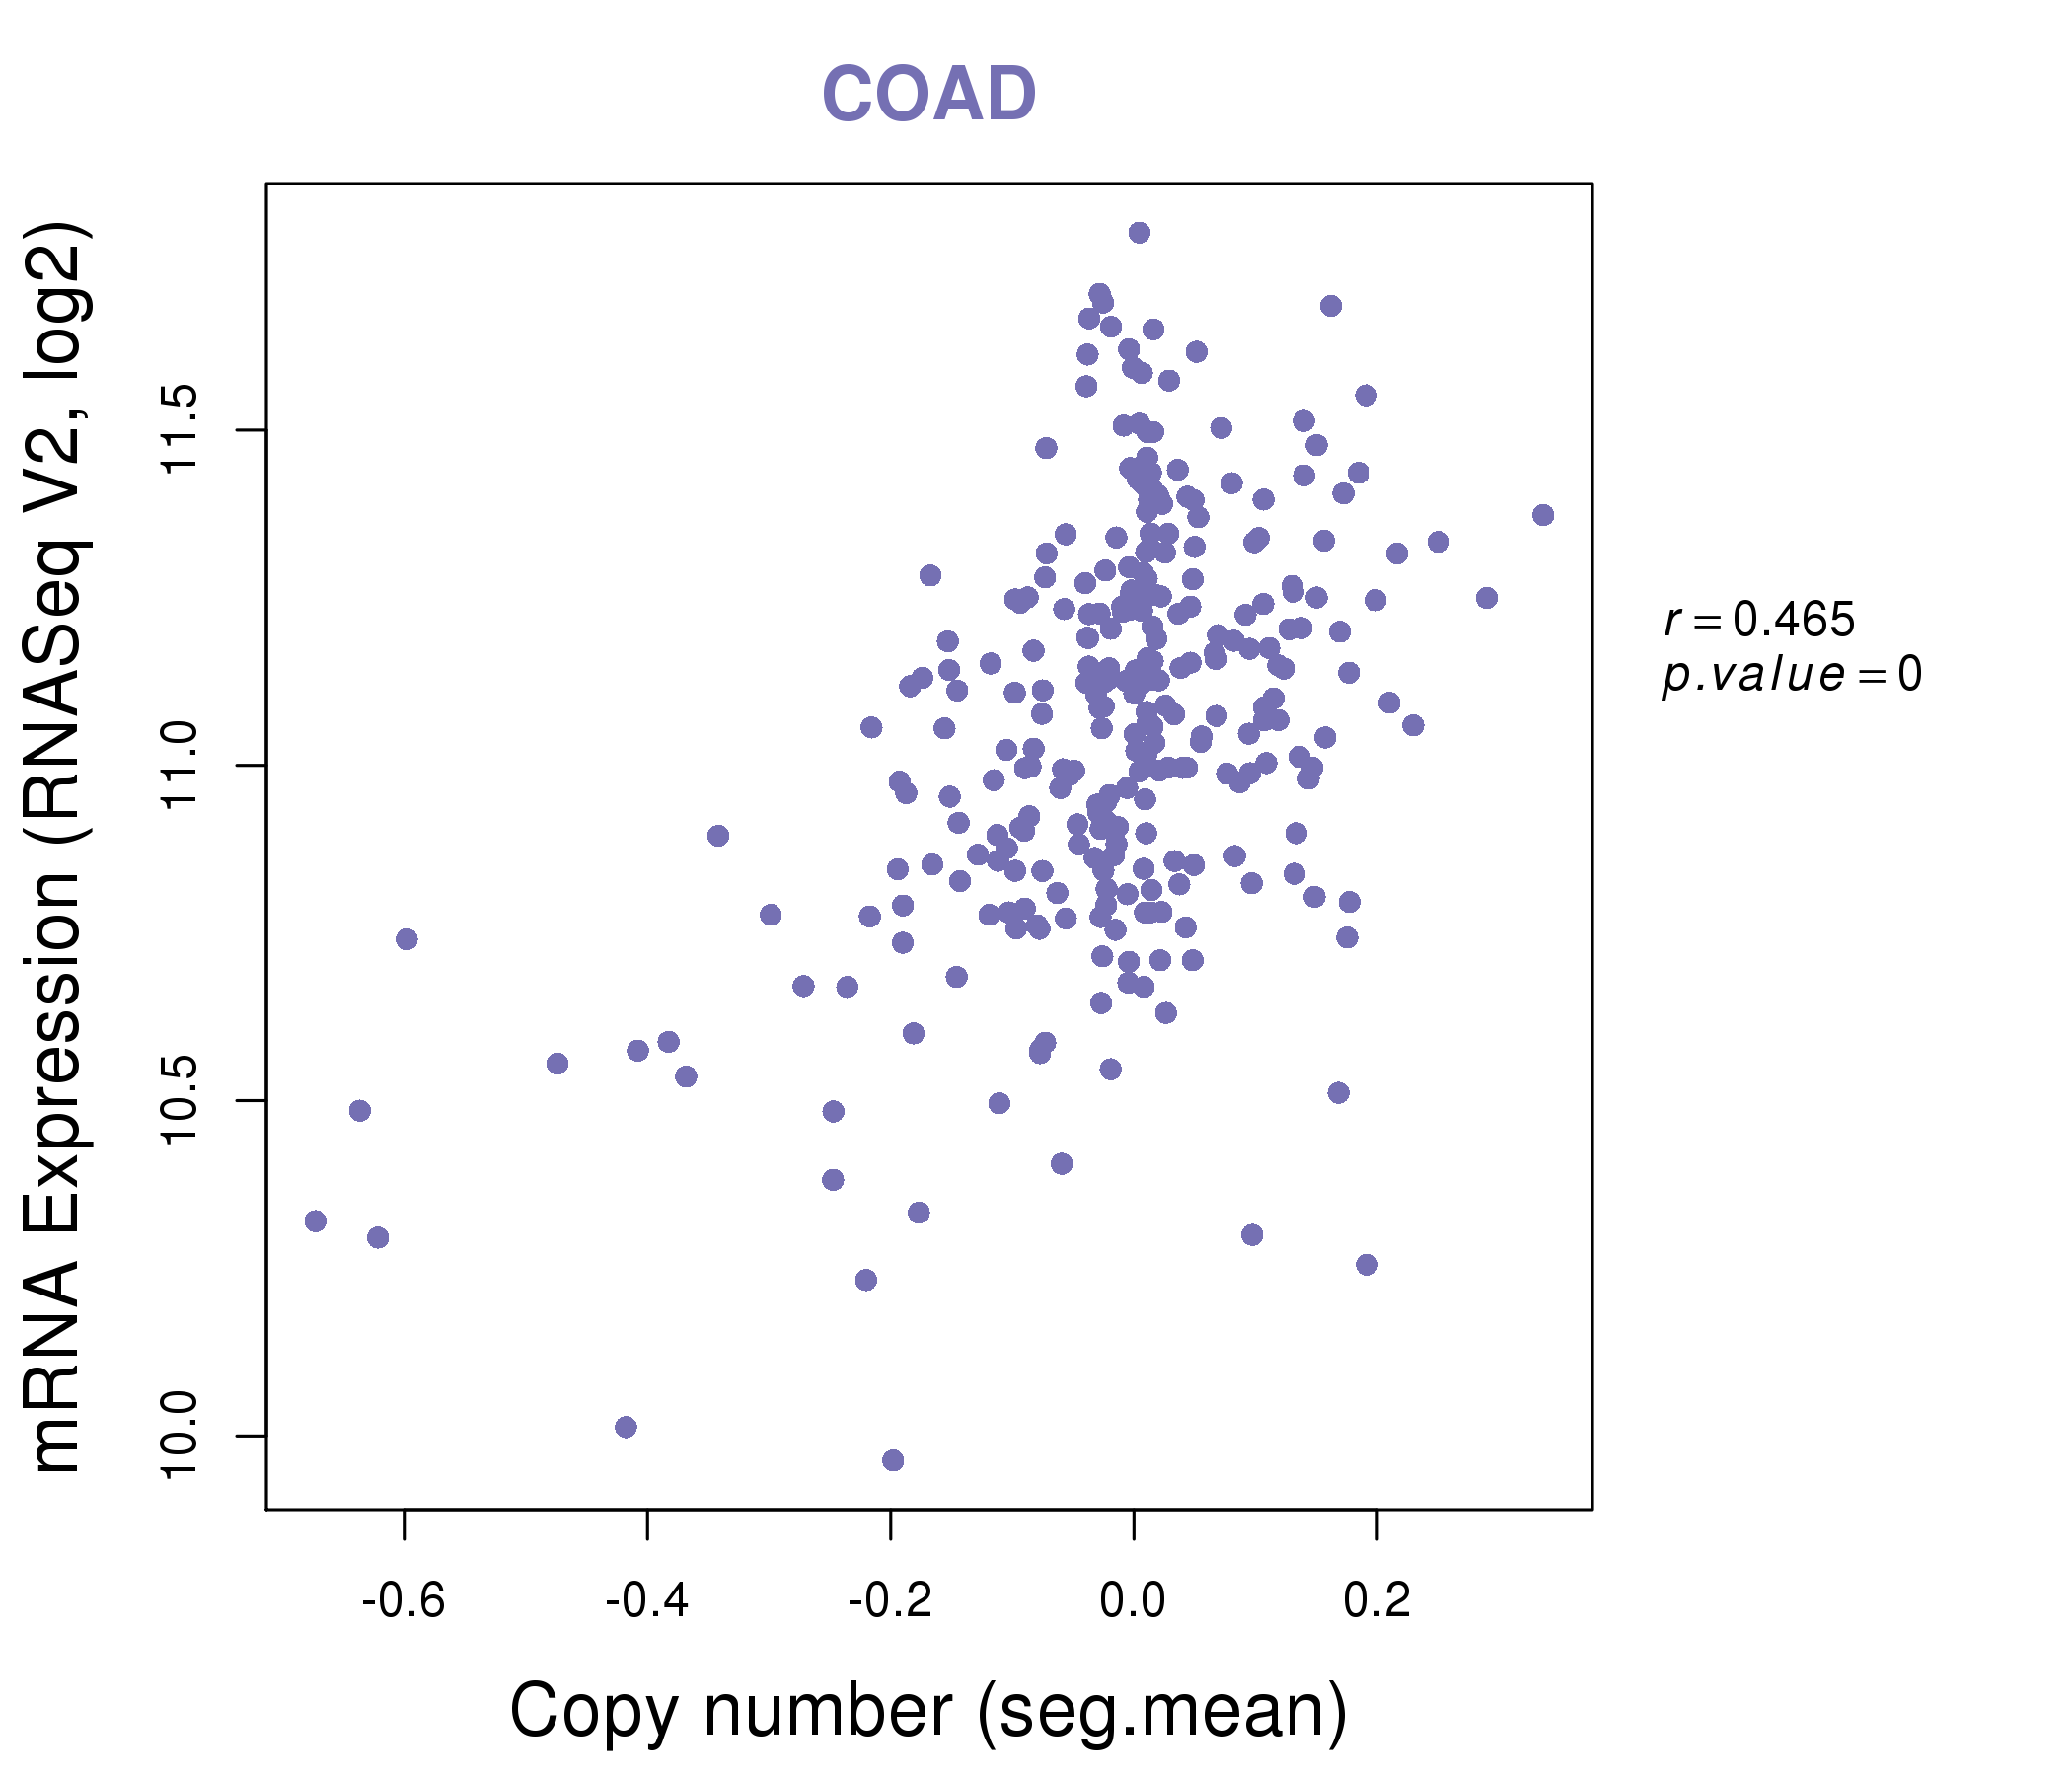
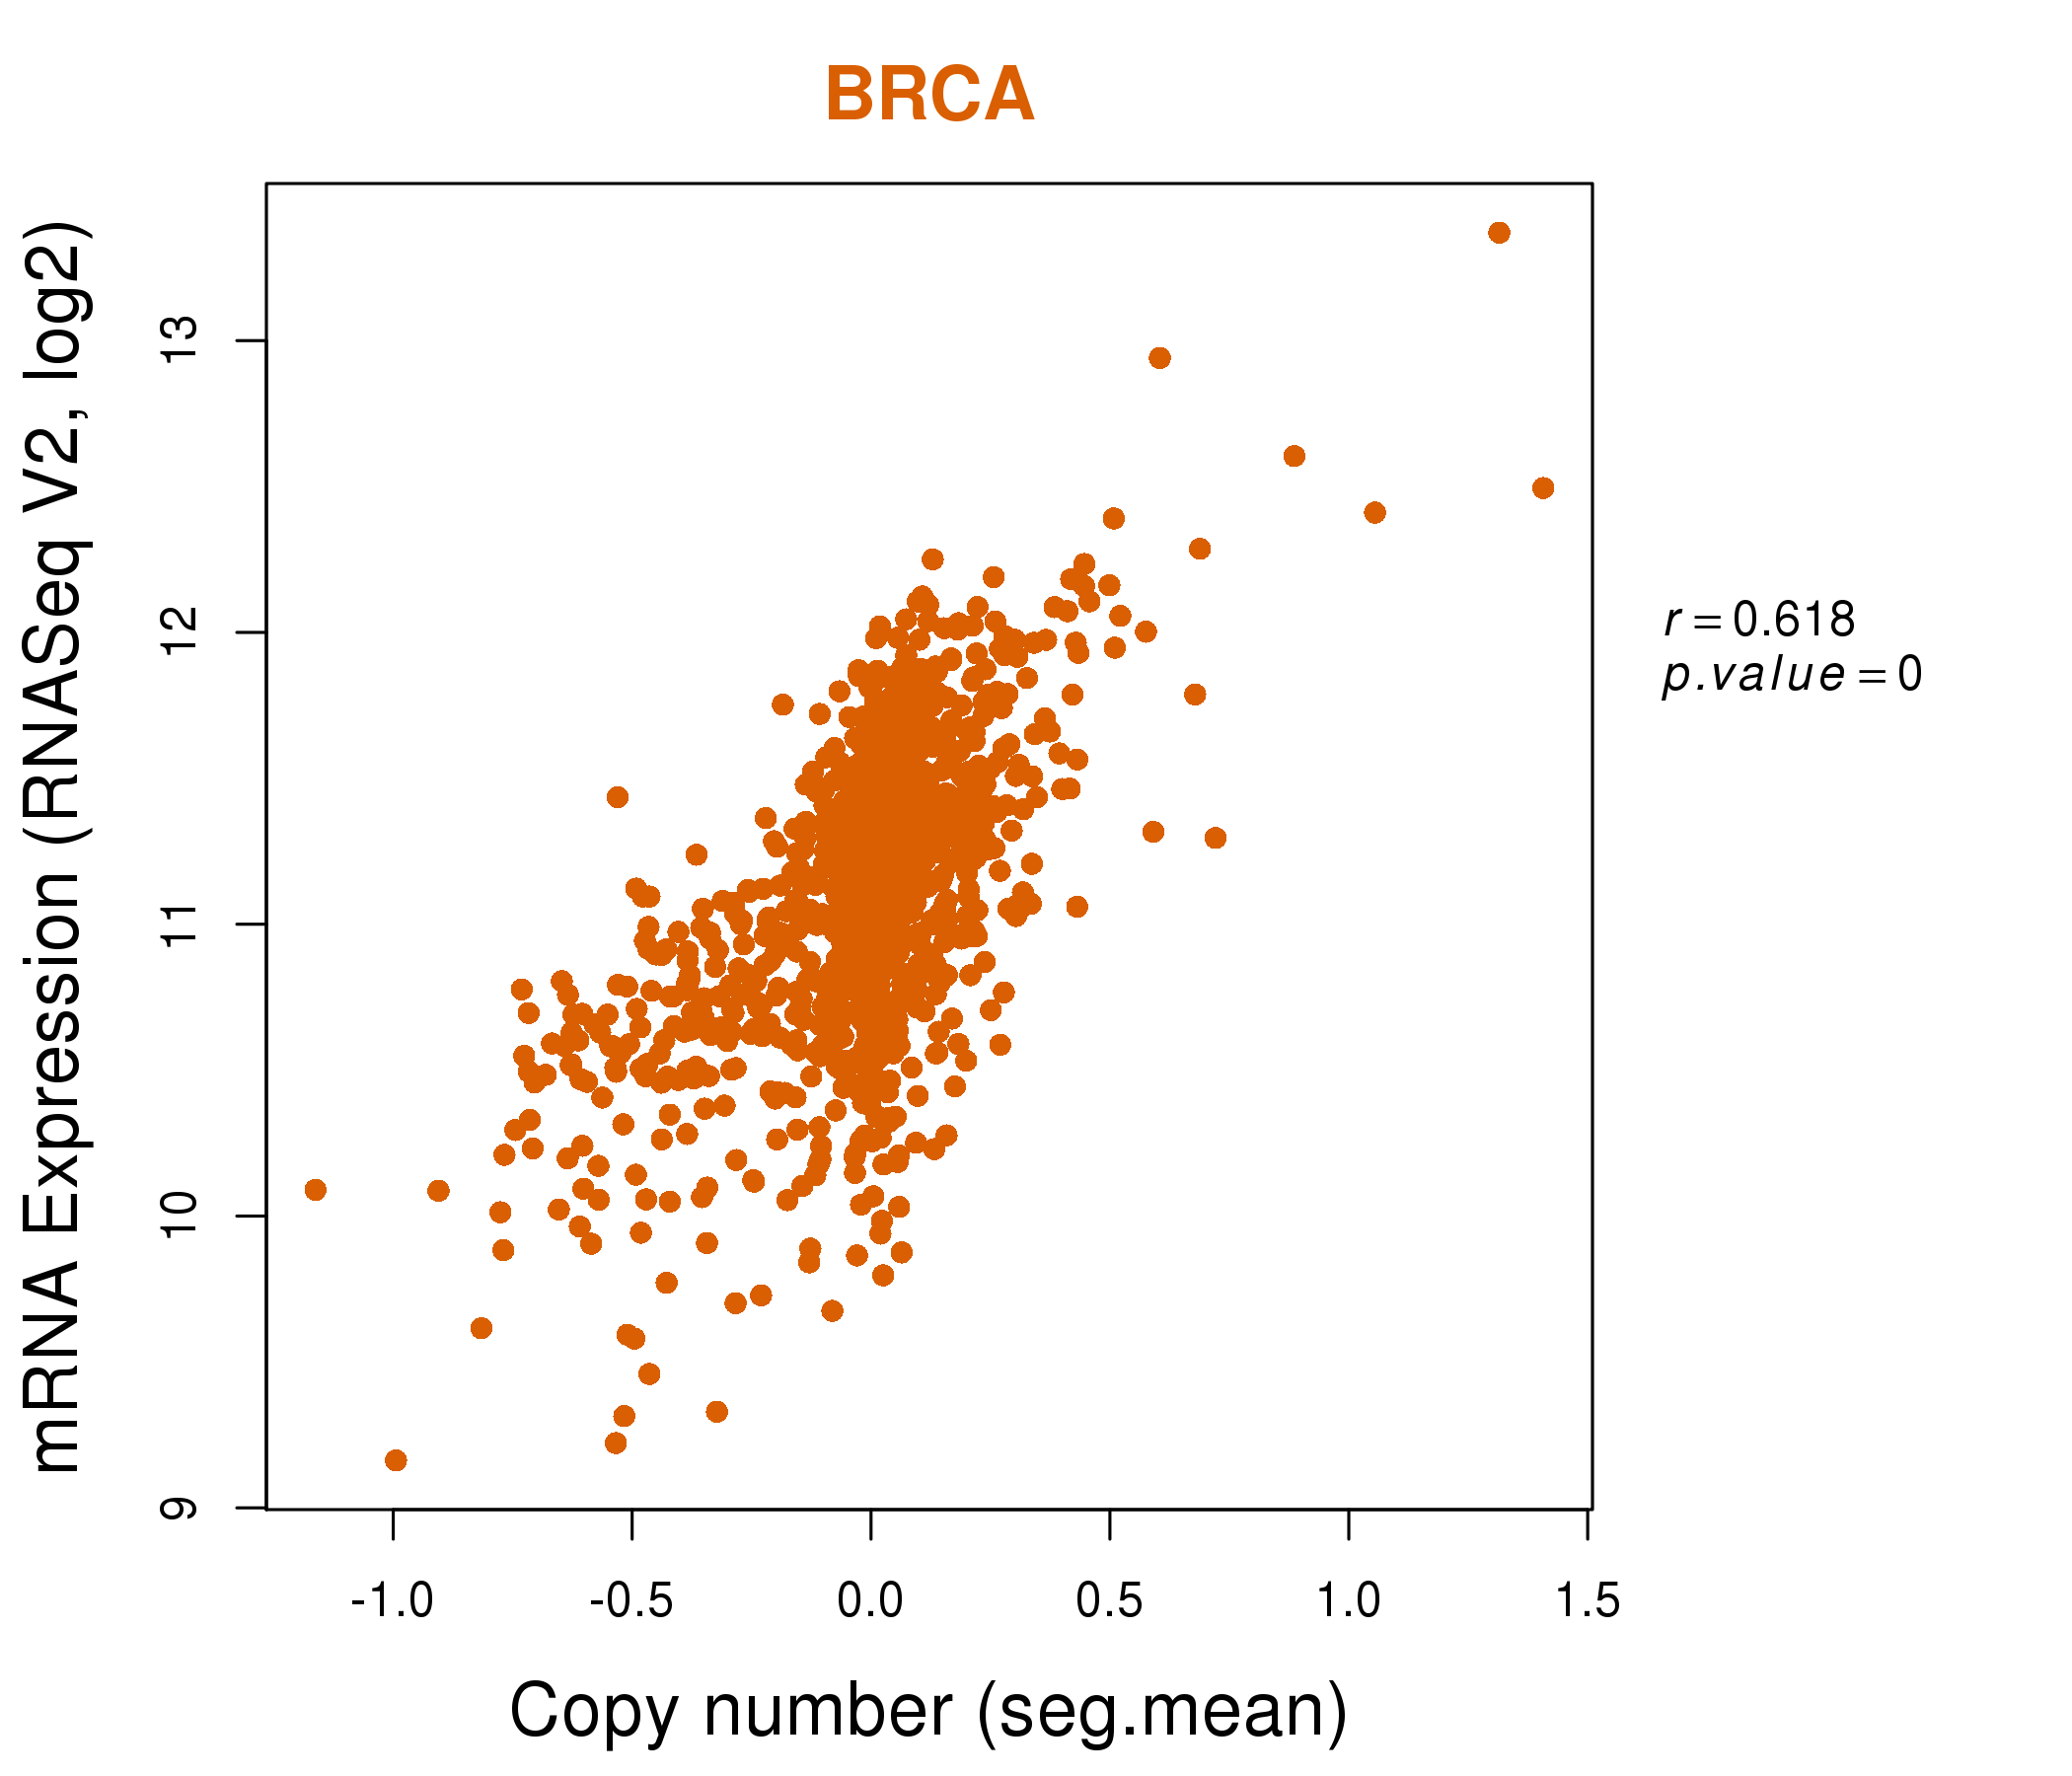
| * Copy number data were extracted from TCGA using R package TCGA-Assembler. The URLs of all public data files on TCGA DCC data server were gathered on Jan-05-2015. Function ProcessCNAData in TCGA-Assembler package was used to obtain gene-level copy number value which is calculated as the average copy number of the genomic region of a gene. |
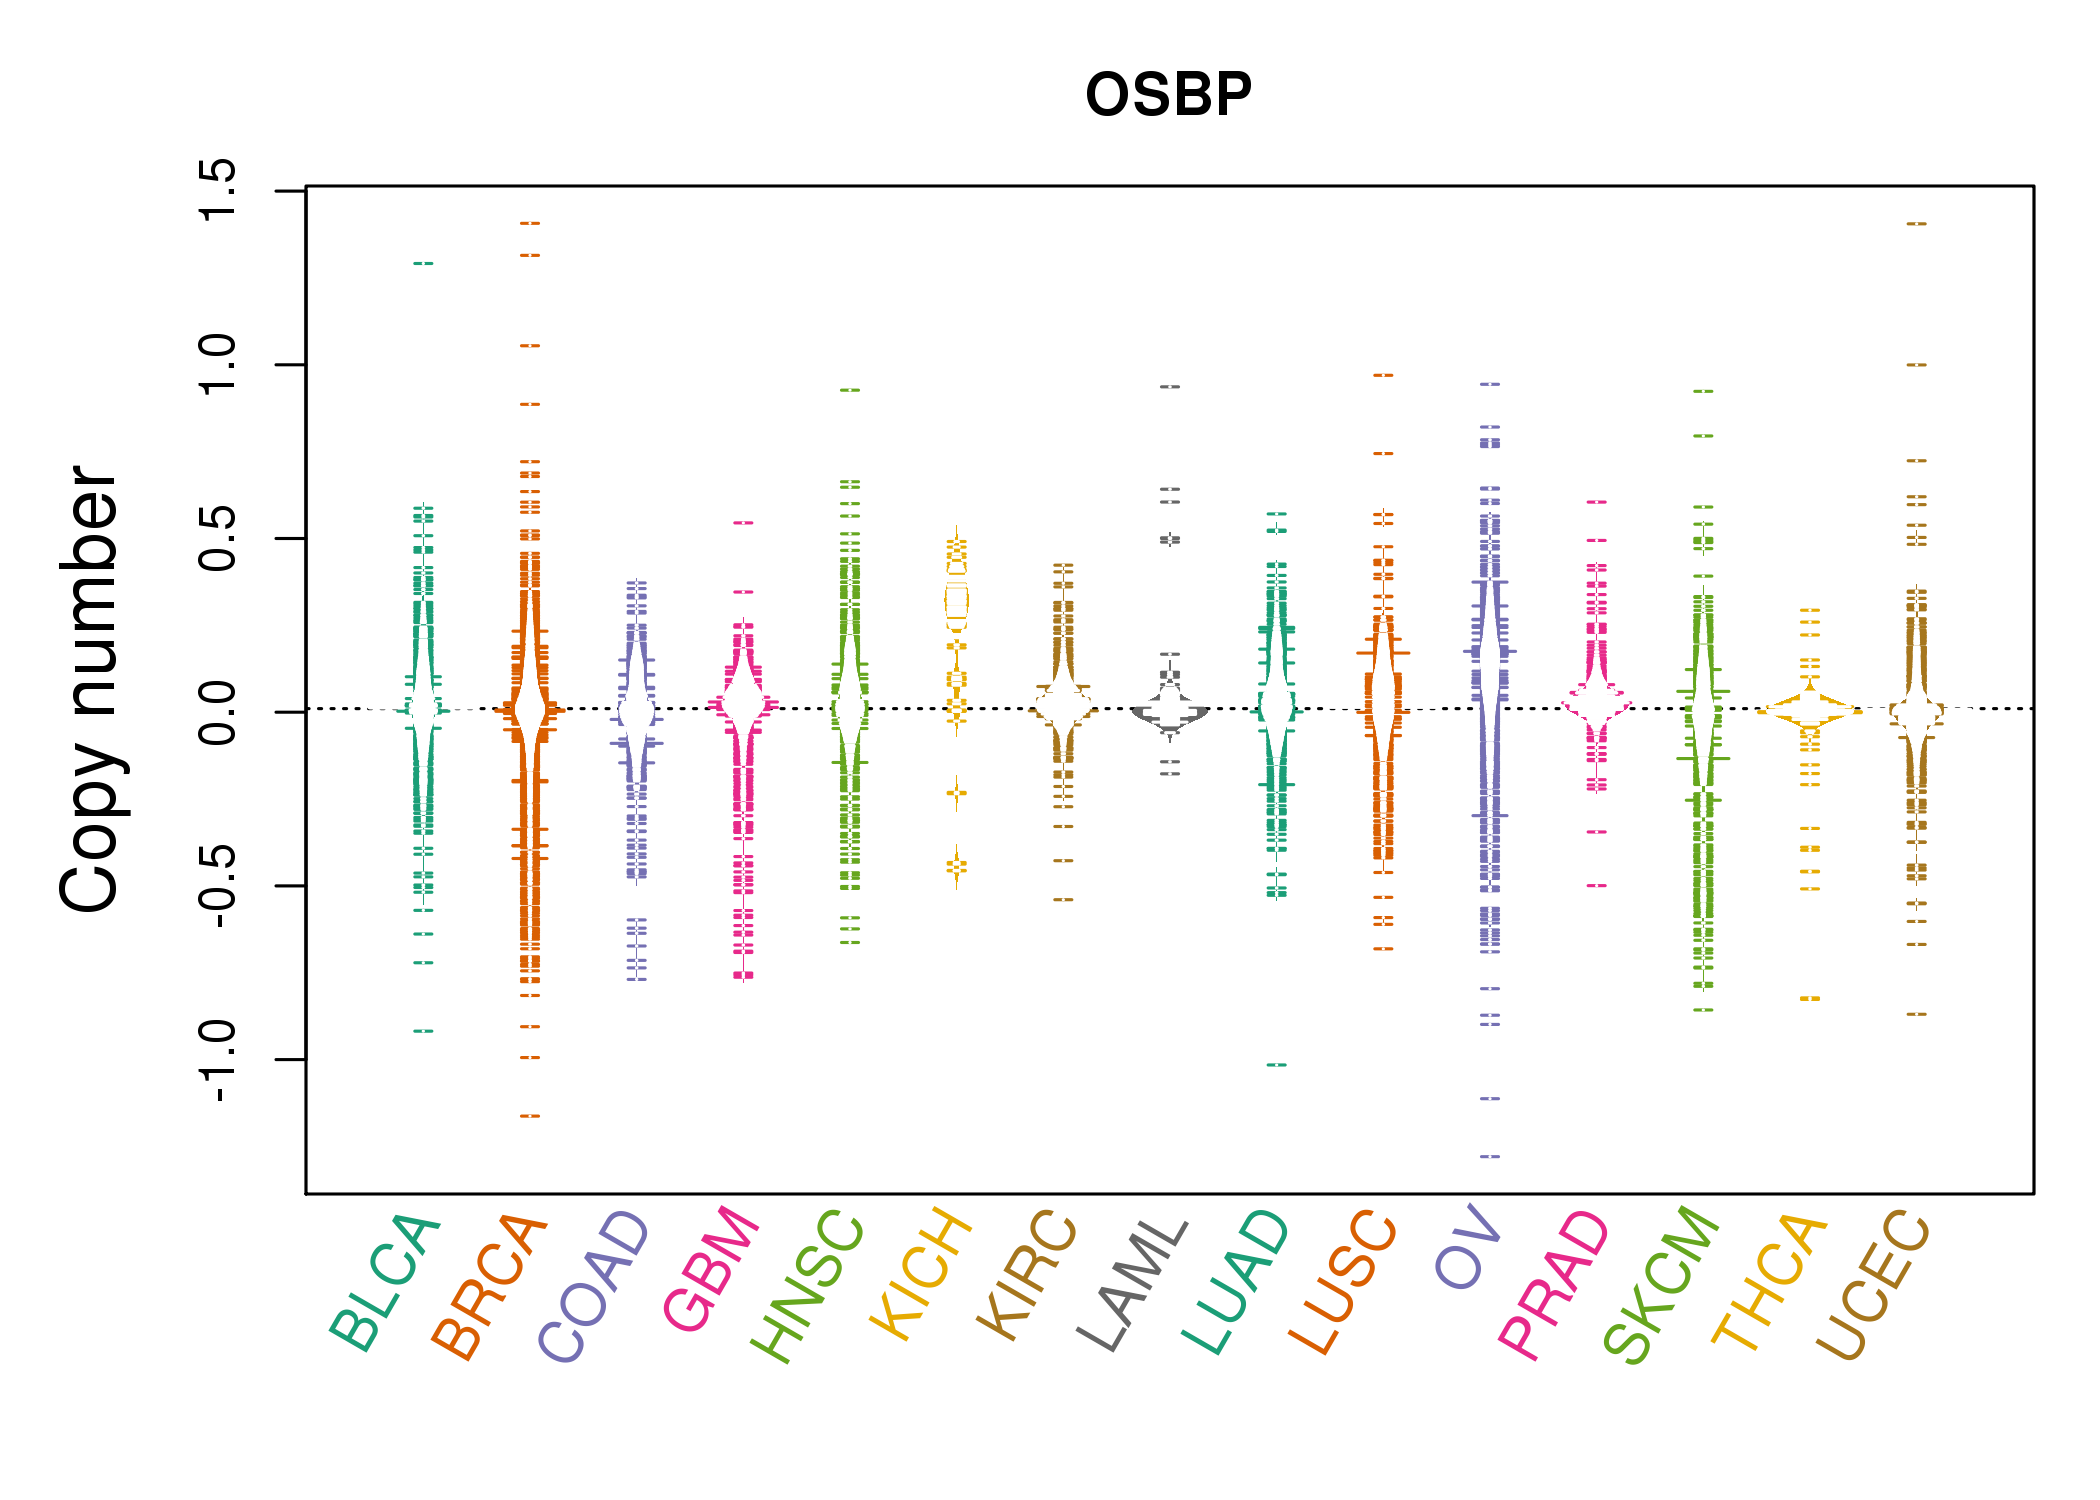 |
| cf) Tissue ID[Tissue type]: BLCA[Bladder Urothelial Carcinoma], BRCA[Breast invasive carcinoma], CESC[Cervical squamous cell carcinoma and endocervical adenocarcinoma], COAD[Colon adenocarcinoma], GBM[Glioblastoma multiforme], Glioma Low Grade, HNSC[Head and Neck squamous cell carcinoma], KICH[Kidney Chromophobe], KIRC[Kidney renal clear cell carcinoma], KIRP[Kidney renal papillary cell carcinoma], LAML[Acute Myeloid Leukemia], LUAD[Lung adenocarcinoma], LUSC[Lung squamous cell carcinoma], OV[Ovarian serous cystadenocarcinoma ], PAAD[Pancreatic adenocarcinoma], PRAD[Prostate adenocarcinoma], SKCM[Skin Cutaneous Melanoma], STAD[Stomach adenocarcinoma], THCA[Thyroid carcinoma], UCEC[Uterine Corpus Endometrial Carcinoma] |
| Top |
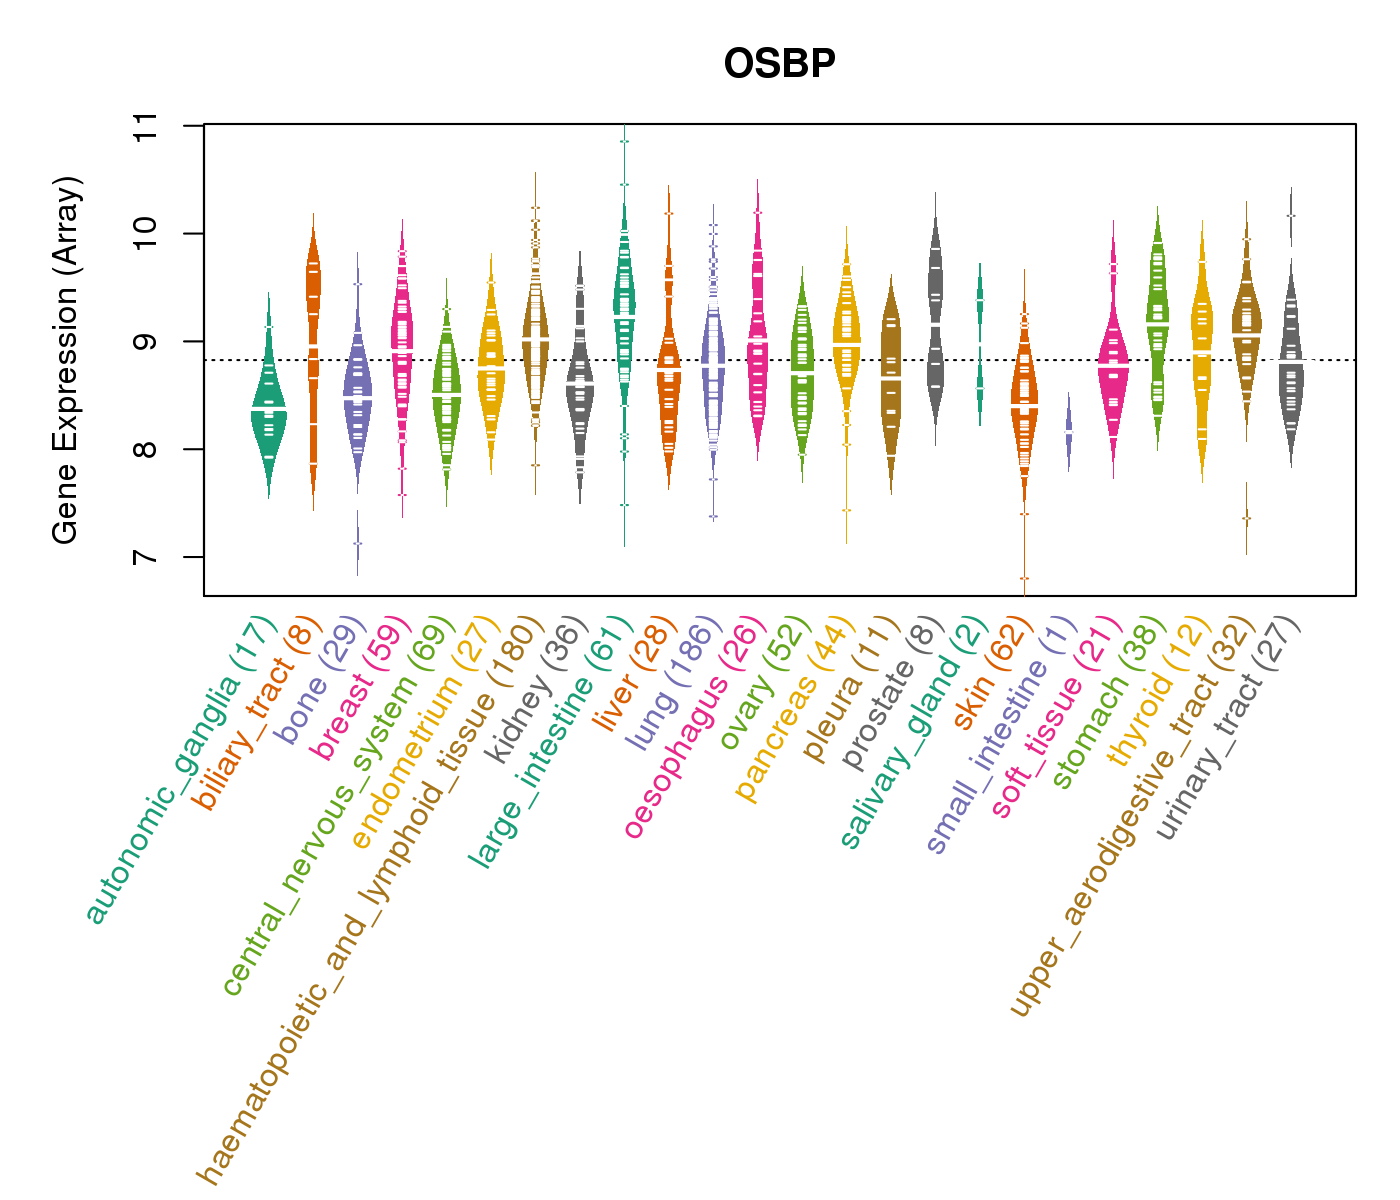
| Gene Expression for OSBP |
| * CCLE gene expression data were extracted from CCLE_Expression_Entrez_2012-10-18.res: Gene-centric RMA-normalized mRNA expression data. |
 |
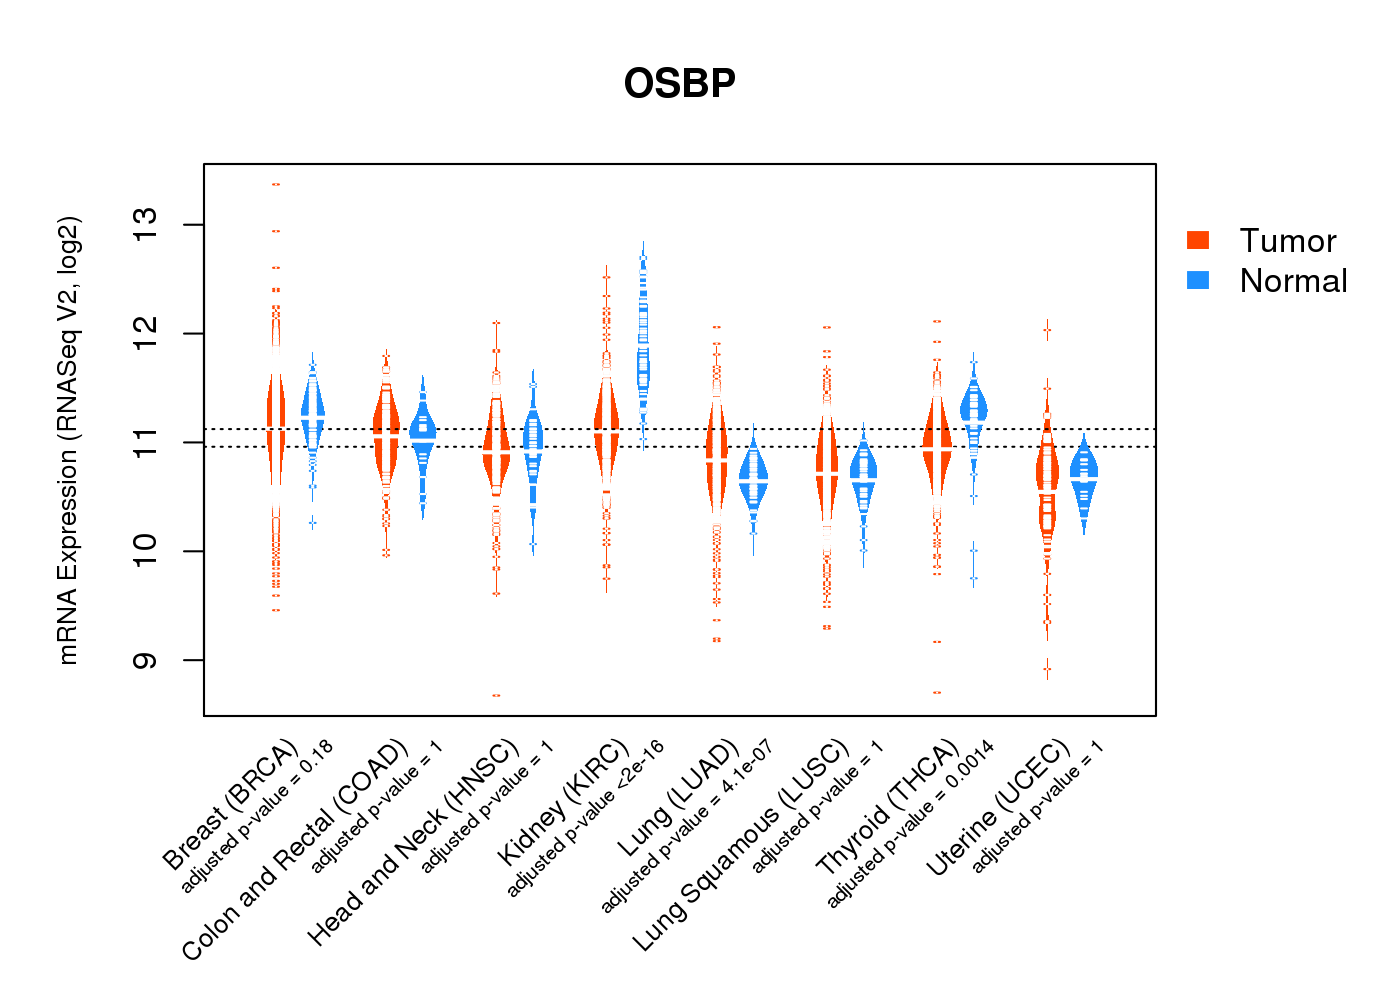
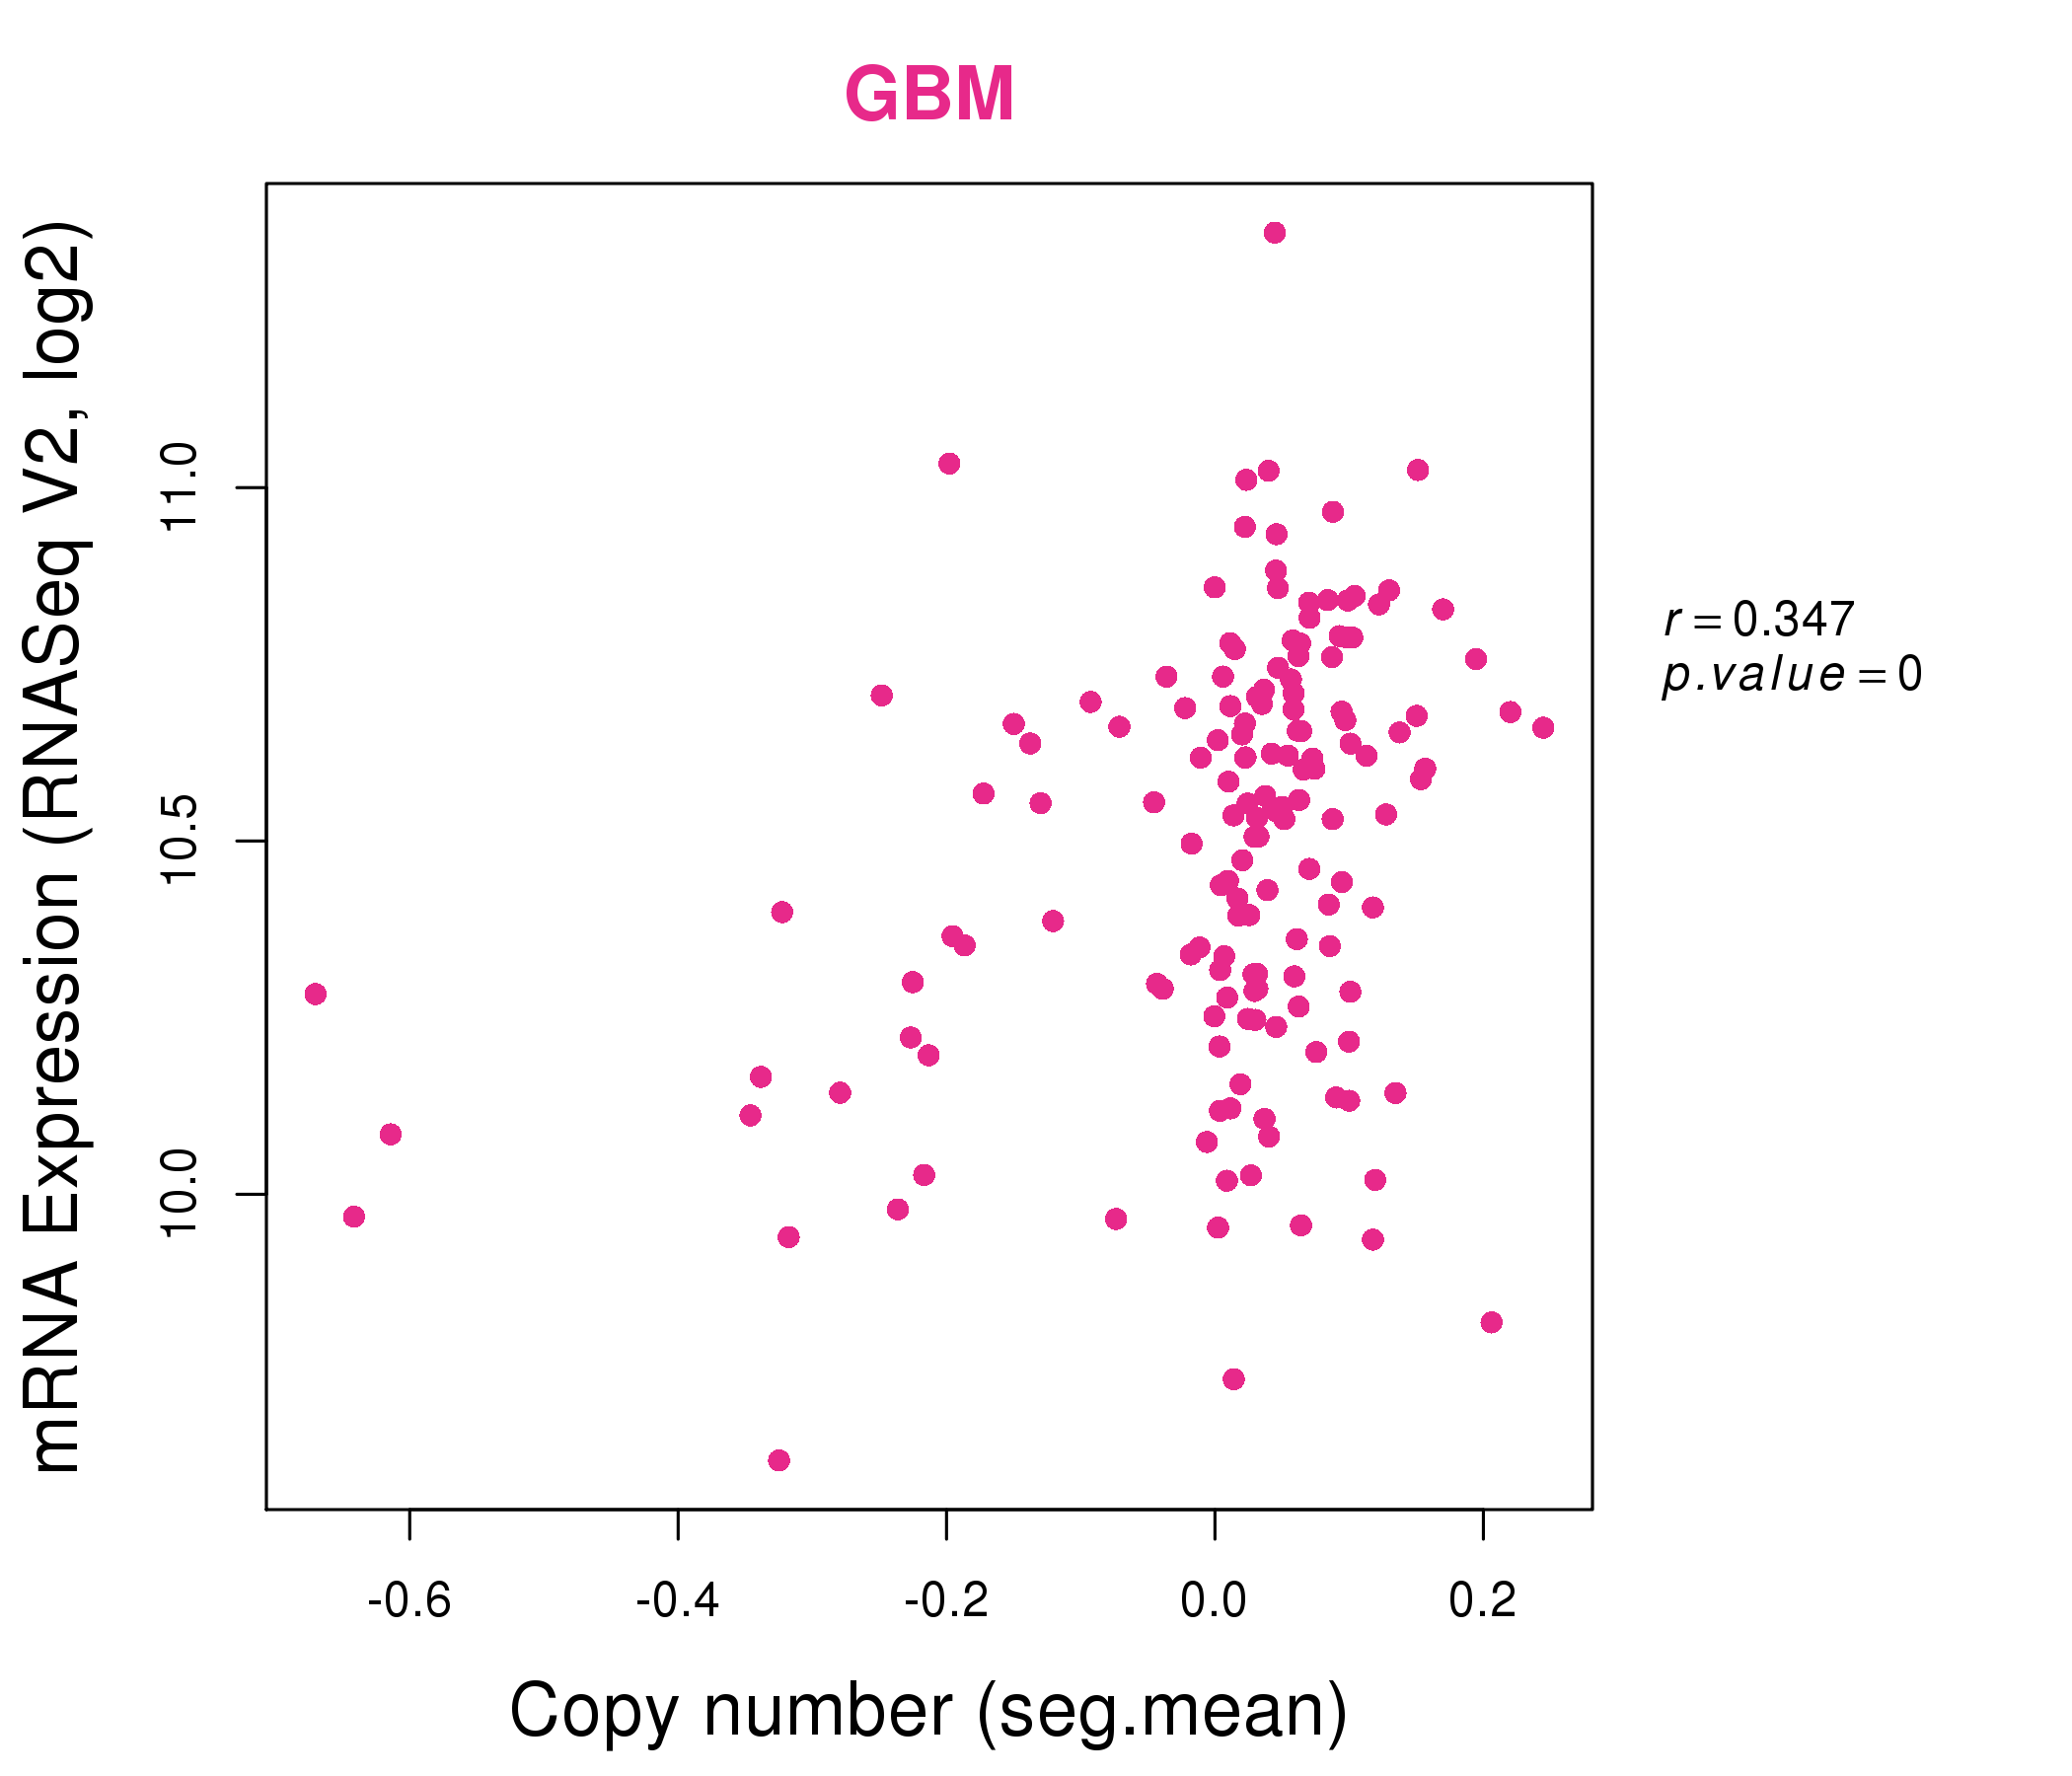
| * Normalized gene expression data of RNASeqV2 was extracted from TCGA using R package TCGA-Assembler. The URLs of all public data files on TCGA DCC data server were gathered at Jan-05-2015. Only eight cancer types have enough normal control samples for differential expression analysis. (t test, adjusted p<0.05 (using Benjamini-Hochberg FDR)) |
 |
| Top |
| * This plots show the correlation between CNV and gene expression. |
: Open all plots for all cancer types
 |
|
 |
|
| Top |
| Gene-Gene Network Information |
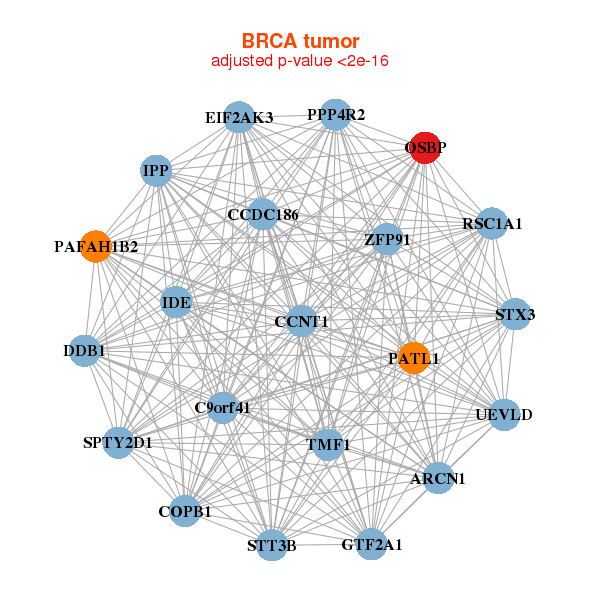
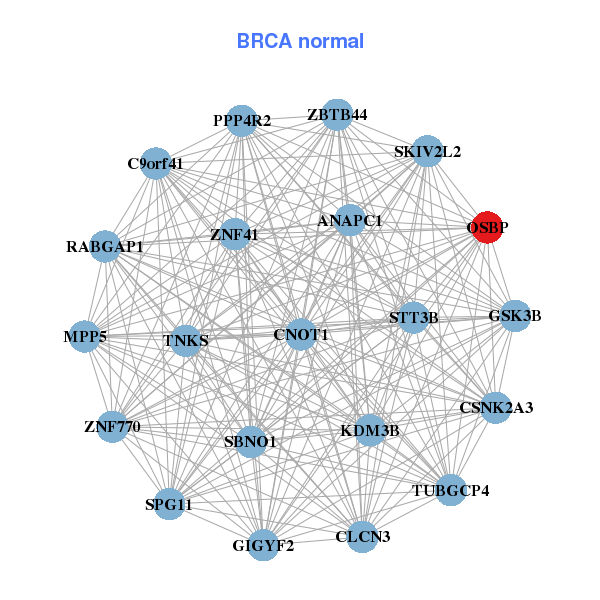
| * Co-Expression network figures were drawn using R package igraph. Only the top 20 genes with the highest correlations were shown. Red circle: input gene, orange circle: cell metabolism gene, sky circle: other gene |
: Open all plots for all cancer types
 |
|
| ARCN1,CCDC186,C9orf41,CCNT1,COPB1,DDB1,EIF2AK3, GTF2A1,IDE,IPP,OSBP,PAFAH1B2,PATL1,PPP4R2, RSC1A1,SPTY2D1,STT3B,STX3,TMF1,UEVLD,ZFP91 | ANAPC1,C9orf41,CLCN3,CNOT1,CSNK2A3,GIGYF2,GSK3B, KDM3B,MPP5,OSBP,PPP4R2,RABGAP1,SBNO1,SKIV2L2, SPG11,STT3B,TNKS,TUBGCP4,ZBTB44,ZNF41,ZNF770 |
 |
|
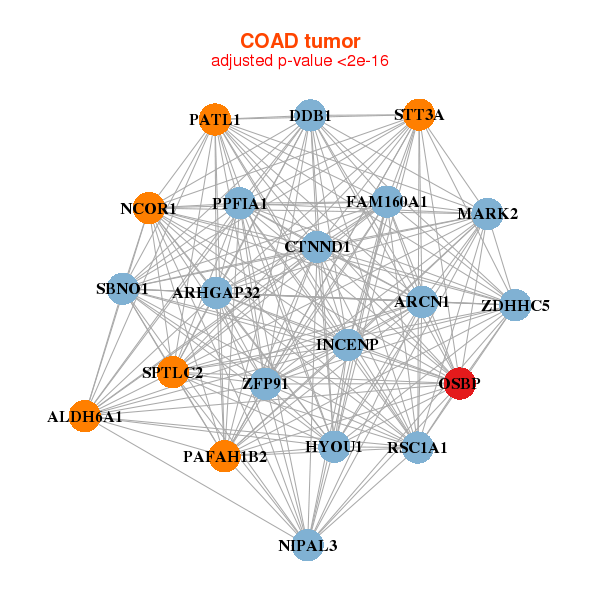
| ALDH6A1,ARCN1,ARHGAP32,CTNND1,DDB1,FAM160A1,HYOU1, INCENP,MARK2,NCOR1,NIPAL3,OSBP,PAFAH1B2,PATL1, PPFIA1,RSC1A1,SBNO1,SPTLC2,STT3A,ZDHHC5,ZFP91 | AIM1,ARHGAP32,ATP6V1A,PRR14L,CNOT1,CPD,CSNK2A1, CTR9,DCAF7,DNAJC16,DSP,FCGBP,KDM4A,KDM5B, LARP4B,MAN2A1,MED14,OSBP,PLCH1,SPG11,SPTLC2 |
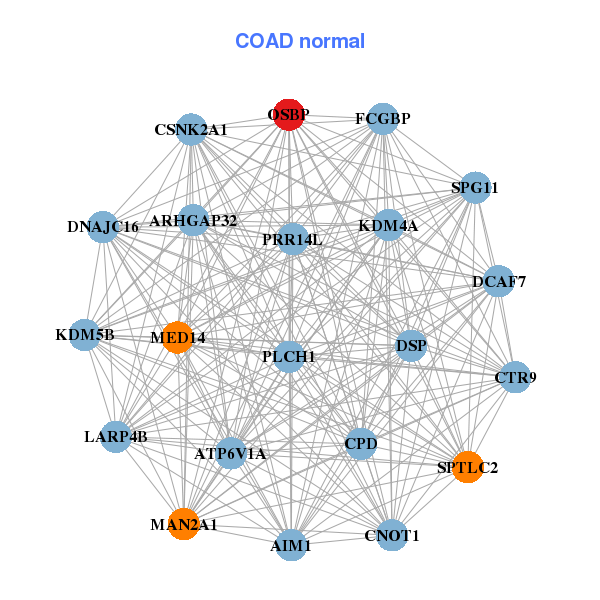
| * Co-Expression network figures were drawn using R package igraph. Only the top 20 genes with the highest correlations were shown. Red circle: input gene, orange circle: cell metabolism gene, sky circle: other gene |
: Open all plots for all cancer types
| Top |
: Open all interacting genes' information including KEGG pathway for all interacting genes from DAVID
| Top |
| Pharmacological Information for OSBP |
| There's no related Drug. |
| Top |
| Cross referenced IDs for OSBP |
| * We obtained these cross-references from Uniprot database. It covers 150 different DBs, 18 categories. http://www.uniprot.org/help/cross_references_section |
: Open all cross reference information
|
Copyright © 2016-Present - The Univsersity of Texas Health Science Center at Houston @ |