|
|||||||||||||||||||||||||||||||||||||||||||||||||||||||||||||||||||||||||||||||||||||||||||||||||||||||||||||||||||||||||||||||||||||||||||||||||||||||||||||||||||||||||||||||||||||||||||||||||||||||||||||||||||||||||||||||||||||||||||||||||||||||||||||||||||||||||||||||||||||||||||||||||||||||||||||||||||||||||||||||||||||||||||||||||||
| |
| Phenotypic Information (metabolism pathway, cancer, disease, phenome) |
| |
| |
| Gene-Gene Network Information: Co-Expression Network, Interacting Genes & KEGG |
| |
|


| Gene Summary for OXCT1 |
| Basic gene info. | Gene symbol | OXCT1 |
| Gene name | 3-oxoacid CoA transferase 1 | |
| Synonyms | OXCT|SCOT | |
| Cytomap | UCSC genome browser: 5p13.1 | |
| Genomic location | chr5 :41730166-41870791 | |
| Type of gene | protein-coding | |
| RefGenes | NM_000436.3, | |
| Ensembl id | ENSG00000083720 | |
| Description | 3-oxoacid CoA-transferase 13-oxoacid-CoA transferase 1SCOT-ssomatic-type succinyl CoA:3-oxoacid CoA-transferasesomatic-type succinyl-CoA:3-oxoacid CoA-transferasesomatic-type succinyl-CoA:3-oxoacid-CoA-transferasesuccinyl CoA:3-oxoacid CoA transfera | |
| Modification date | 20141207 | |
| dbXrefs | MIM : 601424 | |
| HGNC : HGNC | ||
| Ensembl : ENSG00000083720 | ||
| HPRD : 02001 | ||
| Vega : OTTHUMG00000094783 | ||
| Protein | UniProt: go to UniProt's Cross Reference DB Table | |
| Expression | CleanEX: HS_OXCT1 | |
| BioGPS: 5019 | ||
| Gene Expression Atlas: ENSG00000083720 | ||
| The Human Protein Atlas: ENSG00000083720 | ||
| Pathway | NCI Pathway Interaction Database: OXCT1 | |
| KEGG: OXCT1 | ||
| REACTOME: OXCT1 | ||
| ConsensusPathDB | ||
| Pathway Commons: OXCT1 | ||
| Metabolism | MetaCyc: OXCT1 | |
| HUMANCyc: OXCT1 | ||
| Regulation | Ensembl's Regulation: ENSG00000083720 | |
| miRBase: chr5 :41,730,166-41,870,791 | ||
| TargetScan: NM_000436 | ||
| cisRED: ENSG00000083720 | ||
| Context | iHOP: OXCT1 | |
| cancer metabolism search in PubMed: OXCT1 | ||
| UCL Cancer Institute: OXCT1 | ||
| Assigned class in ccmGDB | C | |
| Top |
| Phenotypic Information for OXCT1(metabolism pathway, cancer, disease, phenome) |
| Cancer | CGAP: OXCT1 |
| Familial Cancer Database: OXCT1 | |
| * This gene is included in those cancer gene databases. |
|
|
|
|
|
|
| |||||||||||||||||||||||||||||||||||||||||||||||||||||||||||||||||||||||||||||||||||||||||||||||||||||||||||||||||||||||||||||||||||||||||||||||||||||||||||||||||||||||||||||||||||||||||||||||||||||||||||||||||||||||||||||||||||||||||||||||||||||||||||||||||||||||||||||||||||||||||||||||||||||||||||||||||||||||||||||||||||||||||||||
Oncogene 1 | Significant driver gene in | ||||||||||||||||||||||||||||||||||||||||||||||||||||||||||||||||||||||||||||||||||||||||||||||||||||||||||||||||||||||||||||||||||||||||||||||||||||||||||||||||||||||||||||||||||||||||||||||||||||||||||||||||||||||||||||||||||||||||||||||||||||||||||||||||||||||||||||||||||||||||||||||||||||||||||||||||||||||||||||||||||||||||||||||||||
| cf) number; DB name 1 Oncogene; http://nar.oxfordjournals.org/content/35/suppl_1/D721.long, 2 Tumor Suppressor gene; https://bioinfo.uth.edu/TSGene/, 3 Cancer Gene Census; http://www.nature.com/nrc/journal/v4/n3/abs/nrc1299.html, 4 CancerGenes; http://nar.oxfordjournals.org/content/35/suppl_1/D721.long, 5 Network of Cancer Gene; http://ncg.kcl.ac.uk/index.php, 1Therapeutic Vulnerabilities in Cancer; http://cbio.mskcc.org/cancergenomics/statius/ |
| KEGG_BUTANOATE_METABOLISM REACTOME_METABOLISM_OF_LIPIDS_AND_LIPOPROTEINS | |
| OMIM | |
| Orphanet | |
| Disease | KEGG Disease: OXCT1 |
| MedGen: OXCT1 (Human Medical Genetics with Condition) | |
| ClinVar: OXCT1 | |
| Phenotype | MGI: OXCT1 (International Mouse Phenotyping Consortium) |
| PhenomicDB: OXCT1 | |
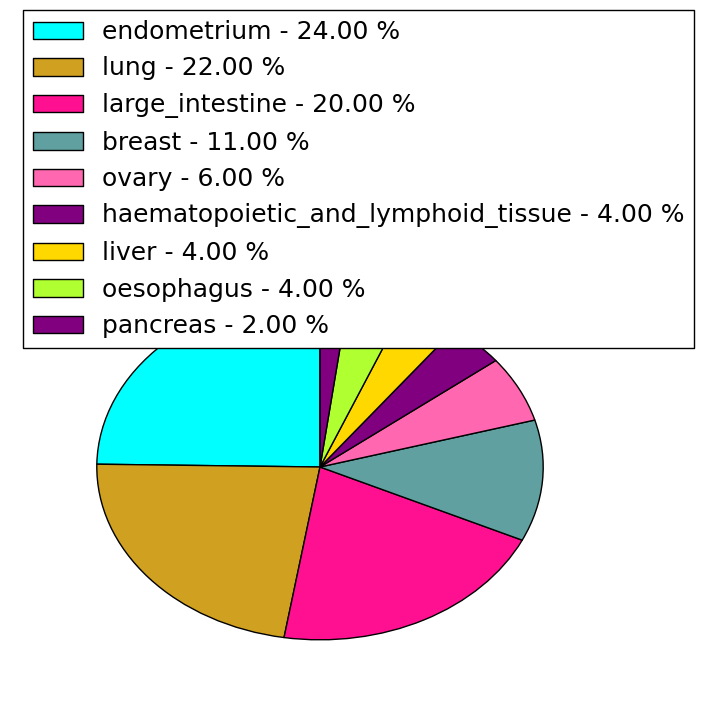
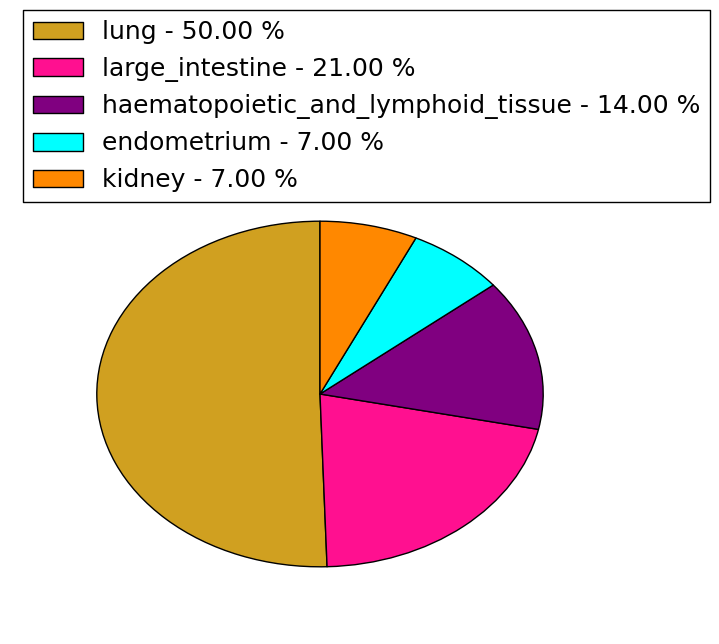
| Mutations for OXCT1 |
| * Under tables are showing count per each tissue to give us broad intuition about tissue specific mutation patterns.You can go to the detailed page for each mutation database's web site. |
| - Statistics for Tissue and Mutation type | Top |
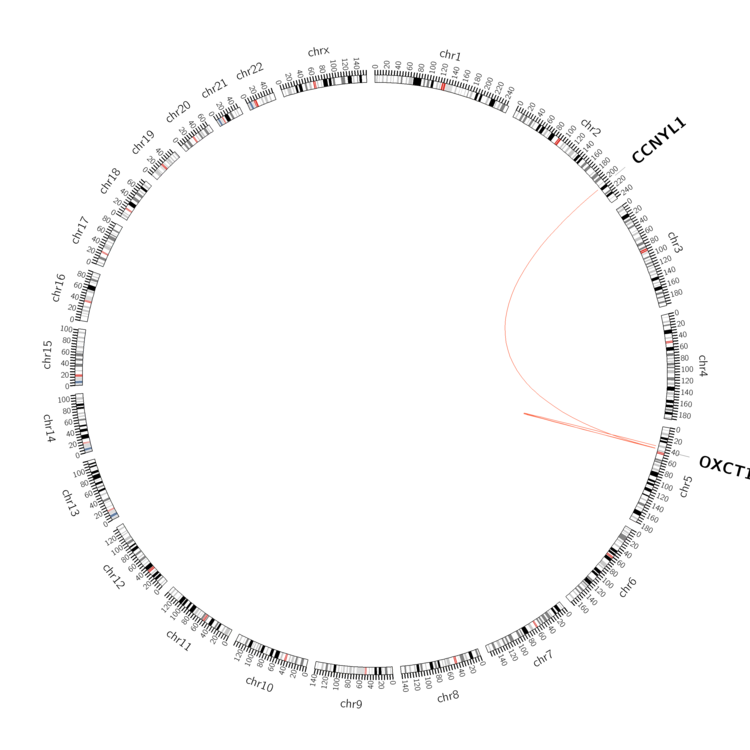 |
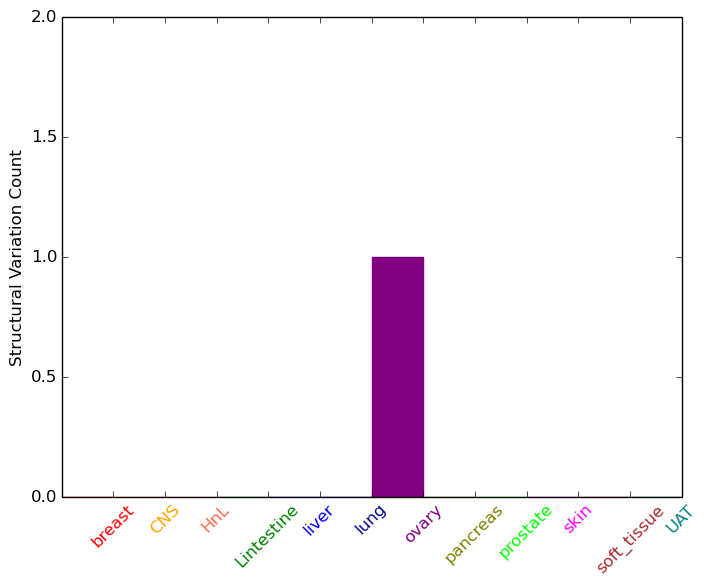
| - For Inter-chromosomal Variations |
| * Inter-chromosomal variantions includes 'interchromosomal amplicon to amplicon', 'interchromosomal amplicon to non-amplified dna', 'interchromosomal insertion', 'Interchromosomal unknown type'. |
 |
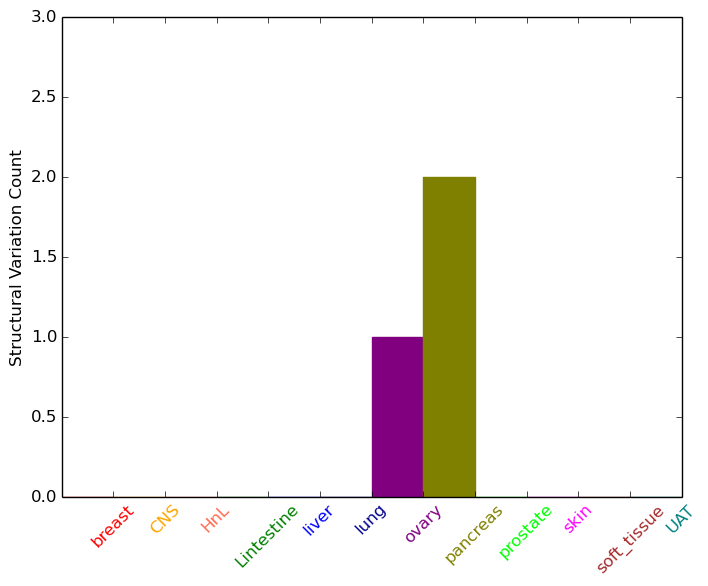
| - For Intra-chromosomal Variations |
| * Intra-chromosomal variantions includes 'intrachromosomal amplicon to amplicon', 'intrachromosomal amplicon to non-amplified dna', 'intrachromosomal deletion', 'intrachromosomal fold-back inversion', 'intrachromosomal inversion', 'intrachromosomal tandem duplication', 'Intrachromosomal unknown type', 'intrachromosomal with inverted orientation', 'intrachromosomal with non-inverted orientation'. |
 |
| Sample | Symbol_a | Chr_a | Start_a | End_a | Symbol_b | Chr_b | Start_b | End_b |
| ovary | OXCT1 | chr5 | 41796553 | 41796573 | OXCT1 | chr5 | 41840886 | 41840906 |
| pancreas | OXCT1 | chr5 | 41765091 | 41765111 | chr5 | 37088127 | 37088147 | |
| pancreas | OXCT1 | chr5 | 41851989 | 41852009 | chr5 | 42043957 | 42043977 |
| cf) Tissue number; Tissue name (1;Breast, 2;Central_nervous_system, 3;Haematopoietic_and_lymphoid_tissue, 4;Large_intestine, 5;Liver, 6;Lung, 7;Ovary, 8;Pancreas, 9;Prostate, 10;Skin, 11;Soft_tissue, 12;Upper_aerodigestive_tract) |
| * From mRNA Sanger sequences, Chitars2.0 arranged chimeric transcripts. This table shows OXCT1 related fusion information. |
| ID | Head Gene | Tail Gene | Accession | Gene_a | qStart_a | qEnd_a | Chromosome_a | tStart_a | tEnd_a | Gene_a | qStart_a | qEnd_a | Chromosome_a | tStart_a | tEnd_a |
| Top |
| Mutation type/ Tissue ID | brca | cns | cerv | endome | haematopo | kidn | Lintest | liver | lung | ns | ovary | pancre | prost | skin | stoma | thyro | urina | |||
| Total # sample | 2 | 2 | 3 | 2 | 1 | |||||||||||||||
| GAIN (# sample) | 2 | 2 | 3 | 2 | 1 | |||||||||||||||
| LOSS (# sample) |
| cf) Tissue ID; Tissue type (1; Breast, 2; Central_nervous_system, 3; Cervix, 4; Endometrium, 5; Haematopoietic_and_lymphoid_tissue, 6; Kidney, 7; Large_intestine, 8; Liver, 9; Lung, 10; NS, 11; Ovary, 12; Pancreas, 13; Prostate, 14; Skin, 15; Stomach, 16; Thyroid, 17; Urinary_tract) |
| Top |
|
 |
| Top |
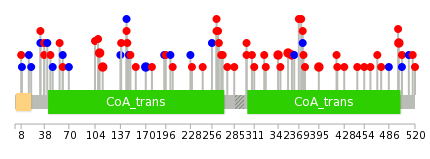
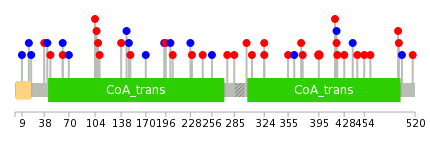
| Stat. for Non-Synonymous SNVs (# total SNVs=45) | (# total SNVs=14) |
 |  |
(# total SNVs=0) | (# total SNVs=0) |
| Top |
| * When you move the cursor on each content, you can see more deailed mutation information on the Tooltip. Those are primary_site,primary_histology,mutation(aa),pubmedID. |
| GRCh37 position | Mutation(aa) | Unique sampleID count |
| chr5:41850282-41850282 | p.? | 3 |
| chr5:41803197-41803197 | p.Q342E | 2 |
| chr5:41850261-41850261 | p.I145I | 2 |
| chr5:41853594-41853594 | p.S114L | 2 |
| chr5:41853606-41853606 | p.R110H | 2 |
| chr5:41850186-41850186 | p.S170S | 2 |
| chr5:41805723-41805723 | p.V301I | 2 |
| chr5:41739516-41739516 | p.Q499H | 2 |
| chr5:41801144-41801144 | p.D360G | 2 |
| chr5:41794170-41794170 | p.D395N | 2 |
| Top |
|
 |
| Point Mutation/ Tissue ID | 1 | 2 | 3 | 4 | 5 | 6 | 7 | 8 | 9 | 10 | 11 | 12 | 13 | 14 | 15 | 16 | 17 | 18 | 19 | 20 |
| # sample | 1 | 1 | 1 | 7 | 1 | 1 | 7 | 3 | 2 | 6 | 6 | 10 | ||||||||
| # mutation | 1 | 1 | 1 | 6 | 1 | 1 | 8 | 3 | 2 | 6 | 8 | 10 | ||||||||
| nonsynonymous SNV | 1 | 3 | 1 | 4 | 3 | 2 | 4 | 5 | 9 | |||||||||||
| synonymous SNV | 1 | 1 | 4 | 1 | 4 | 2 | 3 | 1 |
| cf) Tissue ID; Tissue type (1; BLCA[Bladder Urothelial Carcinoma], 2; BRCA[Breast invasive carcinoma], 3; CESC[Cervical squamous cell carcinoma and endocervical adenocarcinoma], 4; COAD[Colon adenocarcinoma], 5; GBM[Glioblastoma multiforme], 6; Glioma Low Grade, 7; HNSC[Head and Neck squamous cell carcinoma], 8; KICH[Kidney Chromophobe], 9; KIRC[Kidney renal clear cell carcinoma], 10; KIRP[Kidney renal papillary cell carcinoma], 11; LAML[Acute Myeloid Leukemia], 12; LUAD[Lung adenocarcinoma], 13; LUSC[Lung squamous cell carcinoma], 14; OV[Ovarian serous cystadenocarcinoma ], 15; PAAD[Pancreatic adenocarcinoma], 16; PRAD[Prostate adenocarcinoma], 17; SKCM[Skin Cutaneous Melanoma], 18:STAD[Stomach adenocarcinoma], 19:THCA[Thyroid carcinoma], 20:UCEC[Uterine Corpus Endometrial Carcinoma]) |
| Top |
| * We represented just top 10 SNVs. When you move the cursor on each content, you can see more deailed mutation information on the Tooltip. Those are primary_site, primary_histology, mutation(aa), pubmedID. |
| Genomic Position | Mutation(aa) | Unique sampleID count |
| chr5:41762297 | p.G324E | 2 |
| chr5:41794170 | p.K418K | 2 |
| chr5:41803250 | p.D395N | 2 |
| chr5:41850186 | p.T372N | 1 |
| chr5:41762295 | p.S170S | 1 |
| chr5:41862746 | p.R18R | 1 |
| chr5:41805770 | p.L363L | 1 |
| chr5:41850248 | p.A150T | 1 |
| chr5:41862794 | p.S9S | 1 |
| chr5:41807445 | p.R355Q | 1 |
| * Copy number data were extracted from TCGA using R package TCGA-Assembler. The URLs of all public data files on TCGA DCC data server were gathered on Jan-05-2015. Function ProcessCNAData in TCGA-Assembler package was used to obtain gene-level copy number value which is calculated as the average copy number of the genomic region of a gene. |
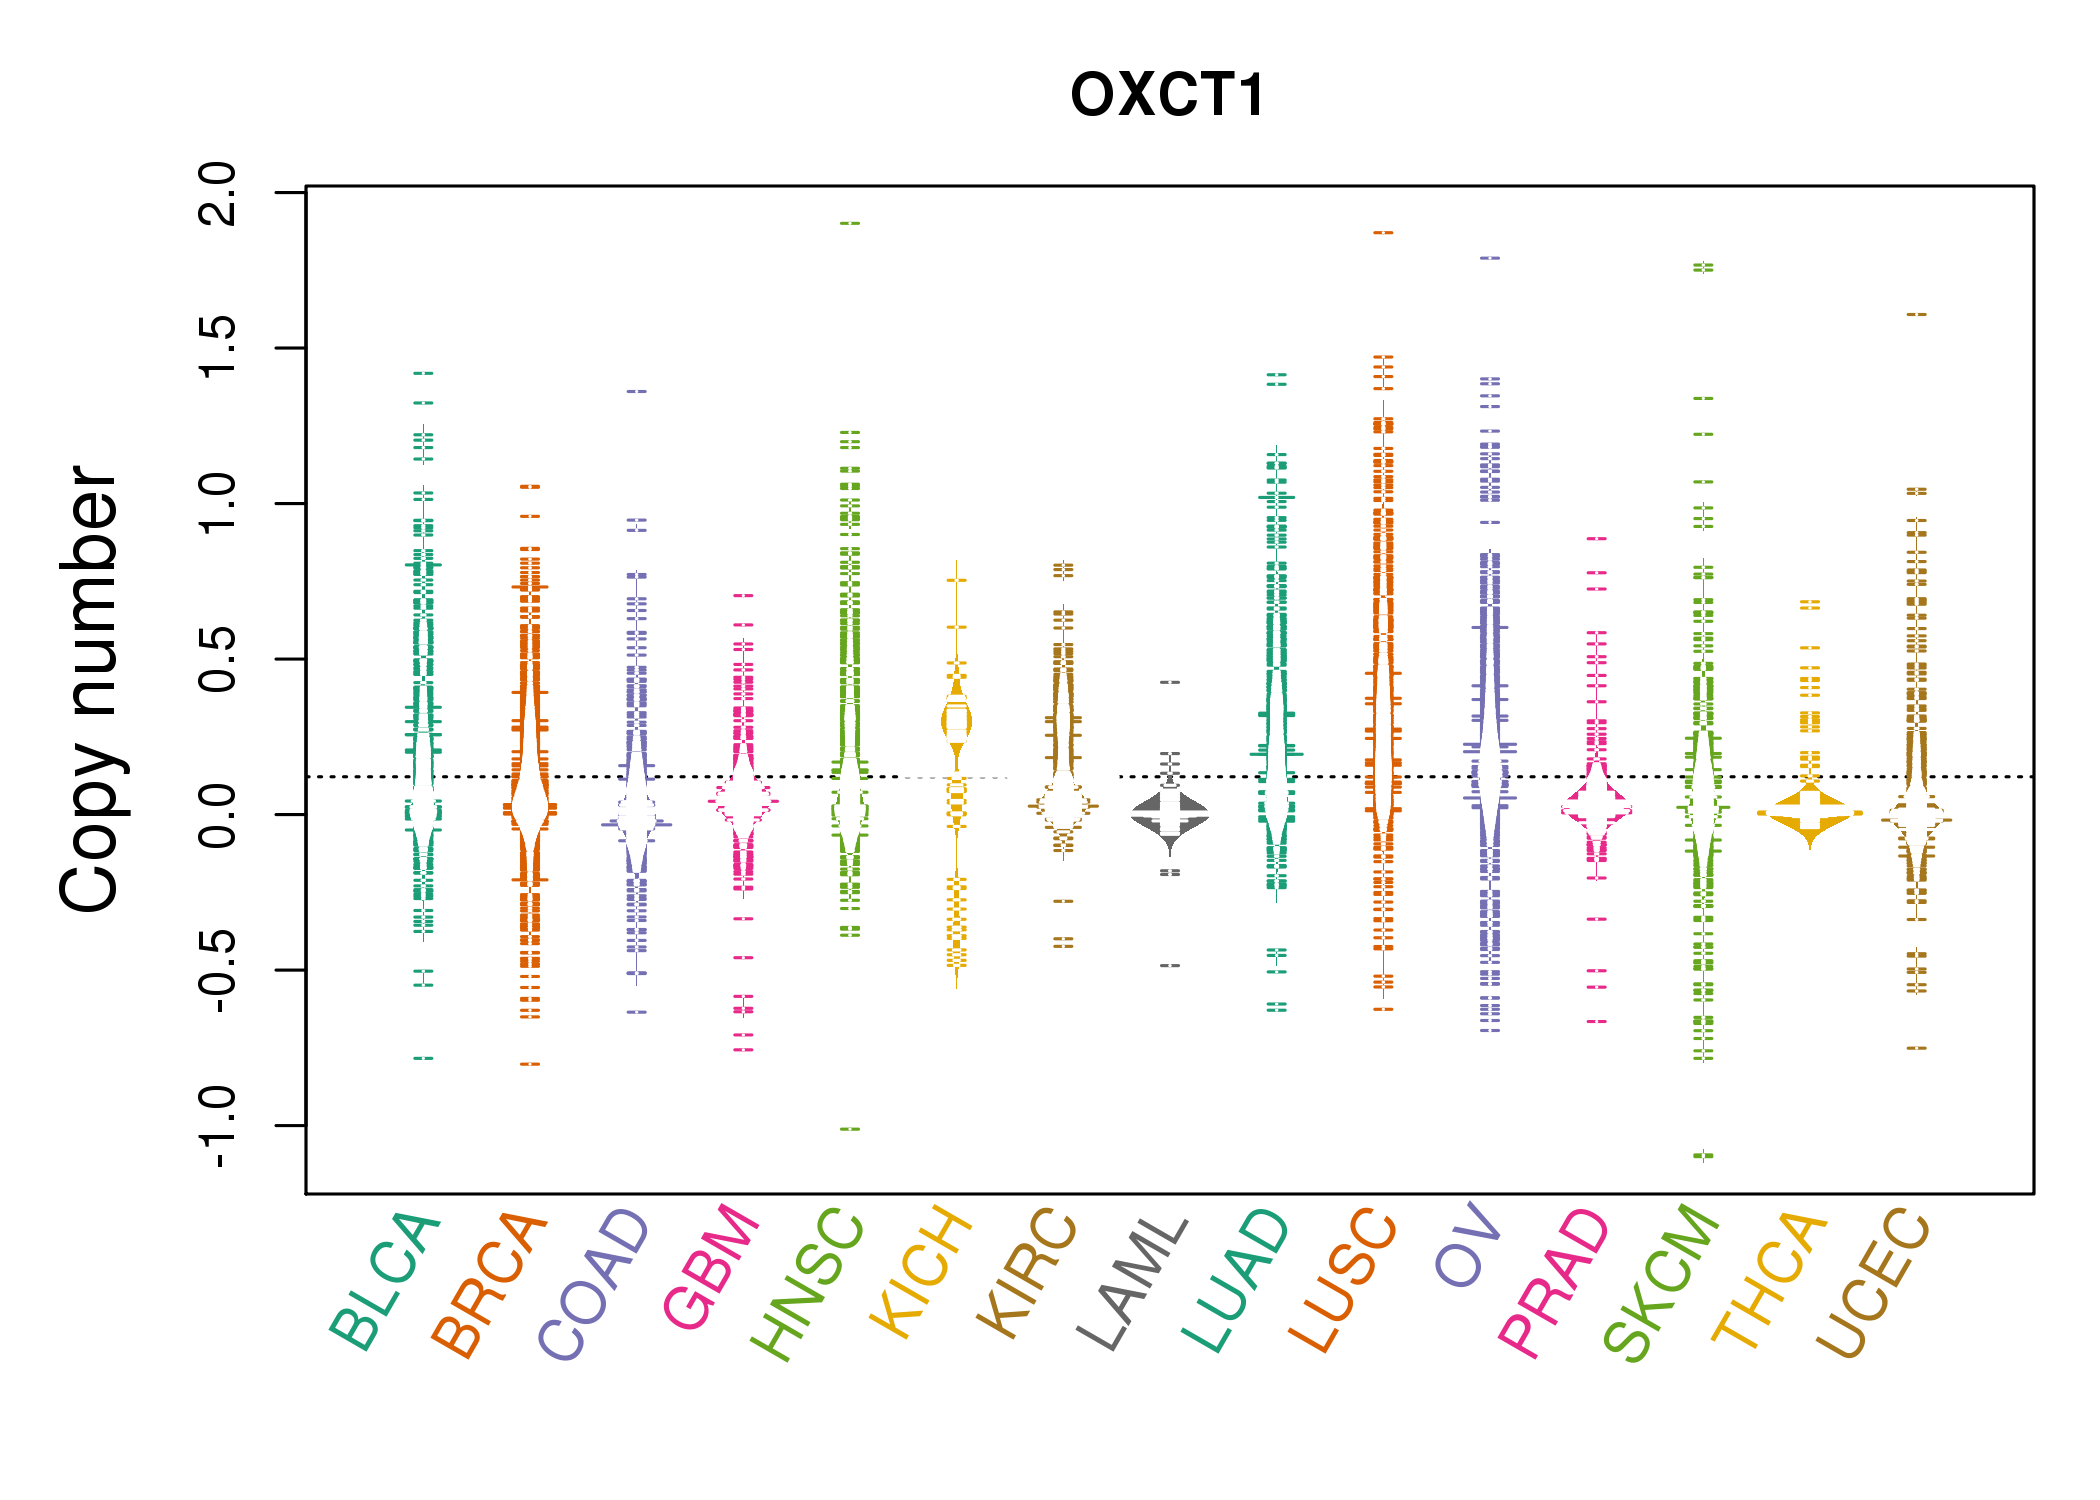 |
| cf) Tissue ID[Tissue type]: BLCA[Bladder Urothelial Carcinoma], BRCA[Breast invasive carcinoma], CESC[Cervical squamous cell carcinoma and endocervical adenocarcinoma], COAD[Colon adenocarcinoma], GBM[Glioblastoma multiforme], Glioma Low Grade, HNSC[Head and Neck squamous cell carcinoma], KICH[Kidney Chromophobe], KIRC[Kidney renal clear cell carcinoma], KIRP[Kidney renal papillary cell carcinoma], LAML[Acute Myeloid Leukemia], LUAD[Lung adenocarcinoma], LUSC[Lung squamous cell carcinoma], OV[Ovarian serous cystadenocarcinoma ], PAAD[Pancreatic adenocarcinoma], PRAD[Prostate adenocarcinoma], SKCM[Skin Cutaneous Melanoma], STAD[Stomach adenocarcinoma], THCA[Thyroid carcinoma], UCEC[Uterine Corpus Endometrial Carcinoma] |
| Top |
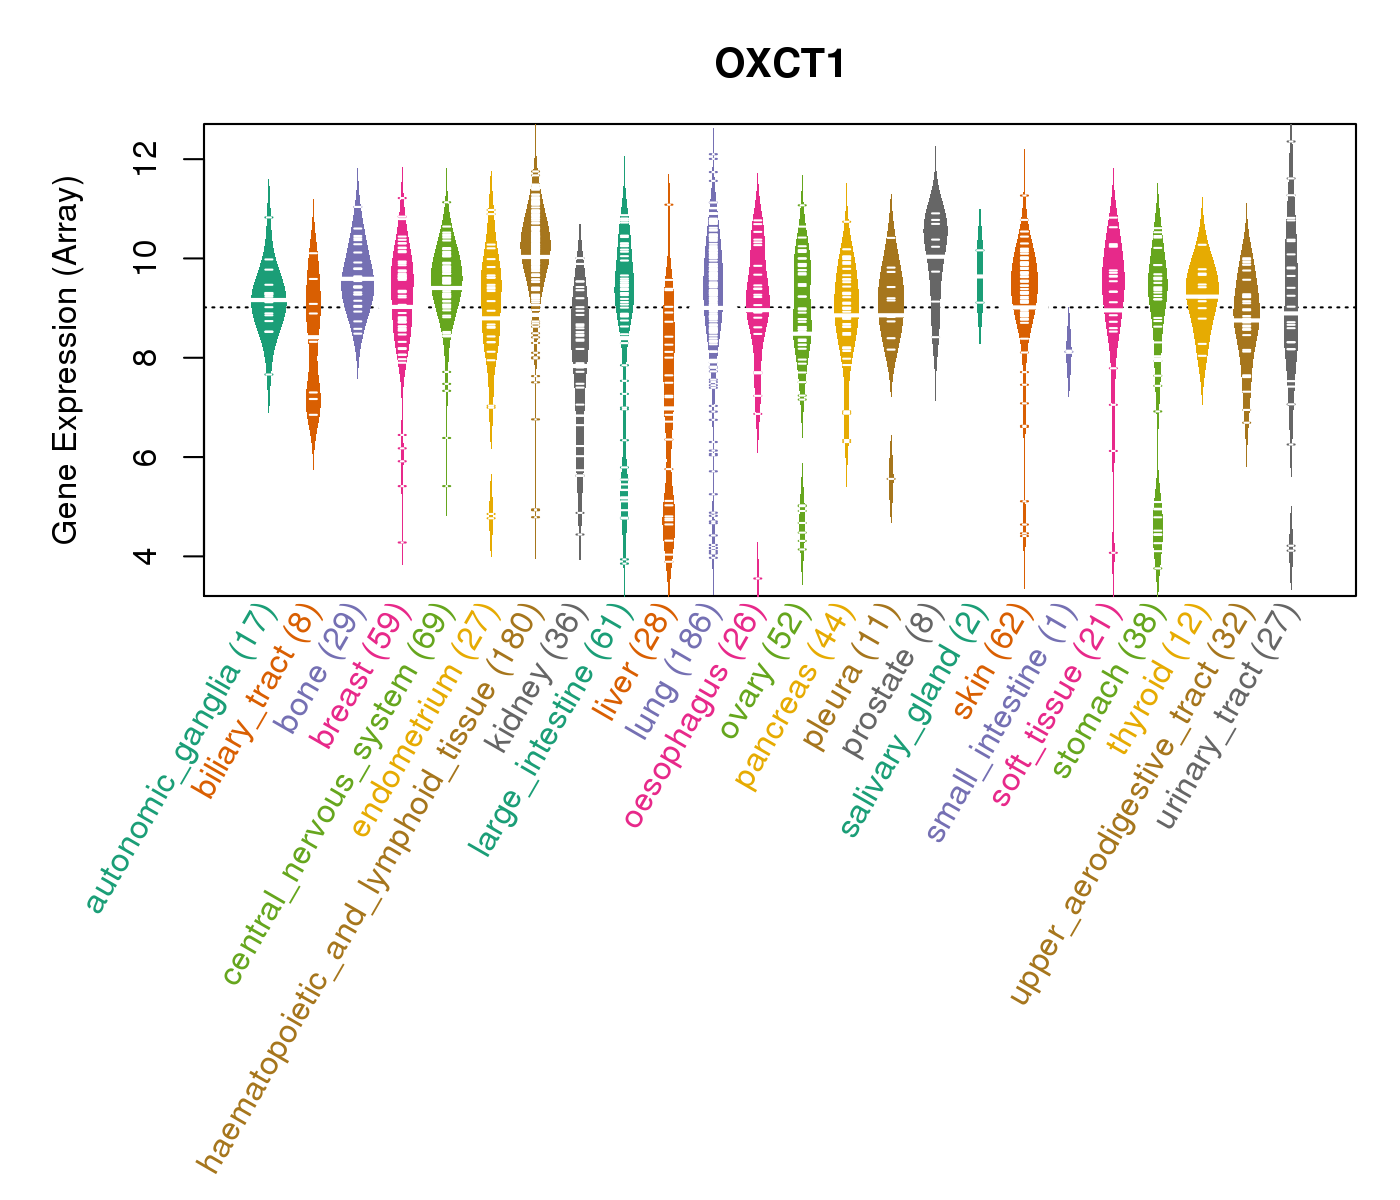
| Gene Expression for OXCT1 |
| * CCLE gene expression data were extracted from CCLE_Expression_Entrez_2012-10-18.res: Gene-centric RMA-normalized mRNA expression data. |
 |
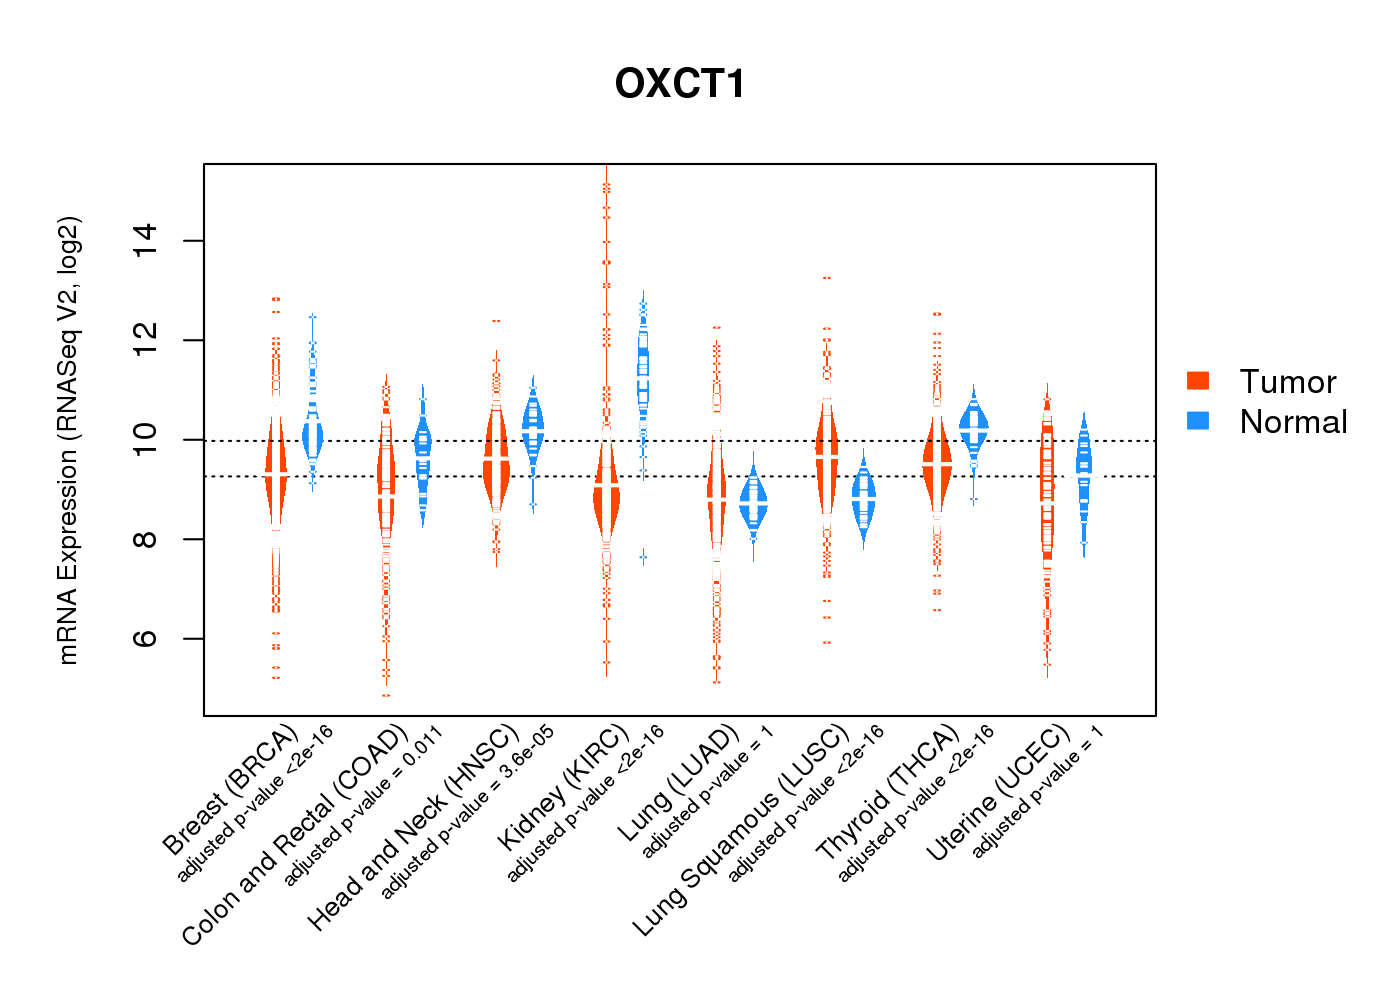
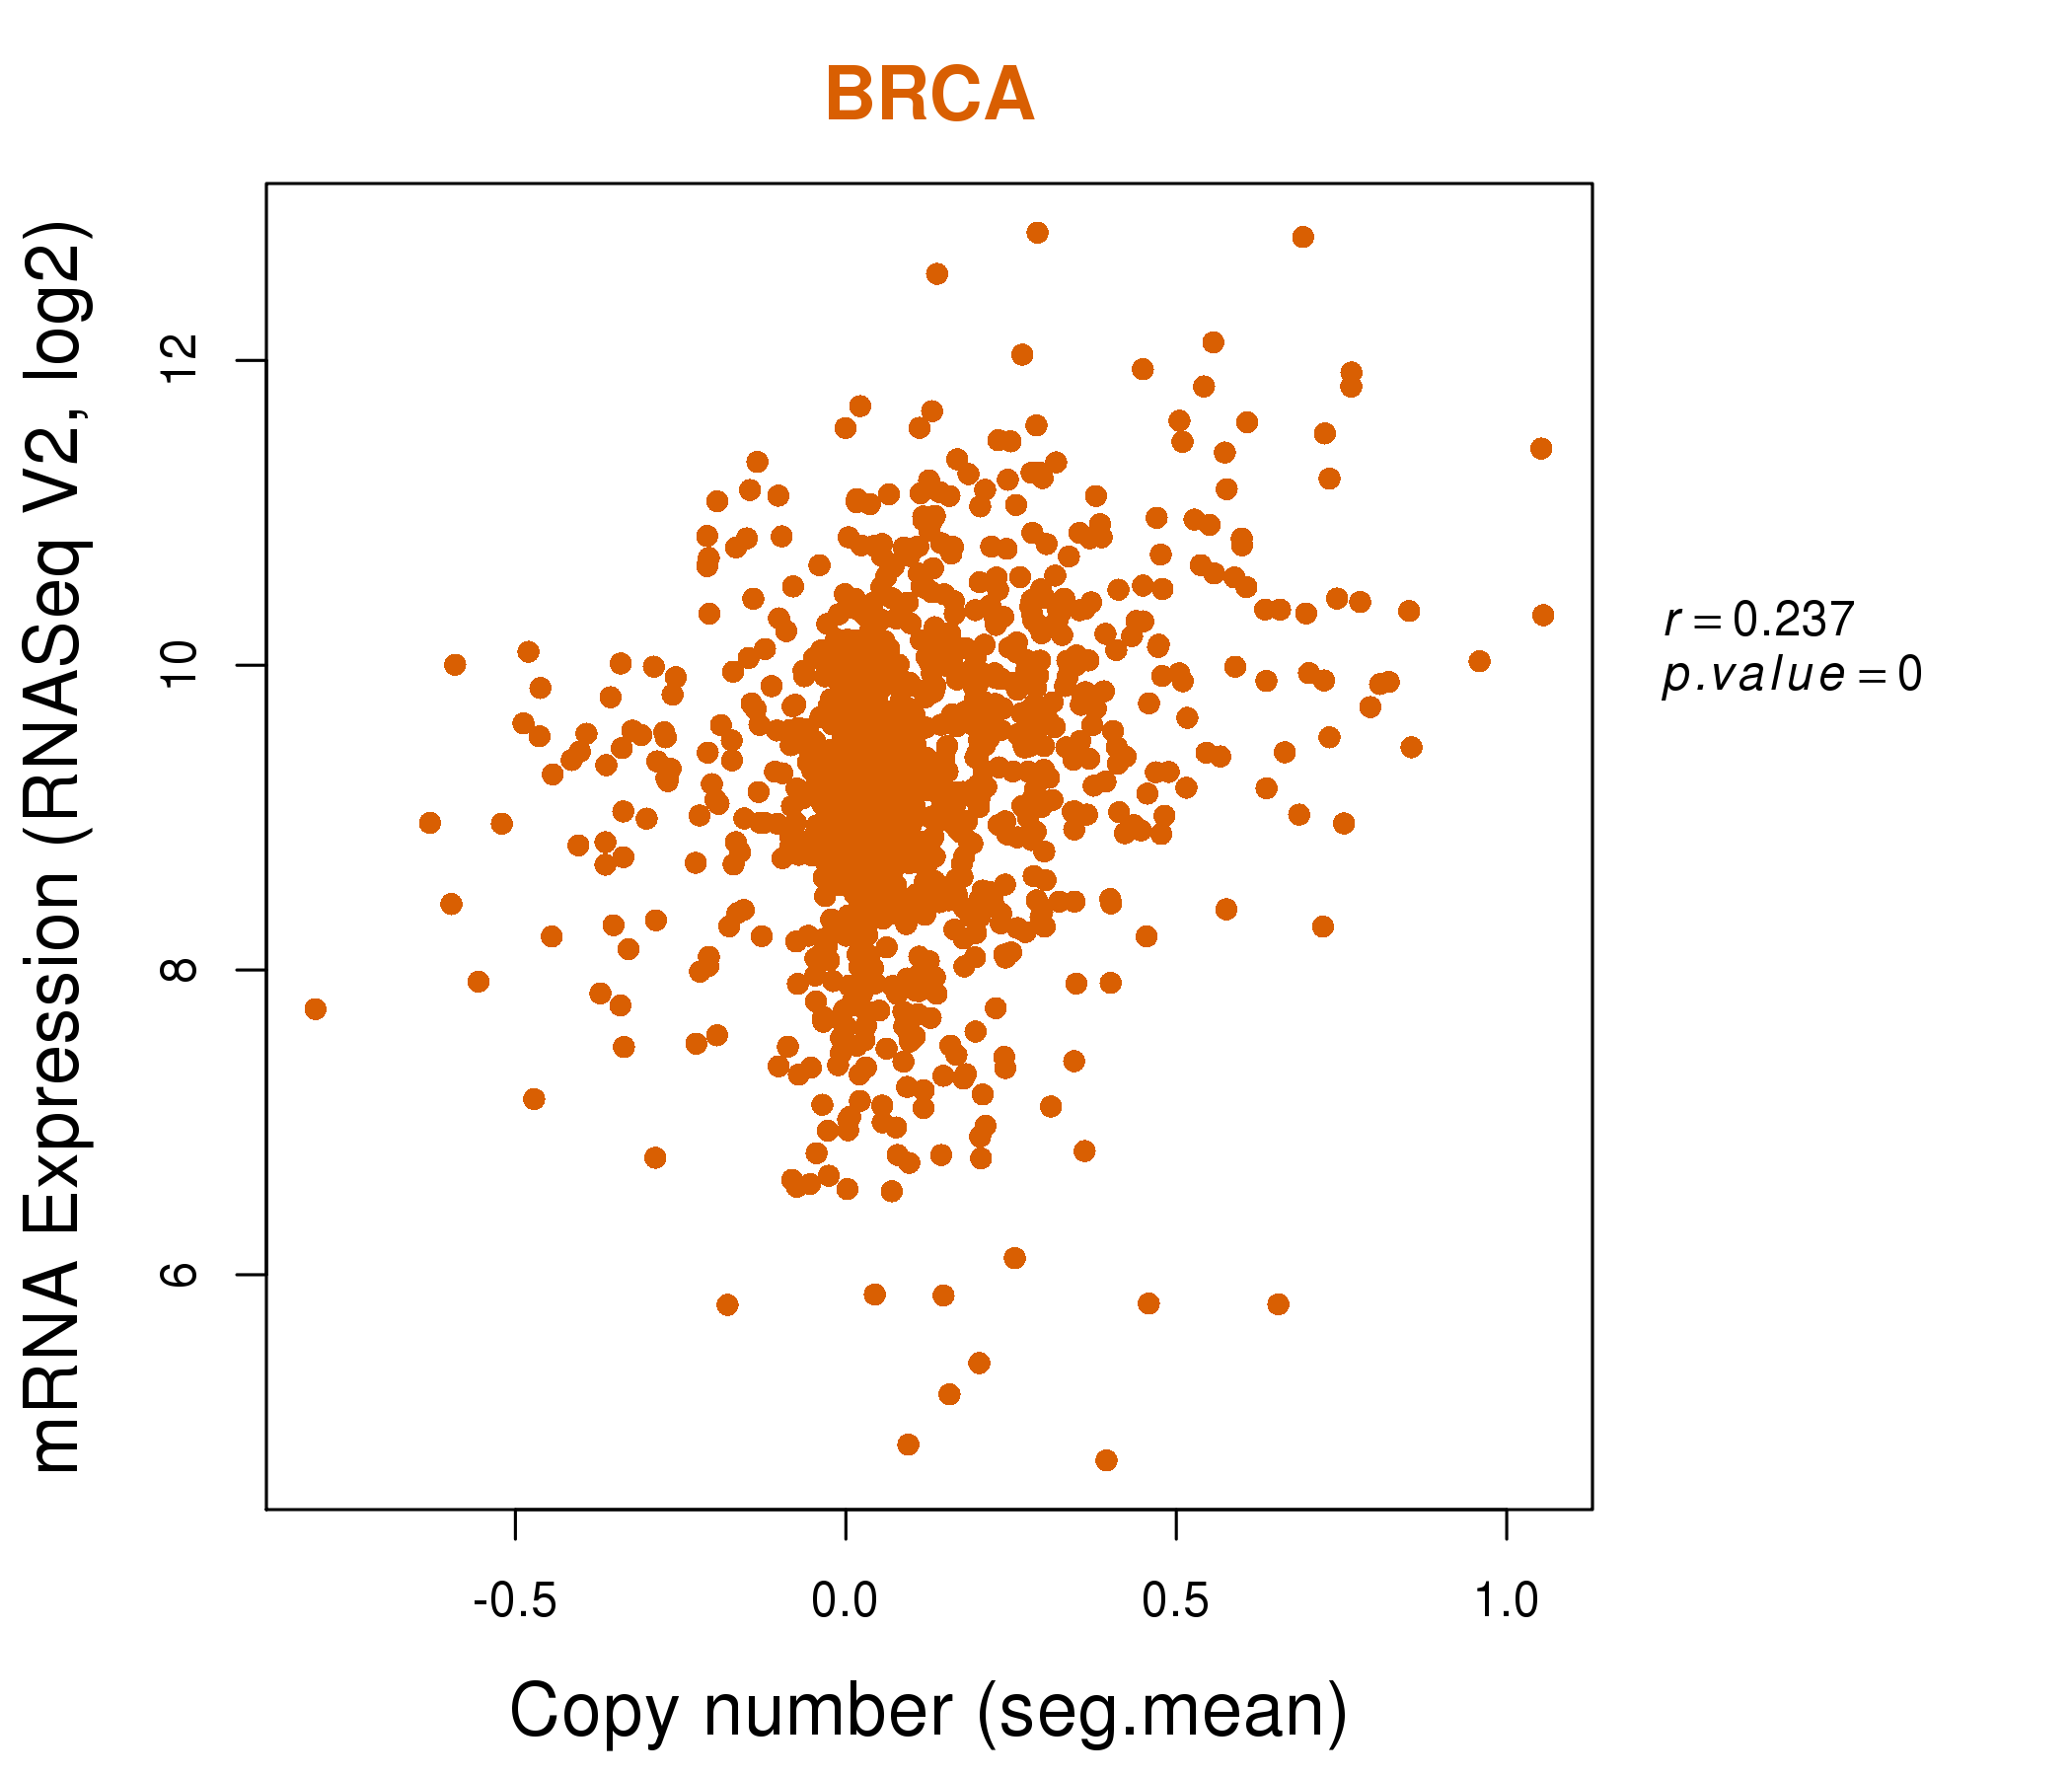
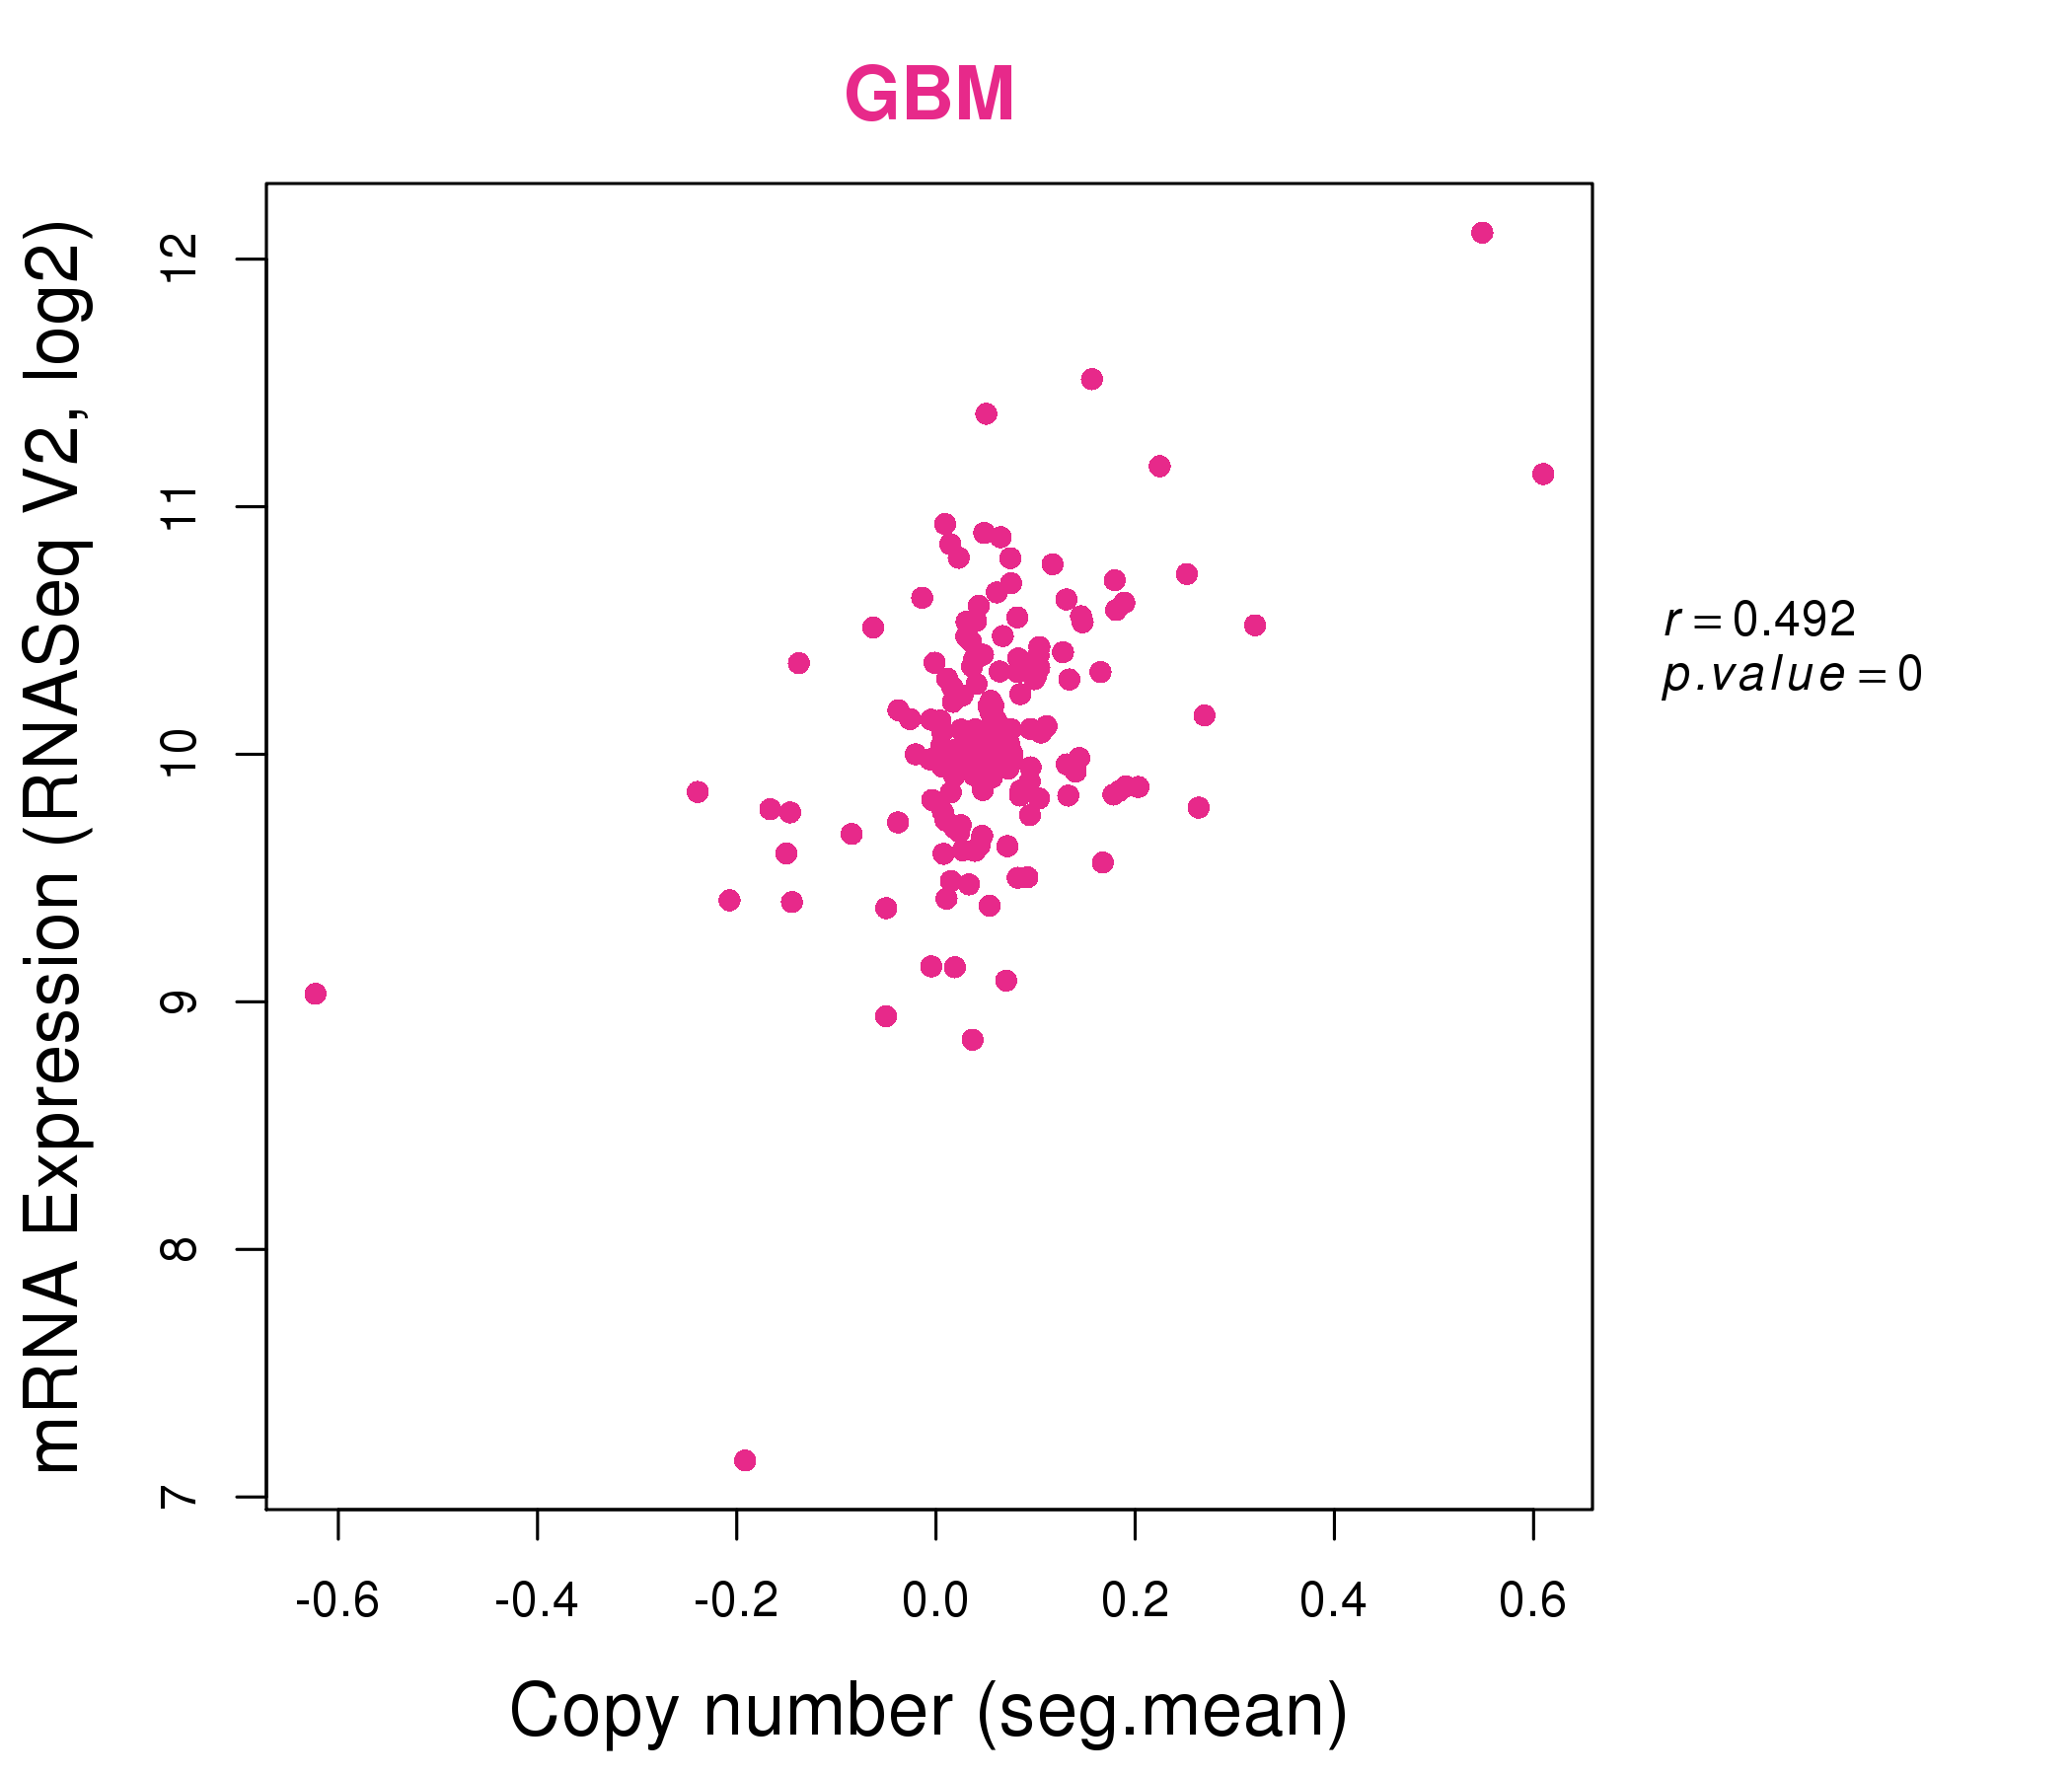
| * Normalized gene expression data of RNASeqV2 was extracted from TCGA using R package TCGA-Assembler. The URLs of all public data files on TCGA DCC data server were gathered at Jan-05-2015. Only eight cancer types have enough normal control samples for differential expression analysis. (t test, adjusted p<0.05 (using Benjamini-Hochberg FDR)) |
 |
| Top |
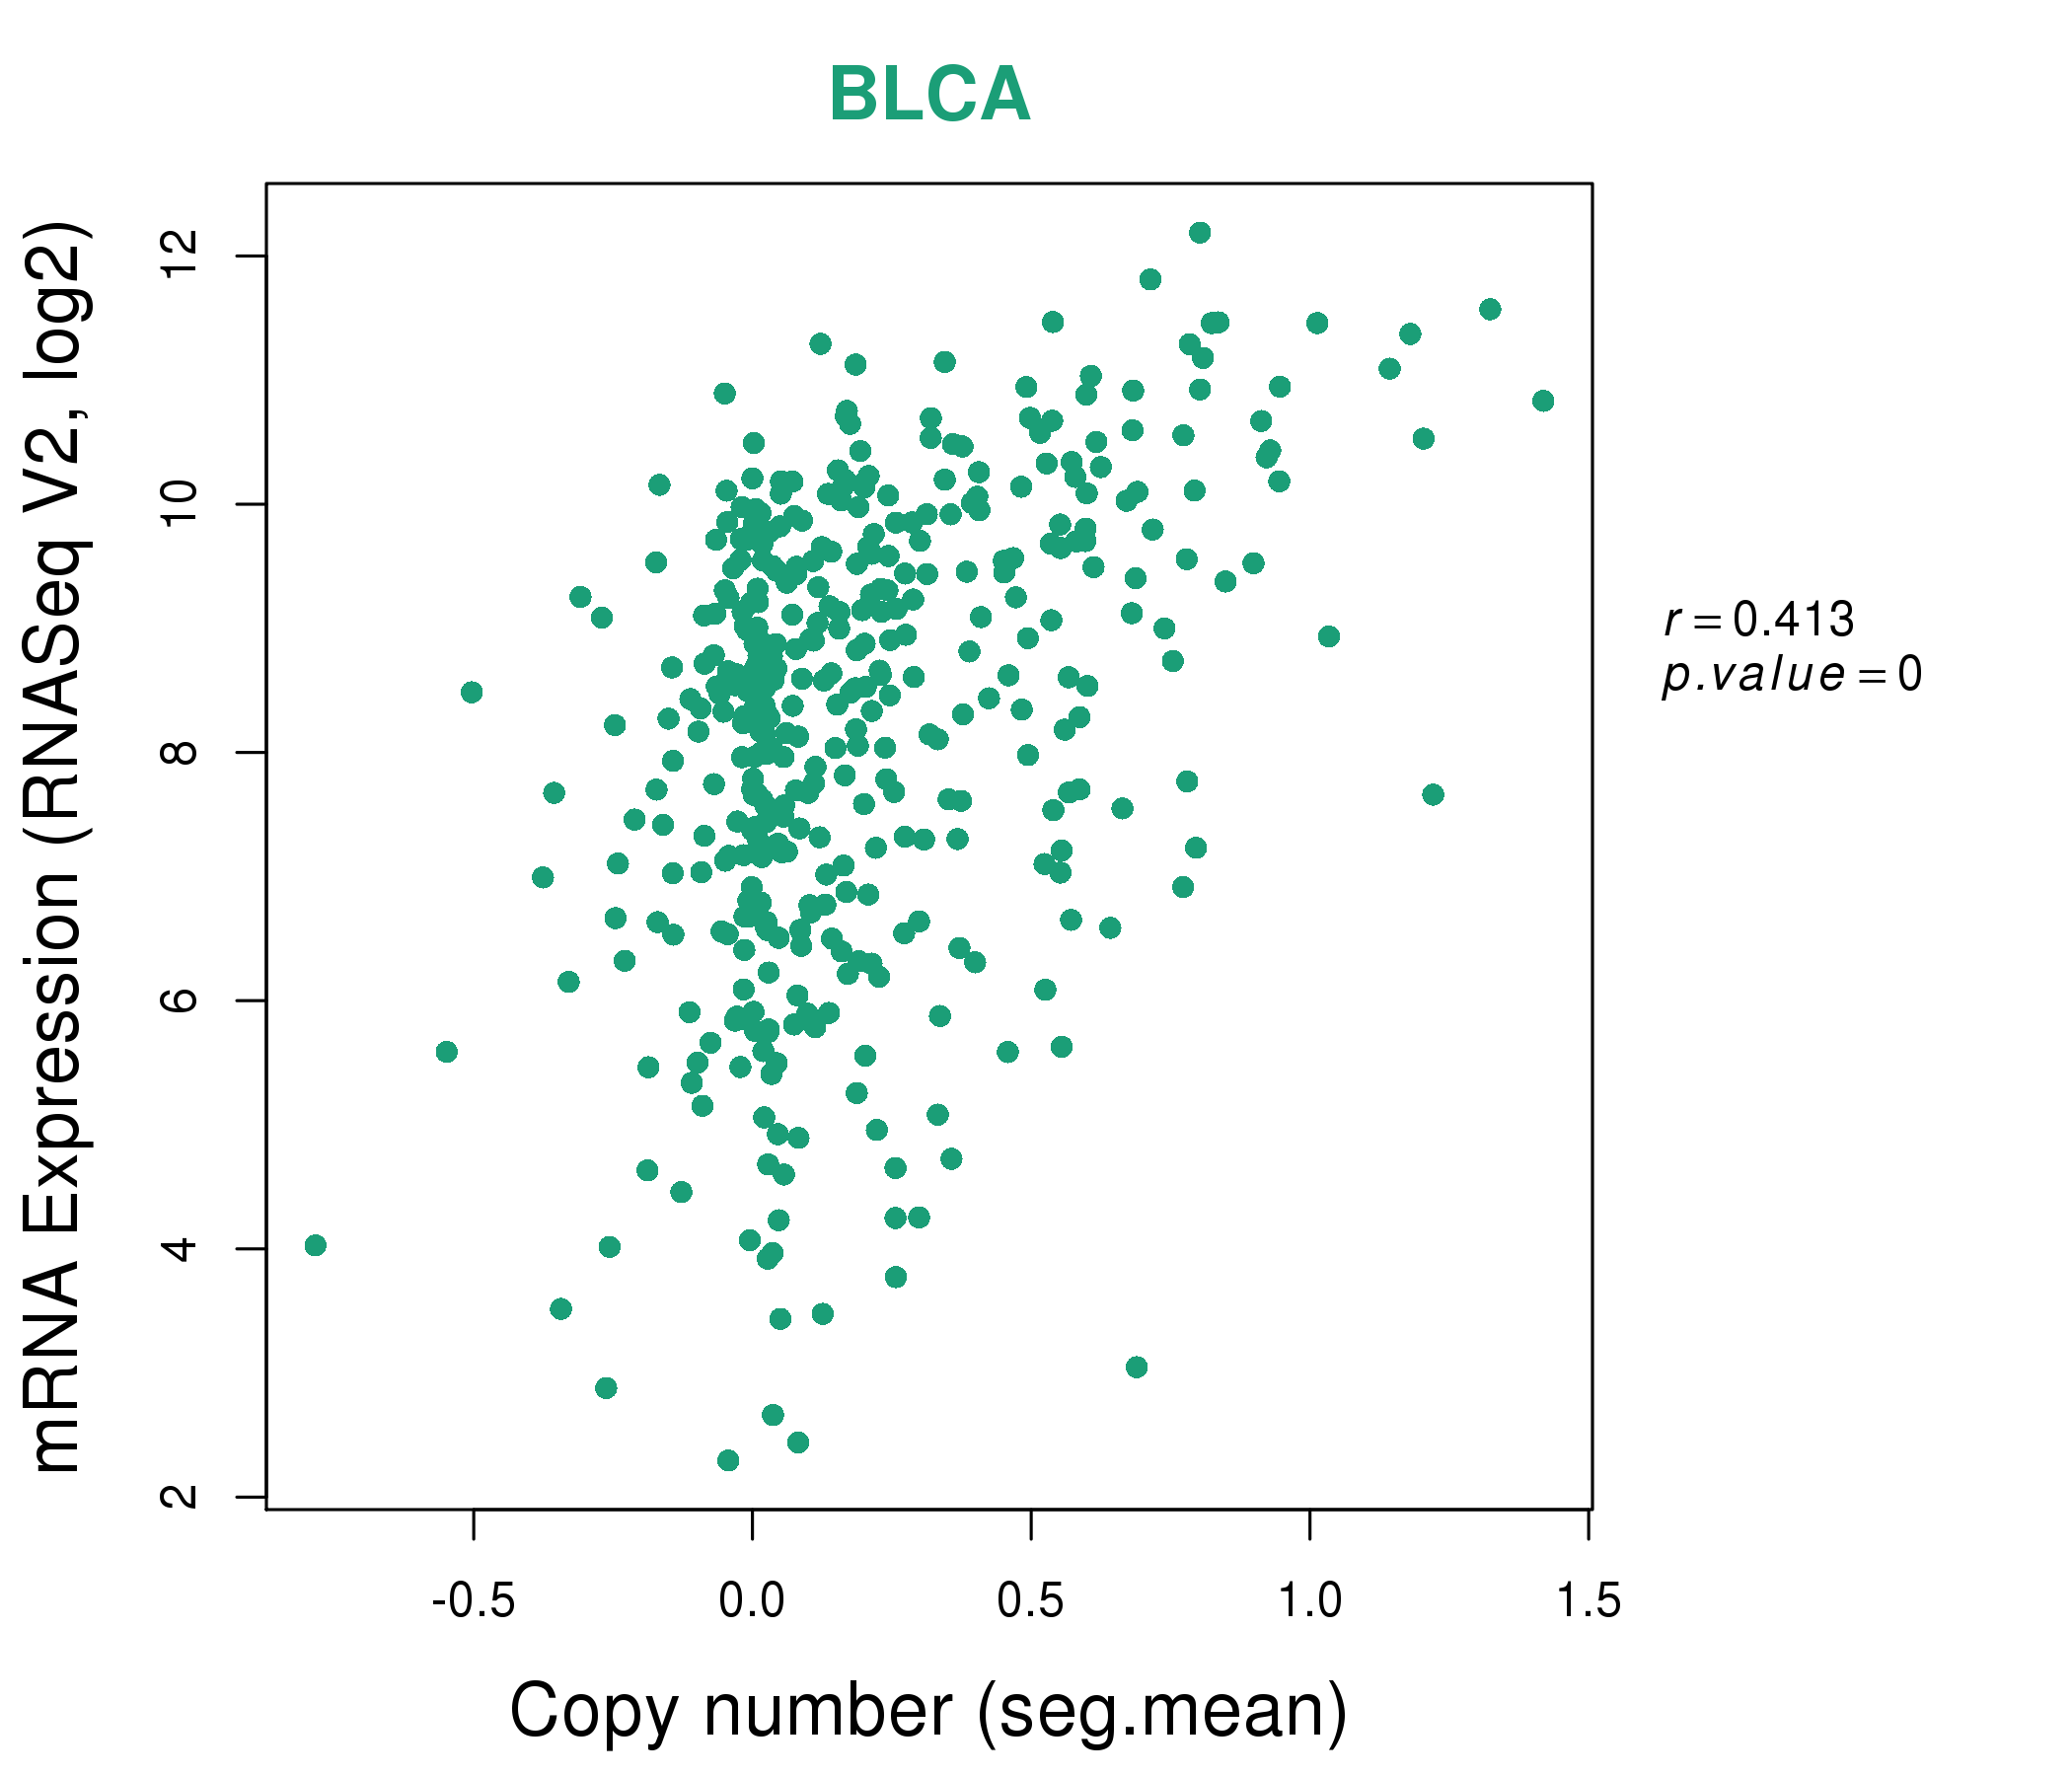
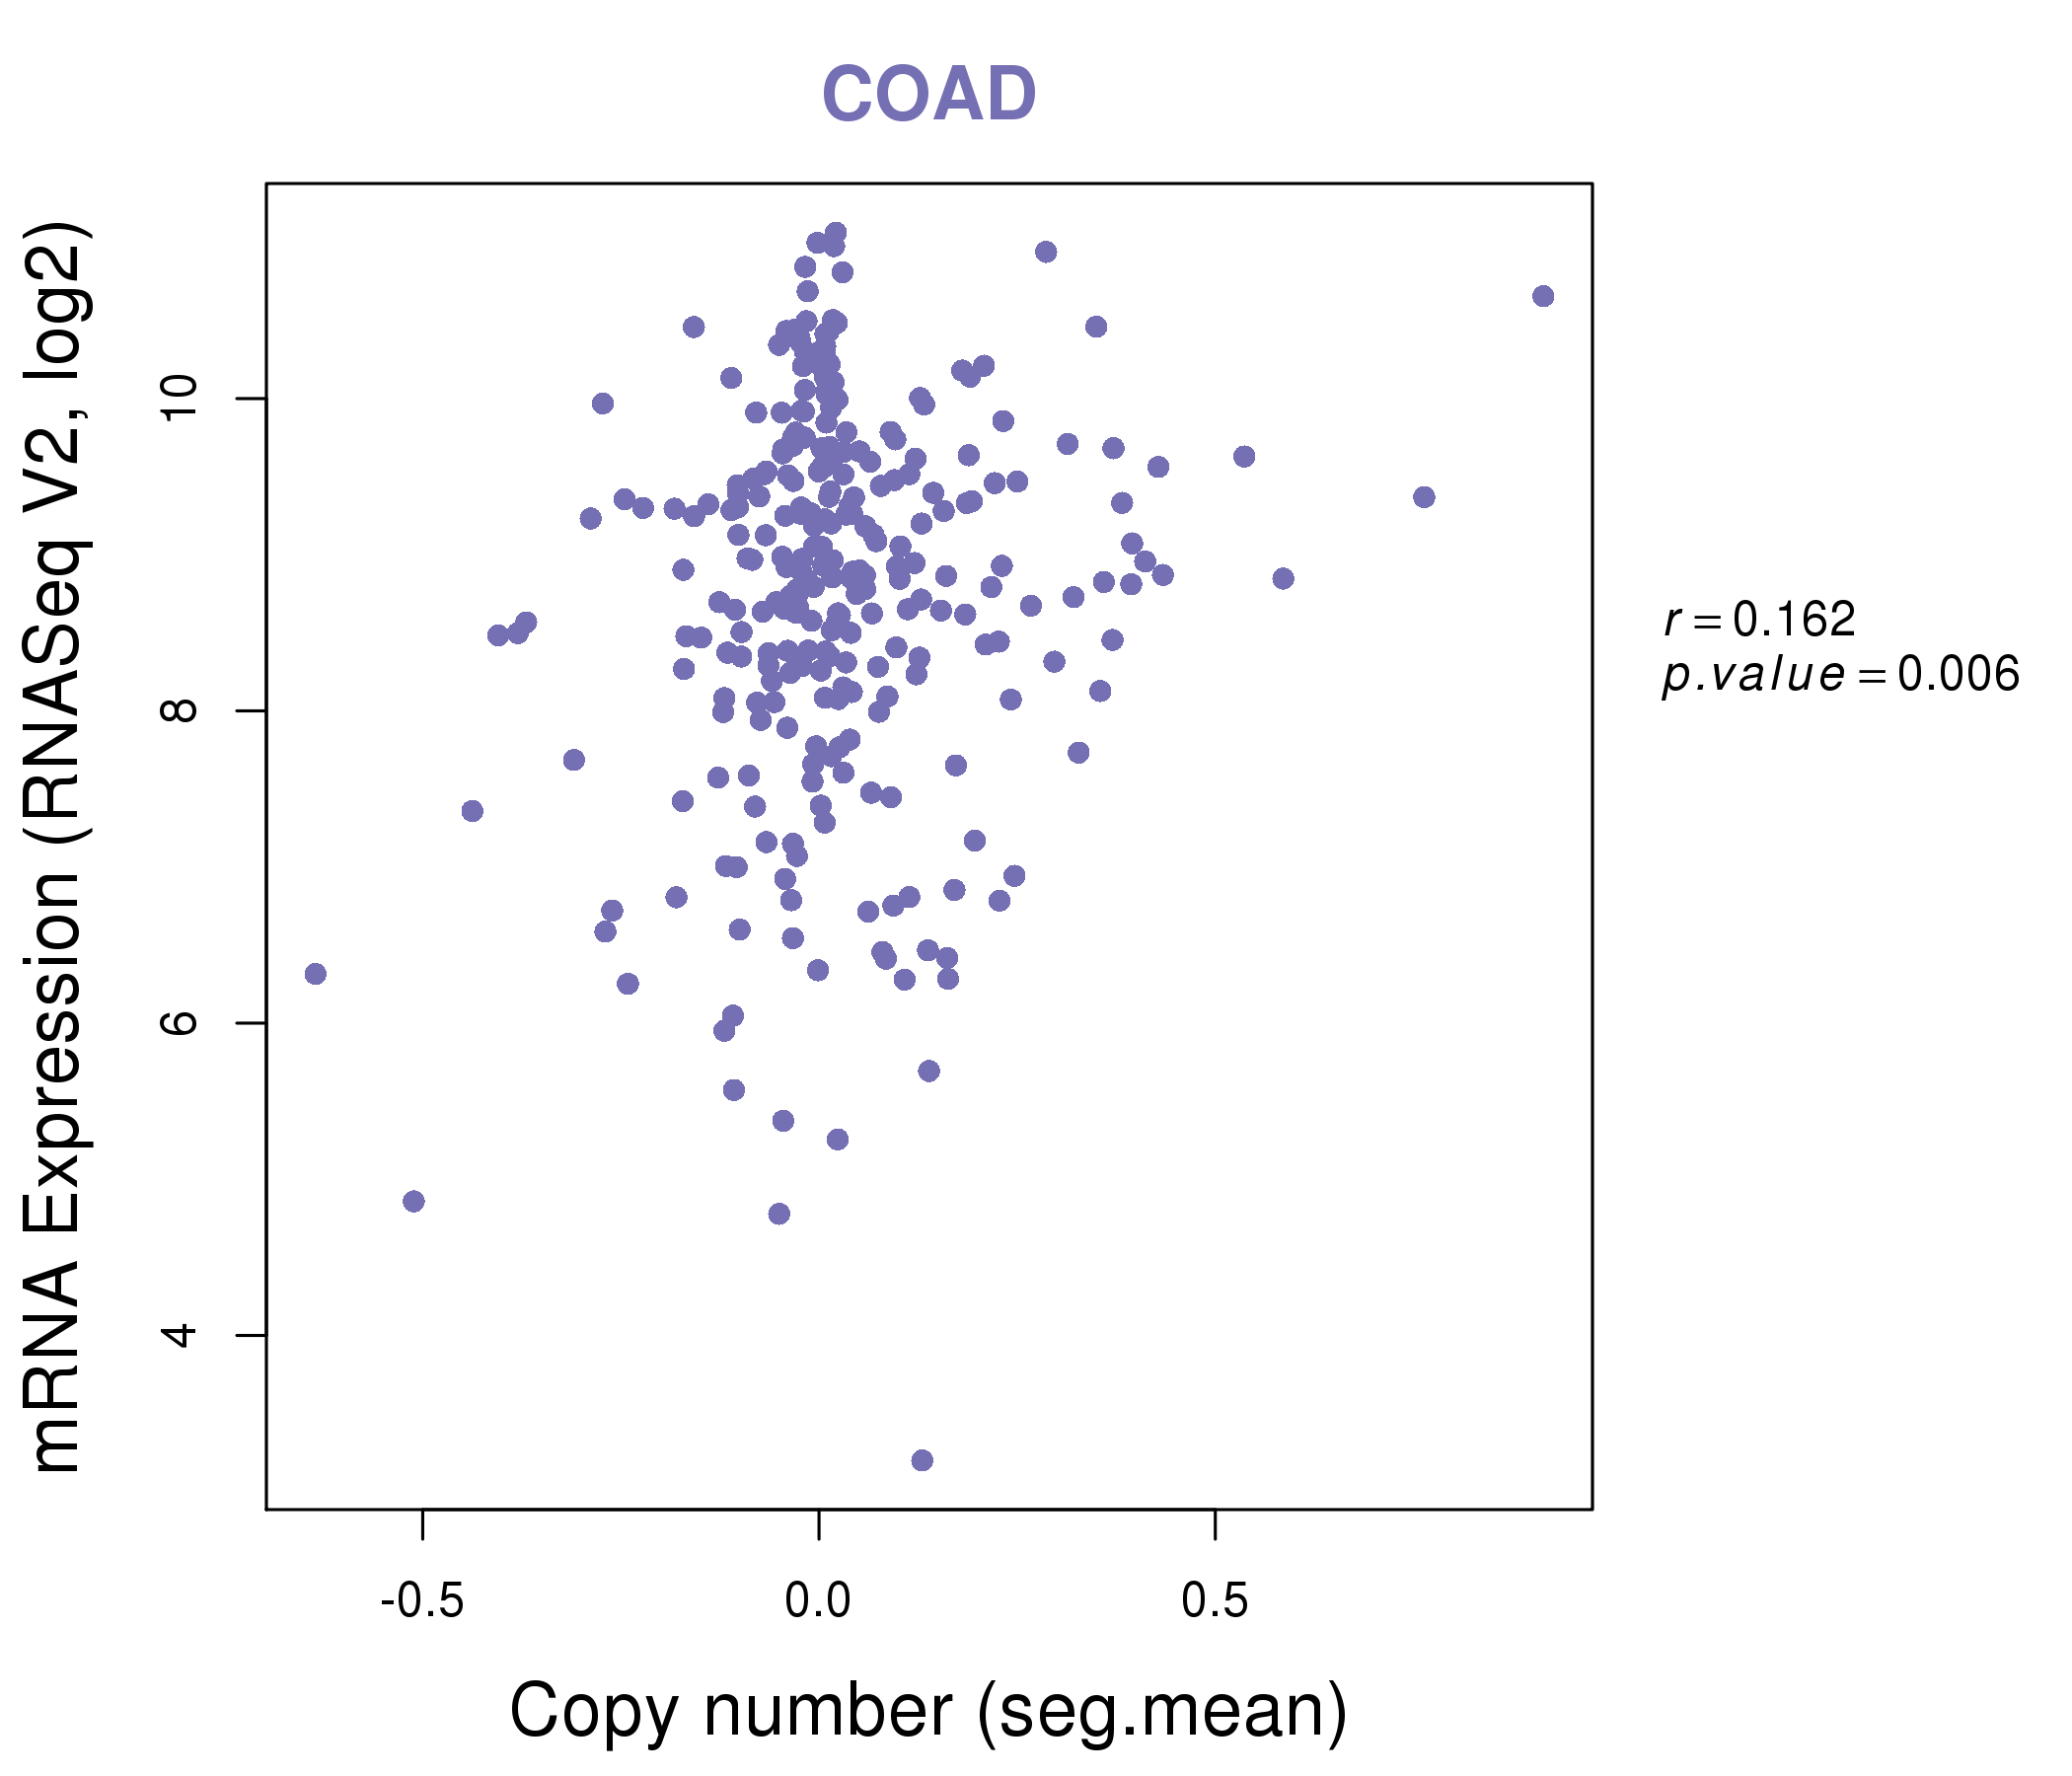
| * This plots show the correlation between CNV and gene expression. |
: Open all plots for all cancer types
 |
|
 |
|
| Top |
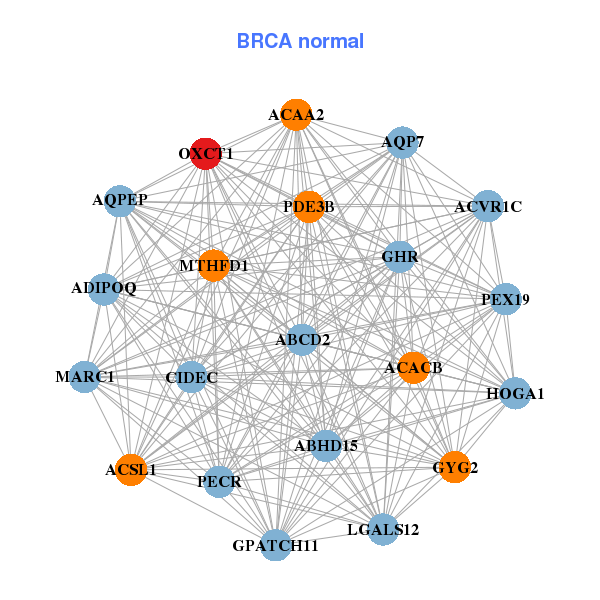
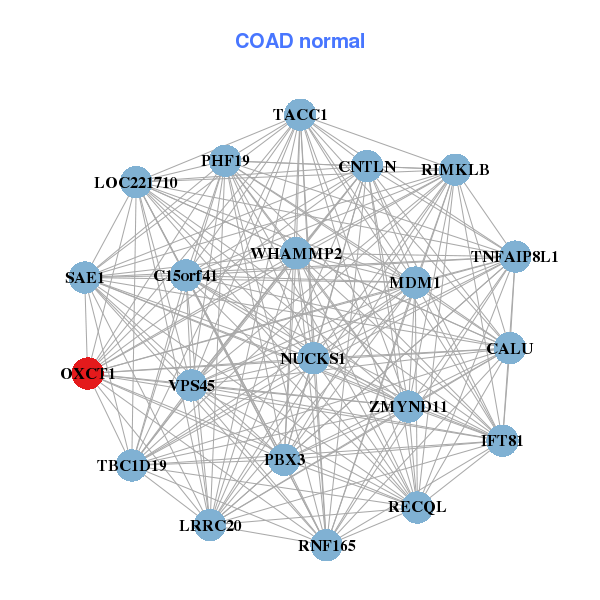
| Gene-Gene Network Information |
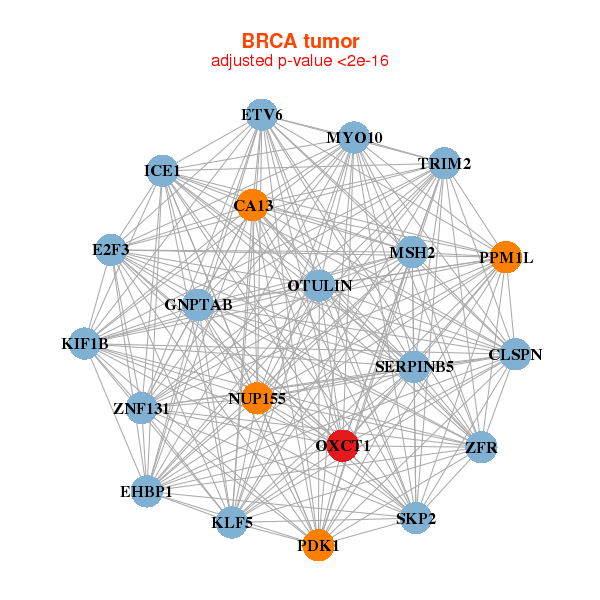
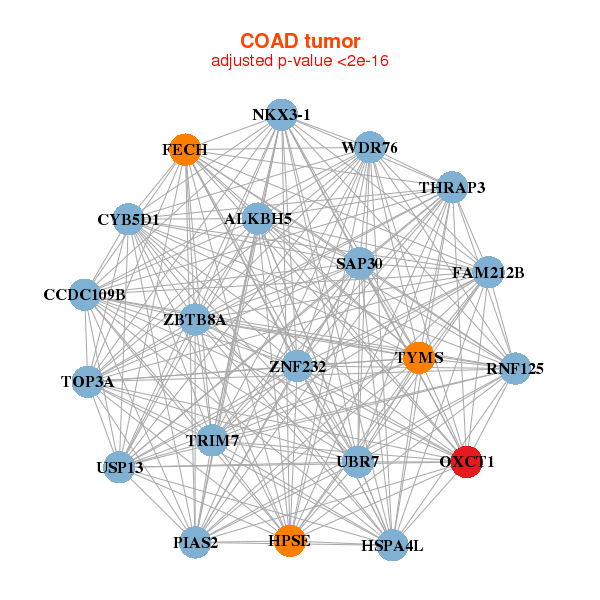
| * Co-Expression network figures were drawn using R package igraph. Only the top 20 genes with the highest correlations were shown. Red circle: input gene, orange circle: cell metabolism gene, sky circle: other gene |
: Open all plots for all cancer types
 |
| ||||
| CA13,CLSPN,E2F3,EHBP1,ETV6,OTULIN,GNPTAB, ICE1,KIF1B,KLF5,MSH2,MYO10,NUP155,OXCT1, PDK1,PPM1L,SERPINB5,SKP2,TRIM2,ZFR,ZNF131 | ABCD2,ABHD15,ACAA2,ACACB,ACSL1,ACVR1C,ADIPOQ, AQP7,AQPEP,GPATCH11,CIDEC,HOGA1,GHR,GYG2, LGALS12,MARC1,MTHFD1,OXCT1,PDE3B,PECR,PEX19 | ||||
 |
| ||||
| ALKBH5,FAM212B,CCDC109B,CYB5D1,FECH,HPSE,HSPA4L, NKX3-1,OXCT1,PIAS2,RNF125,SAP30,THRAP3,TOP3A, TRIM7,TYMS,UBR7,USP13,WDR76,ZBTB8A,ZNF232 | C15orf41,CALU,CNTLN,IFT81,LOC221710,LRRC20,MDM1, NUCKS1,OXCT1,PBX3,PHF19,RECQL,RIMKLB,RNF165, SAE1,TACC1,TBC1D19,TNFAIP8L1,VPS45,WHAMMP2,ZMYND11 |
| * Co-Expression network figures were drawn using R package igraph. Only the top 20 genes with the highest correlations were shown. Red circle: input gene, orange circle: cell metabolism gene, sky circle: other gene |
: Open all plots for all cancer types
| Top |
: Open all interacting genes' information including KEGG pathway for all interacting genes from DAVID
| Top |
| Pharmacological Information for OXCT1 |
| DB Category | DB Name | DB's ID and Url link |
| * Gene Centered Interaction Network. |
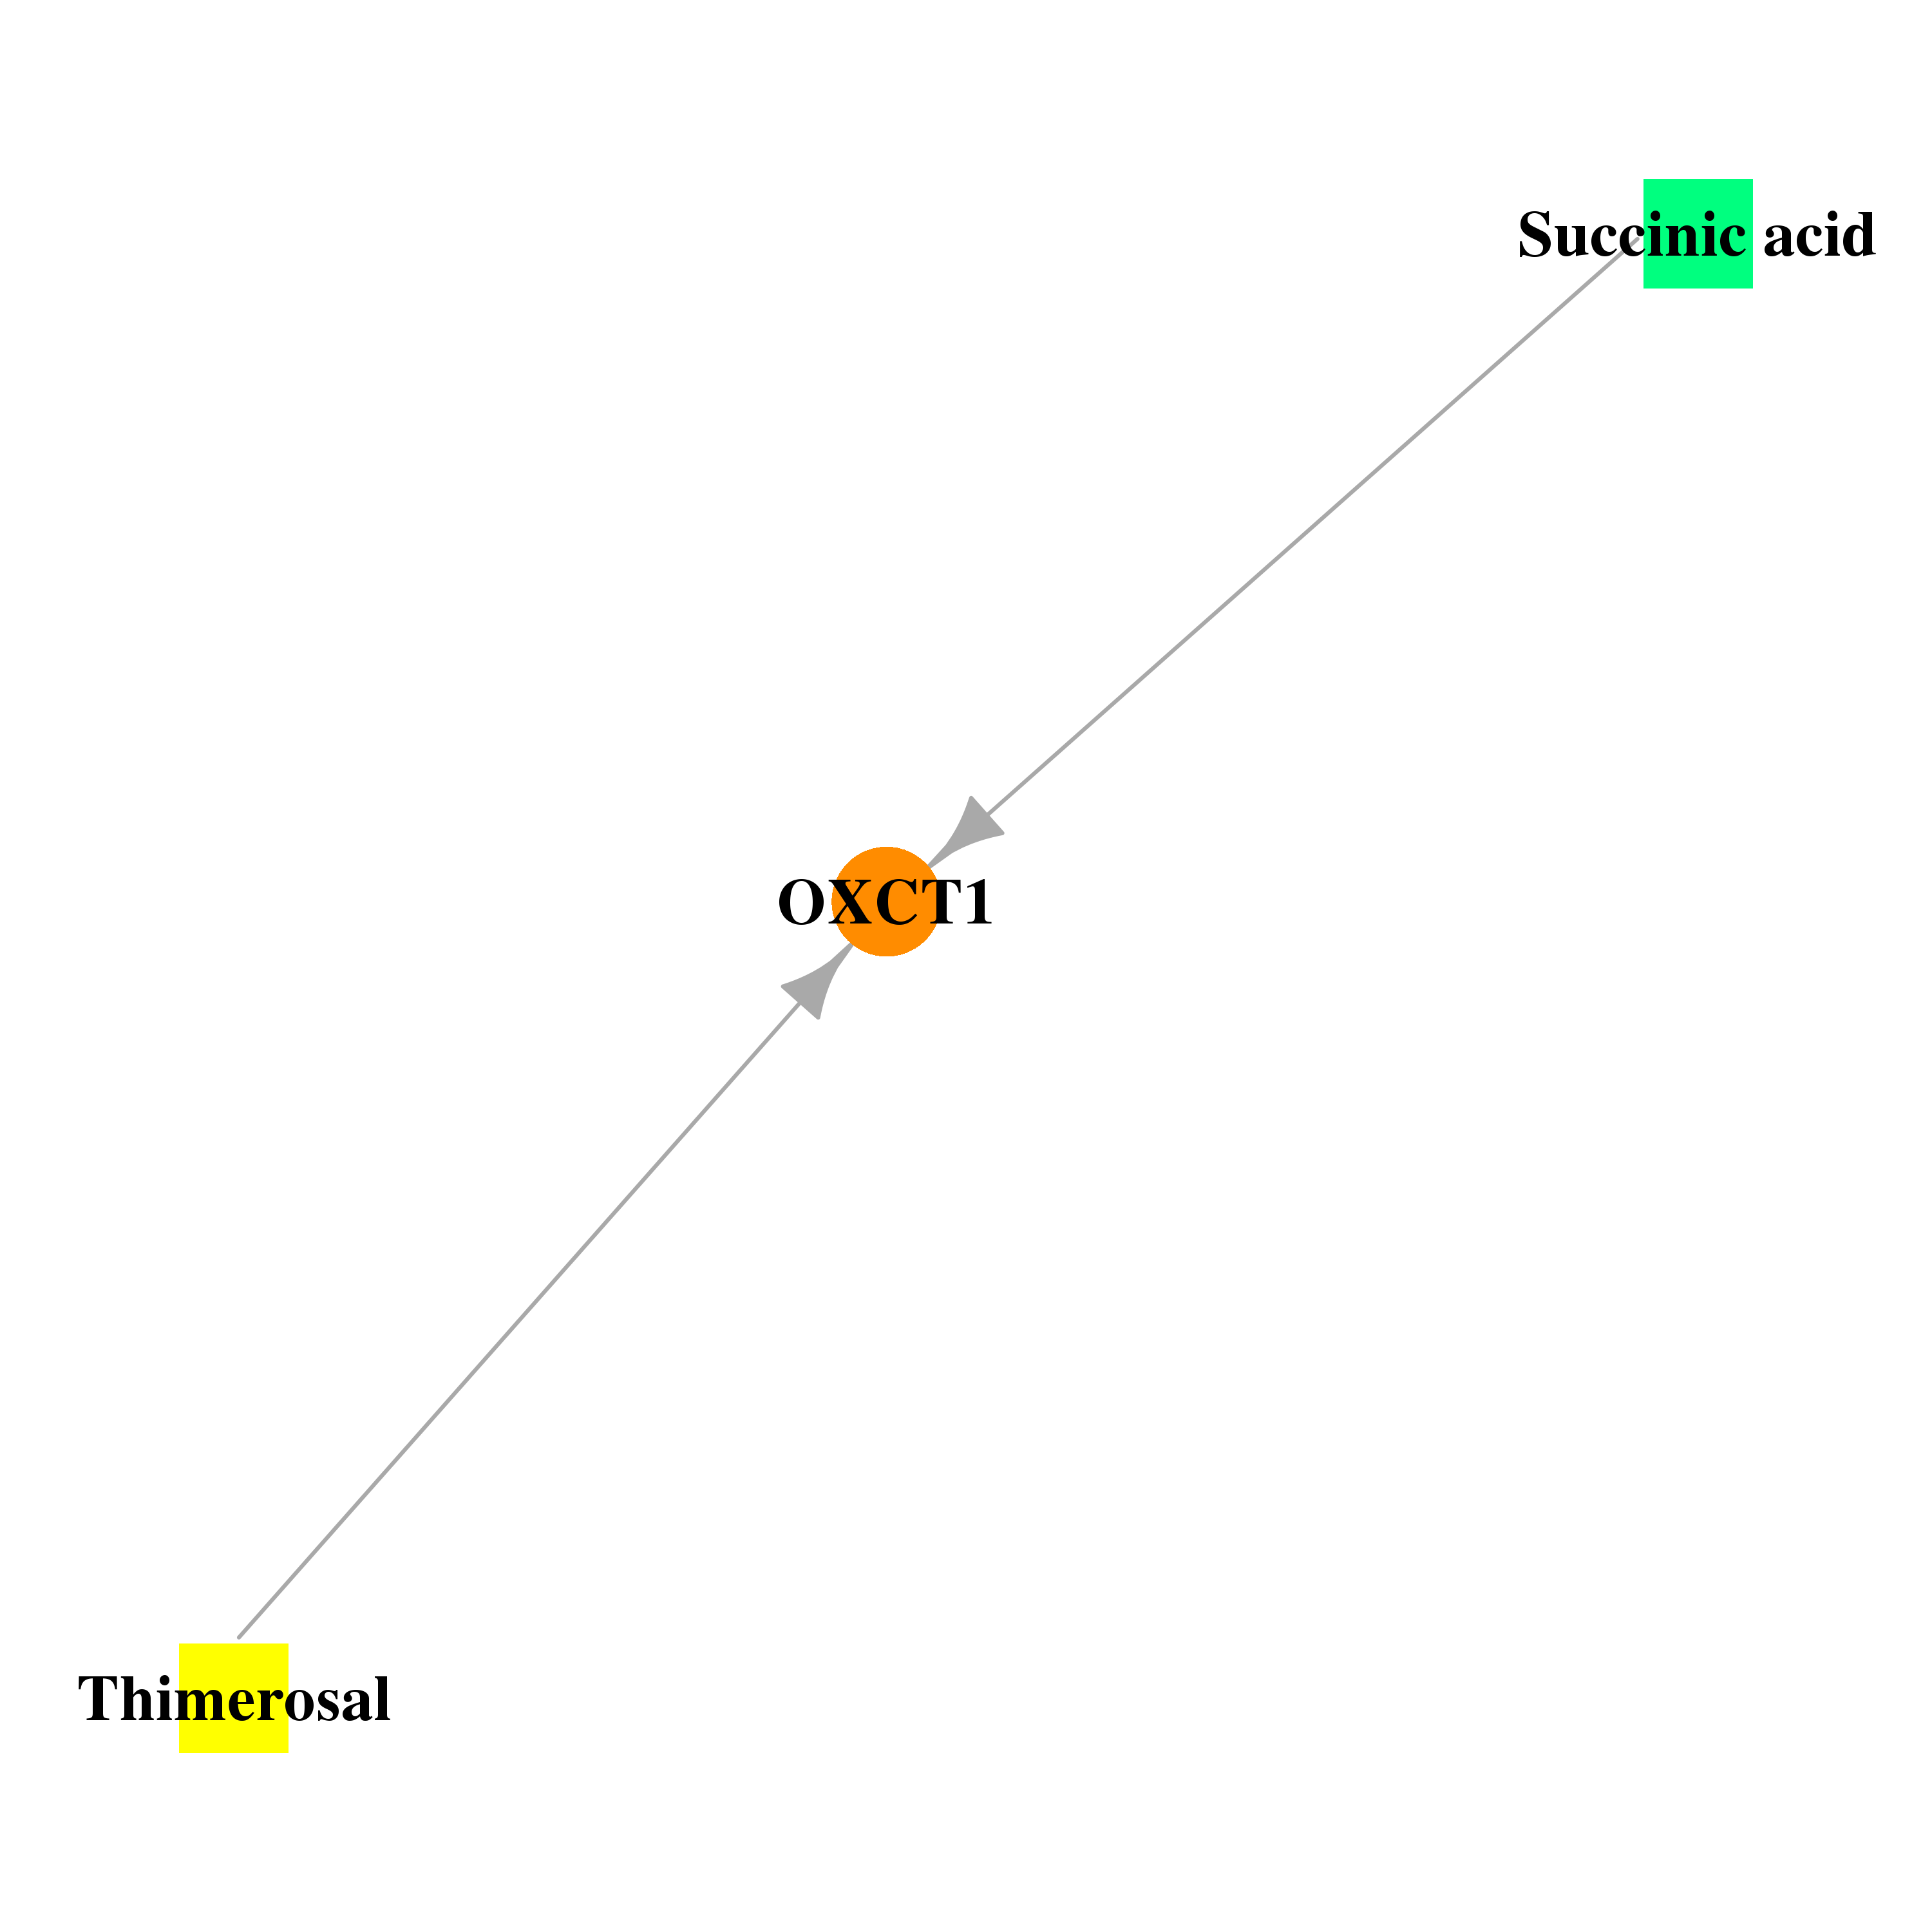 |
| * Drug Centered Interaction Network. |
| DrugBank ID | Target Name | Drug Groups | Generic Name | Drug Centered Network | Drug Structure |
| DB00139 | 3-oxoacid CoA transferase 1 | approved; nutraceutical | Succinic acid | 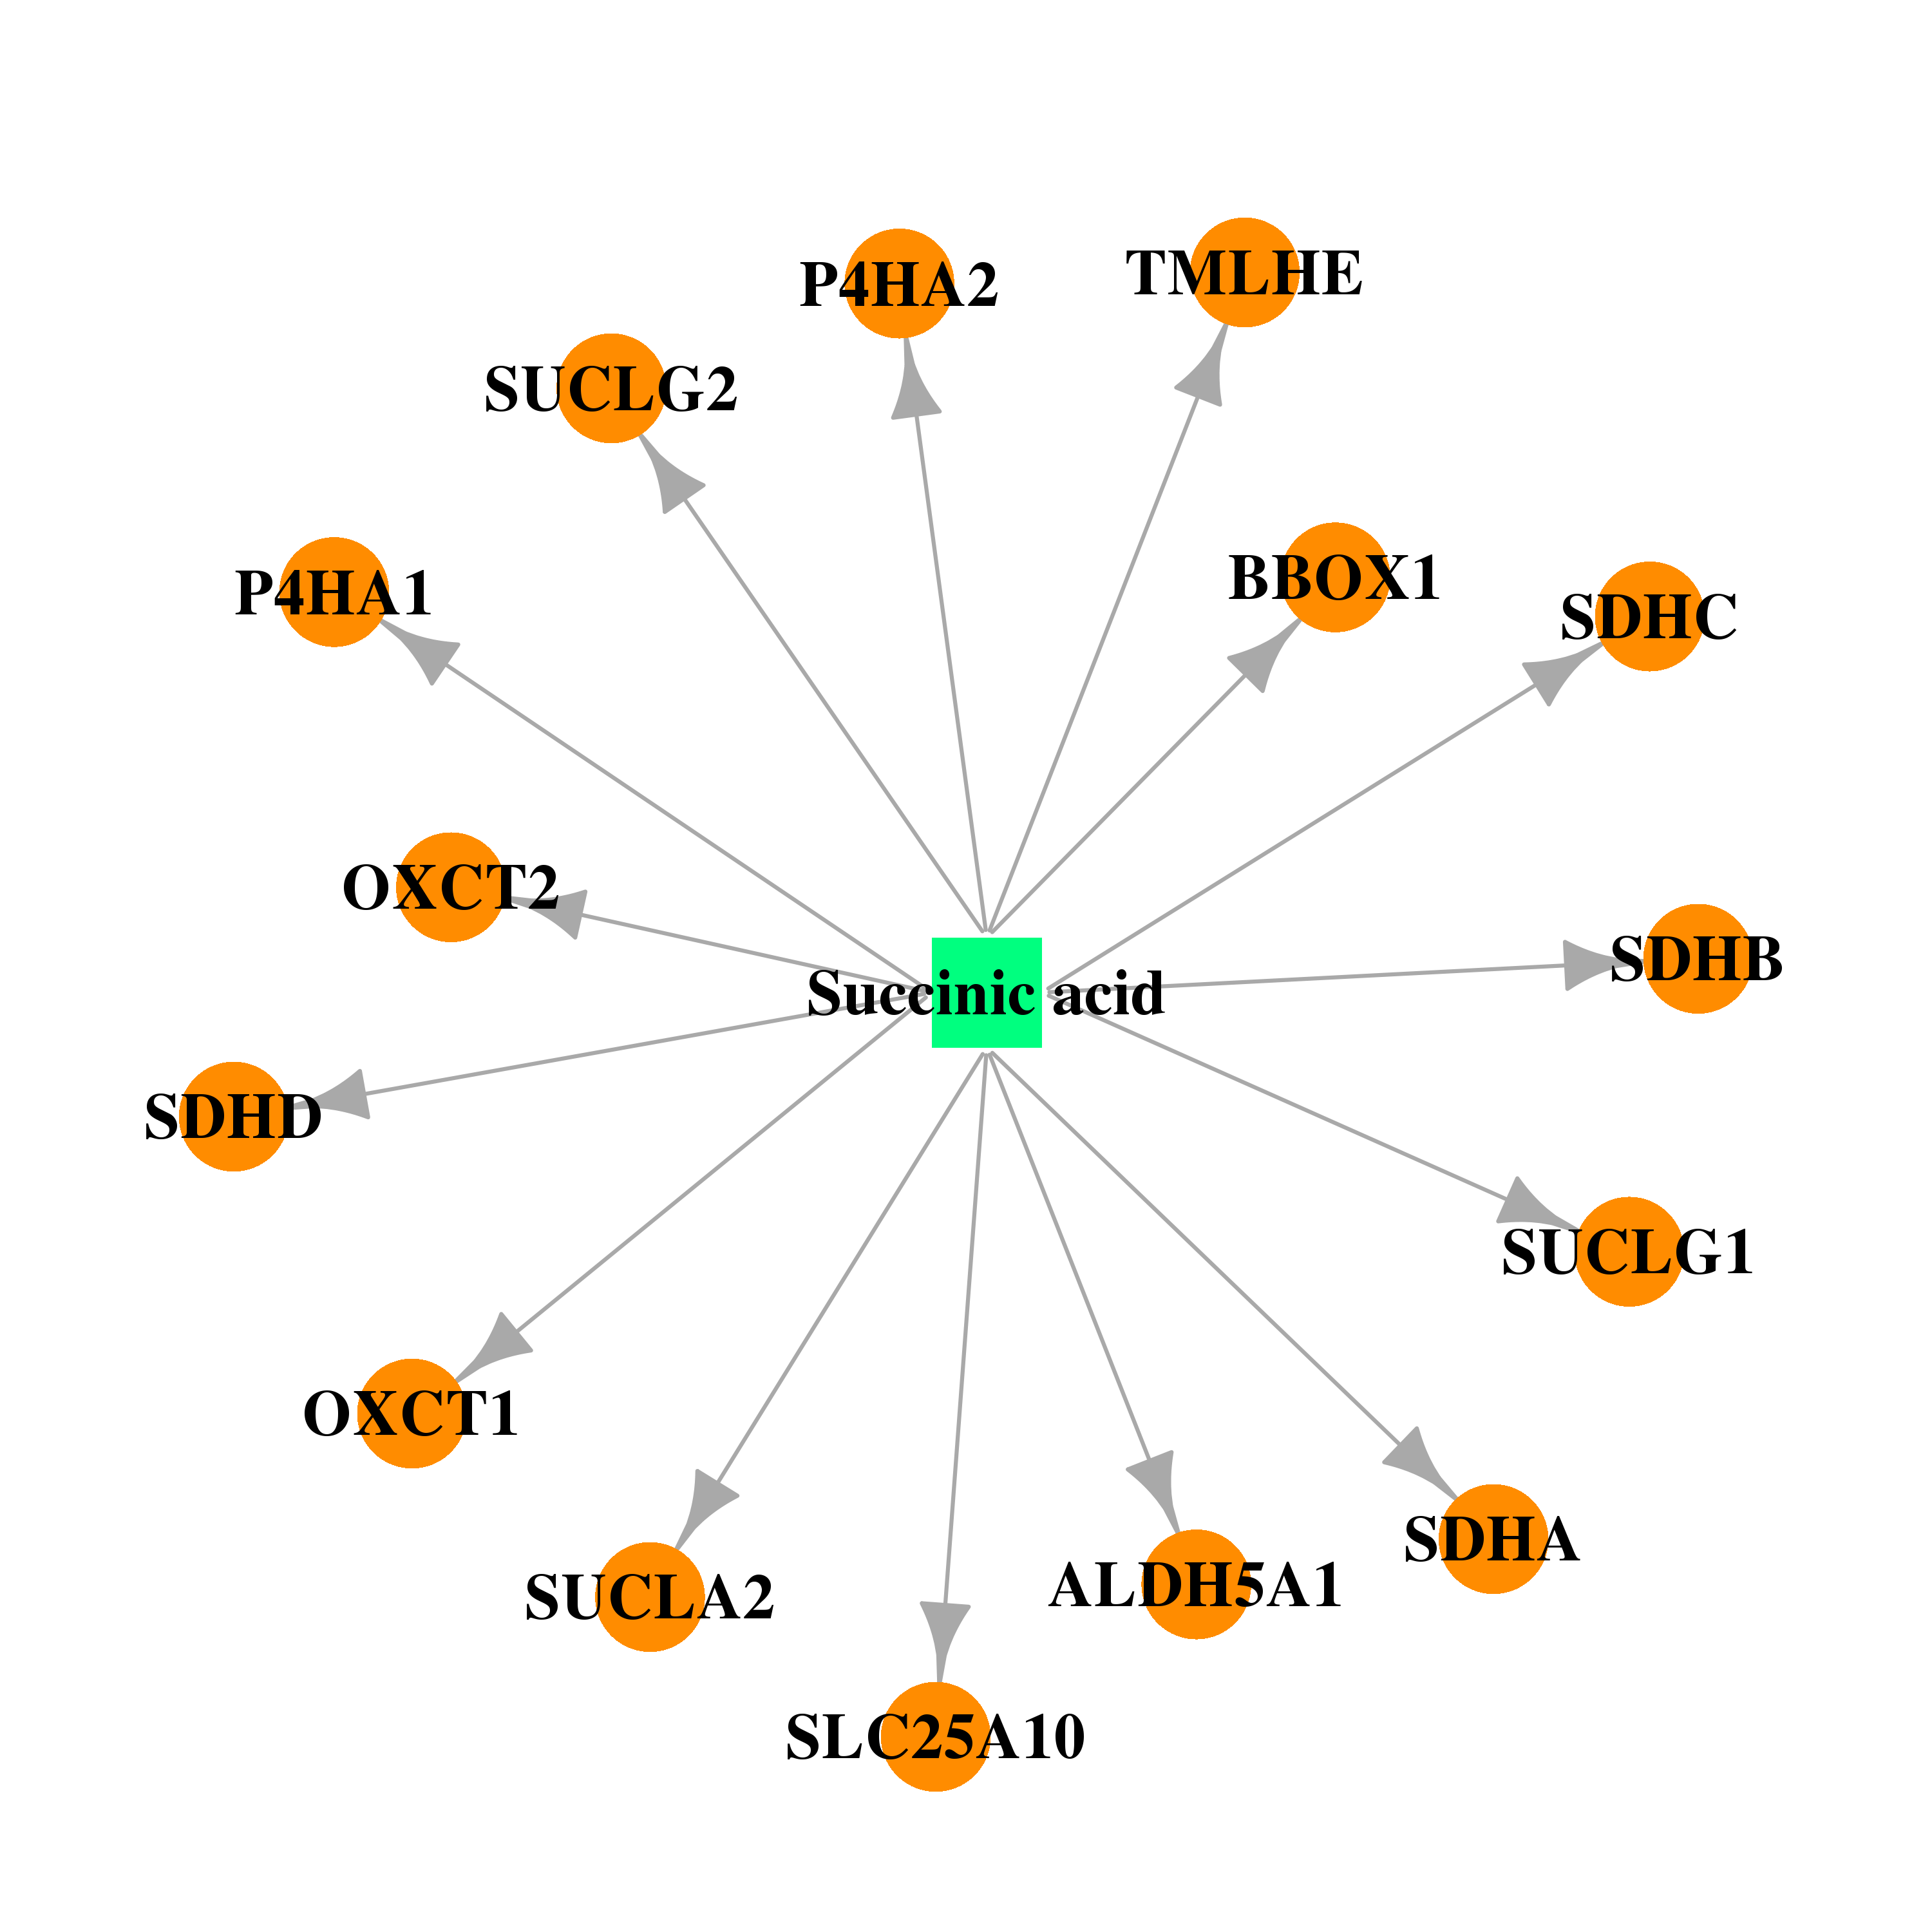 |  |
| DB02731 | 3-oxoacid CoA transferase 1 | experimental | Thimerosal |  |  |
| Top |
| Cross referenced IDs for OXCT1 |
| * We obtained these cross-references from Uniprot database. It covers 150 different DBs, 18 categories. http://www.uniprot.org/help/cross_references_section |
: Open all cross reference information
|
Copyright © 2016-Present - The Univsersity of Texas Health Science Center at Houston @ |