|
|||||||||||||||||||||||||||||||||||||||||||||||||||||||||||||||||||||||||||||||||||||||||||||||||||||||||||||||||||||||||||||||||||||||||||||||||||||||||||||||||||||||||||||||||||||||||||||||||||||||||||||||||||||||||||||||||||||||||||||||||||||||||||||||||||||||||||||||||||||||||||||||||||||||||||||||||||||||||||||||||||||||||||||||||||||||||||||||
| |
| Phenotypic Information (metabolism pathway, cancer, disease, phenome) |
| |
| |
| Gene-Gene Network Information: Co-Expression Network, Interacting Genes & KEGG |
| |
|


| Gene Summary for P4HA1 |
| Basic gene info. | Gene symbol | P4HA1 |
| Gene name | prolyl 4-hydroxylase, alpha polypeptide I | |
| Synonyms | P4HA | |
| Cytomap | UCSC genome browser: 10q21.3-q23.1 | |
| Genomic location | chr10 :74766979-74856732 | |
| Type of gene | protein-coding | |
| RefGenes | NM_000917.3, NM_001017962.2,NM_001142595.1,NM_001142596.1, | |
| Ensembl id | ENSG00000122884 | |
| Description | C-P4Halpha(I)collagen prolyl 4-hydroxylase alpha(I)procollagen-proline, 2-oxoglutarate 4-dioxygenase (proline 4-hydroxylase), alpha polypeptide Iprocollagen-proline,2-oxoglutarate-4-dioxygenase subunit alpha-1prolyl 4-hydroxylase subunit alpha-1 | |
| Modification date | 20141207 | |
| dbXrefs | MIM : 176710 | |
| HGNC : HGNC | ||
| Ensembl : ENSG00000122884 | ||
| HPRD : 08901 | ||
| Vega : OTTHUMG00000018449 | ||
| Protein | UniProt: go to UniProt's Cross Reference DB Table | |
| Expression | CleanEX: HS_P4HA1 | |
| BioGPS: 5033 | ||
| Gene Expression Atlas: ENSG00000122884 | ||
| The Human Protein Atlas: ENSG00000122884 | ||
| Pathway | NCI Pathway Interaction Database: P4HA1 | |
| KEGG: P4HA1 | ||
| REACTOME: P4HA1 | ||
| ConsensusPathDB | ||
| Pathway Commons: P4HA1 | ||
| Metabolism | MetaCyc: P4HA1 | |
| HUMANCyc: P4HA1 | ||
| Regulation | Ensembl's Regulation: ENSG00000122884 | |
| miRBase: chr10 :74,766,979-74,856,732 | ||
| TargetScan: NM_000917 | ||
| cisRED: ENSG00000122884 | ||
| Context | iHOP: P4HA1 | |
| cancer metabolism search in PubMed: P4HA1 | ||
| UCL Cancer Institute: P4HA1 | ||
| Assigned class in ccmGDB | C | |
| Top |
| Phenotypic Information for P4HA1(metabolism pathway, cancer, disease, phenome) |
| Cancer | CGAP: P4HA1 |
| Familial Cancer Database: P4HA1 | |
| * This gene is included in those cancer gene databases. |
|
|
|
|
|
|
| |||||||||||||||||||||||||||||||||||||||||||||||||||||||||||||||||||||||||||||||||||||||||||||||||||||||||||||||||||||||||||||||||||||||||||||||||||||||||||||||||||||||||||||||||||||||||||||||||||||||||||||||||||||||||||||||||||||||||||||||||||||||||||||||||||||||||||||||||||||||||||||||||||||||||||||||||||||||||||||||||||||||||||||||||||||||||
Oncogene 1 | Significant driver gene in | ||||||||||||||||||||||||||||||||||||||||||||||||||||||||||||||||||||||||||||||||||||||||||||||||||||||||||||||||||||||||||||||||||||||||||||||||||||||||||||||||||||||||||||||||||||||||||||||||||||||||||||||||||||||||||||||||||||||||||||||||||||||||||||||||||||||||||||||||||||||||||||||||||||||||||||||||||||||||||||||||||||||||||||||||||||||||||||||
| cf) number; DB name 1 Oncogene; http://nar.oxfordjournals.org/content/35/suppl_1/D721.long, 2 Tumor Suppressor gene; https://bioinfo.uth.edu/TSGene/, 3 Cancer Gene Census; http://www.nature.com/nrc/journal/v4/n3/abs/nrc1299.html, 4 CancerGenes; http://nar.oxfordjournals.org/content/35/suppl_1/D721.long, 5 Network of Cancer Gene; http://ncg.kcl.ac.uk/index.php, 1Therapeutic Vulnerabilities in Cancer; http://cbio.mskcc.org/cancergenomics/statius/ |
| KEGG_ARGININE_AND_PROLINE_METABOLISM | |
| OMIM | |
| Orphanet | |
| Disease | KEGG Disease: P4HA1 |
| MedGen: P4HA1 (Human Medical Genetics with Condition) | |
| ClinVar: P4HA1 | |
| Phenotype | MGI: P4HA1 (International Mouse Phenotyping Consortium) |
| PhenomicDB: P4HA1 | |
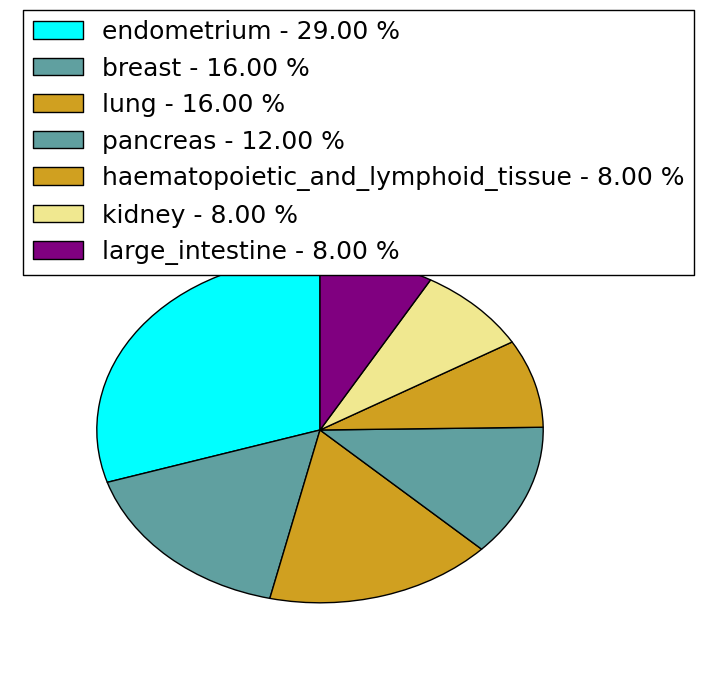
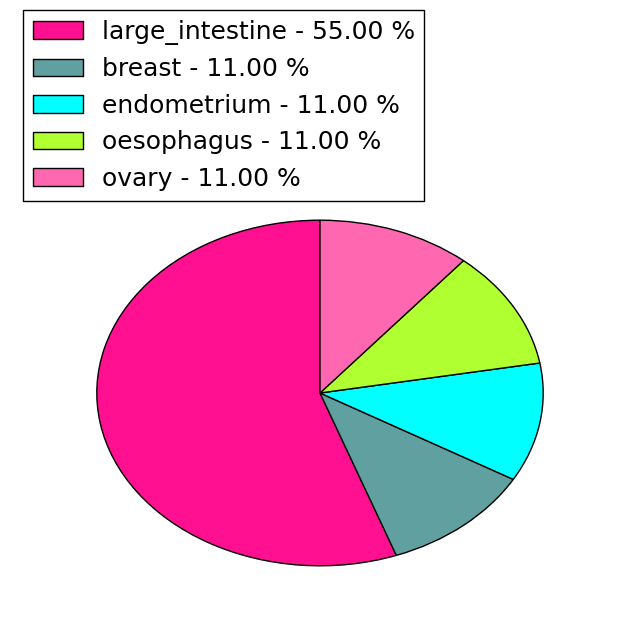
| Mutations for P4HA1 |
| * Under tables are showing count per each tissue to give us broad intuition about tissue specific mutation patterns.You can go to the detailed page for each mutation database's web site. |
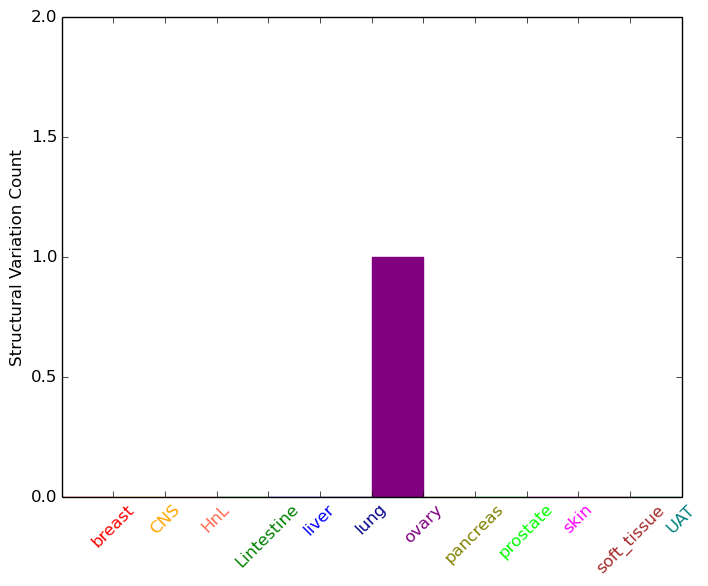
| - Statistics for Tissue and Mutation type | Top |
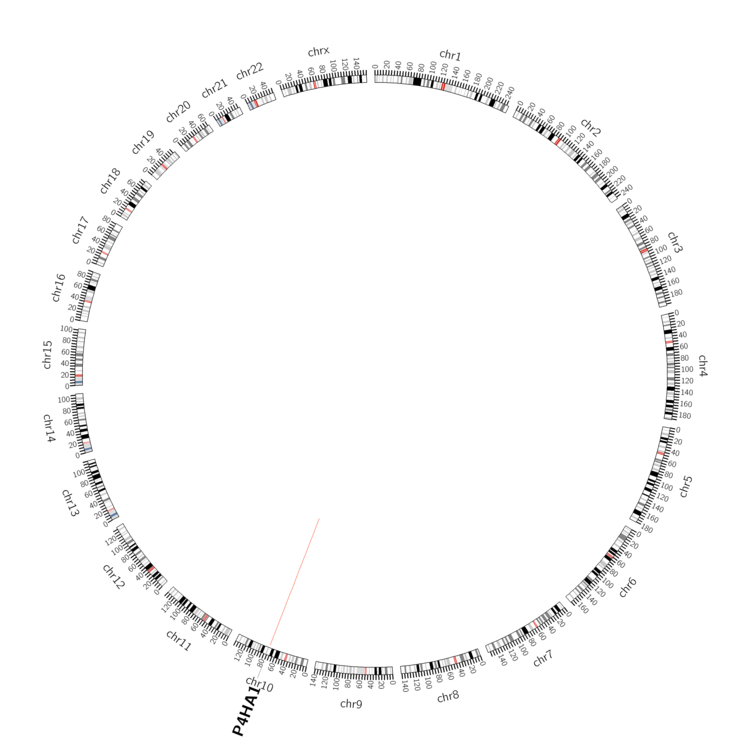 |
| - For Inter-chromosomal Variations |
| There's no inter-chromosomal structural variation. |
| - For Intra-chromosomal Variations |
| * Intra-chromosomal variantions includes 'intrachromosomal amplicon to amplicon', 'intrachromosomal amplicon to non-amplified dna', 'intrachromosomal deletion', 'intrachromosomal fold-back inversion', 'intrachromosomal inversion', 'intrachromosomal tandem duplication', 'Intrachromosomal unknown type', 'intrachromosomal with inverted orientation', 'intrachromosomal with non-inverted orientation'. |
 |
| Sample | Symbol_a | Chr_a | Start_a | End_a | Symbol_b | Chr_b | Start_b | End_b |
| ovary | P4HA1 | chr10 | 74818454 | 74818474 | P4HA1 | chr10 | 74818556 | 74818576 |
| cf) Tissue number; Tissue name (1;Breast, 2;Central_nervous_system, 3;Haematopoietic_and_lymphoid_tissue, 4;Large_intestine, 5;Liver, 6;Lung, 7;Ovary, 8;Pancreas, 9;Prostate, 10;Skin, 11;Soft_tissue, 12;Upper_aerodigestive_tract) |
| * From mRNA Sanger sequences, Chitars2.0 arranged chimeric transcripts. This table shows P4HA1 related fusion information. |
| ID | Head Gene | Tail Gene | Accession | Gene_a | qStart_a | qEnd_a | Chromosome_a | tStart_a | tEnd_a | Gene_a | qStart_a | qEnd_a | Chromosome_a | tStart_a | tEnd_a |
| Top |
| Mutation type/ Tissue ID | brca | cns | cerv | endome | haematopo | kidn | Lintest | liver | lung | ns | ovary | pancre | prost | skin | stoma | thyro | urina | |||
| Total # sample | 2 | 2 | ||||||||||||||||||
| GAIN (# sample) | 2 | 2 | ||||||||||||||||||
| LOSS (# sample) |
| cf) Tissue ID; Tissue type (1; Breast, 2; Central_nervous_system, 3; Cervix, 4; Endometrium, 5; Haematopoietic_and_lymphoid_tissue, 6; Kidney, 7; Large_intestine, 8; Liver, 9; Lung, 10; NS, 11; Ovary, 12; Pancreas, 13; Prostate, 14; Skin, 15; Stomach, 16; Thyroid, 17; Urinary_tract) |
| Top |
|
 |
| Top |
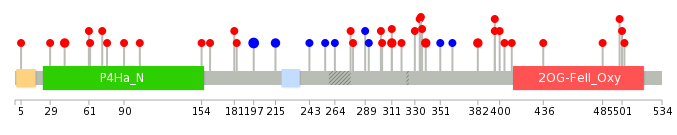
| Stat. for Non-Synonymous SNVs (# total SNVs=24) | (# total SNVs=9) |
 |  |
(# total SNVs=1) | (# total SNVs=1) |
 |  |
| Top |
| * When you move the cursor on each content, you can see more deailed mutation information on the Tooltip. Those are primary_site,primary_histology,mutation(aa),pubmedID. |
| GRCh37 position | Mutation(aa) | Unique sampleID count |
| chr10:74813221-74813221 | p.G197G | 4 |
| chr10:74806829-74806829 | p.R311C | 2 |
| chr10:74813167-74813167 | p.V215V | 2 |
| chr10:74833540-74833540 | p.S41F | 2 |
| chr10:74806745-74806745 | p.R339C | 2 |
| chr10:74828715-74828715 | p.R118* | 2 |
| chr10:74790090-74790090 | p.R396Q | 2 |
| chr10:74768012-74768012 | p.R525* | 2 |
| chr10:74803649-74803649 | p.K382E | 2 |
| chr10:74831885-74831885 | p.G76E | 1 |
| Top |
|
 |
| Point Mutation/ Tissue ID | 1 | 2 | 3 | 4 | 5 | 6 | 7 | 8 | 9 | 10 | 11 | 12 | 13 | 14 | 15 | 16 | 17 | 18 | 19 | 20 |
| # sample | 1 | 7 | 1 | 5 | 3 | 1 | 1 | 1 | 10 | 4 | 6 | |||||||||
| # mutation | 1 | 7 | 1 | 5 | 3 | 1 | 1 | 1 | 9 | 4 | 7 | |||||||||
| nonsynonymous SNV | 1 | 2 | 1 | 3 | 3 | 1 | 1 | 8 | 3 | 6 | ||||||||||
| synonymous SNV | 5 | 2 | 1 | 1 | 1 | 1 |
| cf) Tissue ID; Tissue type (1; BLCA[Bladder Urothelial Carcinoma], 2; BRCA[Breast invasive carcinoma], 3; CESC[Cervical squamous cell carcinoma and endocervical adenocarcinoma], 4; COAD[Colon adenocarcinoma], 5; GBM[Glioblastoma multiforme], 6; Glioma Low Grade, 7; HNSC[Head and Neck squamous cell carcinoma], 8; KICH[Kidney Chromophobe], 9; KIRC[Kidney renal clear cell carcinoma], 10; KIRP[Kidney renal papillary cell carcinoma], 11; LAML[Acute Myeloid Leukemia], 12; LUAD[Lung adenocarcinoma], 13; LUSC[Lung squamous cell carcinoma], 14; OV[Ovarian serous cystadenocarcinoma ], 15; PAAD[Pancreatic adenocarcinoma], 16; PRAD[Prostate adenocarcinoma], 17; SKCM[Skin Cutaneous Melanoma], 18:STAD[Stomach adenocarcinoma], 19:THCA[Thyroid carcinoma], 20:UCEC[Uterine Corpus Endometrial Carcinoma]) |
| Top |
| * We represented just top 10 SNVs. When you move the cursor on each content, you can see more deailed mutation information on the Tooltip. Those are primary_site, primary_histology, mutation(aa), pubmedID. |
| Genomic Position | Mutation(aa) | Unique sampleID count |
| chr10:74813221 | p.G197G,P4HA1 | 3 |
| chr10:74806745 | p.R396Q,P4HA1 | 2 |
| chr10:74790090 | p.R339C,P4HA1 | 2 |
| chr10:74806707 | p.R90H,P4HA1 | 1 |
| chr10:74810876 | p.A483V,P4HA1 | 1 |
| chr10:74769646 | p.R311H,P4HA1 | 1 |
| chr10:74831898 | p.K72Q,P4HA1 | 1 |
| chr10:74810882 | p.W467R,P4HA1 | 1 |
| chr10:74770789 | p.R311C,P4HA1 | 1 |
| chr10:74833540 | p.S41F,P4HA1 | 1 |
| * Copy number data were extracted from TCGA using R package TCGA-Assembler. The URLs of all public data files on TCGA DCC data server were gathered on Jan-05-2015. Function ProcessCNAData in TCGA-Assembler package was used to obtain gene-level copy number value which is calculated as the average copy number of the genomic region of a gene. |
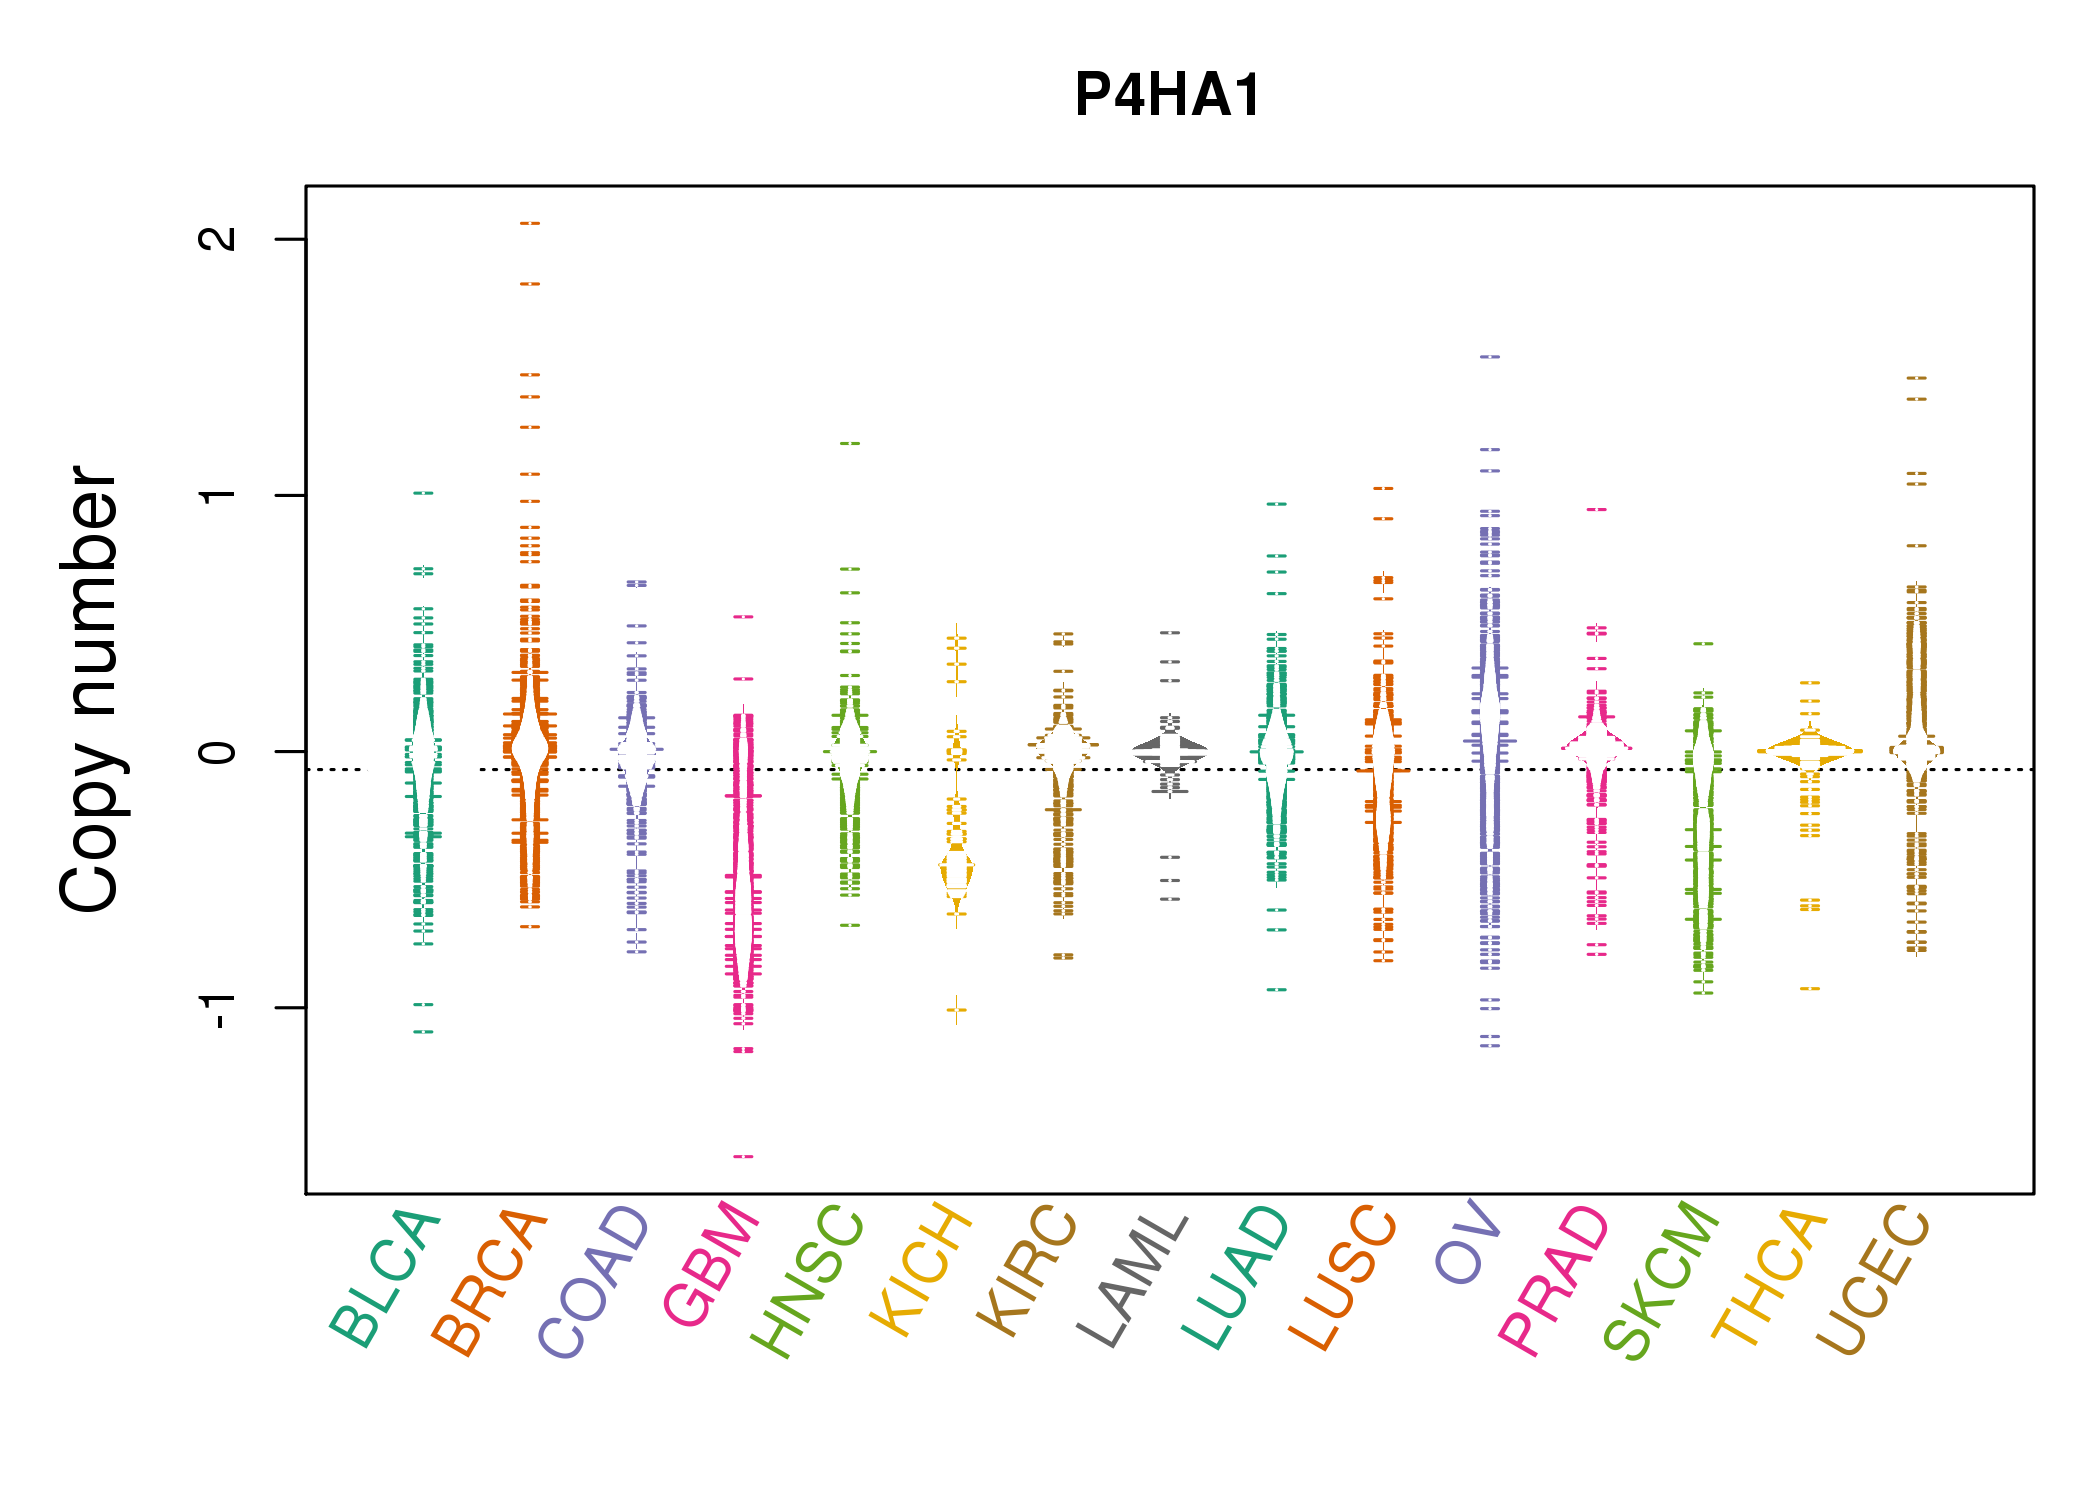 |
| cf) Tissue ID[Tissue type]: BLCA[Bladder Urothelial Carcinoma], BRCA[Breast invasive carcinoma], CESC[Cervical squamous cell carcinoma and endocervical adenocarcinoma], COAD[Colon adenocarcinoma], GBM[Glioblastoma multiforme], Glioma Low Grade, HNSC[Head and Neck squamous cell carcinoma], KICH[Kidney Chromophobe], KIRC[Kidney renal clear cell carcinoma], KIRP[Kidney renal papillary cell carcinoma], LAML[Acute Myeloid Leukemia], LUAD[Lung adenocarcinoma], LUSC[Lung squamous cell carcinoma], OV[Ovarian serous cystadenocarcinoma ], PAAD[Pancreatic adenocarcinoma], PRAD[Prostate adenocarcinoma], SKCM[Skin Cutaneous Melanoma], STAD[Stomach adenocarcinoma], THCA[Thyroid carcinoma], UCEC[Uterine Corpus Endometrial Carcinoma] |
| Top |
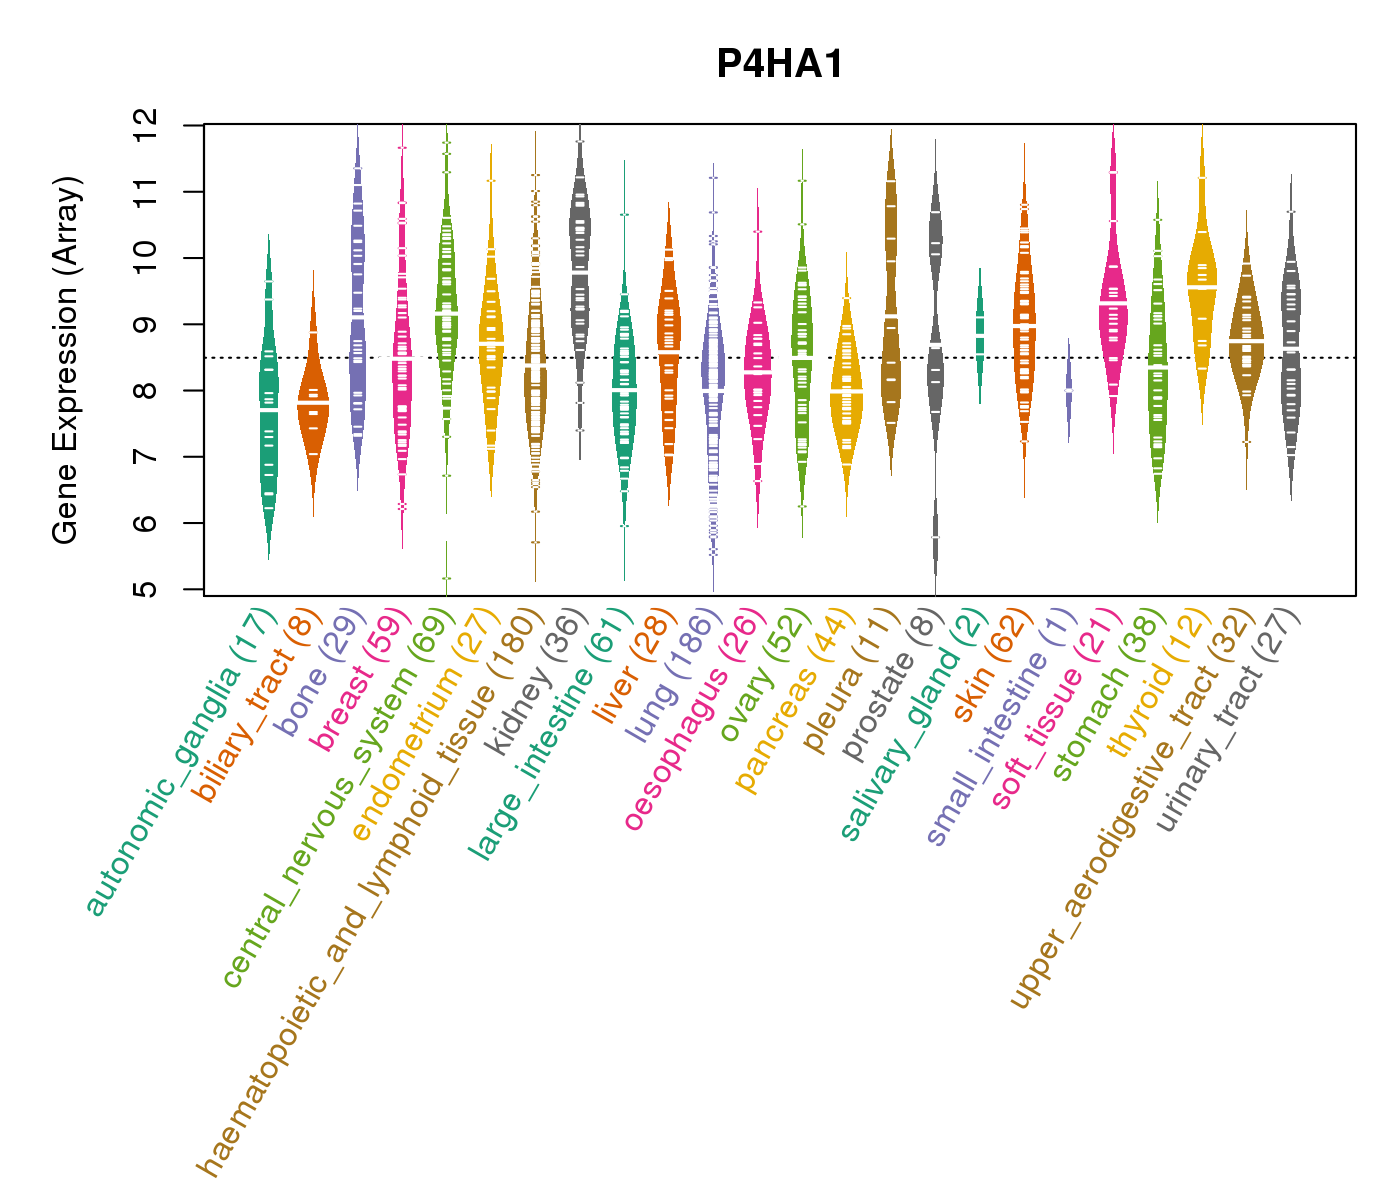
| Gene Expression for P4HA1 |
| * CCLE gene expression data were extracted from CCLE_Expression_Entrez_2012-10-18.res: Gene-centric RMA-normalized mRNA expression data. |
 |
| * Normalized gene expression data of RNASeqV2 was extracted from TCGA using R package TCGA-Assembler. The URLs of all public data files on TCGA DCC data server were gathered at Jan-05-2015. Only eight cancer types have enough normal control samples for differential expression analysis. (t test, adjusted p<0.05 (using Benjamini-Hochberg FDR)) |
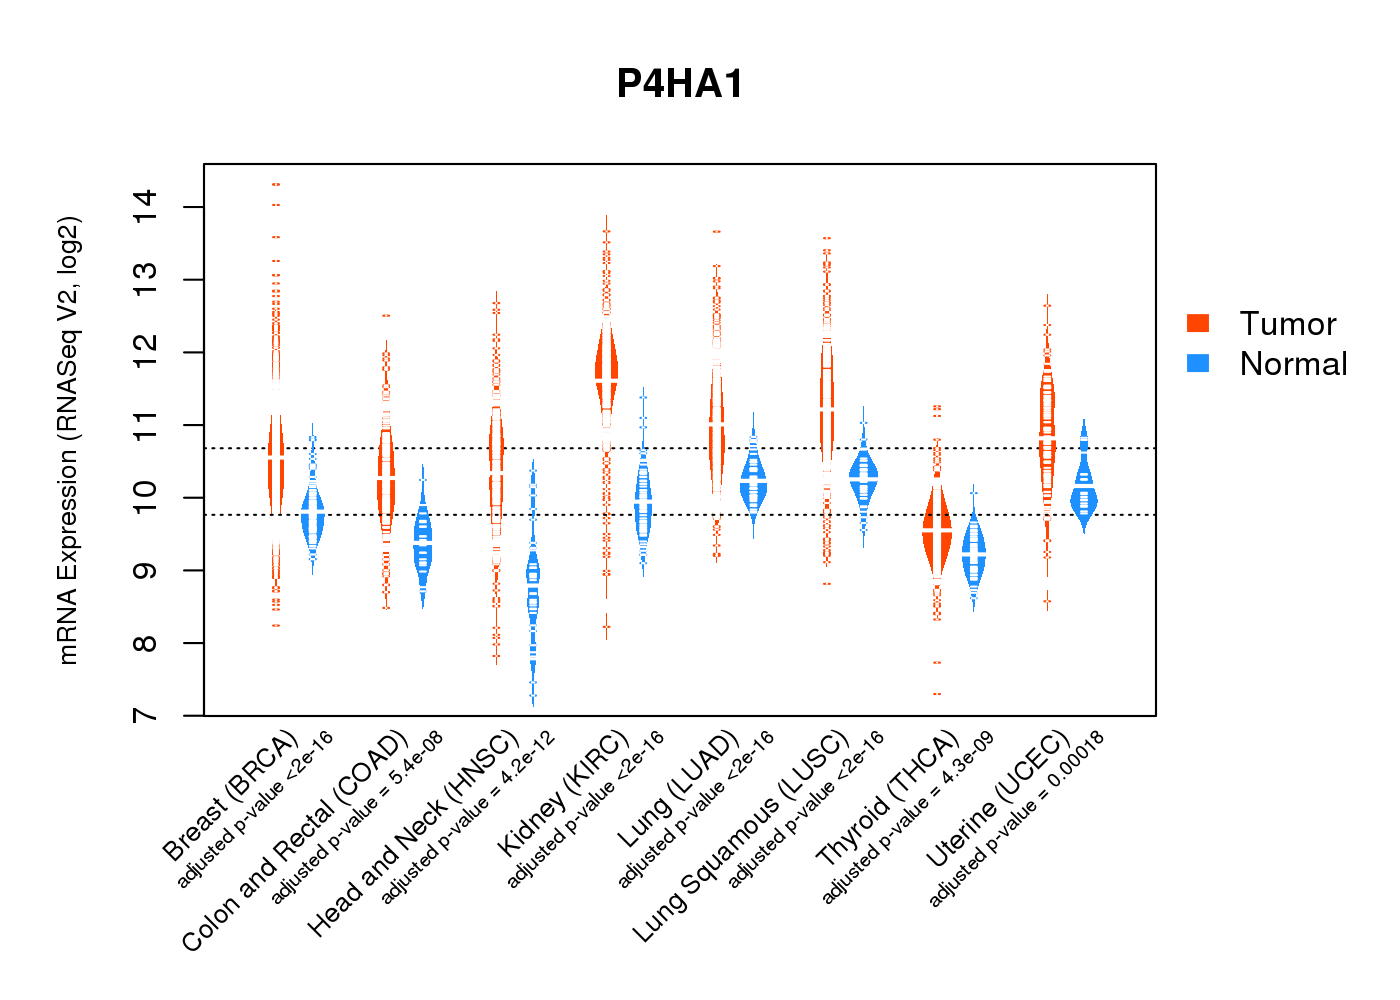 |
| Top |
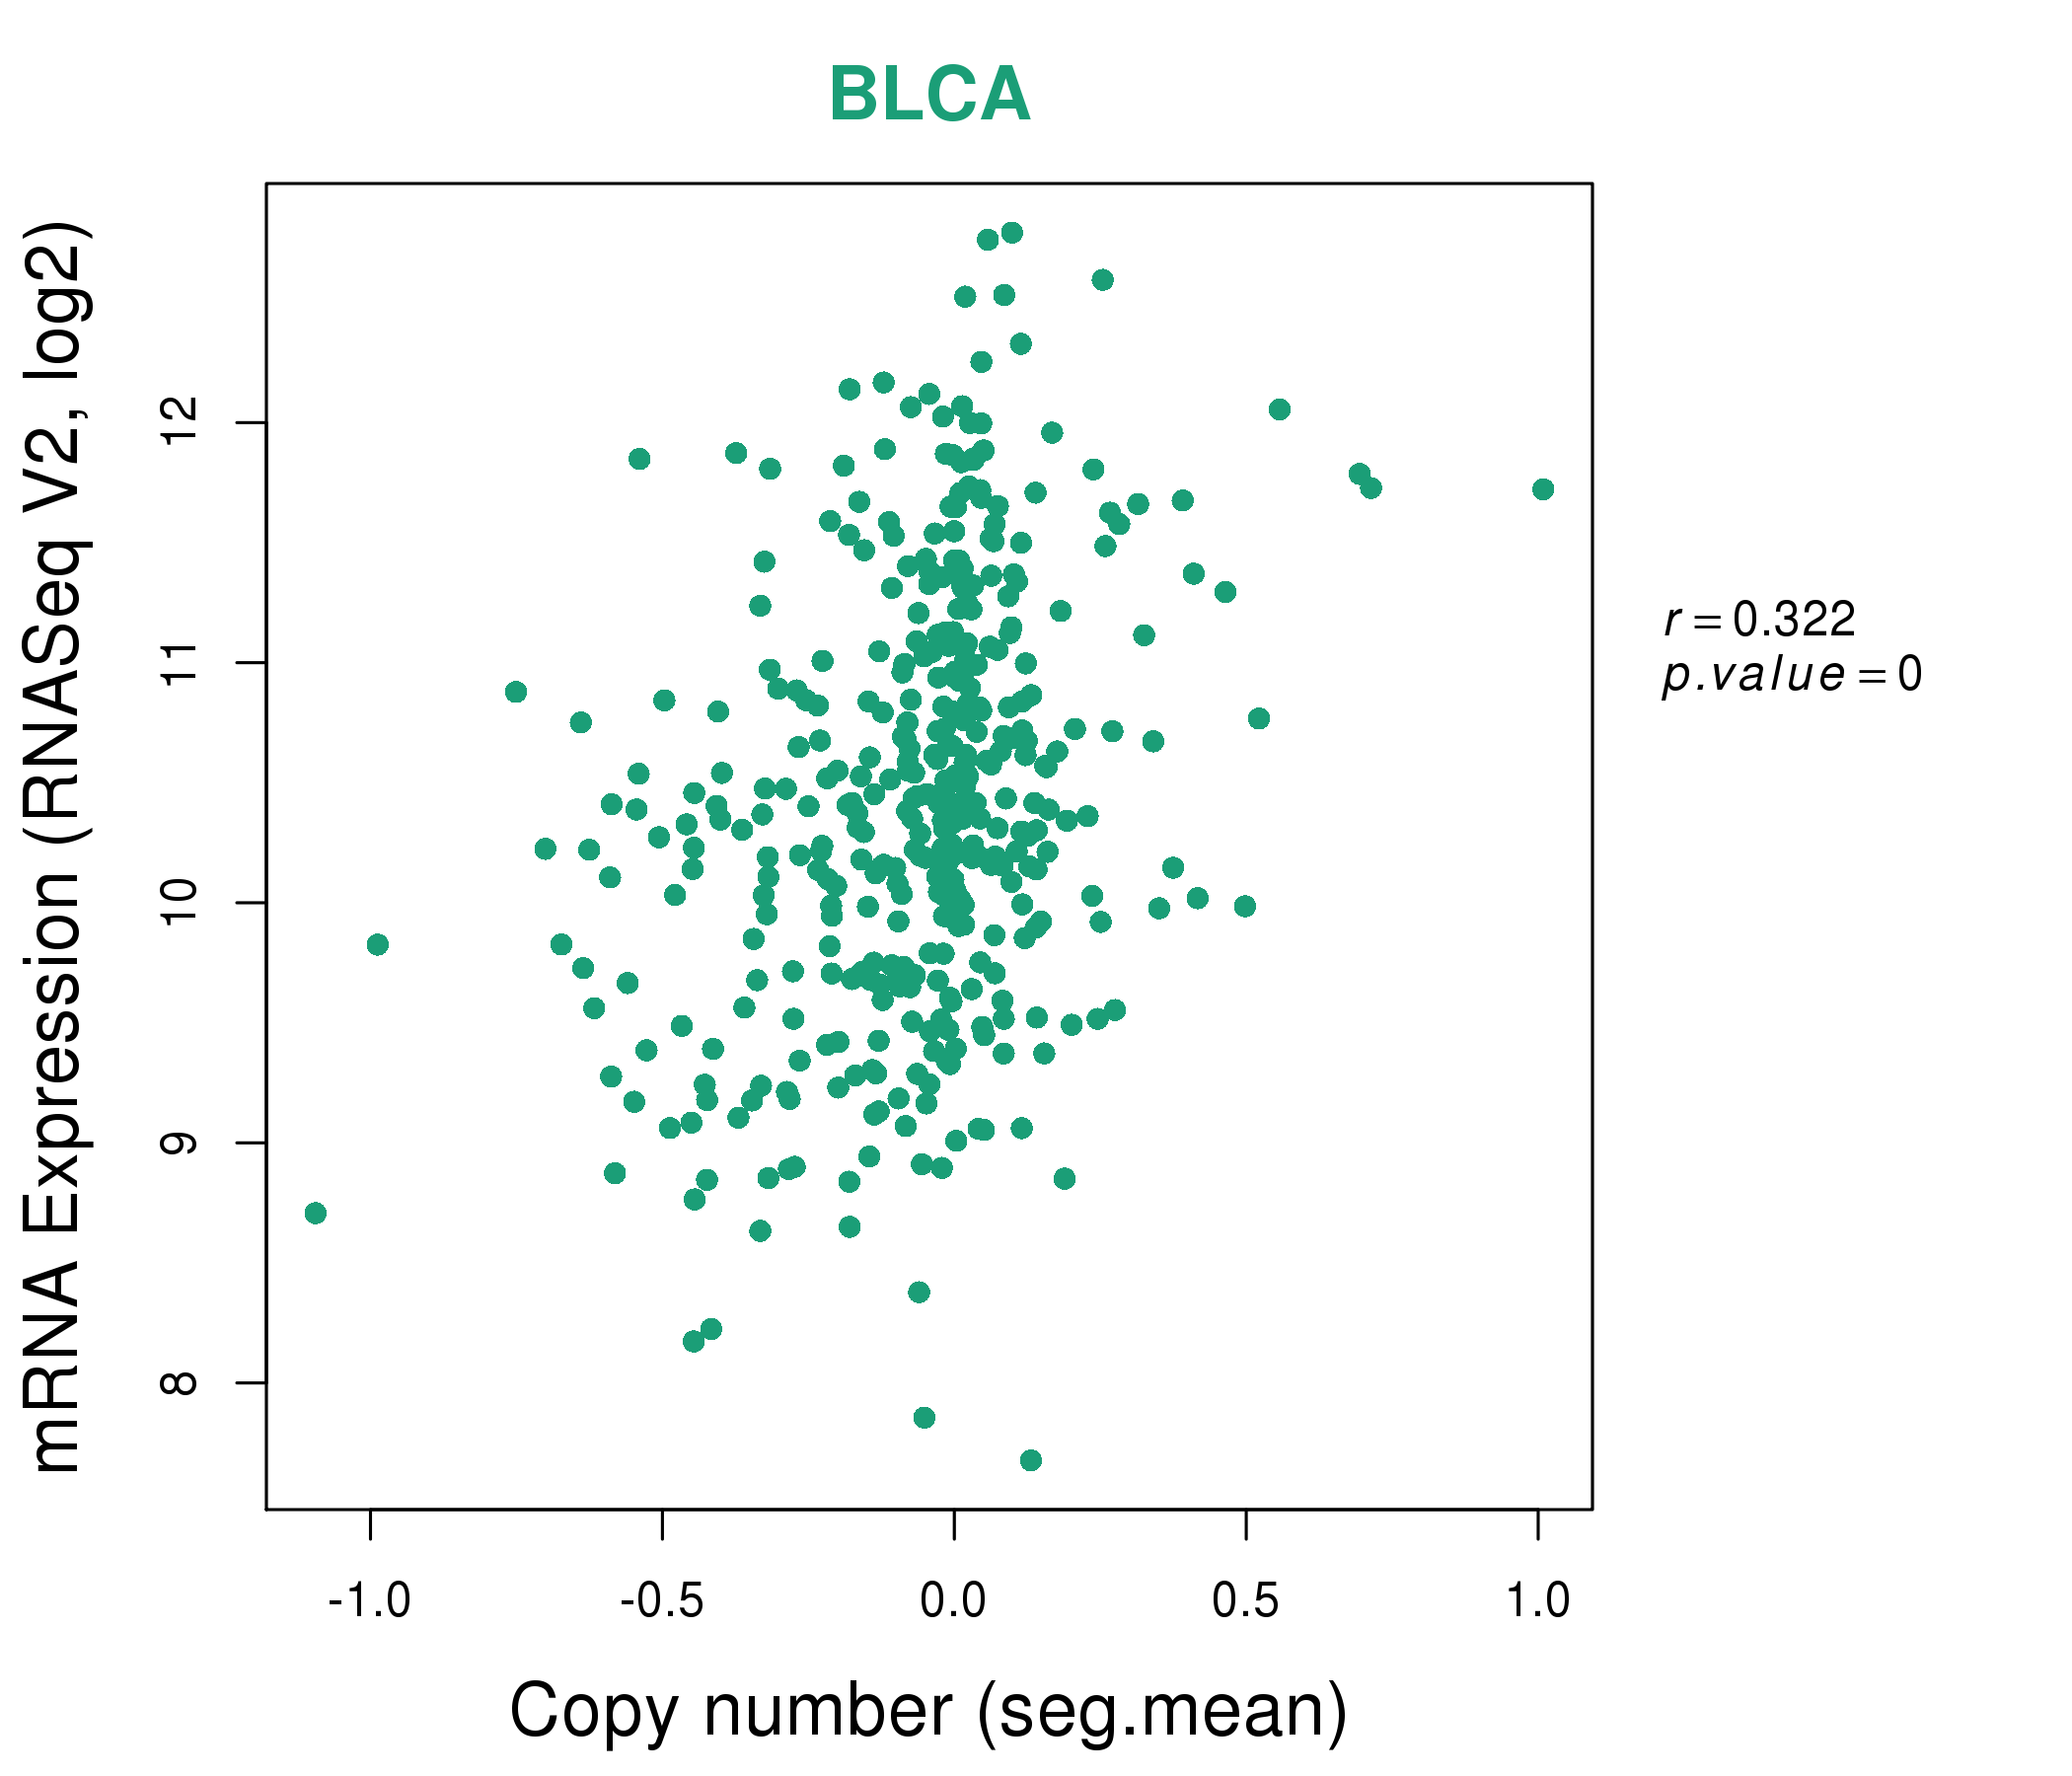
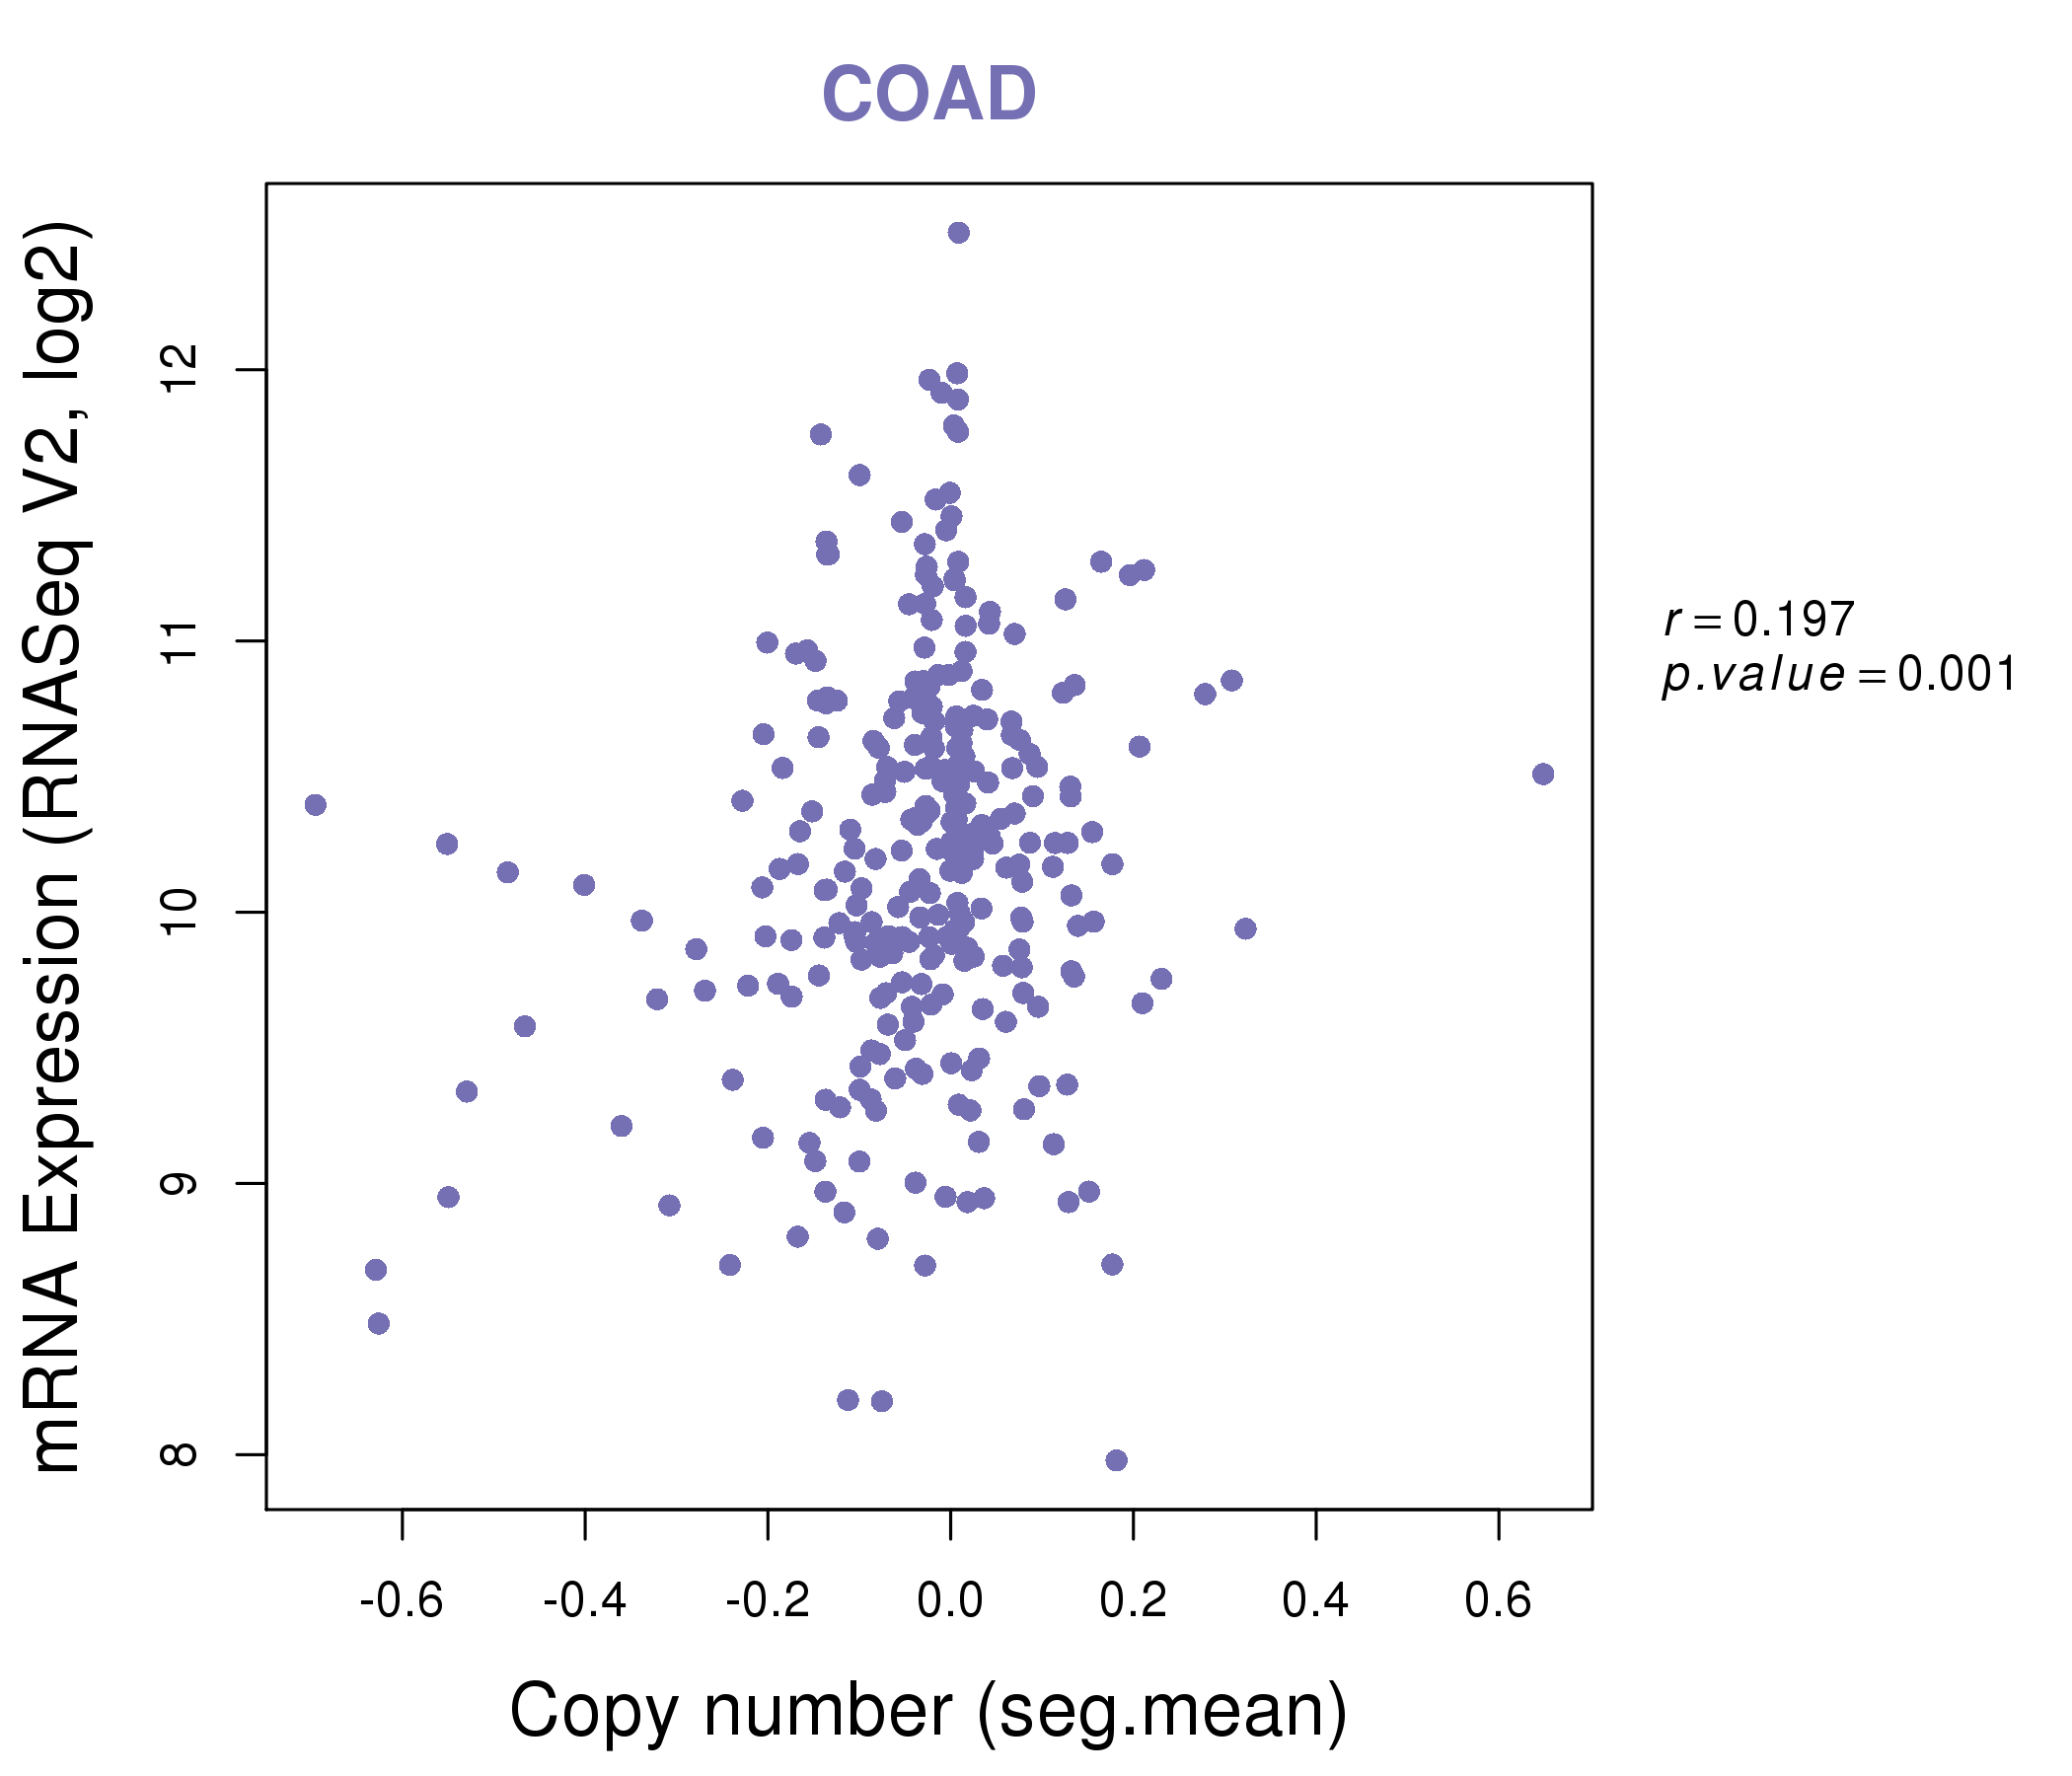
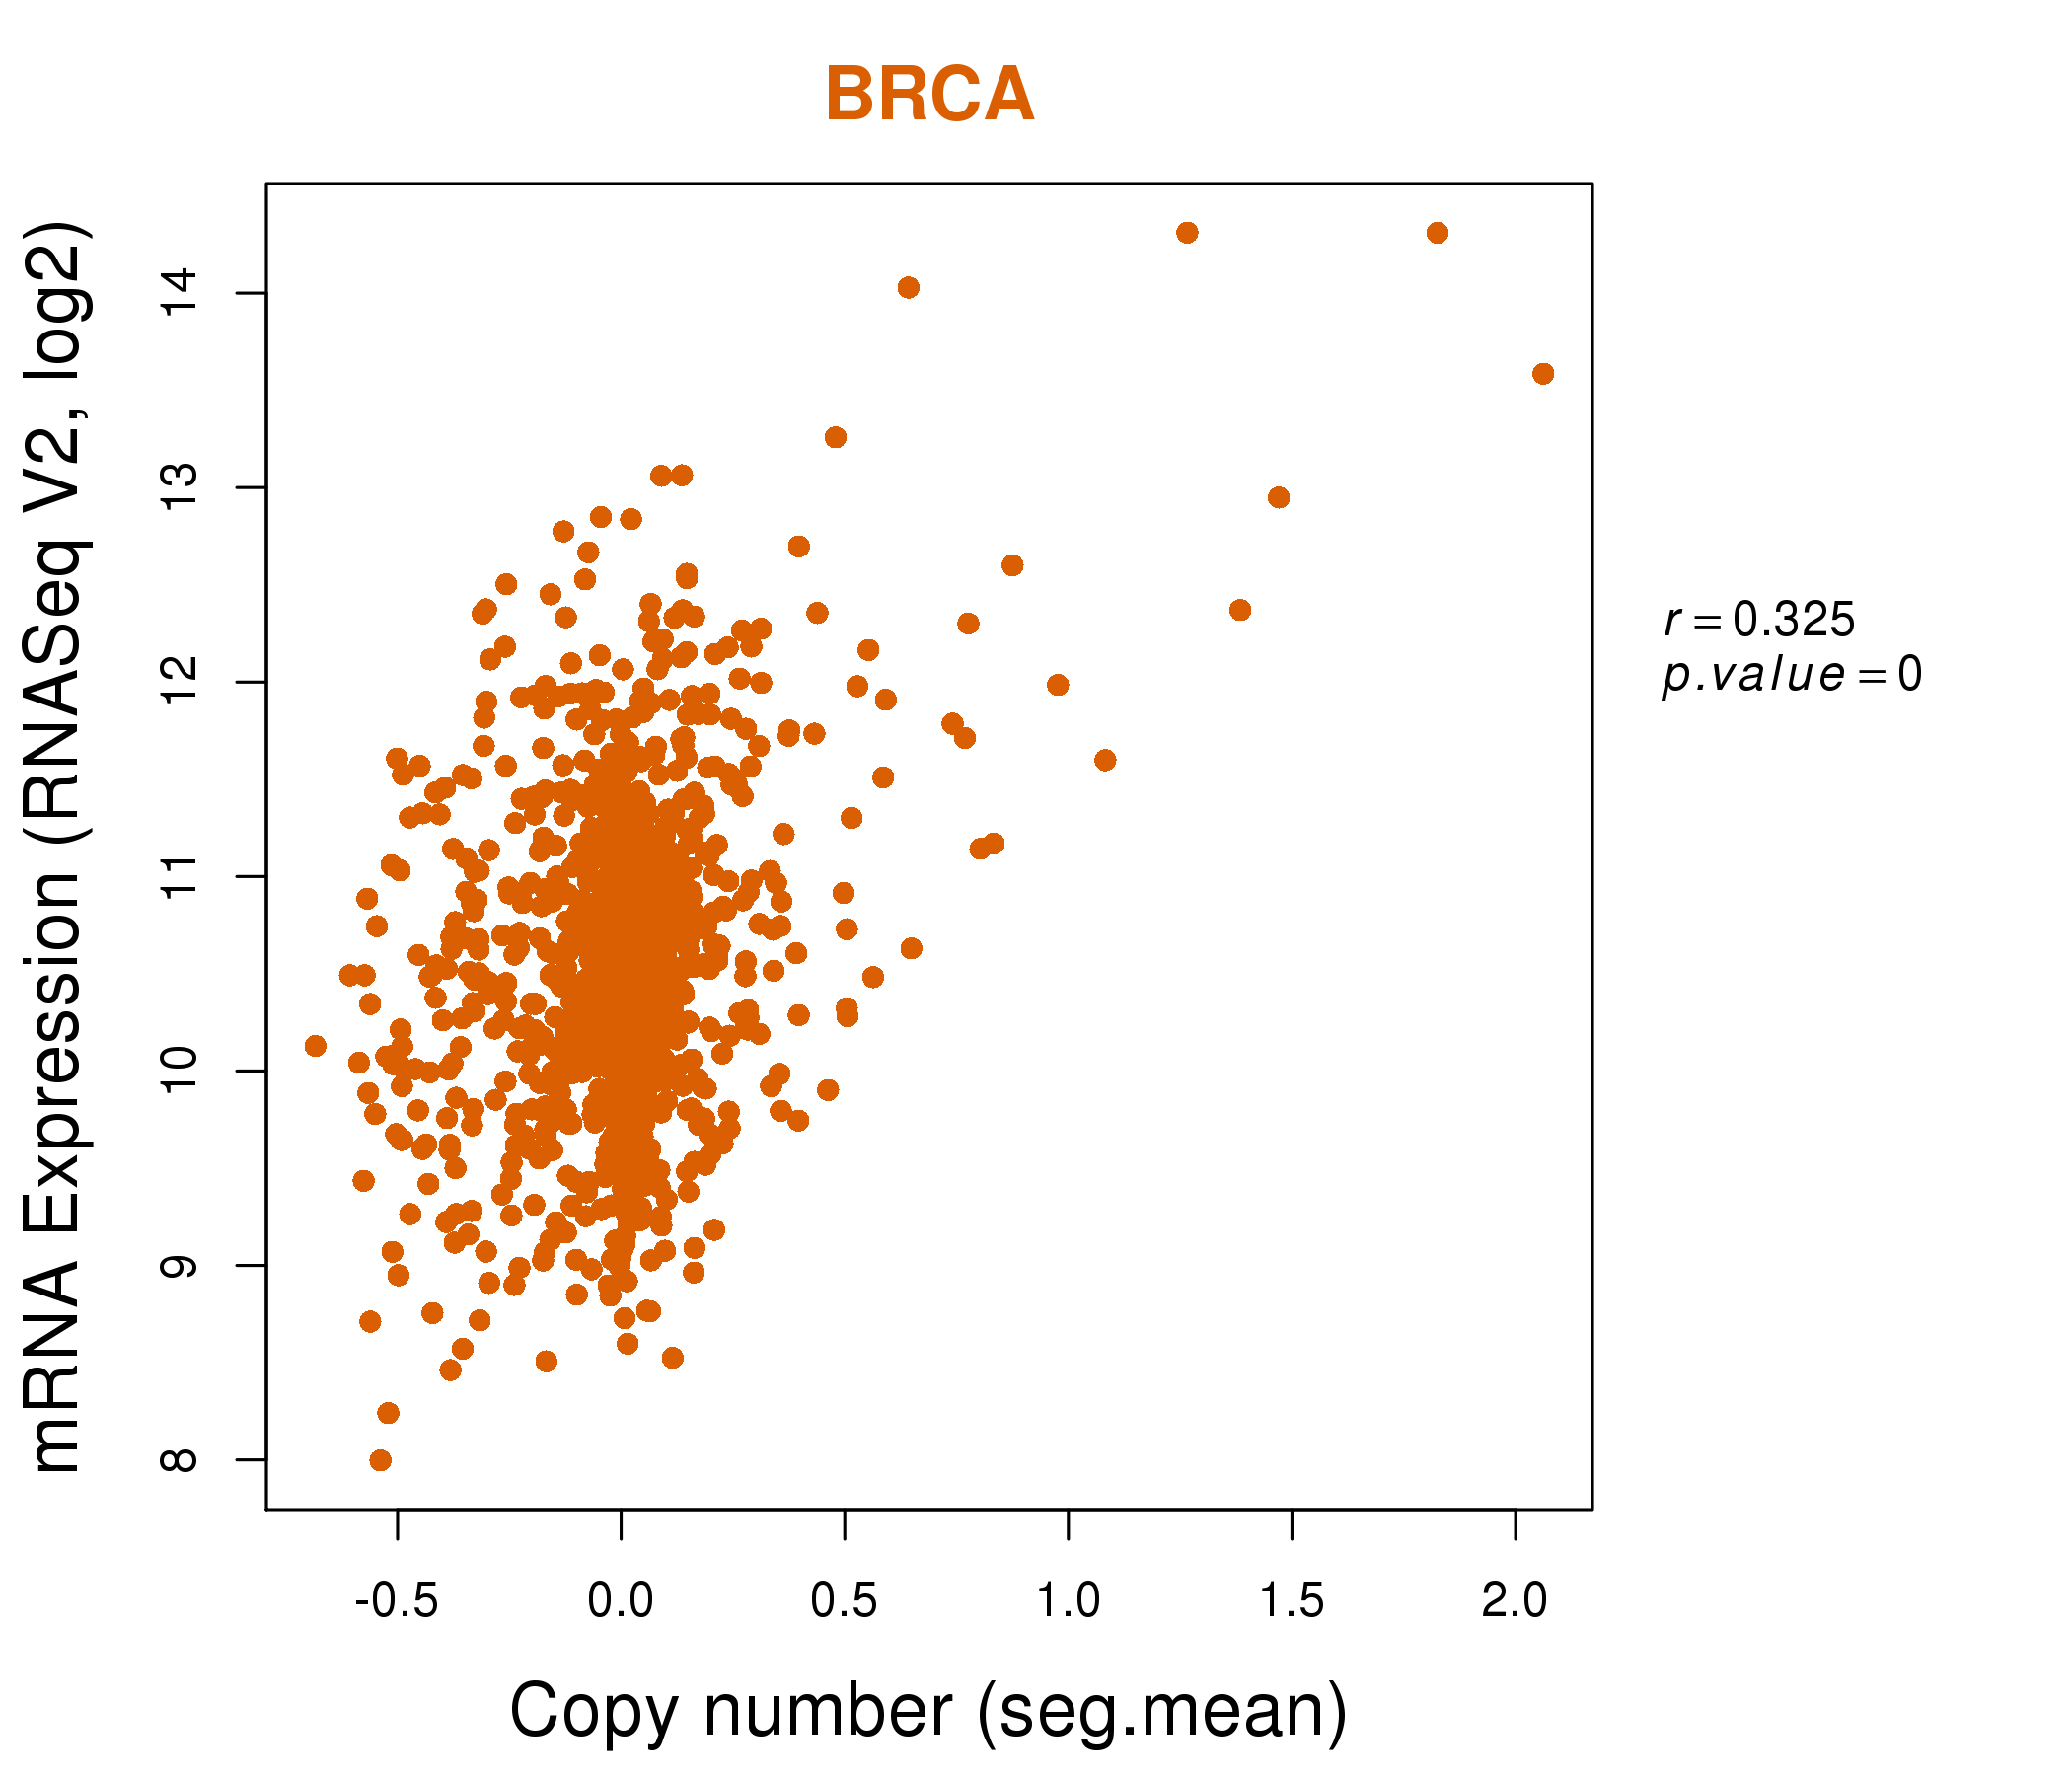
| * This plots show the correlation between CNV and gene expression. |
: Open all plots for all cancer types
 |
|
 |
|

| Top |
| Gene-Gene Network Information |
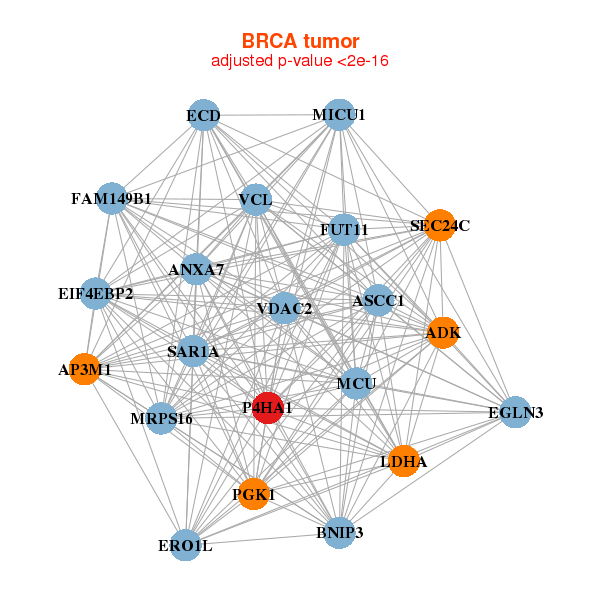
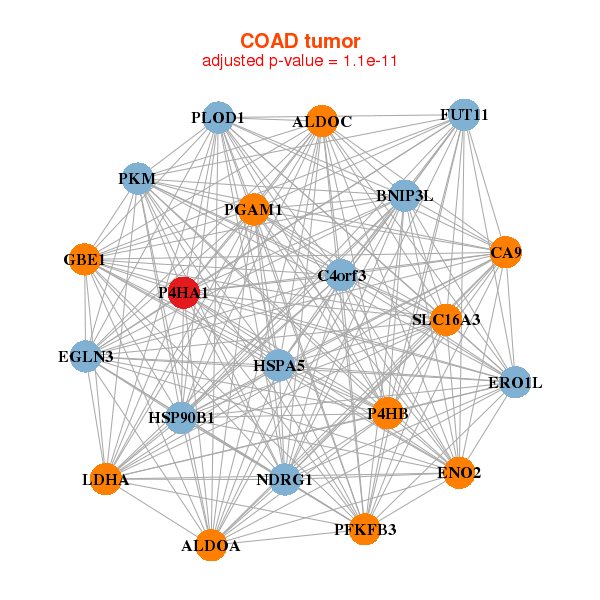
| * Co-Expression network figures were drawn using R package igraph. Only the top 20 genes with the highest correlations were shown. Red circle: input gene, orange circle: cell metabolism gene, sky circle: other gene |
: Open all plots for all cancer types
 |
| ||||
| ADK,ANXA7,AP3M1,ASCC1,BNIP3,MICU1,MCU, ECD,EGLN3,EIF4EBP2,ERO1L,FAM149B1,FUT11,LDHA, MRPS16,P4HA1,PGK1,SAR1A,SEC24C,VCL,VDAC2 | ABCC4,ADD3,CNTNAP2,ELOVL7,EXOC6,FAR2,G3BP2, HERC3,HIST1H4H,HSD3B2,IDE,IDI1,MAPK6,NSF, P4HA1,SAR1B,SCP2,SLC41A2,SMPDL3A,SPPL2A,SYT6 | ||||
 |
| ||||
| ALDOA,ALDOC,BNIP3L,C4orf3,CA9,EGLN3,ENO2, ERO1L,FUT11,GBE1,HSP90B1,HSPA5,LDHA,NDRG1, P4HA1,P4HB,PFKFB3,PGAM1,PKM,PLOD1,SLC16A3 | MAB21L3,CDK19,EGLN3,FAM13A,GABRA2,LIPC,LRP4, MUC20,NDRG1,NETO2,OPN3,P4HA1,PLOD2,RNASEL, RNF170,SCARB1,SLC11A2,ST8SIA6,TCTN3,TSTD2,VWA5A |
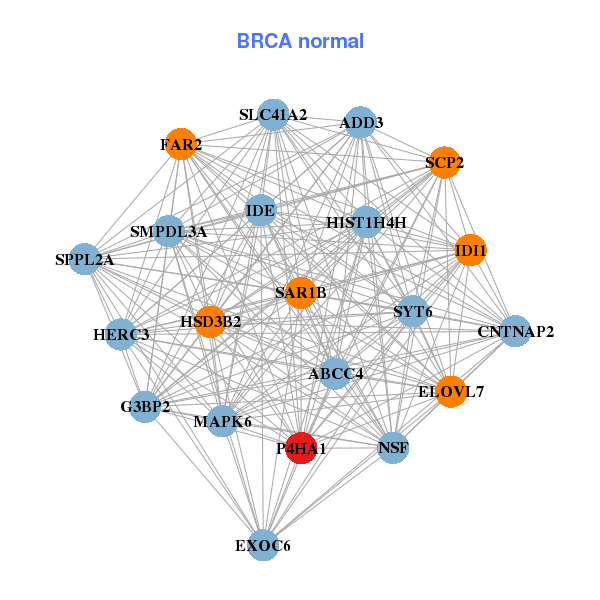
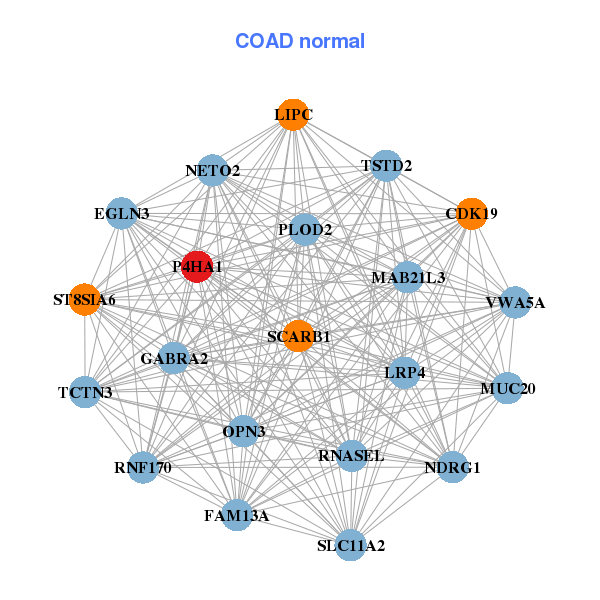
| * Co-Expression network figures were drawn using R package igraph. Only the top 20 genes with the highest correlations were shown. Red circle: input gene, orange circle: cell metabolism gene, sky circle: other gene |
: Open all plots for all cancer types
| Top |
: Open all interacting genes' information including KEGG pathway for all interacting genes from DAVID
| Top |
| Pharmacological Information for P4HA1 |
| DB Category | DB Name | DB's ID and Url link |
| * Gene Centered Interaction Network. |
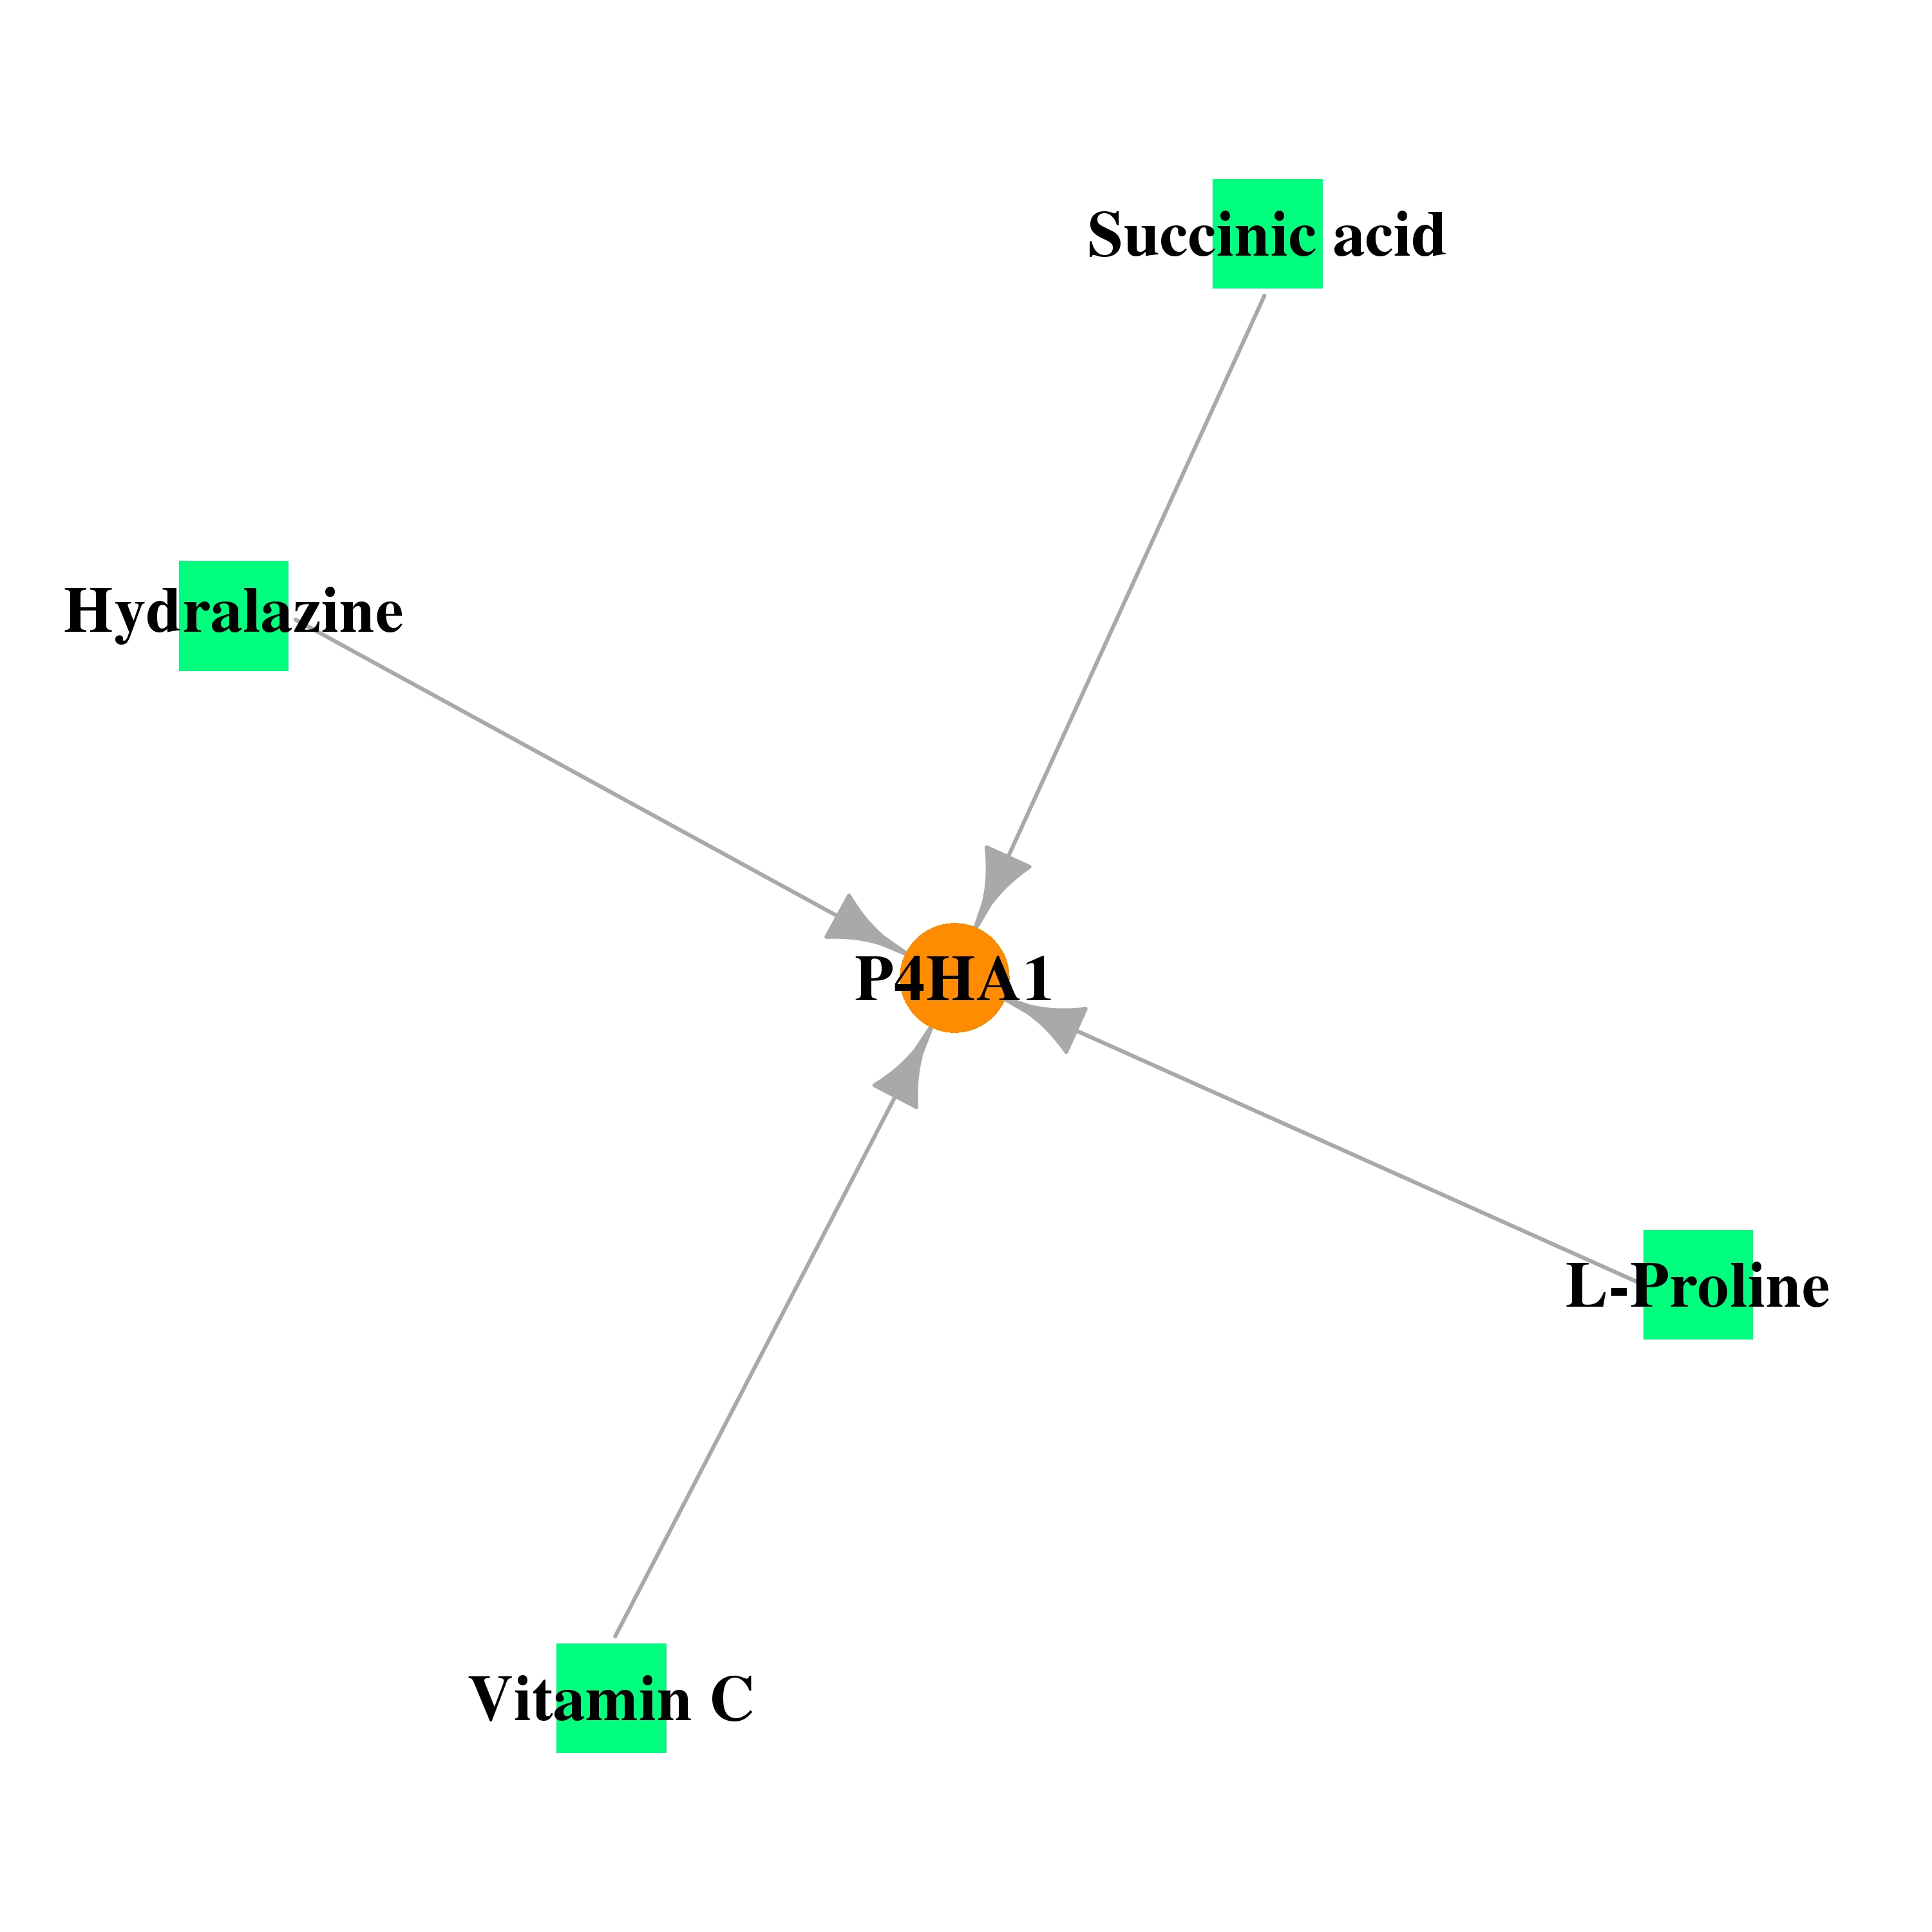 |
| * Drug Centered Interaction Network. |
| DrugBank ID | Target Name | Drug Groups | Generic Name | Drug Centered Network | Drug Structure |
| DB00126 | prolyl 4-hydroxylase, alpha polypeptide I | approved; nutraceutical | Vitamin C | 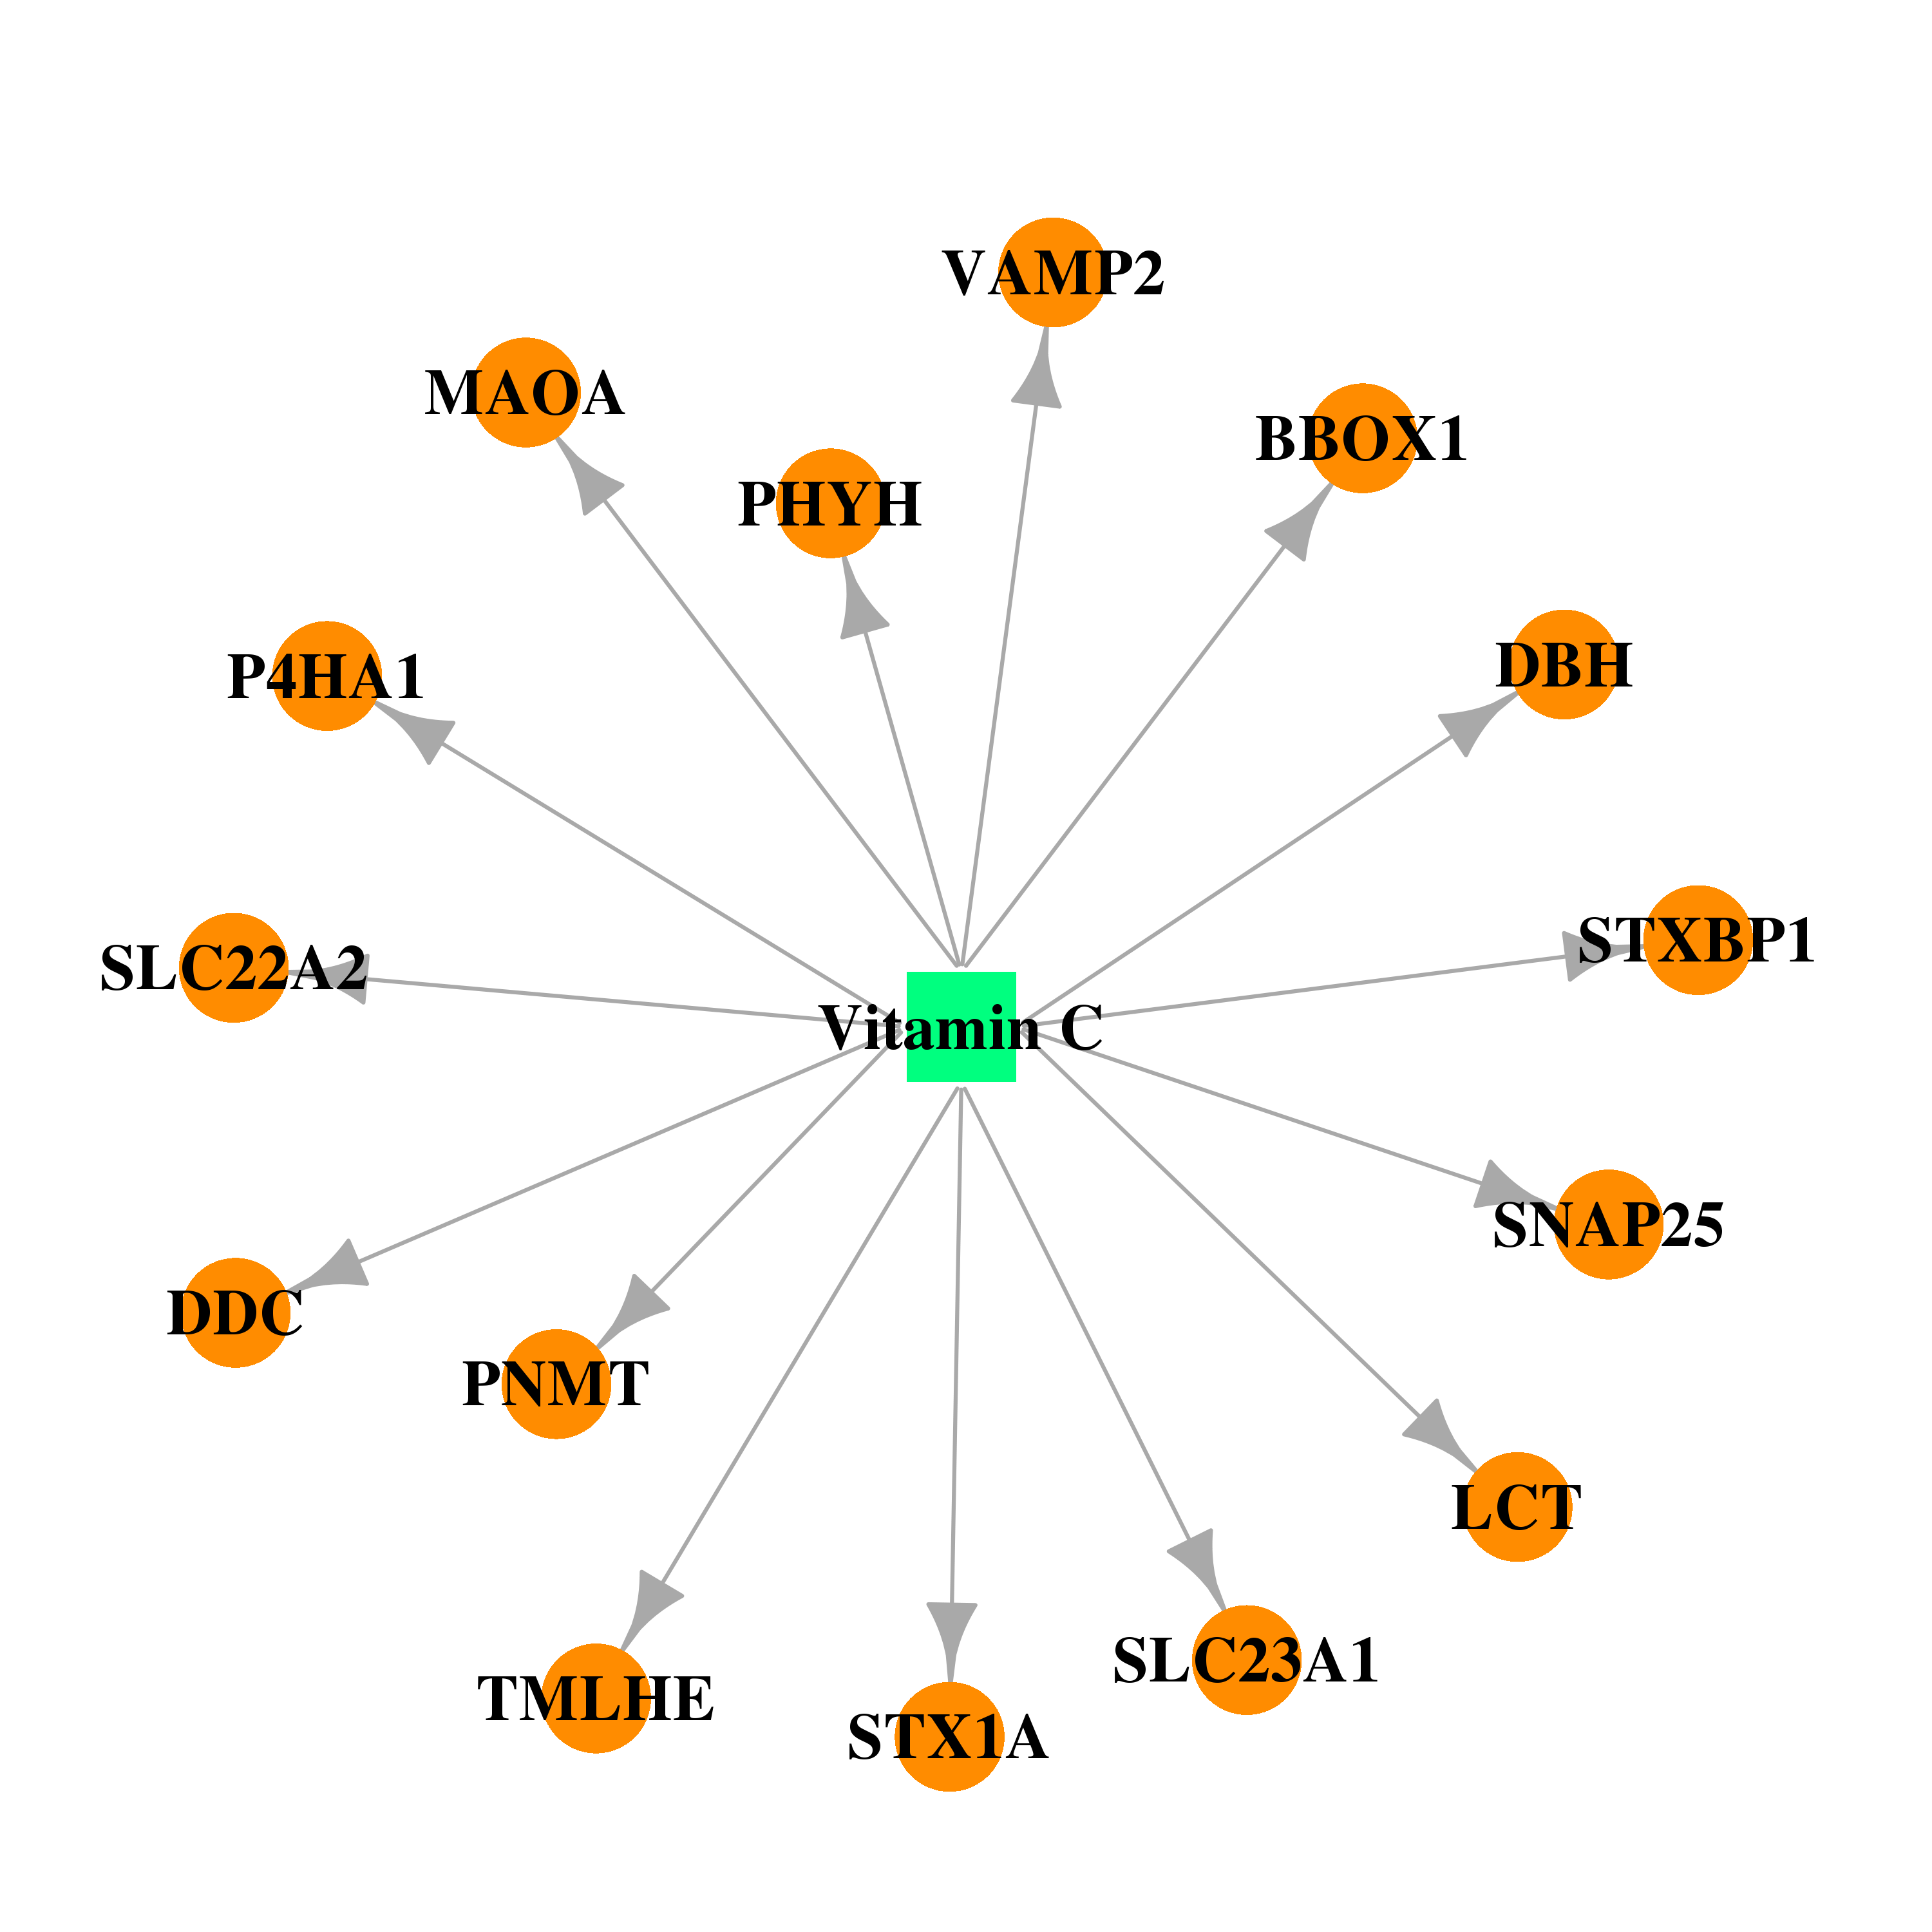 | 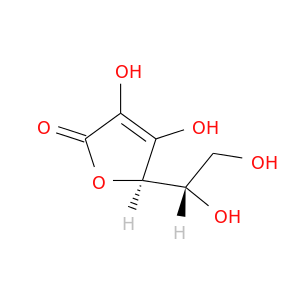 |
| DB00139 | prolyl 4-hydroxylase, alpha polypeptide I | approved; nutraceutical | Succinic acid | 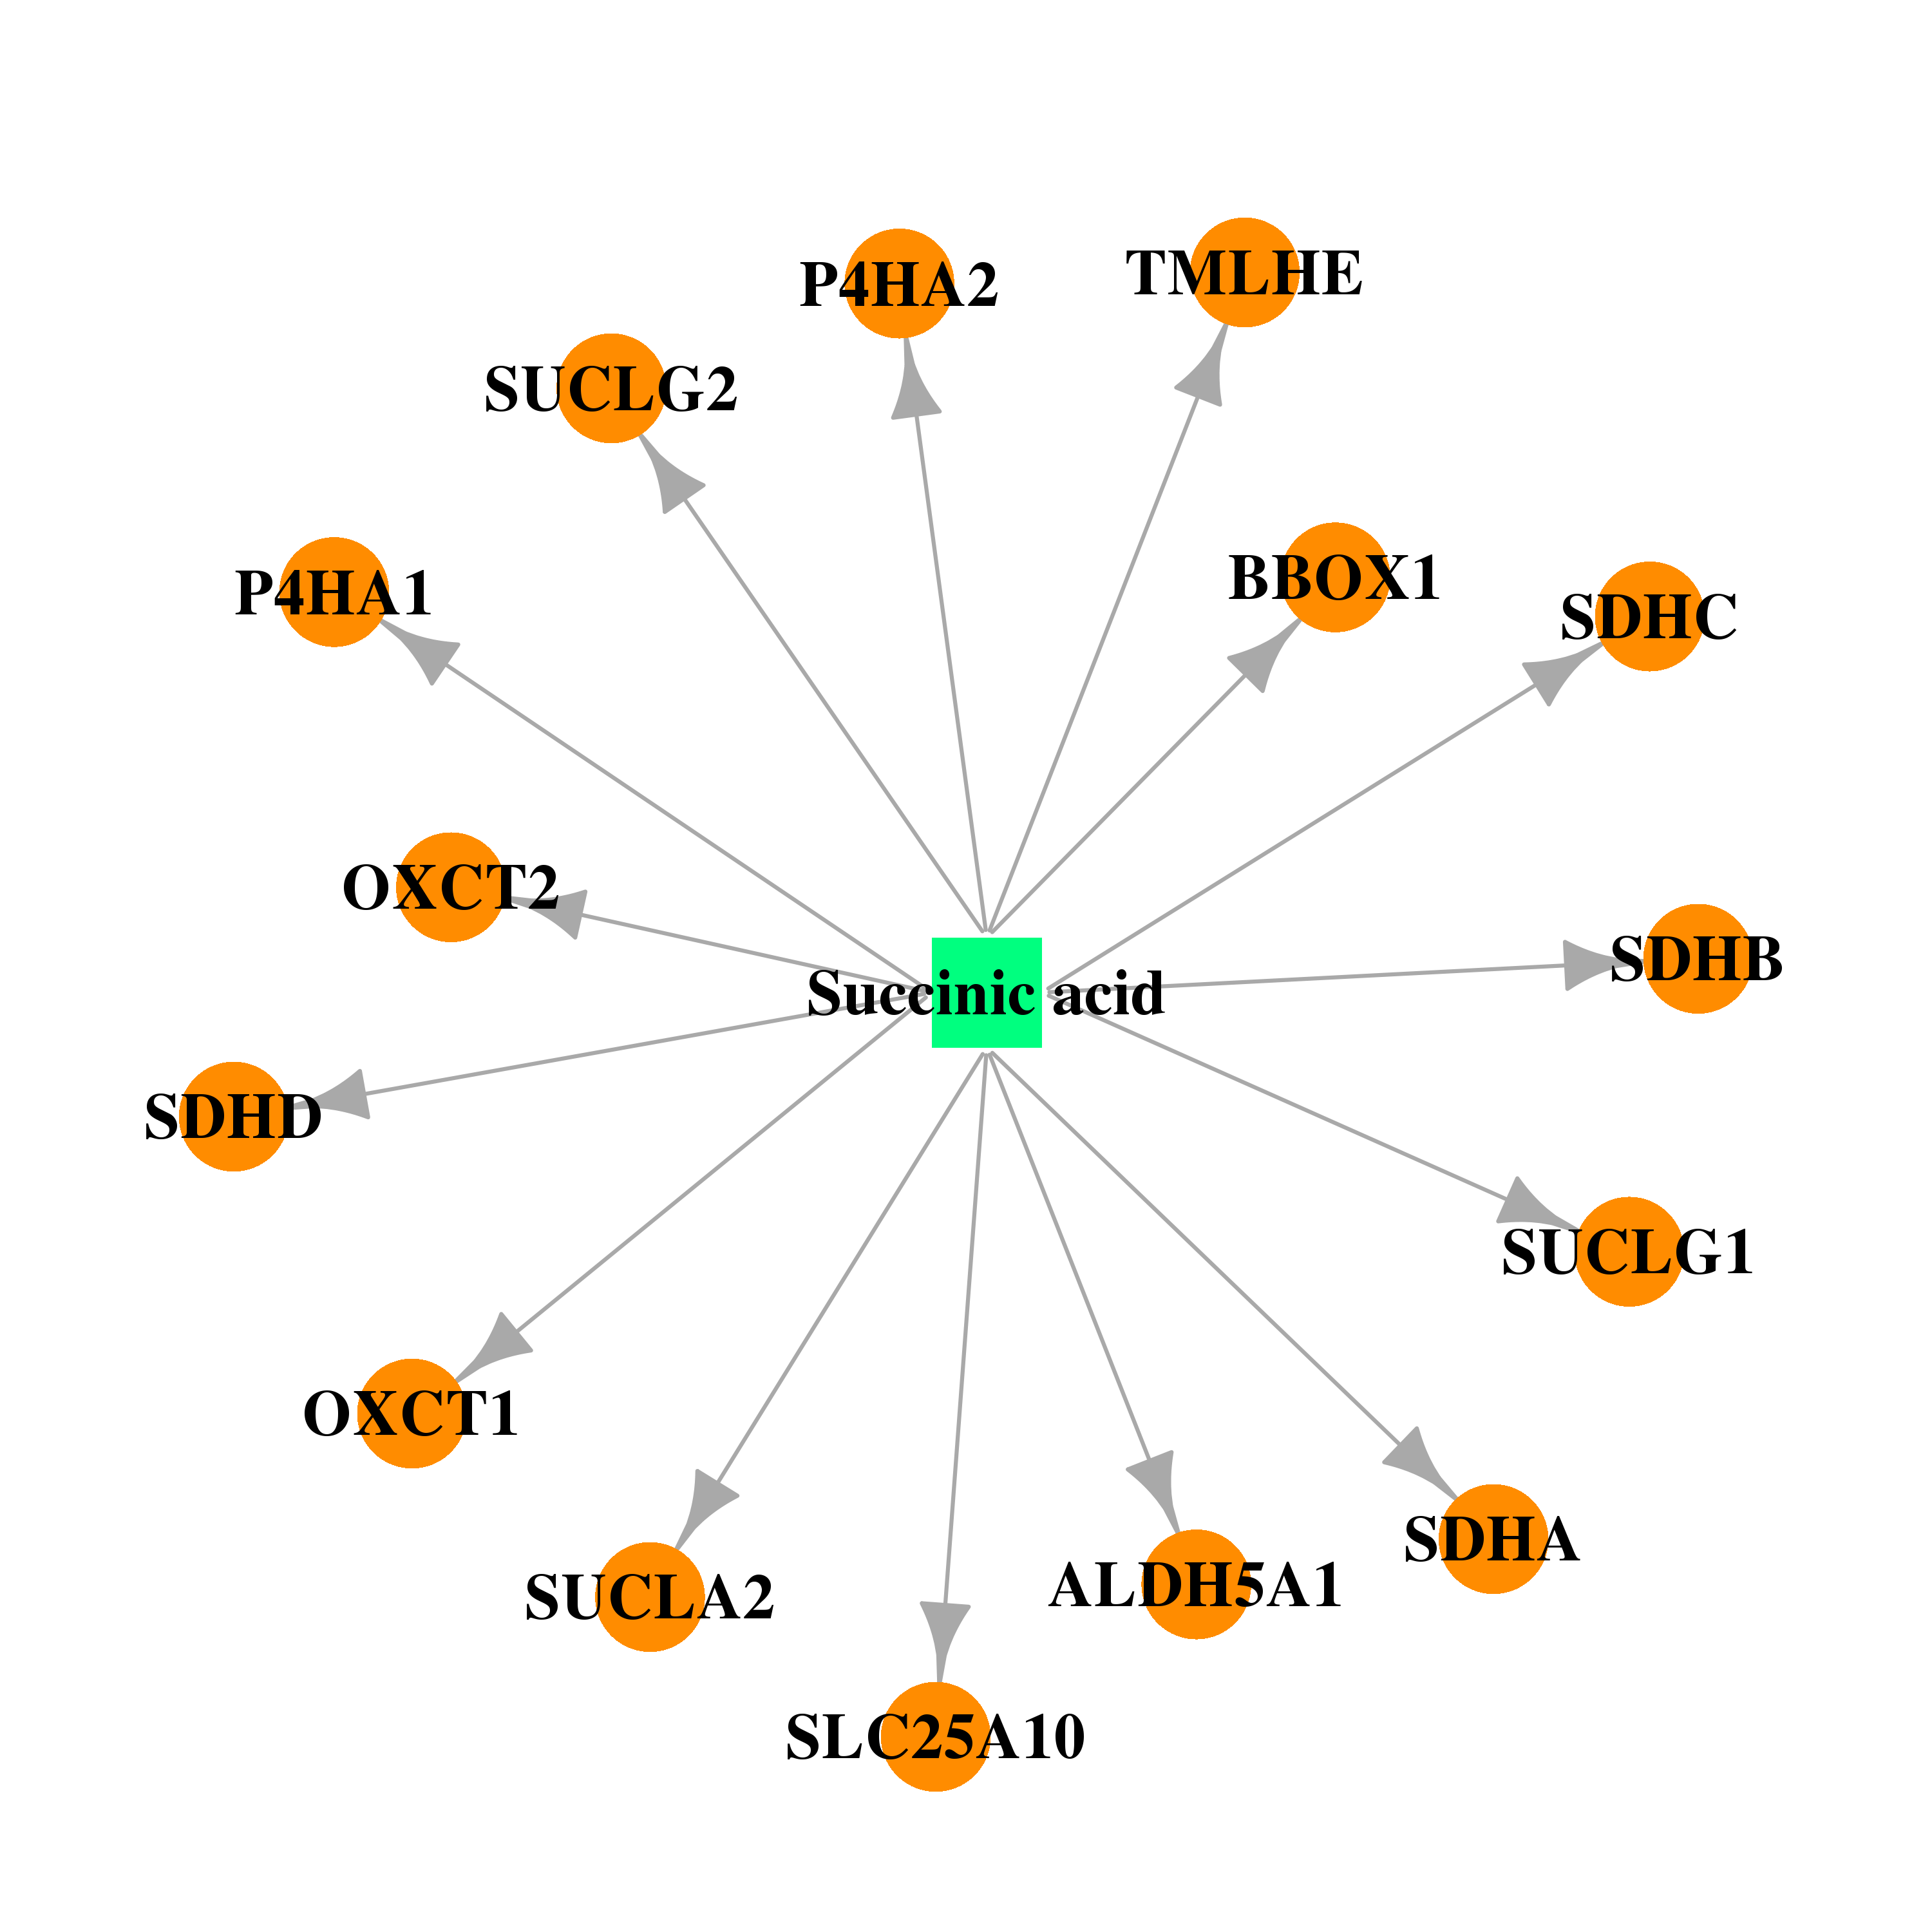 |  |
| DB00172 | prolyl 4-hydroxylase, alpha polypeptide I | approved; nutraceutical | L-Proline | 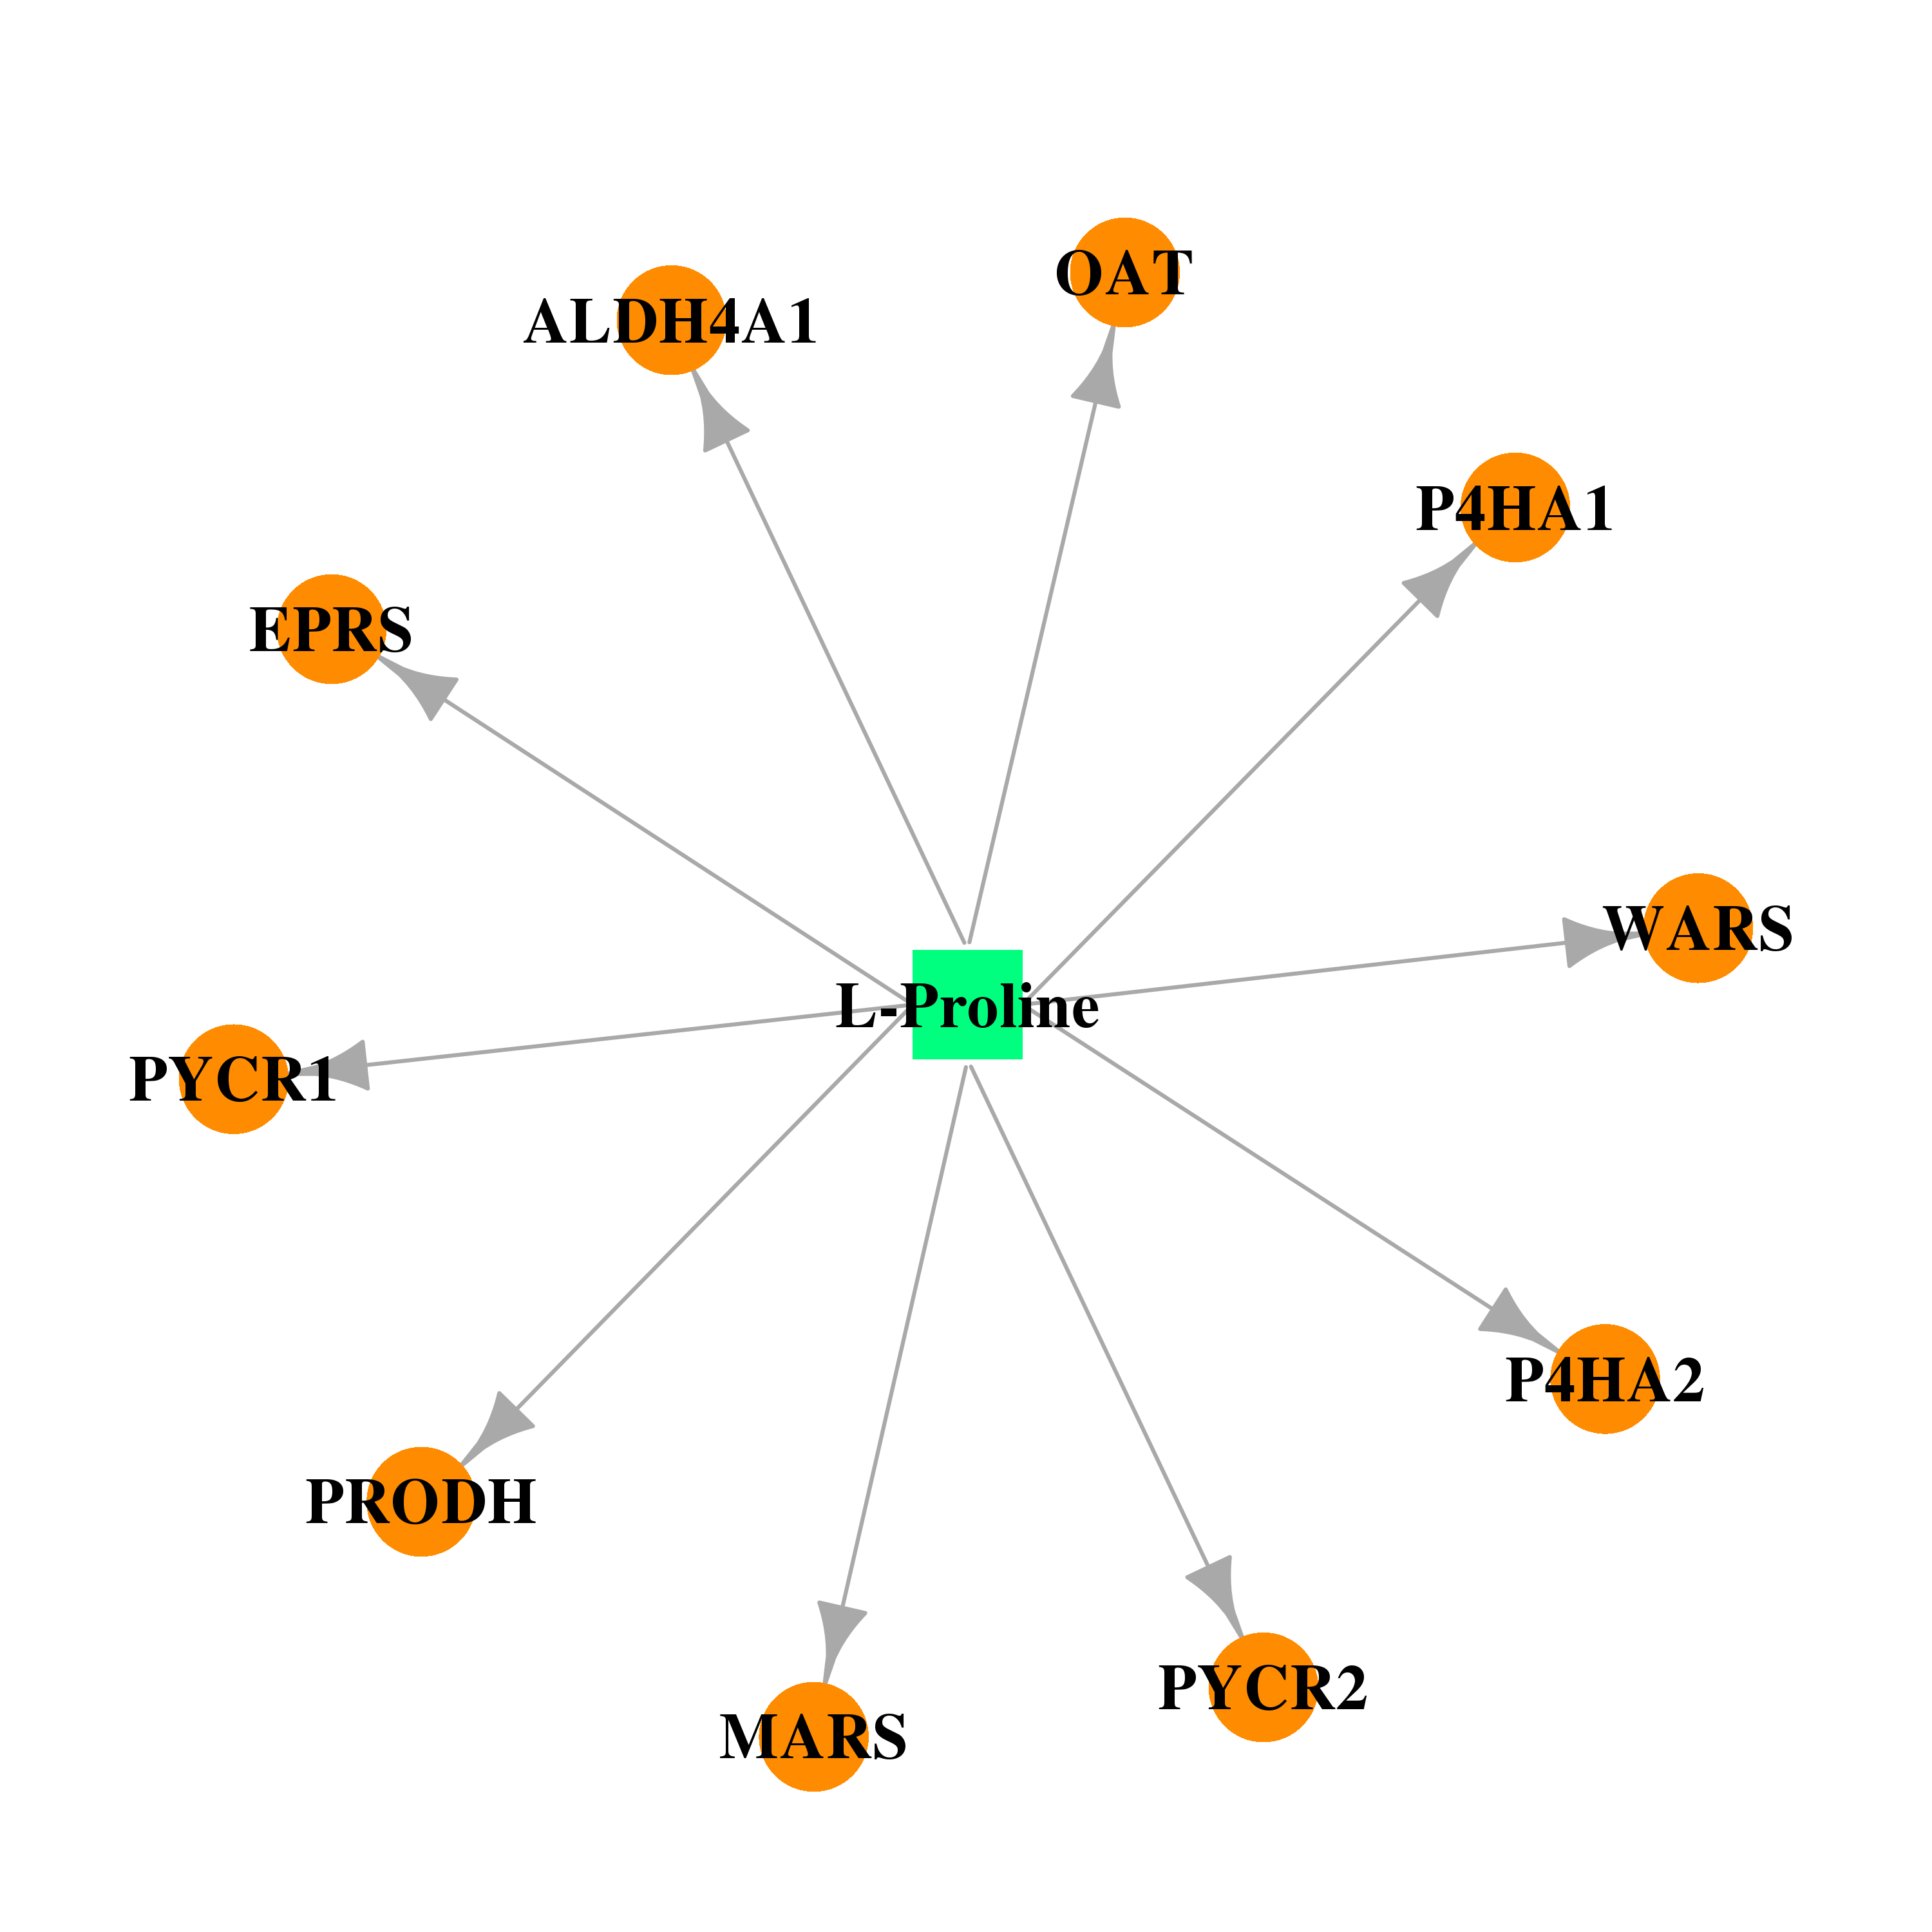 |  |
| DB01275 | prolyl 4-hydroxylase, alpha polypeptide I | approved | Hydralazine | 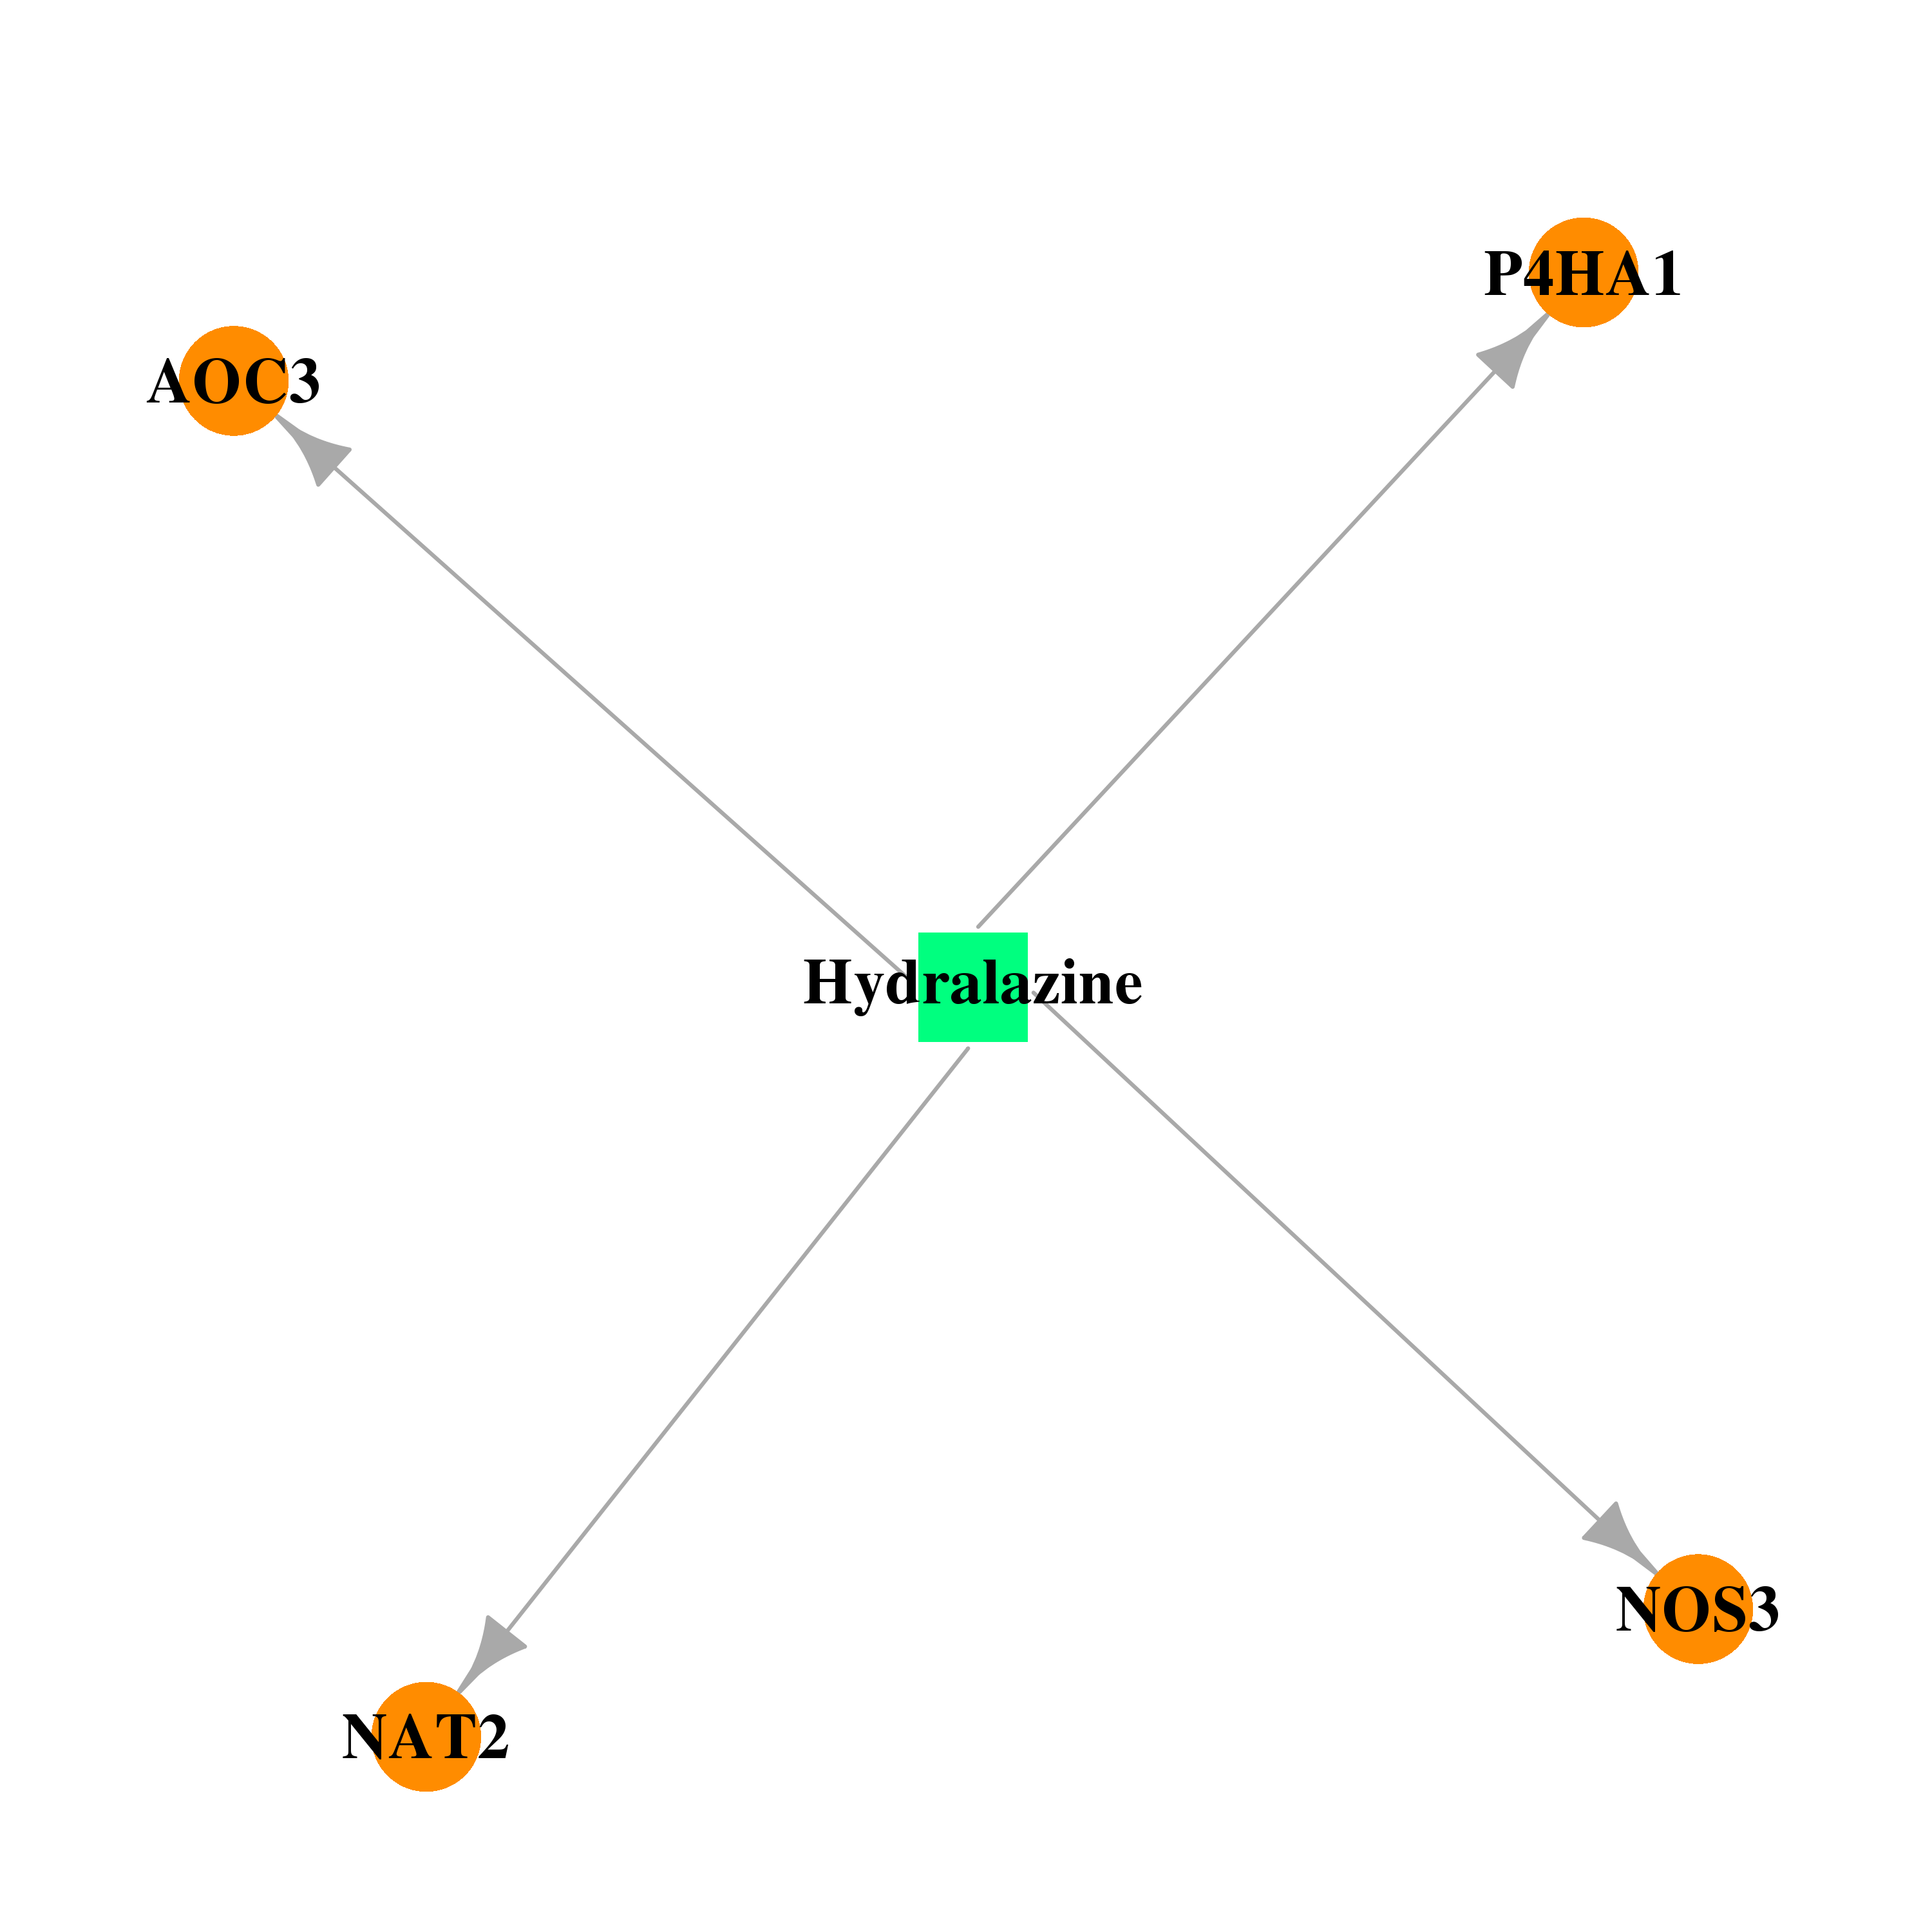 |  |
| Top |
| Cross referenced IDs for P4HA1 |
| * We obtained these cross-references from Uniprot database. It covers 150 different DBs, 18 categories. http://www.uniprot.org/help/cross_references_section |
: Open all cross reference information
|
Copyright © 2016-Present - The Univsersity of Texas Health Science Center at Houston @ |