|
||||||||||||||||||||
| |
| Phenotypic Information (metabolism pathway, cancer, disease, phenome) |
| |
| |
| Gene-Gene Network Information: Co-Expression Network, Interacting Genes & KEGG |
| |
|


| Gene Summary for PAFAH1B2 |
| Basic gene info. | Gene symbol | PAFAH1B2 |
| Gene name | platelet-activating factor acetylhydrolase 1b, catalytic subunit 2 (30kDa) | |
| Synonyms | HEL-S-303 | |
| Cytomap | UCSC genome browser: 11q23 | |
| Genomic location | chr11 :117014999-117041761 | |
| Type of gene | protein-coding | |
| RefGenes | NM_001184746.1, NM_001184747.1,NM_001184748.1,NM_002572.3,NR_110268.1, NR_110269.1,NR_110282.1, | |
| Ensembl id | ENSG00000168092 | |
| Description | PAF acetylhydrolase 30 kDa subunitPAF-AH 30 kDa subunitPAF-AH subunit betaPAF-AH1b alpha 2 subunitPAFAH subunit betaepididymis secretory protein Li 303intracellular platelet-activating factor acetylhydrolase alpha 2 subunitplatelet-activating facto | |
| Modification date | 20141207 | |
| dbXrefs | MIM : 602508 | |
| HGNC : HGNC | ||
| Ensembl : ENSG00000168092 | ||
| HPRD : 03940 | ||
| Vega : OTTHUMG00000167064 | ||
| Protein | UniProt: P68402 go to UniProt's Cross Reference DB Table | |
| Expression | CleanEX: HS_PAFAH1B2 | |
| BioGPS: 5049 | ||
| Gene Expression Atlas: ENSG00000168092 | ||
| The Human Protein Atlas: ENSG00000168092 | ||
| Pathway | NCI Pathway Interaction Database: PAFAH1B2 | |
| KEGG: PAFAH1B2 | ||
| REACTOME: PAFAH1B2 | ||
| ConsensusPathDB | ||
| Pathway Commons: PAFAH1B2 | ||
| Metabolism | MetaCyc: PAFAH1B2 | |
| HUMANCyc: PAFAH1B2 | ||
| Regulation | Ensembl's Regulation: ENSG00000168092 | |
| miRBase: chr11 :117,014,999-117,041,761 | ||
| TargetScan: NM_001184746 | ||
| cisRED: ENSG00000168092 | ||
| Context | iHOP: PAFAH1B2 | |
| cancer metabolism search in PubMed: PAFAH1B2 | ||
| UCL Cancer Institute: PAFAH1B2 | ||
| Assigned class in ccmGDB | A - This gene has a literature evidence and it belongs to cancer gene. | |
| References showing role of PAFAH1B2 in cancer cell metabolism | 1. Kohnz RA, Mulvihill MM, Chang JW, Hsu K-L, Sorrentino A, et al. (2015) Activity-Based Protein Profiling of Oncogene-Driven Changes in Metabolism Reveals Broad Dysregulation of PAFAH1B2 and 1B3 in Cancer. ACS chemical biology. go to article | |
| Top |
| Phenotypic Information for PAFAH1B2(metabolism pathway, cancer, disease, phenome) |
| Cancer | CGAP: PAFAH1B2 |
| Familial Cancer Database: PAFAH1B2 | |
| * This gene is included in those cancer gene databases. |
|
|
|
|
|
| . | ||||||||||||||
Oncogene 1 | Significant driver gene in | |||||||||||||||||||
| cf) number; DB name 1 Oncogene; http://nar.oxfordjournals.org/content/35/suppl_1/D721.long, 2 Tumor Suppressor gene; https://bioinfo.uth.edu/TSGene/, 3 Cancer Gene Census; http://www.nature.com/nrc/journal/v4/n3/abs/nrc1299.html, 4 CancerGenes; http://nar.oxfordjournals.org/content/35/suppl_1/D721.long, 5 Network of Cancer Gene; http://ncg.kcl.ac.uk/index.php, 1Therapeutic Vulnerabilities in Cancer; http://cbio.mskcc.org/cancergenomics/statius/ |
| Nat Rev Drug Discovery, 2013, 12: 829, doi: 10.1038/nrd4145 | |
| OMIM | 602508; gene. 602508; gene. |
| Orphanet | |
| Disease | KEGG Disease: PAFAH1B2 |
| MedGen: PAFAH1B2 (Human Medical Genetics with Condition) | |
| ClinVar: PAFAH1B2 | |
| Phenotype | MGI: PAFAH1B2 (International Mouse Phenotyping Consortium) |
| PhenomicDB: PAFAH1B2 | |
| Mutations for PAFAH1B2 |
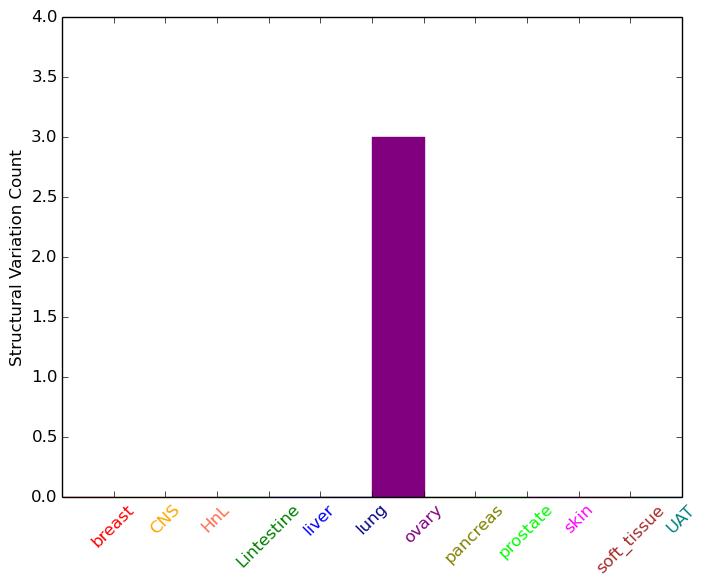
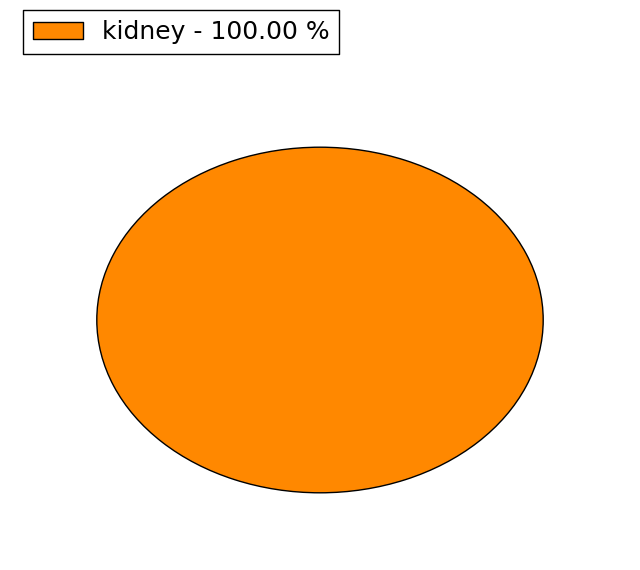
| * Under tables are showing count per each tissue to give us broad intuition about tissue specific mutation patterns.You can go to the detailed page for each mutation database's web site. |
| - Statistics for Tissue and Mutation type | Top |
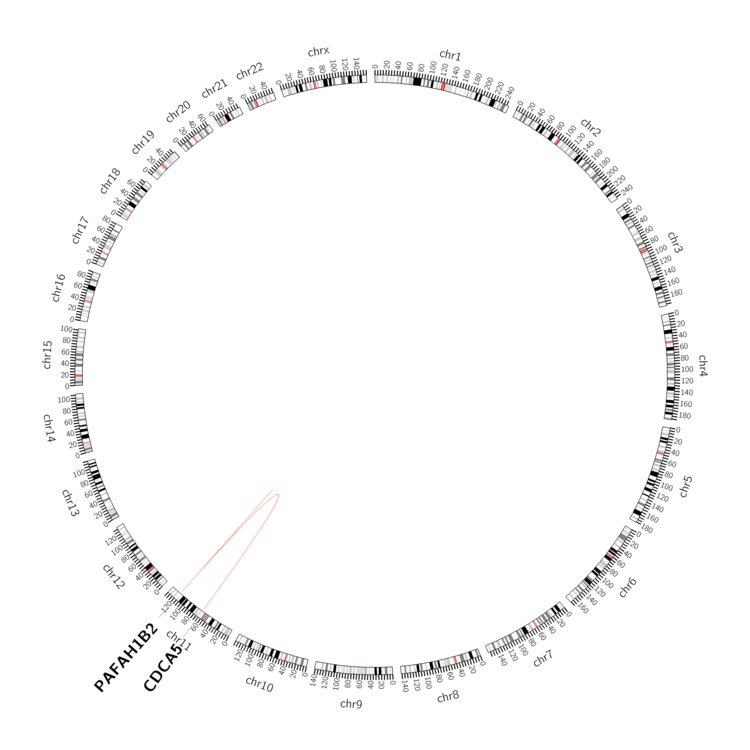 |
| - For Inter-chromosomal Variations |
| There's no inter-chromosomal structural variation. |
| - For Intra-chromosomal Variations |
| * Intra-chromosomal variantions includes 'intrachromosomal amplicon to amplicon', 'intrachromosomal amplicon to non-amplified dna', 'intrachromosomal deletion', 'intrachromosomal fold-back inversion', 'intrachromosomal inversion', 'intrachromosomal tandem duplication', 'Intrachromosomal unknown type', 'intrachromosomal with inverted orientation', 'intrachromosomal with non-inverted orientation'. |
 |
| Sample | Symbol_a | Chr_a | Start_a | End_a | Symbol_b | Chr_b | Start_b | End_b |
| ovary | PAFAH1B2 | chr11 | 117019839 | 117019859 | CDCA5 | chr11 | 64845409 | 64845429 |
| ovary | PAFAH1B2 | chr11 | 117029961 | 117029981 | chr11 | 116988146 | 116988166 |
| cf) Tissue number; Tissue name (1;Breast, 2;Central_nervous_system, 3;Haematopoietic_and_lymphoid_tissue, 4;Large_intestine, 5;Liver, 6;Lung, 7;Ovary, 8;Pancreas, 9;Prostate, 10;Skin, 11;Soft_tissue, 12;Upper_aerodigestive_tract) |
| * From mRNA Sanger sequences, Chitars2.0 arranged chimeric transcripts. This table shows PAFAH1B2 related fusion information. |
| ID | Head Gene | Tail Gene | Accession | Gene_a | qStart_a | qEnd_a | Chromosome_a | tStart_a | tEnd_a | Gene_a | qStart_a | qEnd_a | Chromosome_a | tStart_a | tEnd_a |
| CT002325 | PAFAH1B2 | 1 | 95 | 11 | 117015040 | 117015134 | ARID5A | 96 | 694 | 2 | 97213139 | 97215971 | |
| CB528508 | PAFAH1B2 | 1 | 613 | 11 | 117040748 | 117041360 | ZFAND5 | 610 | 665 | 9 | 74974361 | 74974416 | |
| BC064340 | PAFAH1B2 | 1 | 108 | 11 | 117015115 | 117023244 | FOXR1 | 106 | 748 | 11 | 118849489 | 118851995 | |
| AW629132 | TBL1X | 10 | 155 | X | 9687633 | 9687778 | PAFAH1B2 | 138 | 488 | 11 | 117038809 | 117039159 | |
| BE177628 | PAFAH1B2 | 1 | 473 | 11 | 117026779 | 117027249 | PAFAH1B2 | 460 | 657 | 11 | 117022690 | 117022887 | |
| AA318969 | LIN9 | 2 | 79 | 1 | 226453685 | 226453762 | PAFAH1B2 | 77 | 295 | 11 | 117039777 | 117039995 | |
| BU662239 | CDC25A | 213 | 239 | 3 | 48215500 | 48215526 | PAFAH1B2 | 236 | 709 | 11 | 117039756 | 117040228 | |
| Top |
| There's no copy number variation information in COSMIC data for this gene. |
| Top |
|
 |
| Top |
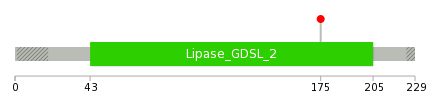
| Stat. for Non-Synonymous SNVs (# total SNVs=1) | (# total SNVs=0) |
 | |
(# total SNVs=0) | (# total SNVs=0) |
| Top |
| * When you move the cursor on each content, you can see more deailed mutation information on the Tooltip. Those are primary_site,primary_histology,mutation(aa),pubmedID. |
| GRCh37 position | Mutation(aa) | Unique sampleID count |
| chr11:117038249-117038249 | p.T175S | 1 |
| Top |
|
 |
| Point Mutation/ Tissue ID | 1 | 2 | 3 | 4 | 5 | 6 | 7 | 8 | 9 | 10 | 11 | 12 | 13 | 14 | 15 | 16 | 17 | 18 | 19 | 20 |
| # sample | 1 | 1 | 1 | 2 | 1 | 2 | 1 | 3 | ||||||||||||
| # mutation | 1 | 1 | 1 | 2 | 1 | 2 | 1 | 3 | ||||||||||||
| nonsynonymous SNV | 1 | 1 | 2 | 1 | 2 | 1 | 3 | |||||||||||||
| synonymous SNV | 1 |
| cf) Tissue ID; Tissue type (1; BLCA[Bladder Urothelial Carcinoma], 2; BRCA[Breast invasive carcinoma], 3; CESC[Cervical squamous cell carcinoma and endocervical adenocarcinoma], 4; COAD[Colon adenocarcinoma], 5; GBM[Glioblastoma multiforme], 6; Glioma Low Grade, 7; HNSC[Head and Neck squamous cell carcinoma], 8; KICH[Kidney Chromophobe], 9; KIRC[Kidney renal clear cell carcinoma], 10; KIRP[Kidney renal papillary cell carcinoma], 11; LAML[Acute Myeloid Leukemia], 12; LUAD[Lung adenocarcinoma], 13; LUSC[Lung squamous cell carcinoma], 14; OV[Ovarian serous cystadenocarcinoma ], 15; PAAD[Pancreatic adenocarcinoma], 16; PRAD[Prostate adenocarcinoma], 17; SKCM[Skin Cutaneous Melanoma], 18:STAD[Stomach adenocarcinoma], 19:THCA[Thyroid carcinoma], 20:UCEC[Uterine Corpus Endometrial Carcinoma]) |
| Top |
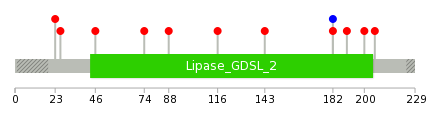
| * We represented just top 10 SNVs. When you move the cursor on each content, you can see more deailed mutation information on the Tooltip. Those are primary_site, primary_histology, mutation(aa), pubmedID. |
| Genomic Position | Mutation(aa) | Unique sampleID count |
| chr11:117038323 | p.R23P,PAFAH1B2 | 1 |
| chr11:117023231 | p.S26Y,PAFAH1B2 | 1 |
| chr11:117038342 | p.G46R,PAFAH1B2 | 1 |
| chr11:117023240 | p.G74W,PAFAH1B2 | 1 |
| chr11:117030704 | p.G88R,PAFAH1B2 | 1 |
| chr11:117031909 | p.G116A,PAFAH1B2 | 1 |
| chr11:117031951 | p.G143C | 1 |
| chr11:117034544 | p.S182L | 1 |
| chr11:117038152 | p.S182S | 1 |
| chr11:117038270 | p.D190N | 1 |
| * Copy number data were extracted from TCGA using R package TCGA-Assembler. The URLs of all public data files on TCGA DCC data server were gathered on Jan-05-2015. Function ProcessCNAData in TCGA-Assembler package was used to obtain gene-level copy number value which is calculated as the average copy number of the genomic region of a gene. |
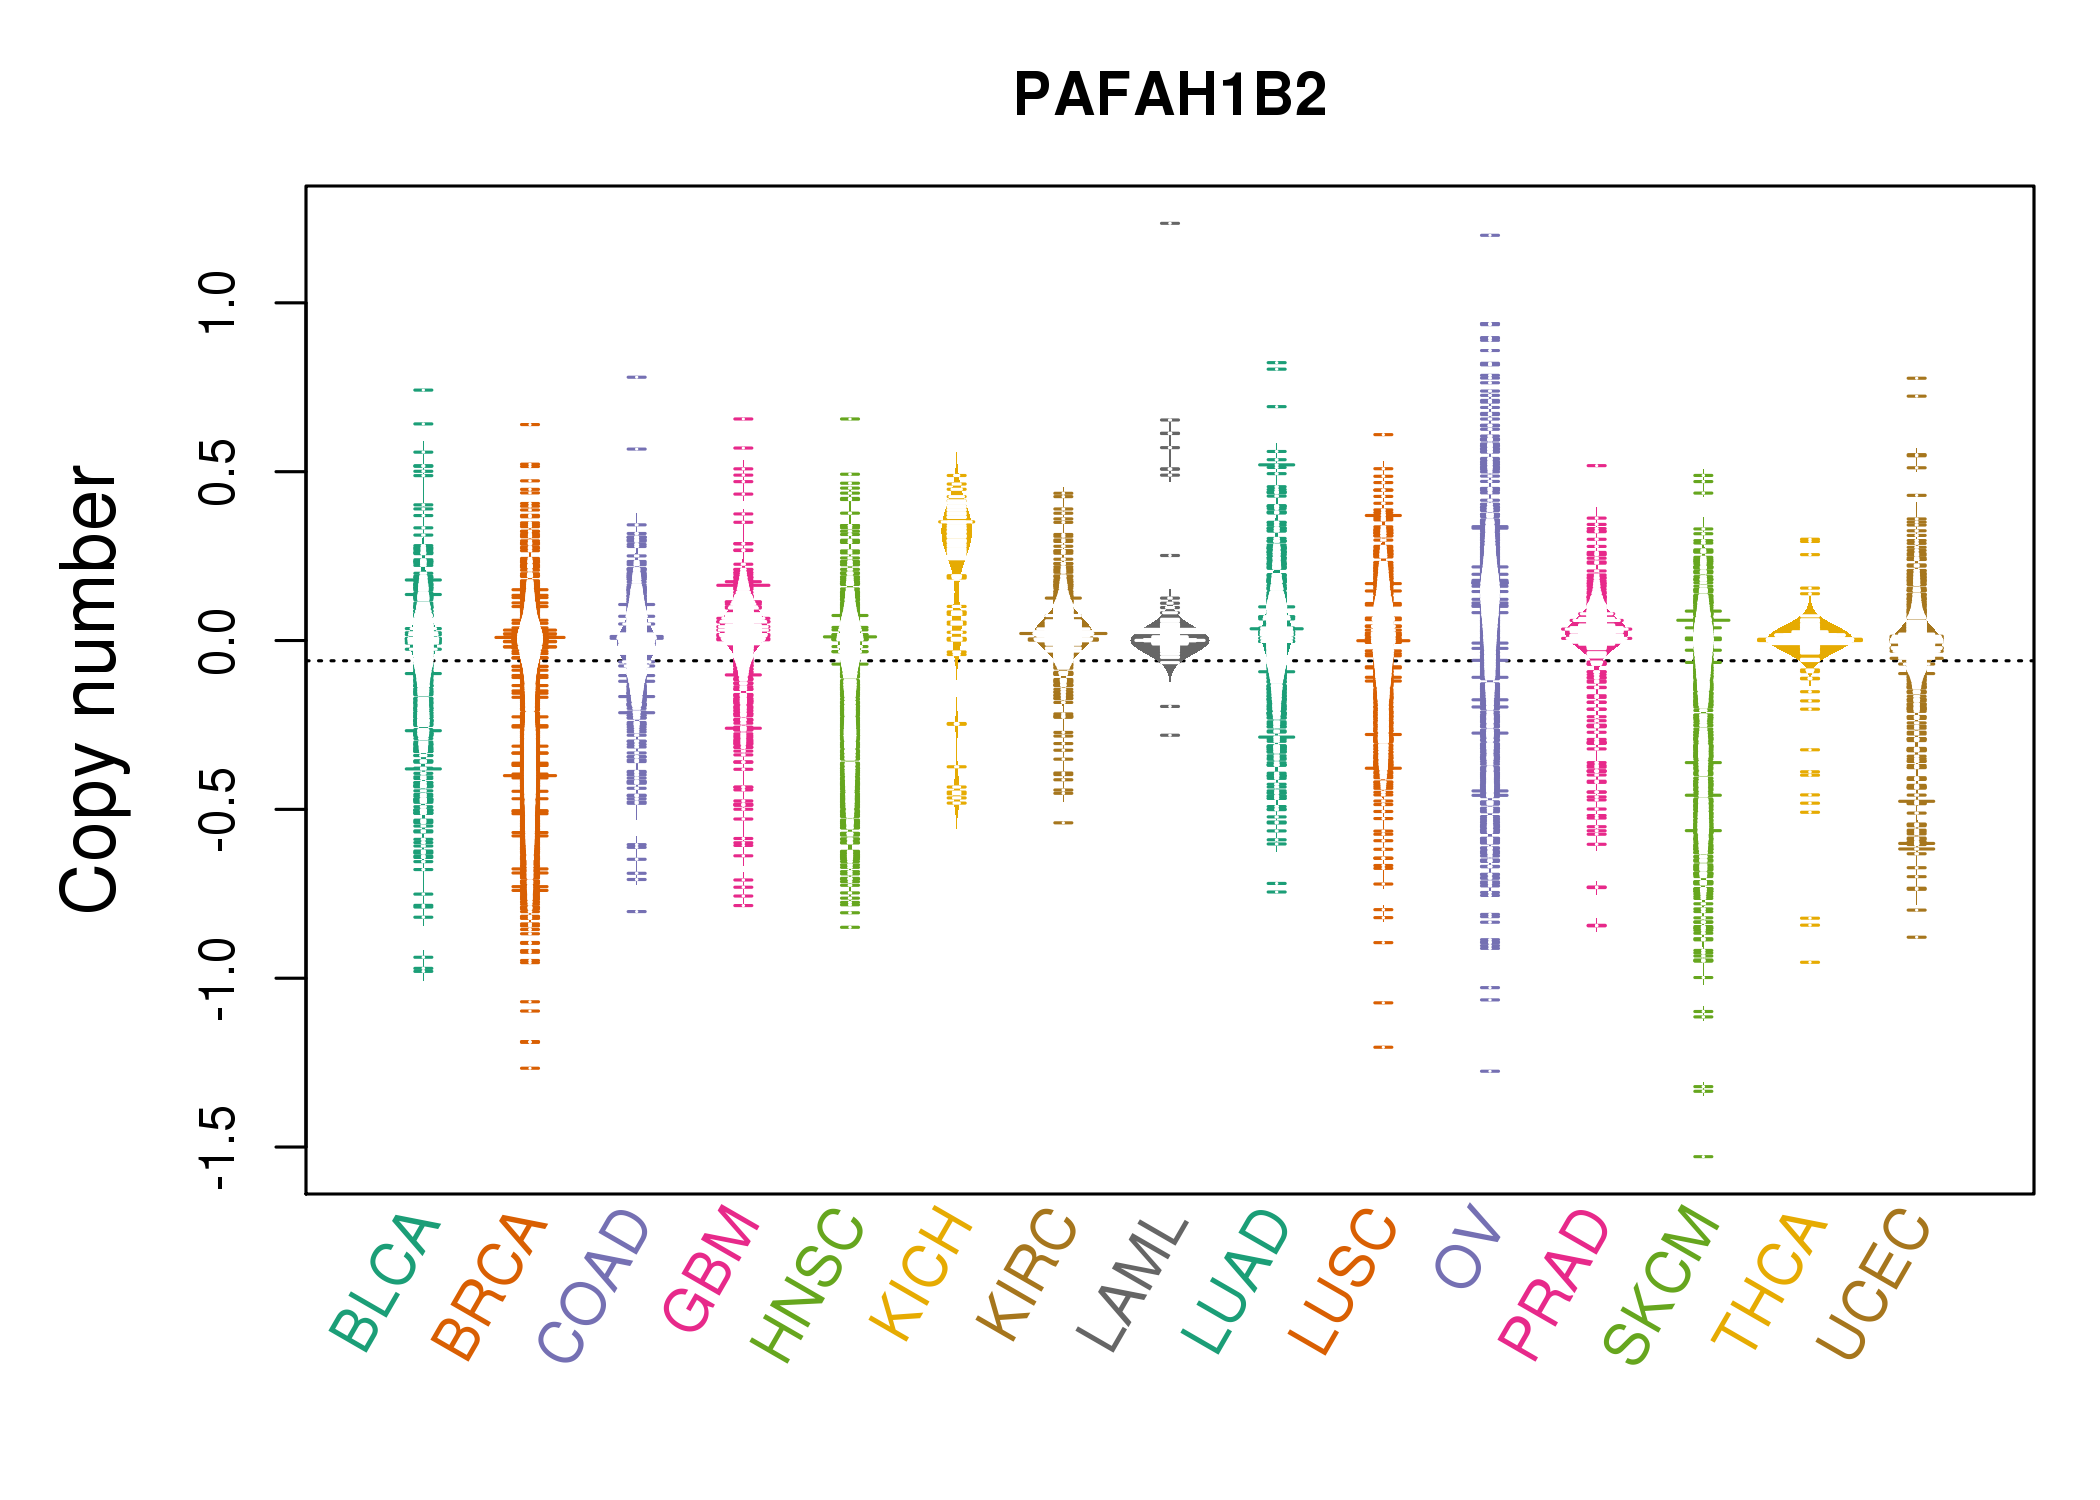 |
| cf) Tissue ID[Tissue type]: BLCA[Bladder Urothelial Carcinoma], BRCA[Breast invasive carcinoma], CESC[Cervical squamous cell carcinoma and endocervical adenocarcinoma], COAD[Colon adenocarcinoma], GBM[Glioblastoma multiforme], Glioma Low Grade, HNSC[Head and Neck squamous cell carcinoma], KICH[Kidney Chromophobe], KIRC[Kidney renal clear cell carcinoma], KIRP[Kidney renal papillary cell carcinoma], LAML[Acute Myeloid Leukemia], LUAD[Lung adenocarcinoma], LUSC[Lung squamous cell carcinoma], OV[Ovarian serous cystadenocarcinoma ], PAAD[Pancreatic adenocarcinoma], PRAD[Prostate adenocarcinoma], SKCM[Skin Cutaneous Melanoma], STAD[Stomach adenocarcinoma], THCA[Thyroid carcinoma], UCEC[Uterine Corpus Endometrial Carcinoma] |
| Top |
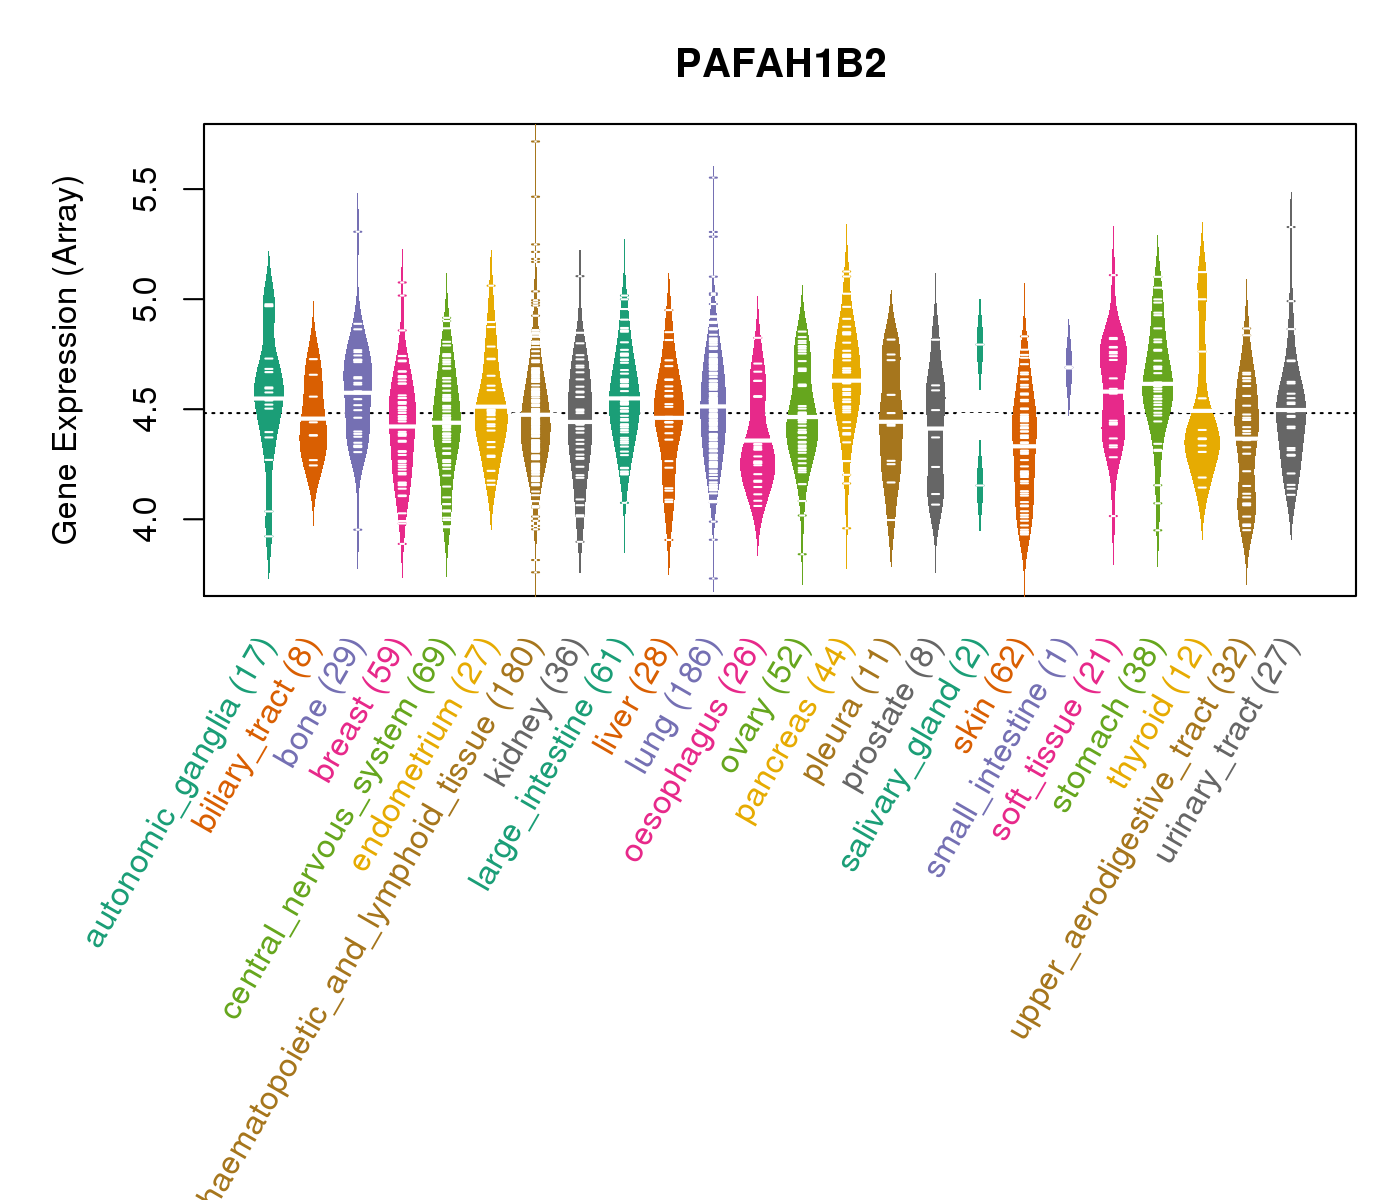
| Gene Expression for PAFAH1B2 |
| * CCLE gene expression data were extracted from CCLE_Expression_Entrez_2012-10-18.res: Gene-centric RMA-normalized mRNA expression data. |
 |
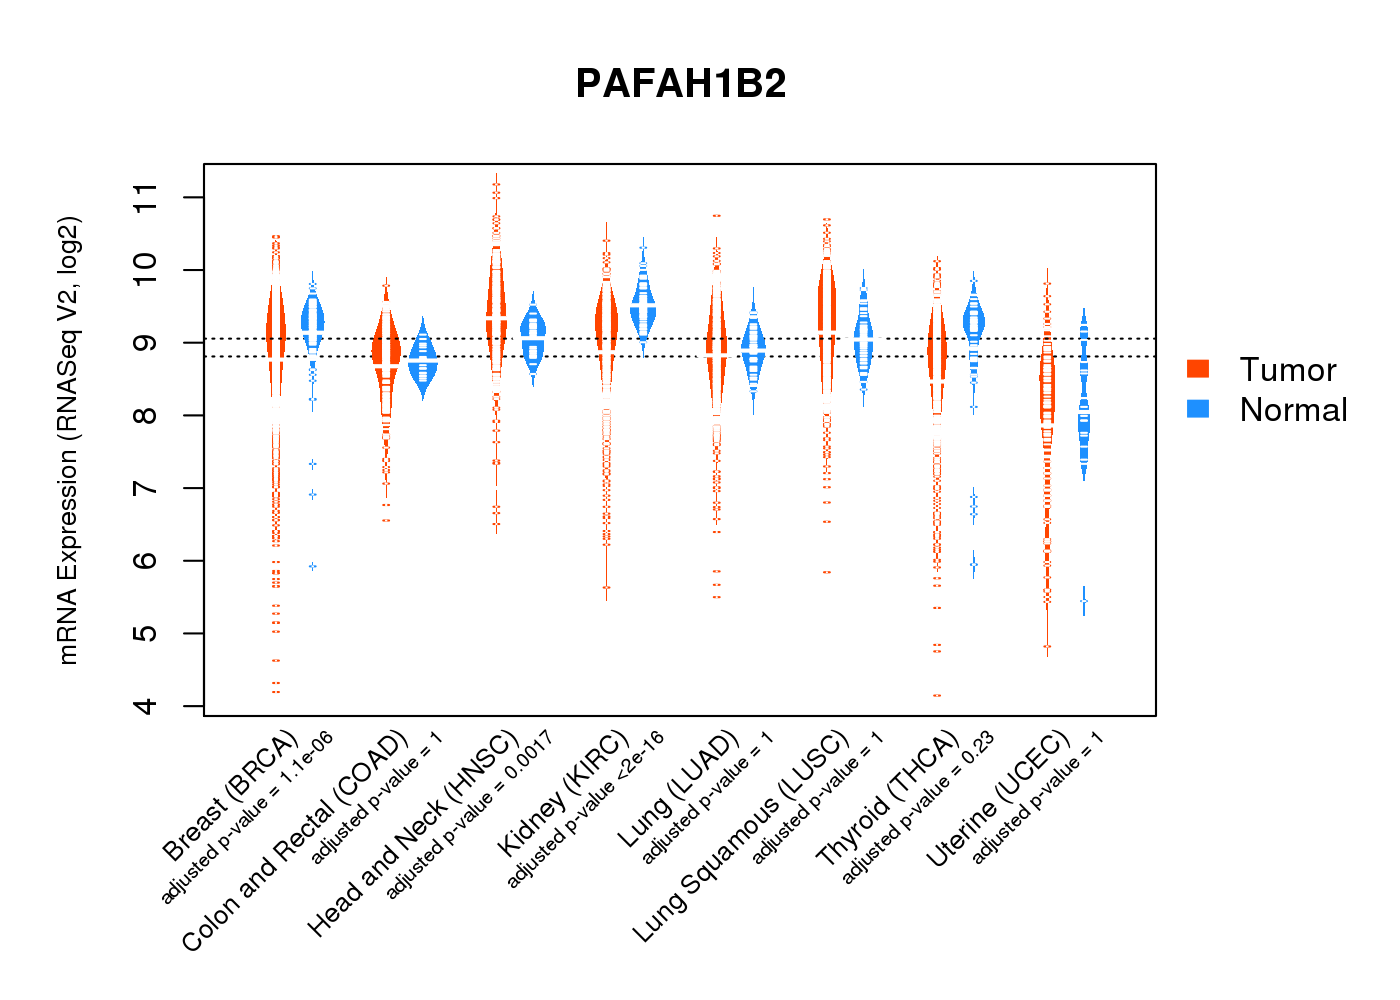
| * Normalized gene expression data of RNASeqV2 was extracted from TCGA using R package TCGA-Assembler. The URLs of all public data files on TCGA DCC data server were gathered at Jan-05-2015. Only eight cancer types have enough normal control samples for differential expression analysis. (t test, adjusted p<0.05 (using Benjamini-Hochberg FDR)) |
 |
| Top |
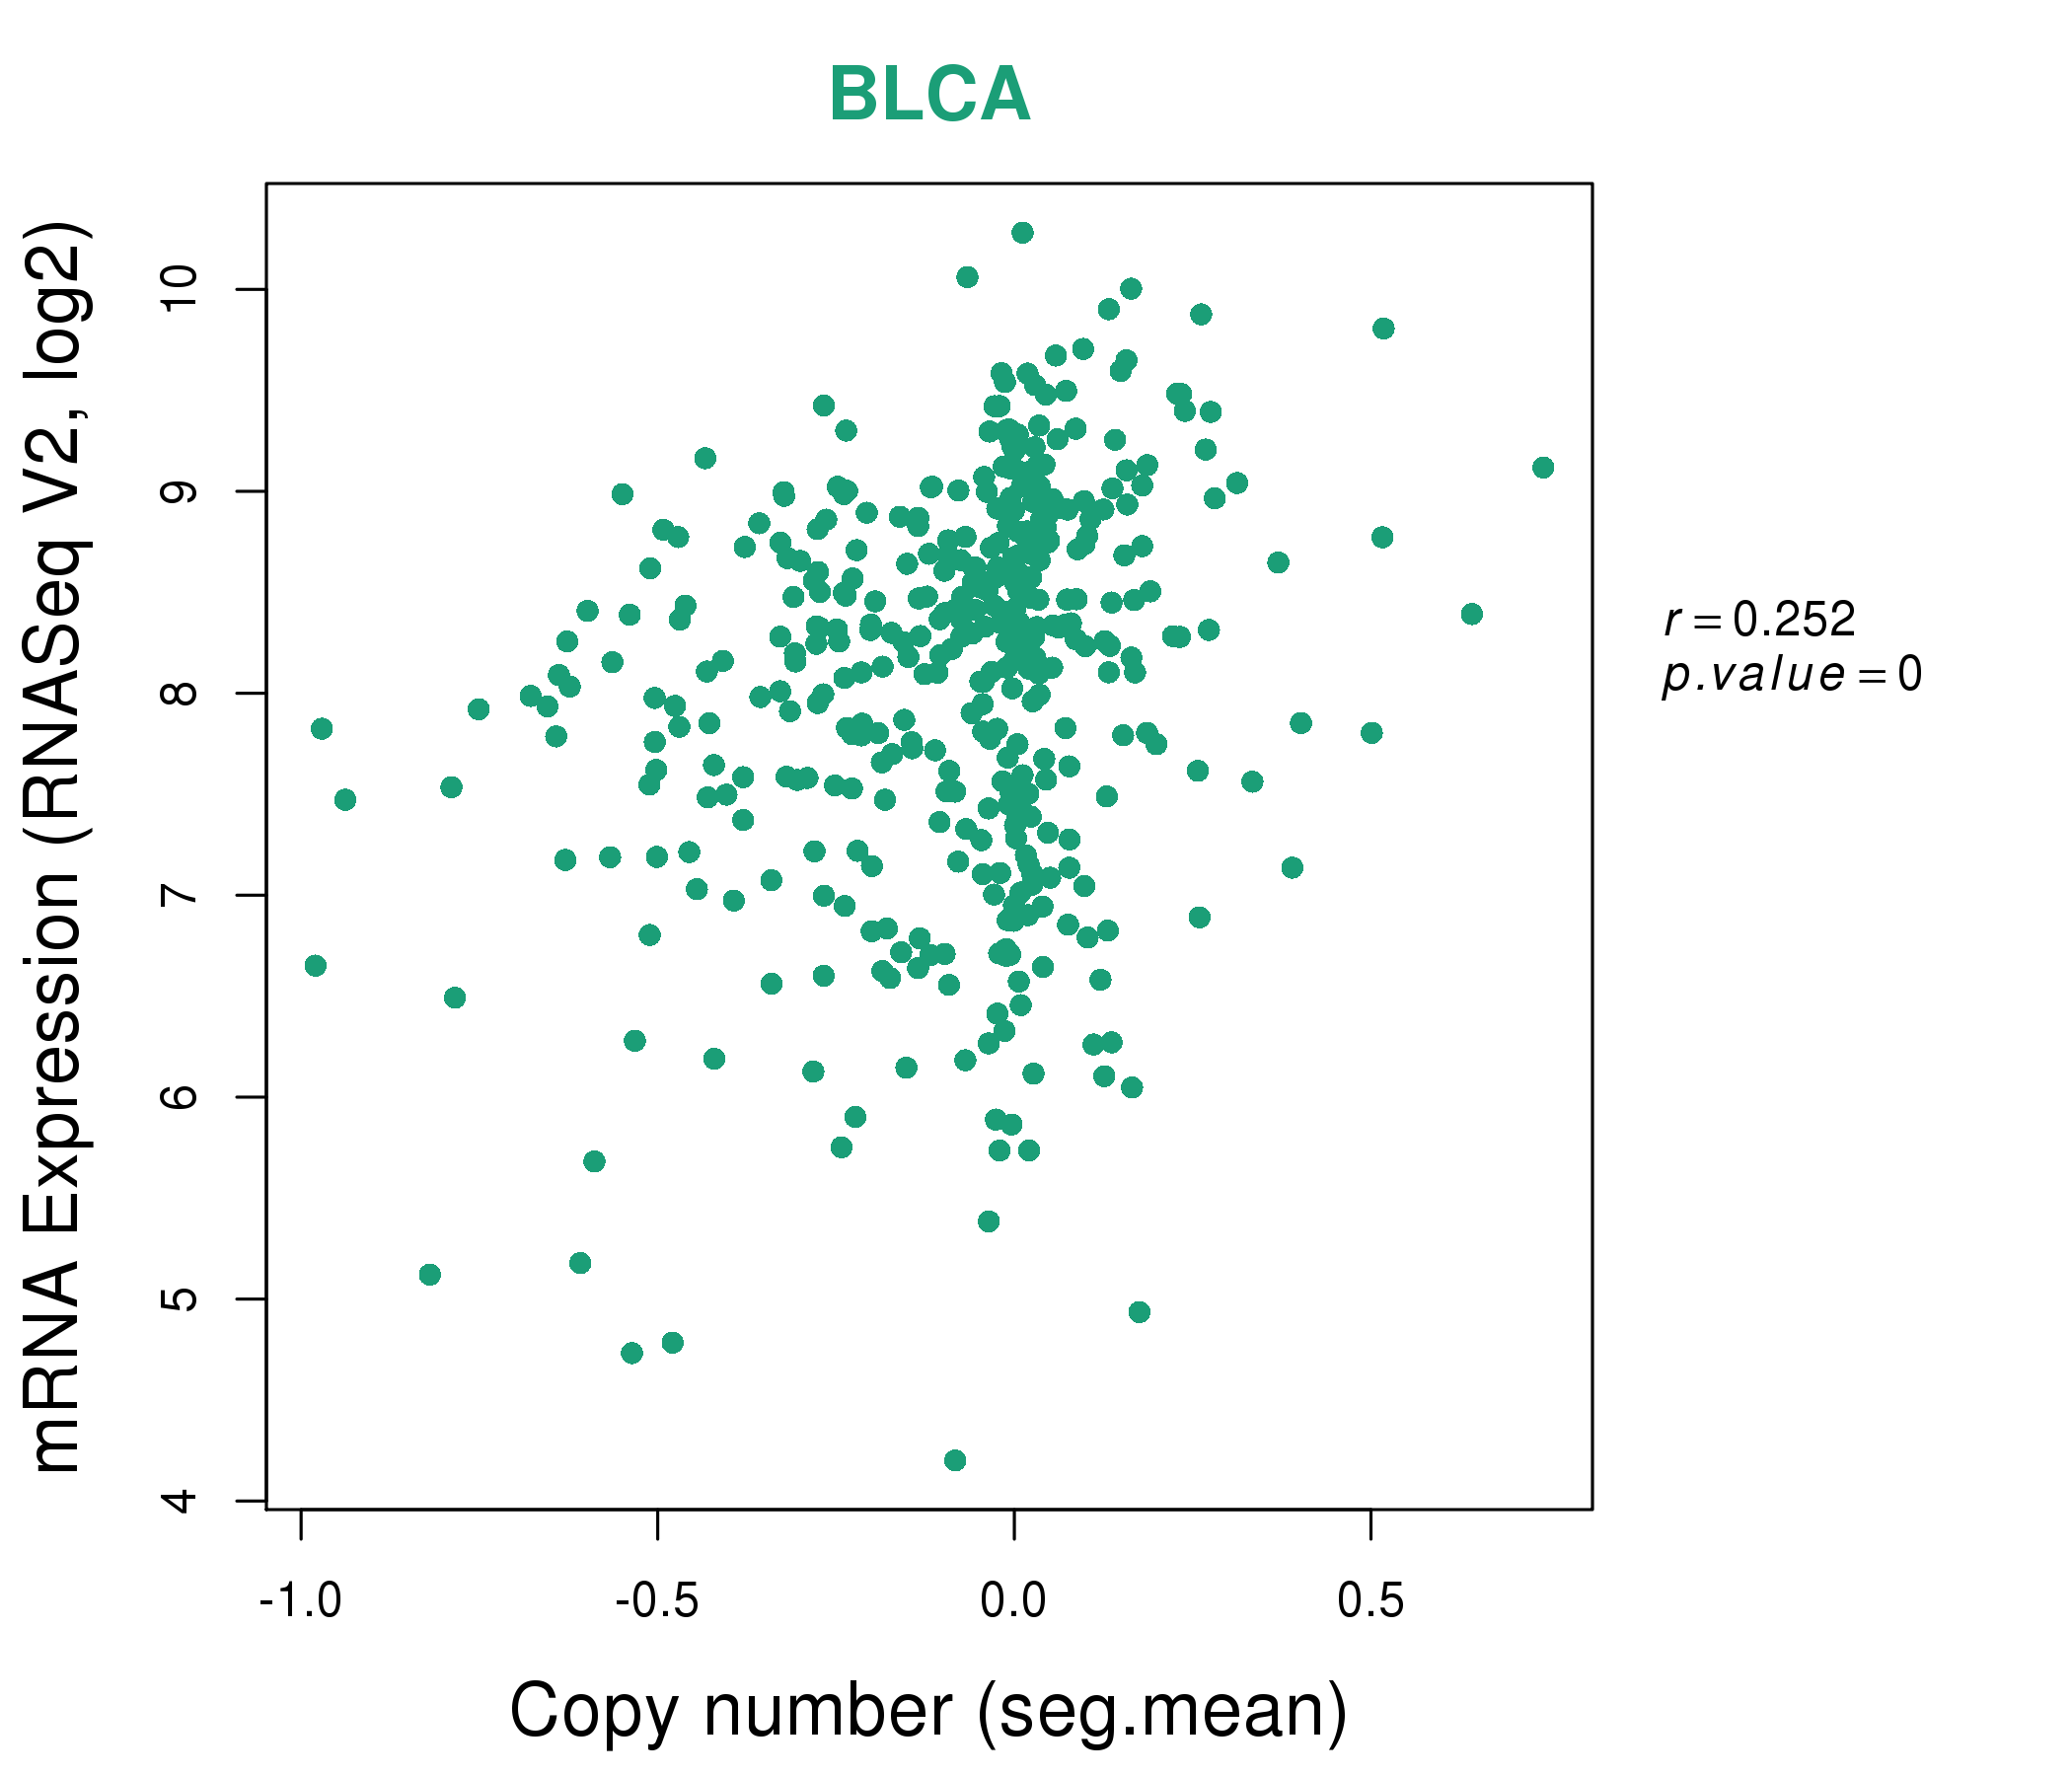
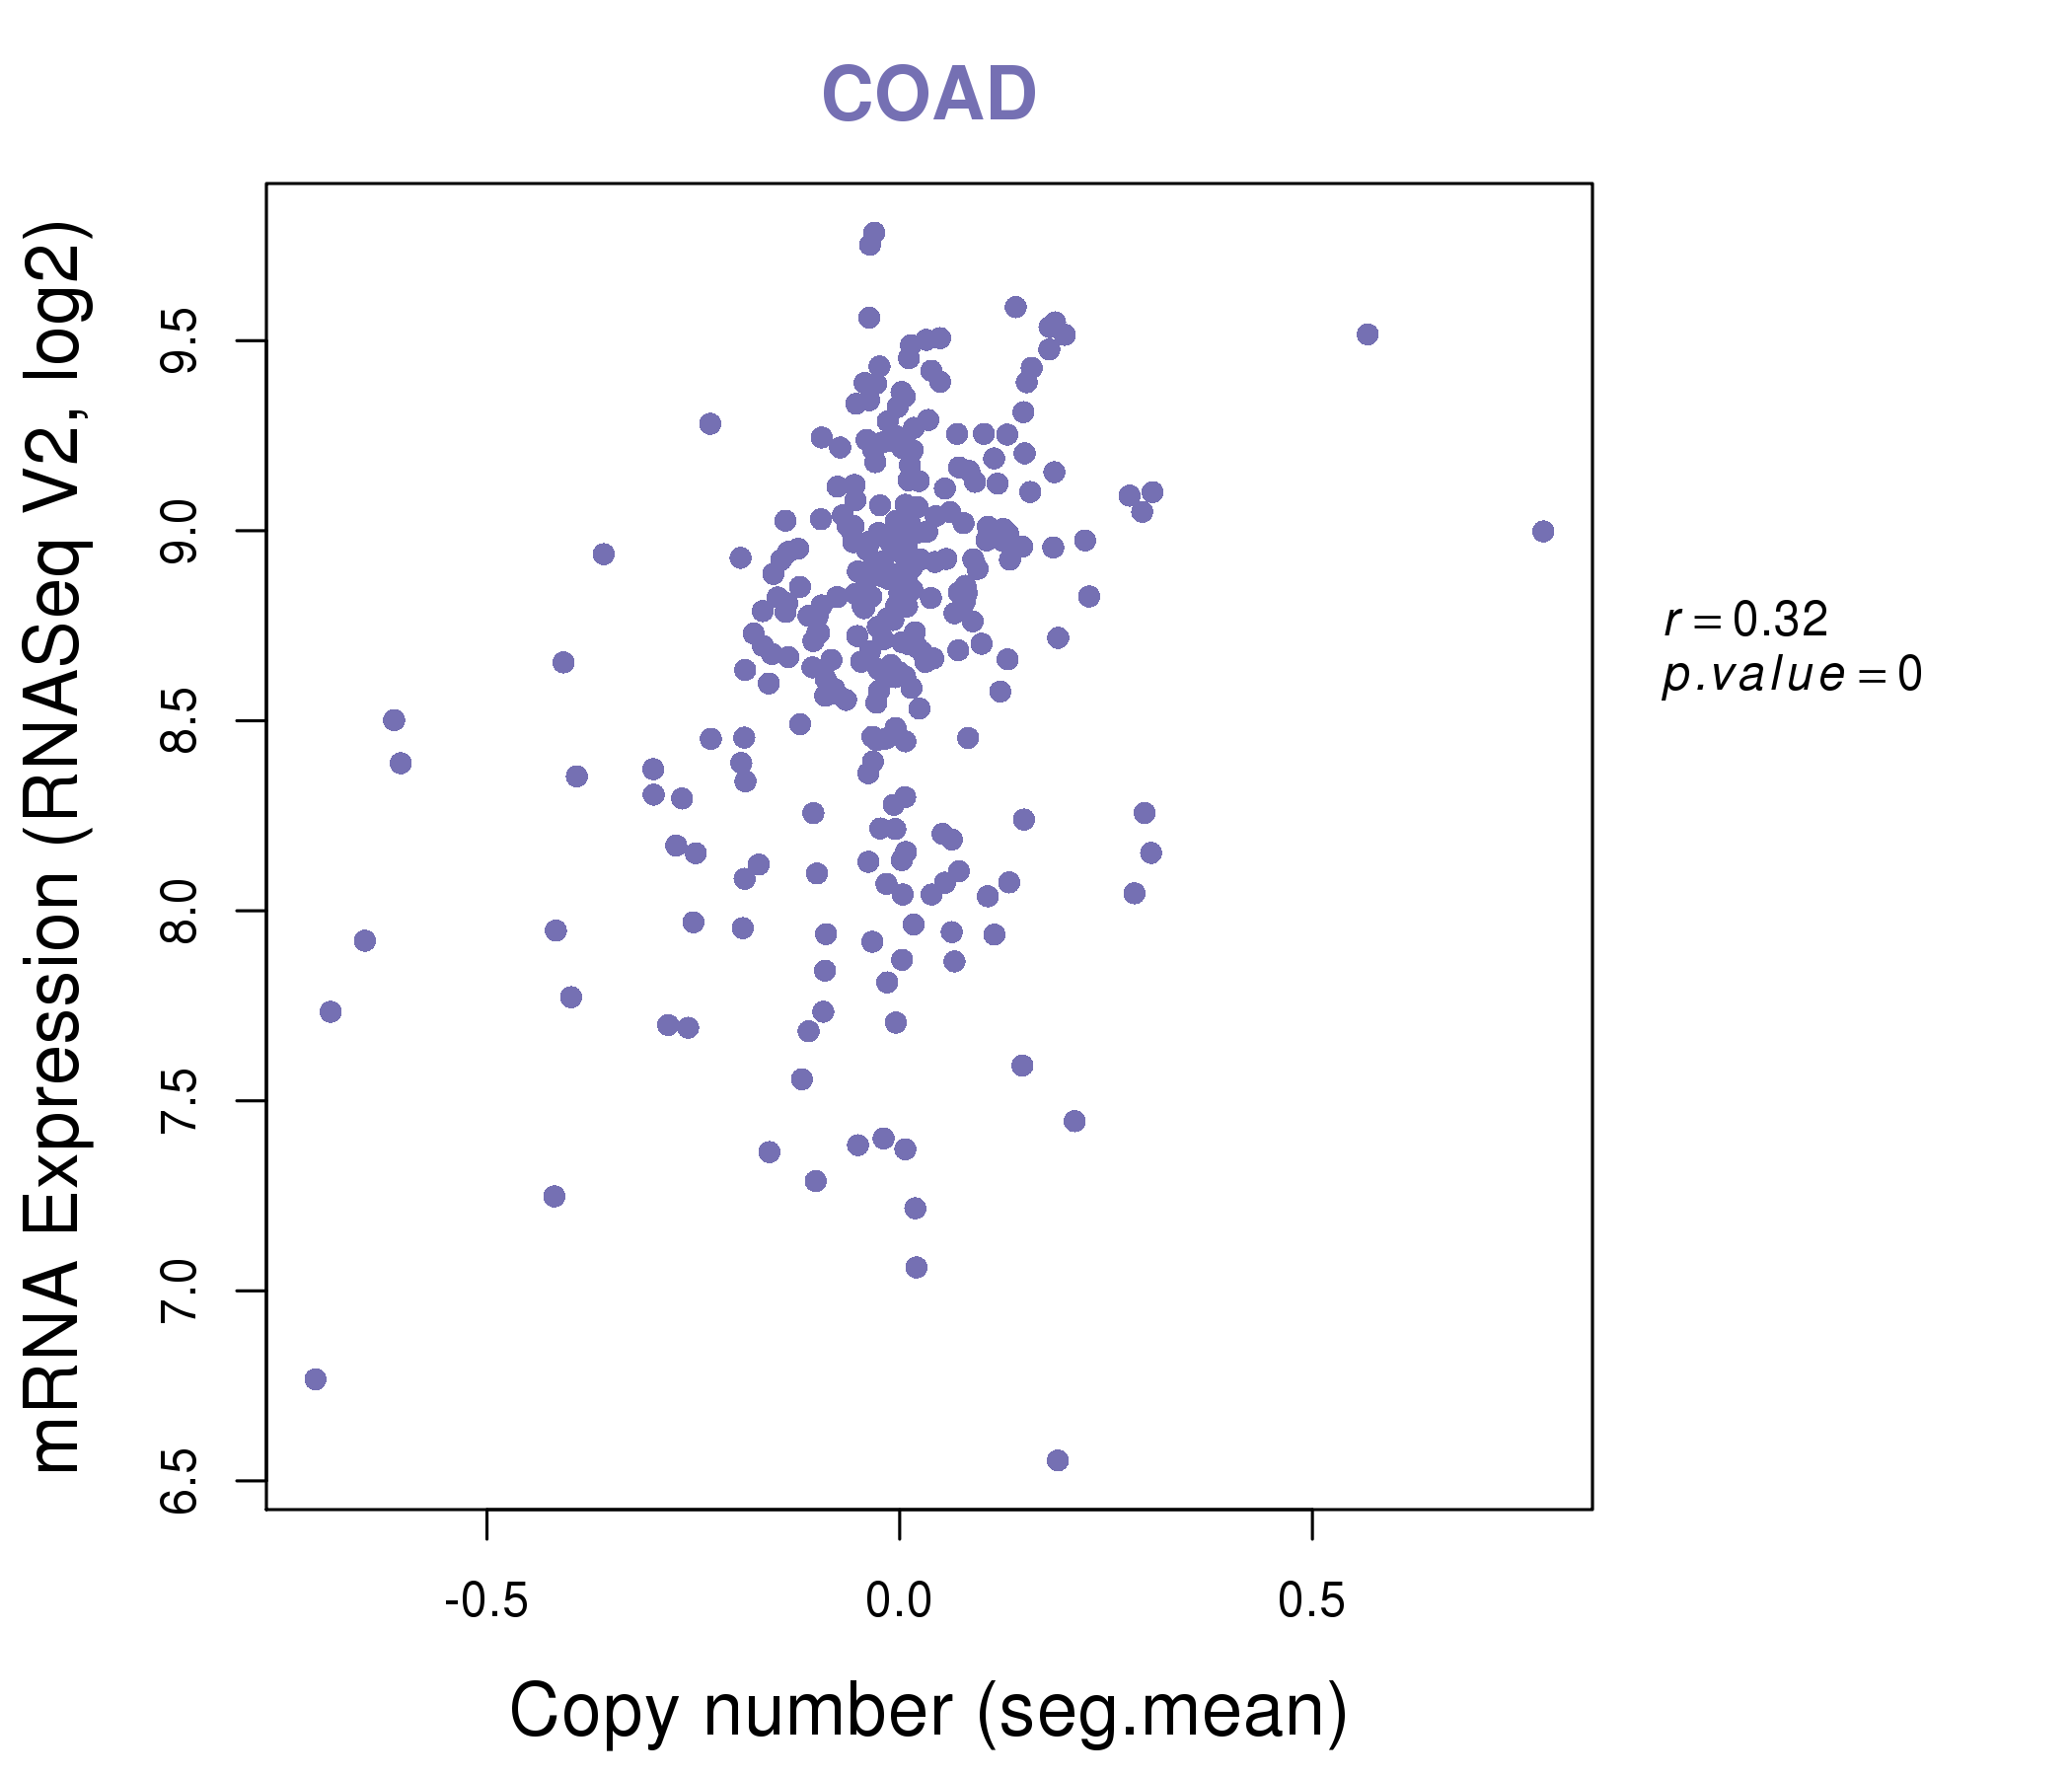
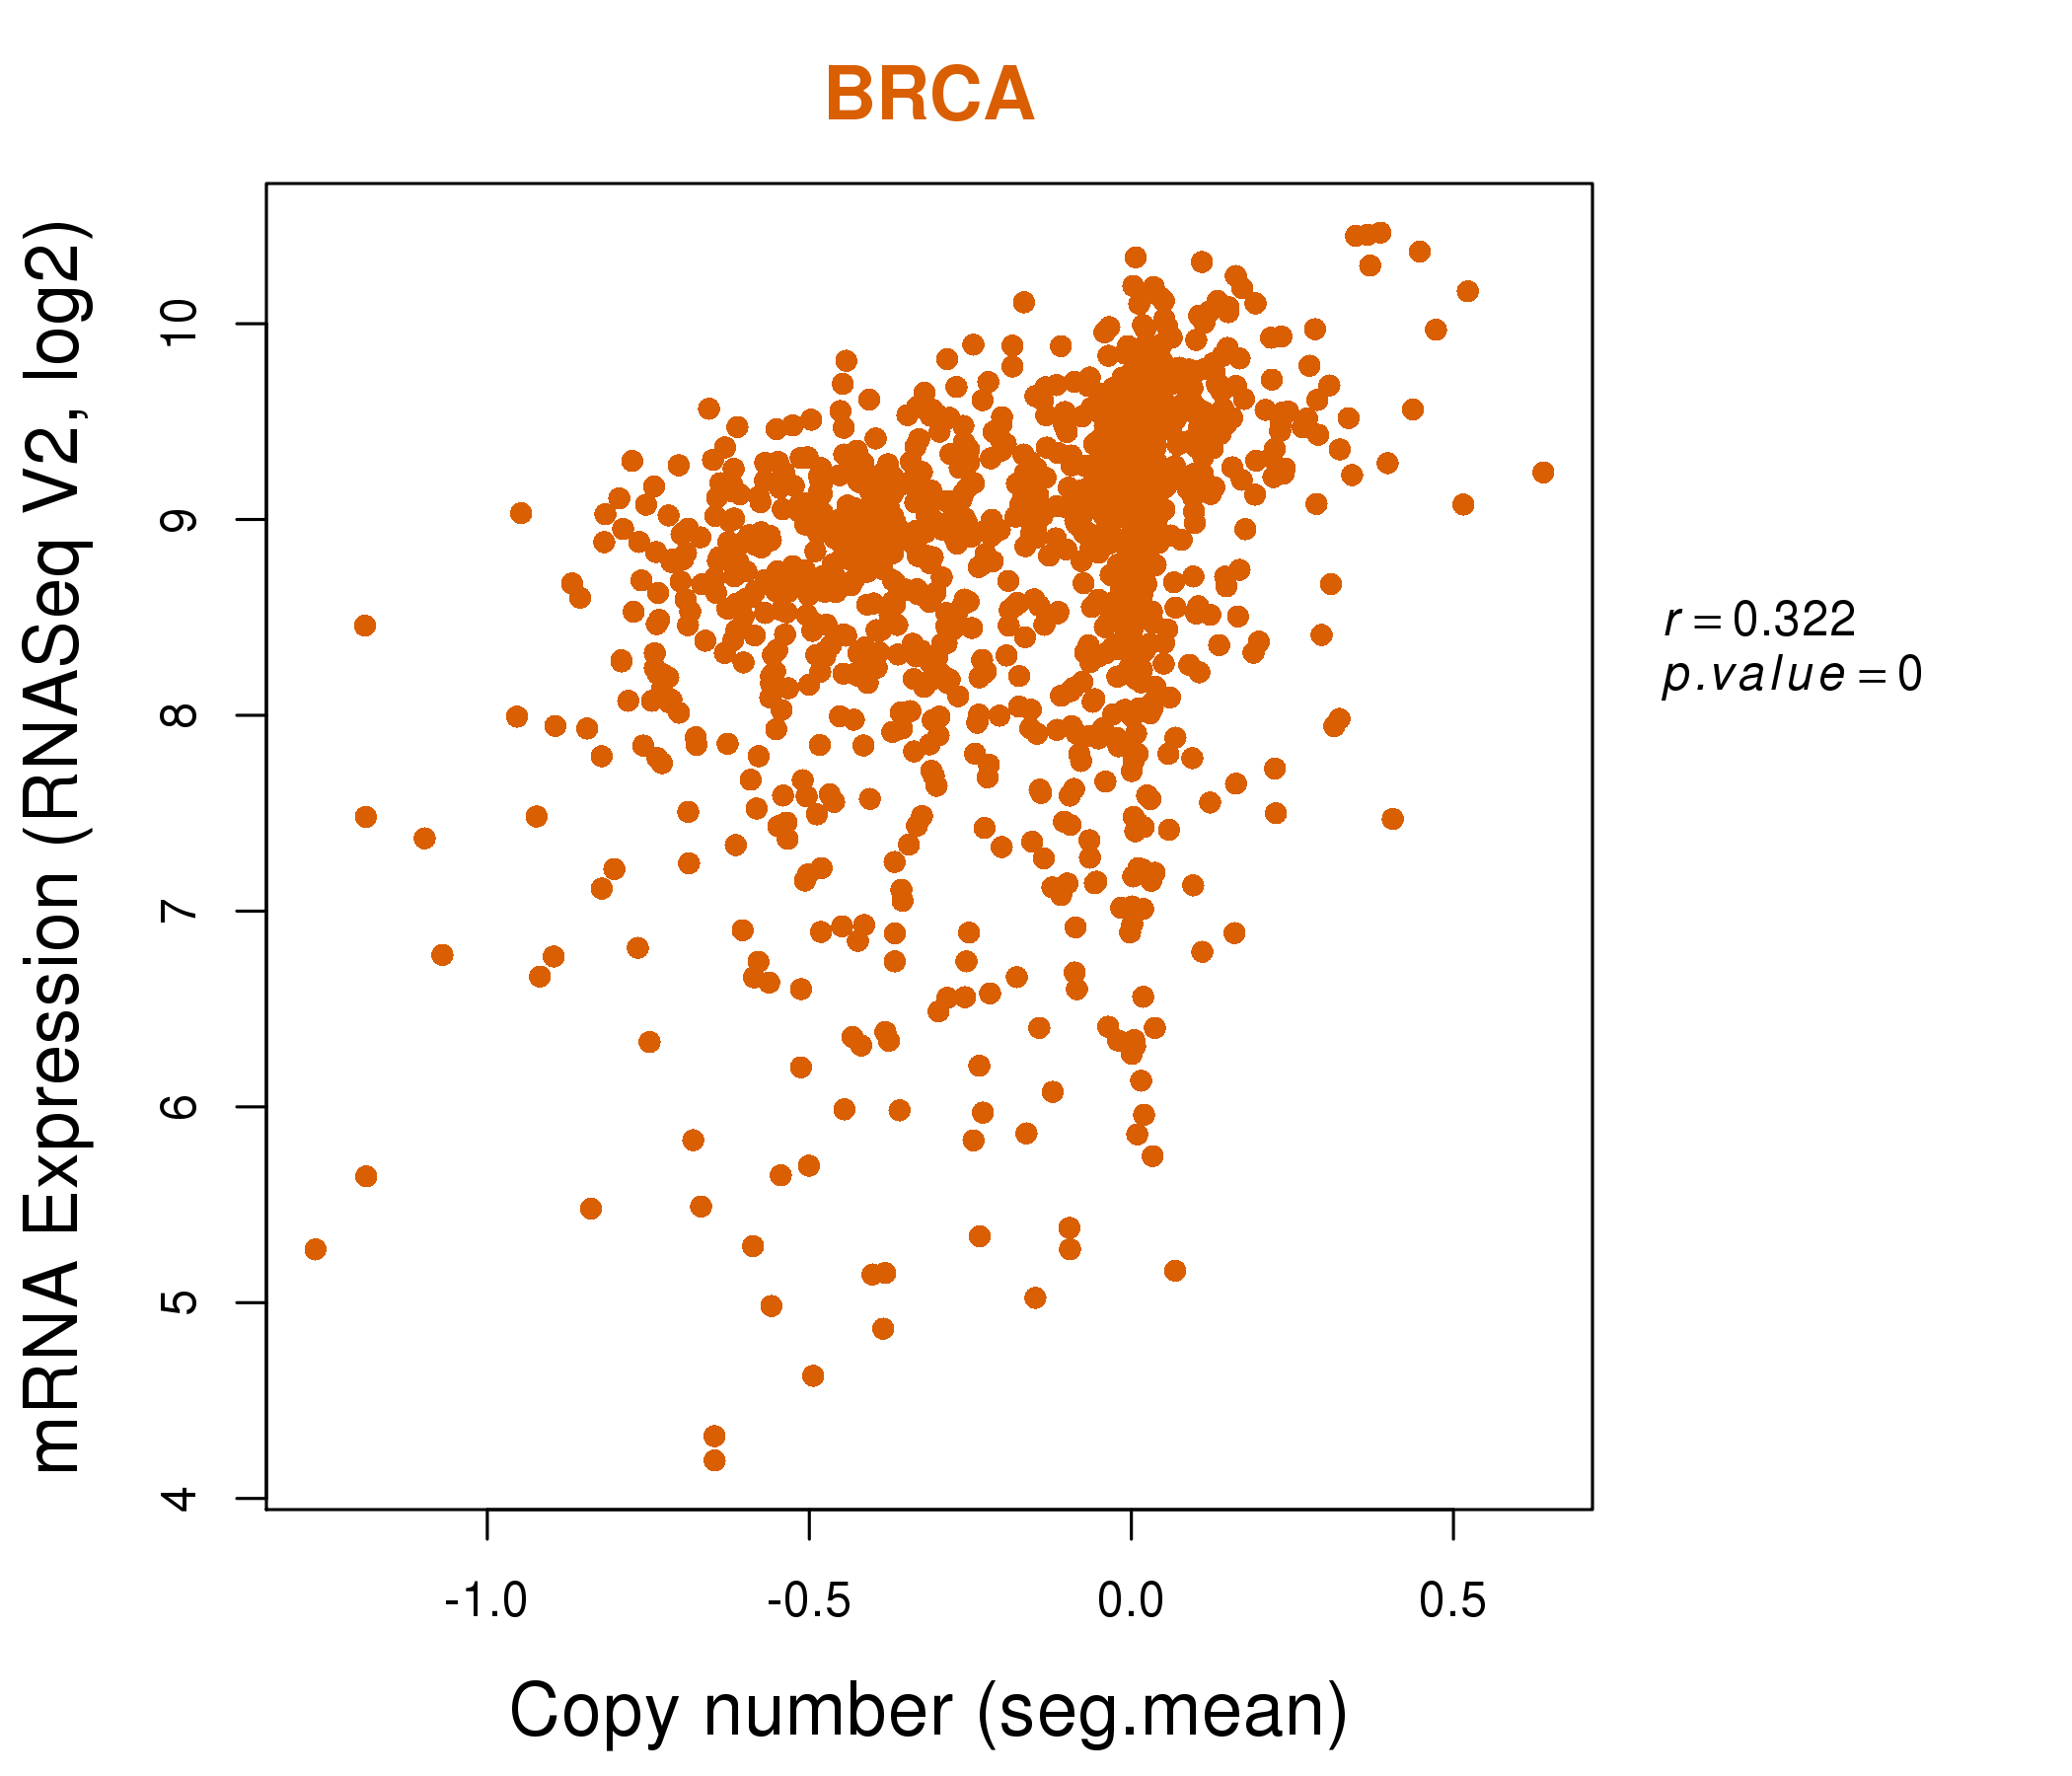
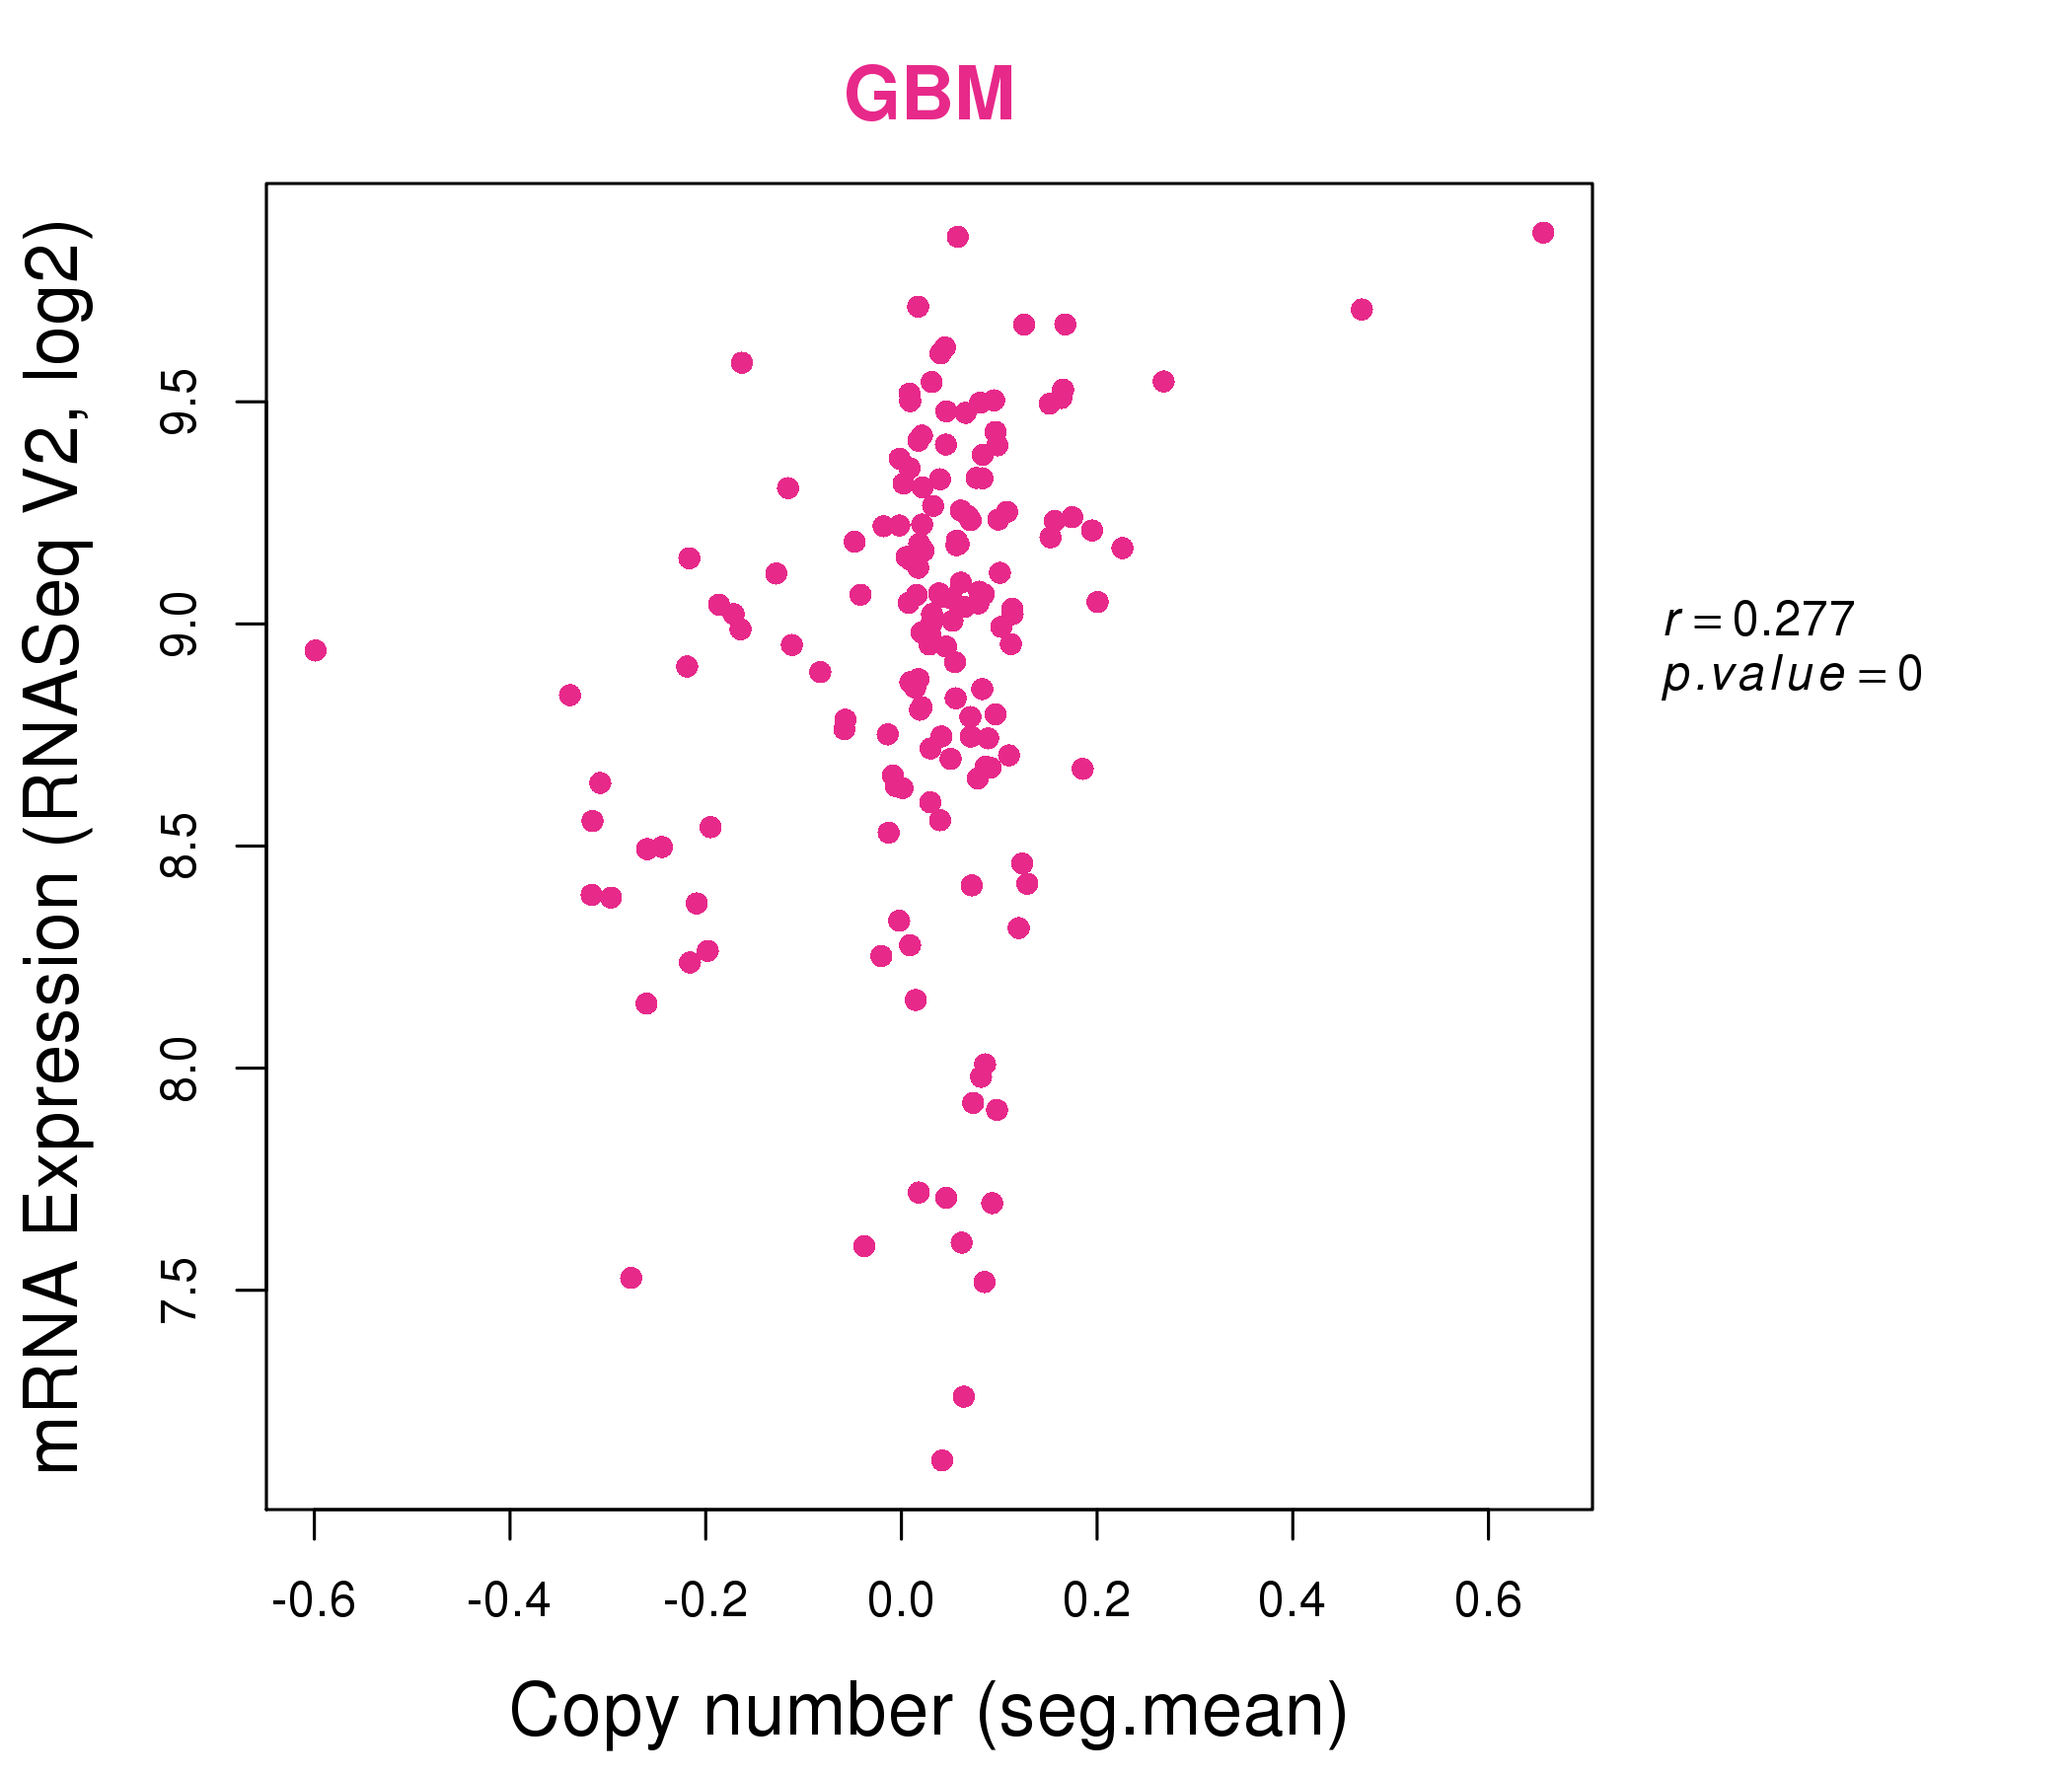
| * This plots show the correlation between CNV and gene expression. |
: Open all plots for all cancer types
 |
|
 |
|
| Top |
| Gene-Gene Network Information |
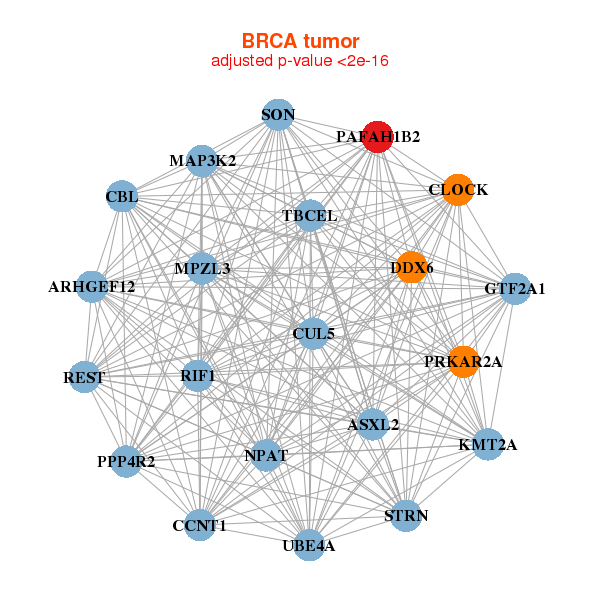
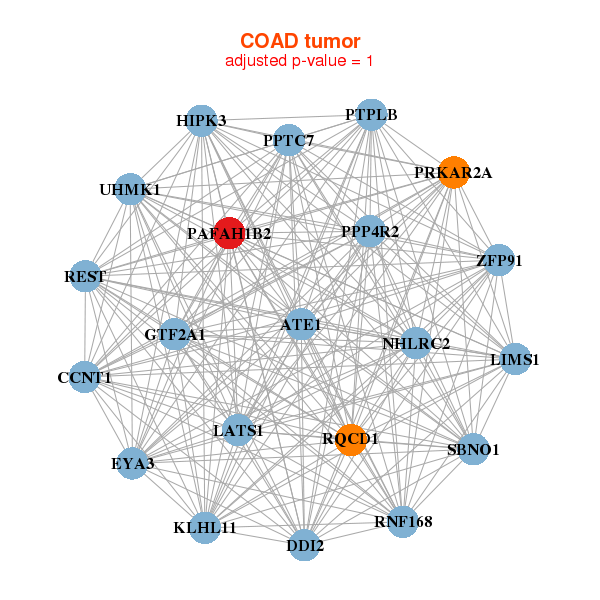
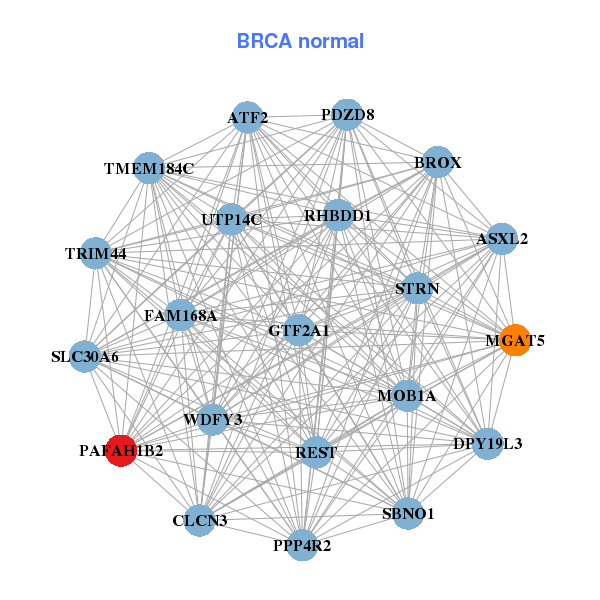
| * Co-Expression network figures were drawn using R package igraph. Only the top 20 genes with the highest correlations were shown. Red circle: input gene, orange circle: cell metabolism gene, sky circle: other gene |
: Open all plots for all cancer types
 |
|
| ARHGEF12,ASXL2,CBL,CCNT1,CLOCK,CUL5,DDX6, GTF2A1,MAP3K2,KMT2A,MPZL3,NPAT,PAFAH1B2,PPP4R2, PRKAR2A,REST,RIF1,SON,STRN,TBCEL,UBE4A | ASXL2,ATF2,BROX,CLCN3,DPY19L3,FAM168A,GTF2A1, MGAT5,MOB1A,PAFAH1B2,PDZD8,PPP4R2,REST,RHBDD1, SBNO1,SLC30A6,STRN,TMEM184C,TRIM44,UTP14C,WDFY3 |
 |
|
| ATE1,CCNT1,DDI2,EYA3,GTF2A1,HIPK3,KLHL11, LATS1,LIMS1,NHLRC2,PAFAH1B2,PPP4R2,PPTC7,PRKAR2A, PTPLB,REST,RNF168,RQCD1,SBNO1,UHMK1,ZFP91 | ALG2,BAG4,C2orf43,C9orf41,CDC40,CEP76,COPB1, DCBLD1,DEPDC4,ERLIN1,CCSER1,HSDL2,LOC729082,PAFAH1B2, RSPRY1,SLC25A40,SLC30A5,SMEK2,STT3B,USP33,ZDHHC20 |
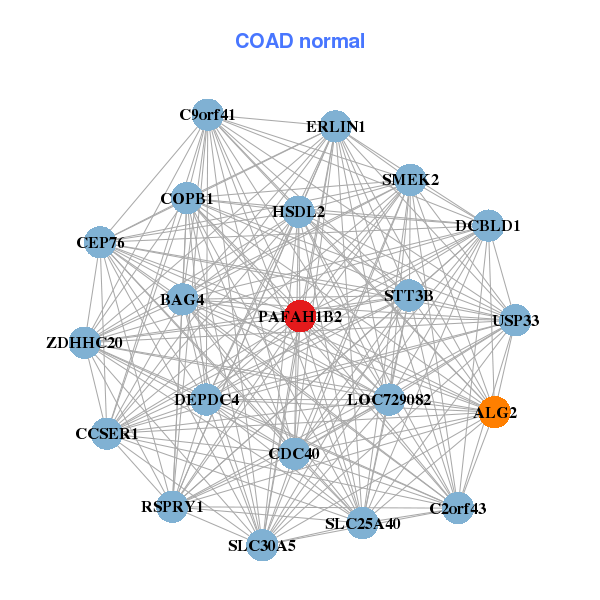
| * Co-Expression network figures were drawn using R package igraph. Only the top 20 genes with the highest correlations were shown. Red circle: input gene, orange circle: cell metabolism gene, sky circle: other gene |
: Open all plots for all cancer types
| Top |
: Open all interacting genes' information including KEGG pathway for all interacting genes from DAVID
| Top |
| Pharmacological Information for PAFAH1B2 |
| There's no related Drug. |
| Top |
| Cross referenced IDs for PAFAH1B2 |
| * We obtained these cross-references from Uniprot database. It covers 150 different DBs, 18 categories. http://www.uniprot.org/help/cross_references_section |
: Open all cross reference information
|
Copyright © 2016-Present - The Univsersity of Texas Health Science Center at Houston @ |