|
|||||||||||||||||||||||||||||||||||||||||||||||||||||||||||||||||||||||||||||||||||||||||||||||||||||||||||||||||||||||||||||||||||||||||||||||||||||||||||||||||||||||||||||||||||||||||||||||||||||||||||||||||||||||||||||||||||||||||||||||||||||||||||||||||||||||||||||||||||||||||||||||||||||||||||||||||||||||||||||||||||||||||||||||||||||||||||||||||||||
| |
| Phenotypic Information (metabolism pathway, cancer, disease, phenome) |
| |
| |
| Gene-Gene Network Information: Co-Expression Network, Interacting Genes & KEGG |
| |
|


| Gene Summary for ATP5B |
| Basic gene info. | Gene symbol | ATP5B |
| Gene name | ATP synthase, H+ transporting, mitochondrial F1 complex, beta polypeptide | |
| Synonyms | ATPMB|ATPSB|HEL-S-271 | |
| Cytomap | UCSC genome browser: 12q13.13 | |
| Genomic location | chr12 :57031958-57039852 | |
| Type of gene | protein-coding | |
| RefGenes | NM_001686.3, | |
| Ensembl id | ENSG00000110955 | |
| Description | ATP synthase subunit beta, mitochondrialepididymis secretory protein Li 271mitochondrial ATP synthase beta subunitmitochondrial ATP synthetase, beta subunit | |
| Modification date | 20141207 | |
| dbXrefs | MIM : 102910 | |
| HGNC : HGNC | ||
| Ensembl : ENSG00000110955 | ||
| HPRD : 00044 | ||
| Protein | UniProt: go to UniProt's Cross Reference DB Table | |
| Expression | CleanEX: HS_ATP5B | |
| BioGPS: 506 | ||
| Gene Expression Atlas: ENSG00000110955 | ||
| The Human Protein Atlas: ENSG00000110955 | ||
| Pathway | NCI Pathway Interaction Database: ATP5B | |
| KEGG: ATP5B | ||
| REACTOME: ATP5B | ||
| ConsensusPathDB | ||
| Pathway Commons: ATP5B | ||
| Metabolism | MetaCyc: ATP5B | |
| HUMANCyc: ATP5B | ||
| Regulation | Ensembl's Regulation: ENSG00000110955 | |
| miRBase: chr12 :57,031,958-57,039,852 | ||
| TargetScan: NM_001686 | ||
| cisRED: ENSG00000110955 | ||
| Context | iHOP: ATP5B | |
| cancer metabolism search in PubMed: ATP5B | ||
| UCL Cancer Institute: ATP5B | ||
| Assigned class in ccmGDB | C | |
| Top |
| Phenotypic Information for ATP5B(metabolism pathway, cancer, disease, phenome) |
| Cancer | CGAP: ATP5B |
| Familial Cancer Database: ATP5B | |
| * This gene is included in those cancer gene databases. |
|
|
|
|
|
| . | |||||||||||||||||||||||||||||||||||||||||||||||||||||||||||||||||||||||||||||||||||||||||||||||||||||||||||||||||||||||||||||||||||||||||||||||||||||||||||||||||||||||||||||||||||||||||||||||||||||||||||||||||||||||||||||||||||||||||||||||||||||||||||||||||||||||||||||||||||||||||||||||||||||||||||||||||||||||||||||||||||||||||||||||||||||||||||||||
Oncogene 1 | Significant driver gene in | ||||||||||||||||||||||||||||||||||||||||||||||||||||||||||||||||||||||||||||||||||||||||||||||||||||||||||||||||||||||||||||||||||||||||||||||||||||||||||||||||||||||||||||||||||||||||||||||||||||||||||||||||||||||||||||||||||||||||||||||||||||||||||||||||||||||||||||||||||||||||||||||||||||||||||||||||||||||||||||||||||||||||||||||||||||||||||||||||||||
| cf) number; DB name 1 Oncogene; http://nar.oxfordjournals.org/content/35/suppl_1/D721.long, 2 Tumor Suppressor gene; https://bioinfo.uth.edu/TSGene/, 3 Cancer Gene Census; http://www.nature.com/nrc/journal/v4/n3/abs/nrc1299.html, 4 CancerGenes; http://nar.oxfordjournals.org/content/35/suppl_1/D721.long, 5 Network of Cancer Gene; http://ncg.kcl.ac.uk/index.php, 1Therapeutic Vulnerabilities in Cancer; http://cbio.mskcc.org/cancergenomics/statius/ |
| REACTOME_METABOLISM_OF_PROTEINS | |
| OMIM | |
| Orphanet | |
| Disease | KEGG Disease: ATP5B |
| MedGen: ATP5B (Human Medical Genetics with Condition) | |
| ClinVar: ATP5B | |
| Phenotype | MGI: ATP5B (International Mouse Phenotyping Consortium) |
| PhenomicDB: ATP5B | |
| Mutations for ATP5B |
| * Under tables are showing count per each tissue to give us broad intuition about tissue specific mutation patterns.You can go to the detailed page for each mutation database's web site. |
| There's no structural variation information in COSMIC data for this gene. |
| * From mRNA Sanger sequences, Chitars2.0 arranged chimeric transcripts. This table shows ATP5B related fusion information. |
| ID | Head Gene | Tail Gene | Accession | Gene_a | qStart_a | qEnd_a | Chromosome_a | tStart_a | tEnd_a | Gene_a | qStart_a | qEnd_a | Chromosome_a | tStart_a | tEnd_a |
| CA312538 | ATP5B | 18 | 86 | 12 | 57031962 | 57032030 | ATP5B | 83 | 135 | 12 | 57032029 | 57032081 | |
| AW852155 | ATP5B | 2 | 185 | 12 | 57033603 | 57033790 | PTGES3 | 184 | 264 | 12 | 57076115 | 57076316 | |
| AW375766 | HADH | 8 | 290 | 4 | 108955685 | 108955967 | ATP5B | 285 | 399 | 12 | 57031962 | 57032076 | |
| BE676351 | ATP5B | 14 | 124 | 12 | 57031962 | 57032072 | MSI2 | 111 | 443 | 17 | 55723353 | 55723686 | |
| BF819282 | ATP5B | 7 | 105 | 12 | 57036599 | 57037268 | CLU | 102 | 271 | 8 | 27462542 | 27462711 | |
| AA128804 | UBE2T | 1 | 56 | 1 | 202304725 | 202304780 | ATP5B | 48 | 107 | 12 | 57031962 | 57032021 | |
| CV344647 | ATP5B | 32 | 425 | 12 | 57037273 | 57038740 | PTMA | 421 | 527 | 2 | 232573311 | 232573417 | |
| BG258137 | ATP5B | 29 | 305 | 12 | 57036523 | 57037370 | ATP5B | 297 | 402 | 12 | 57031959 | 57032064 | |
| AK127078 | FMN1 | 1 | 3310 | 15 | 33065737 | 33359029 | ATP5B | 3305 | 3812 | 12 | 57031962 | 57033823 | |
| BG179093 | ATP5B | 14 | 122 | 12 | 57033033 | 57033812 | ATP5B | 118 | 539 | 12 | 57031962 | 57033065 | |
| Top |
| Mutation type/ Tissue ID | brca | cns | cerv | endome | haematopo | kidn | Lintest | liver | lung | ns | ovary | pancre | prost | skin | stoma | thyro | urina | |||
| Total # sample | 1 | |||||||||||||||||||
| GAIN (# sample) | 1 | |||||||||||||||||||
| LOSS (# sample) |
| cf) Tissue ID; Tissue type (1; Breast, 2; Central_nervous_system, 3; Cervix, 4; Endometrium, 5; Haematopoietic_and_lymphoid_tissue, 6; Kidney, 7; Large_intestine, 8; Liver, 9; Lung, 10; NS, 11; Ovary, 12; Pancreas, 13; Prostate, 14; Skin, 15; Stomach, 16; Thyroid, 17; Urinary_tract) |
| Top |
|
 |
| Top |
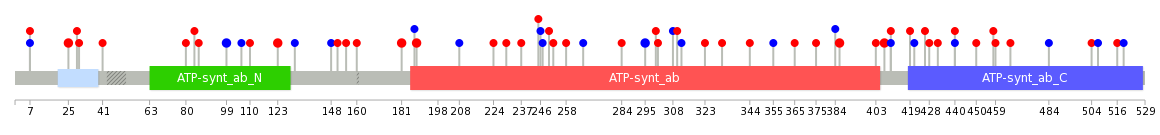
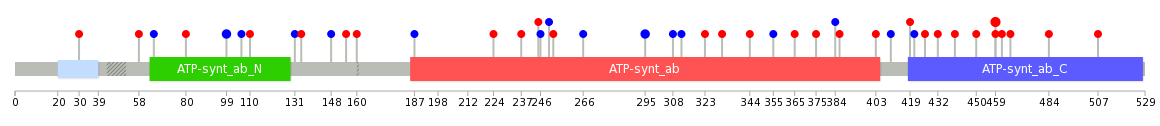
| Stat. for Non-Synonymous SNVs (# total SNVs=37) | (# total SNVs=12) |
 |  |
(# total SNVs=1) | (# total SNVs=0) |
 |
| Top |
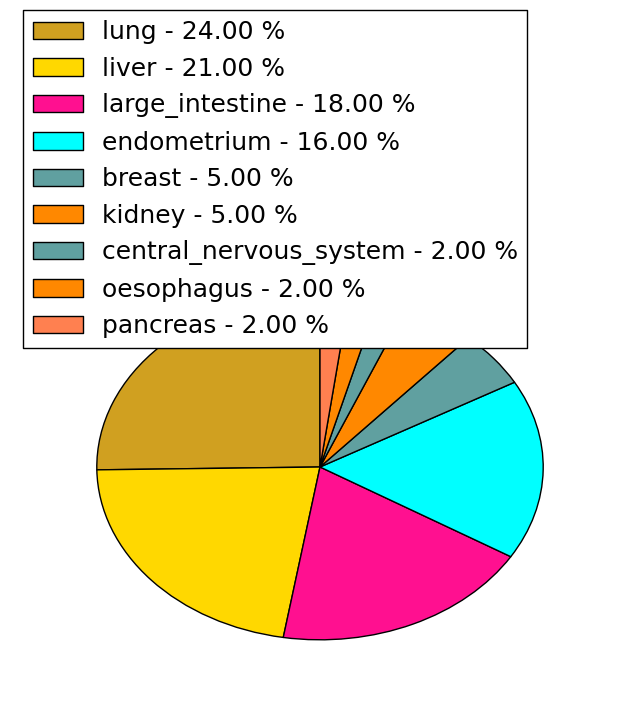
| * When you move the cursor on each content, you can see more deailed mutation information on the Tooltip. Those are primary_site,primary_histology,mutation(aa),pubmedID. |
| GRCh37 position | Mutation(aa) | Unique sampleID count |
| chr12:57039674-57039674 | p.S25L | 2 |
| chr12:57036523-57036523 | p.D295D | 2 |
| chr12:57038681-57038681 | p.Q123H | 2 |
| chr12:57037665-57037665 | p.K188R | 2 |
| chr12:57038968-57038968 | p.V99V | 2 |
| chr12:57033832-57033832 | p.I407V | 2 |
| chr12:57037687-57037687 | p.E181Q | 2 |
| chr12:57033894-57033894 | p.S386L | 2 |
| chr12:57032929-57032929 | p.L484L | 1 |
| chr12:57033788-57033788 | p.A421A | 1 |
| Top |
|
 |
| Point Mutation/ Tissue ID | 1 | 2 | 3 | 4 | 5 | 6 | 7 | 8 | 9 | 10 | 11 | 12 | 13 | 14 | 15 | 16 | 17 | 18 | 19 | 20 |
| # sample | 2 | 1 | 10 | 1 | 2 | 5 | 2 | 3 | 2 | 9 | 7 | |||||||||
| # mutation | 2 | 1 | 10 | 1 | 2 | 6 | 2 | 2 | 3 | 9 | 8 | |||||||||
| nonsynonymous SNV | 1 | 1 | 7 | 1 | 1 | 3 | 2 | 1 | 3 | 4 | 5 | |||||||||
| synonymous SNV | 1 | 3 | 1 | 3 | 1 | 5 | 3 |
| cf) Tissue ID; Tissue type (1; BLCA[Bladder Urothelial Carcinoma], 2; BRCA[Breast invasive carcinoma], 3; CESC[Cervical squamous cell carcinoma and endocervical adenocarcinoma], 4; COAD[Colon adenocarcinoma], 5; GBM[Glioblastoma multiforme], 6; Glioma Low Grade, 7; HNSC[Head and Neck squamous cell carcinoma], 8; KICH[Kidney Chromophobe], 9; KIRC[Kidney renal clear cell carcinoma], 10; KIRP[Kidney renal papillary cell carcinoma], 11; LAML[Acute Myeloid Leukemia], 12; LUAD[Lung adenocarcinoma], 13; LUSC[Lung squamous cell carcinoma], 14; OV[Ovarian serous cystadenocarcinoma ], 15; PAAD[Pancreatic adenocarcinoma], 16; PRAD[Prostate adenocarcinoma], 17; SKCM[Skin Cutaneous Melanoma], 18:STAD[Stomach adenocarcinoma], 19:THCA[Thyroid carcinoma], 20:UCEC[Uterine Corpus Endometrial Carcinoma]) |
| Top |
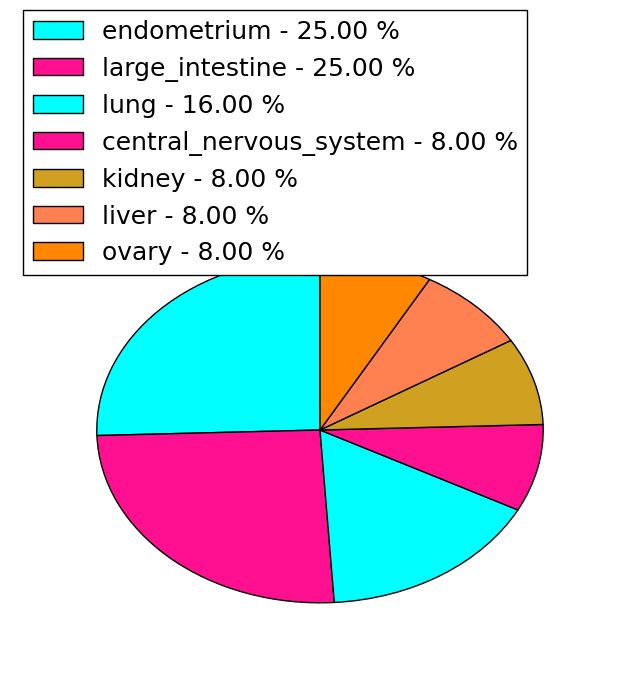
| * We represented just top 10 SNVs. When you move the cursor on each content, you can see more deailed mutation information on the Tooltip. Those are primary_site, primary_histology, mutation(aa), pubmedID. |
| Genomic Position | Mutation(aa) | Unique sampleID count |
| chr12:57033004 | p.K459Q | 3 |
| chr12:57038968 | p.D295D | 2 |
| chr12:57036523 | p.V99V | 2 |
| chr12:57033030 | p.S386L | 1 |
| chr12:57038721 | p.G237S | 1 |
| chr12:57033957 | p.V384V | 1 |
| chr12:57037243 | p.A224T | 1 |
| chr12:57033060 | p.F507L | 1 |
| chr12:57038732 | p.T375M | 1 |
| chr12:57036251 | p.I187I | 1 |
| * Copy number data were extracted from TCGA using R package TCGA-Assembler. The URLs of all public data files on TCGA DCC data server were gathered on Jan-05-2015. Function ProcessCNAData in TCGA-Assembler package was used to obtain gene-level copy number value which is calculated as the average copy number of the genomic region of a gene. |
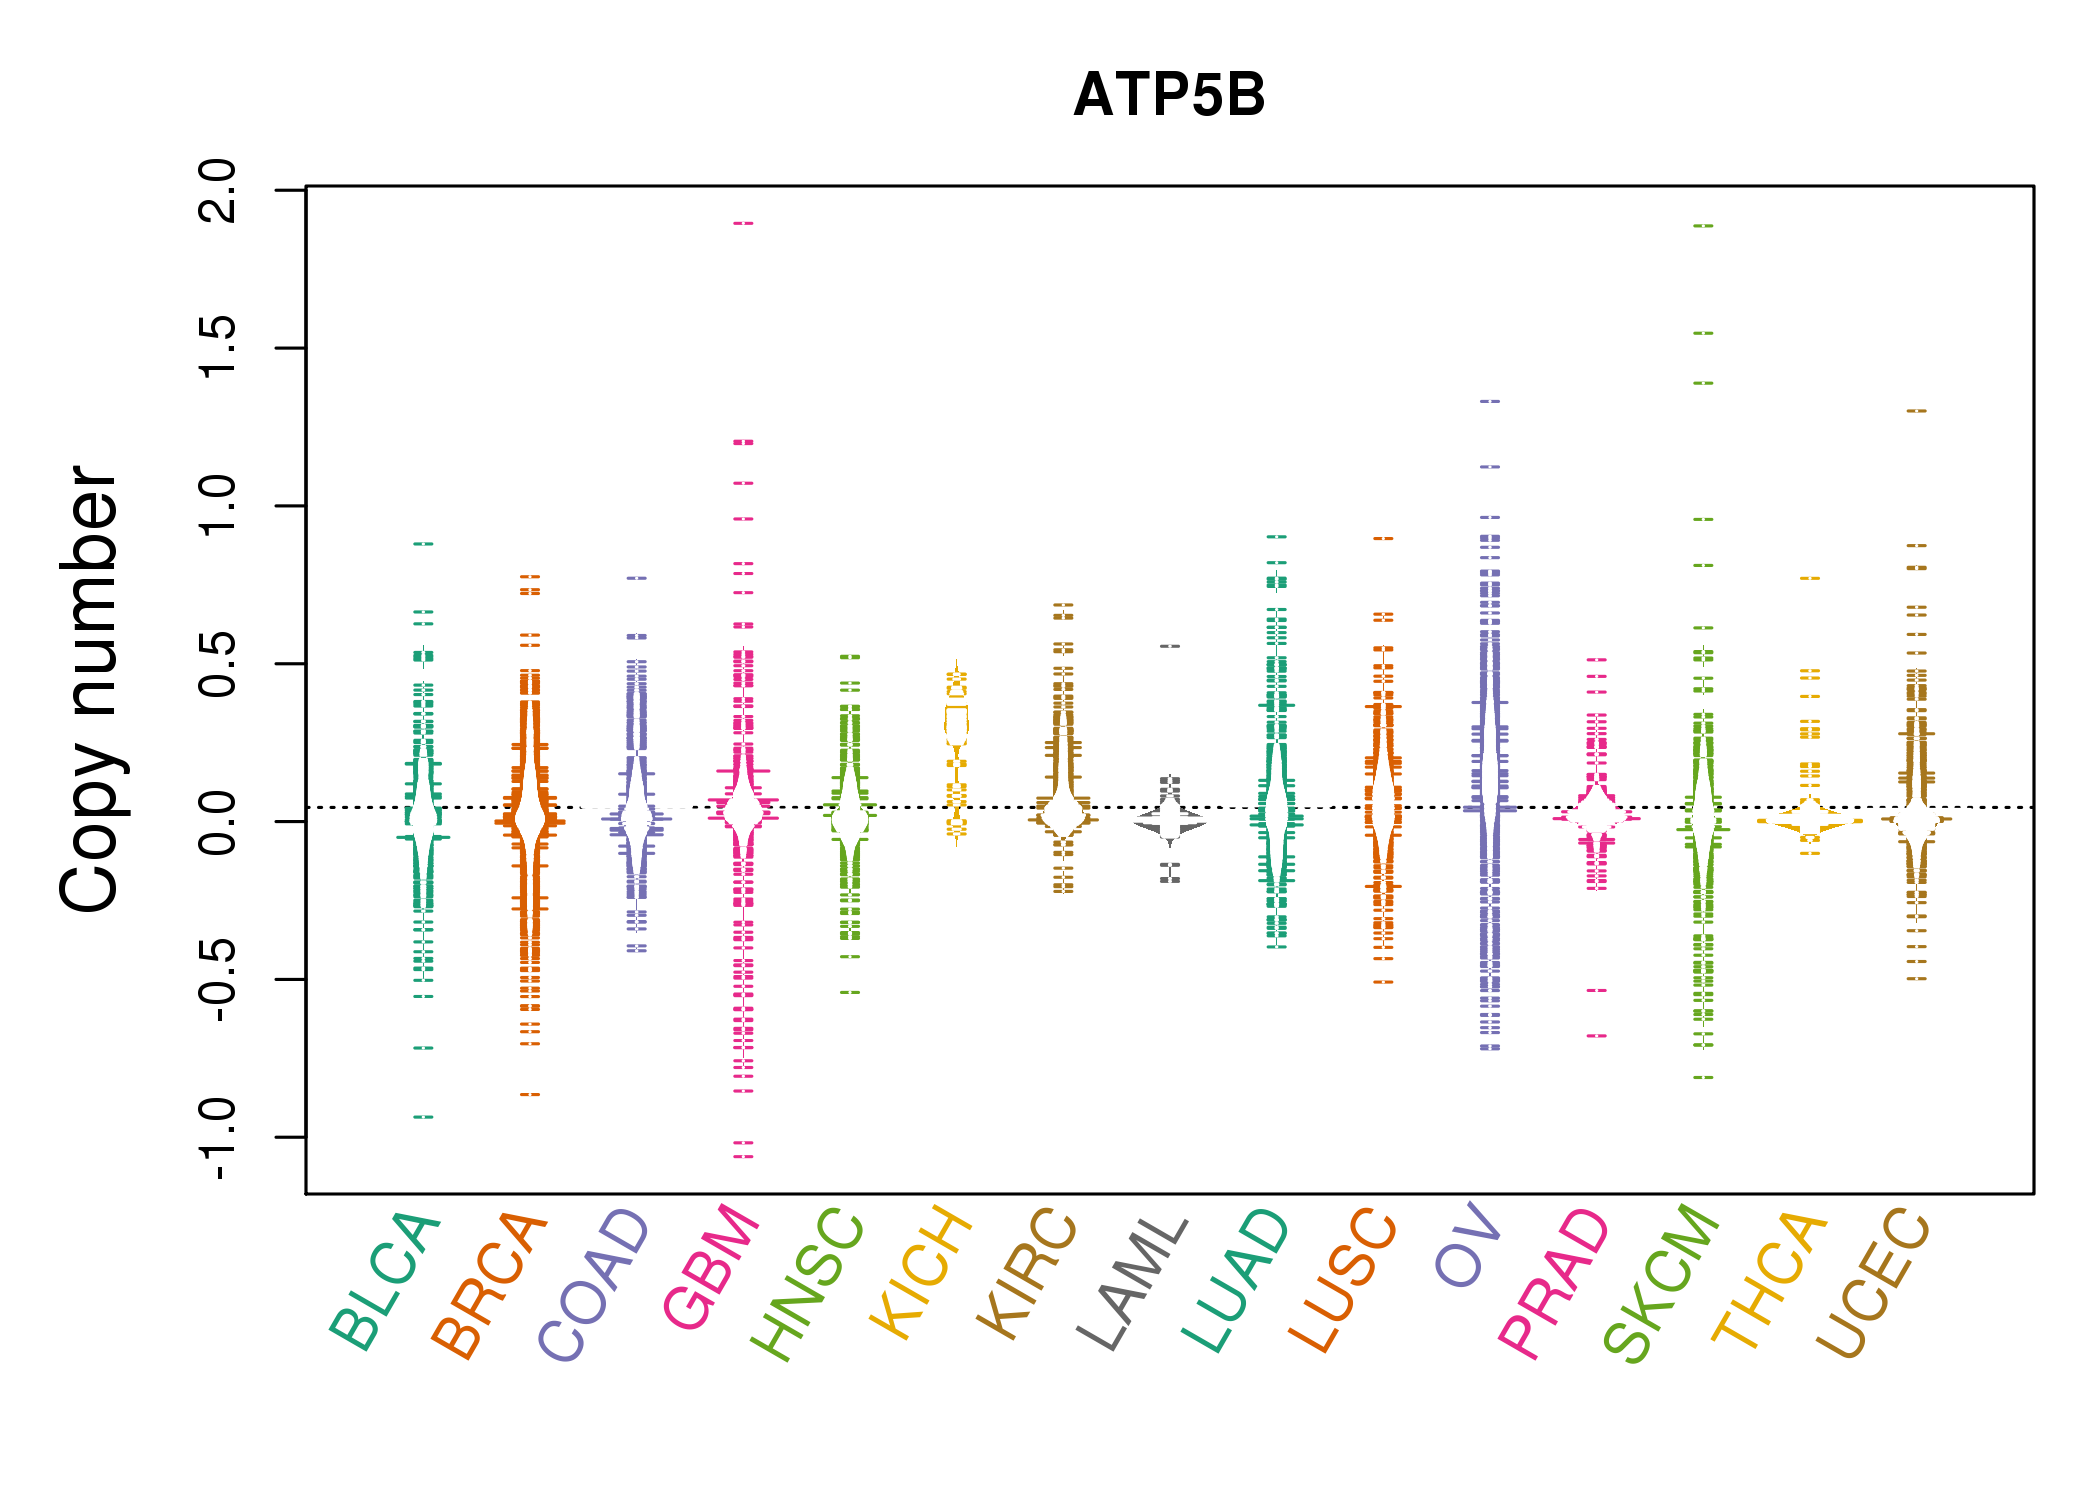 |
| cf) Tissue ID[Tissue type]: BLCA[Bladder Urothelial Carcinoma], BRCA[Breast invasive carcinoma], CESC[Cervical squamous cell carcinoma and endocervical adenocarcinoma], COAD[Colon adenocarcinoma], GBM[Glioblastoma multiforme], Glioma Low Grade, HNSC[Head and Neck squamous cell carcinoma], KICH[Kidney Chromophobe], KIRC[Kidney renal clear cell carcinoma], KIRP[Kidney renal papillary cell carcinoma], LAML[Acute Myeloid Leukemia], LUAD[Lung adenocarcinoma], LUSC[Lung squamous cell carcinoma], OV[Ovarian serous cystadenocarcinoma ], PAAD[Pancreatic adenocarcinoma], PRAD[Prostate adenocarcinoma], SKCM[Skin Cutaneous Melanoma], STAD[Stomach adenocarcinoma], THCA[Thyroid carcinoma], UCEC[Uterine Corpus Endometrial Carcinoma] |
| Top |
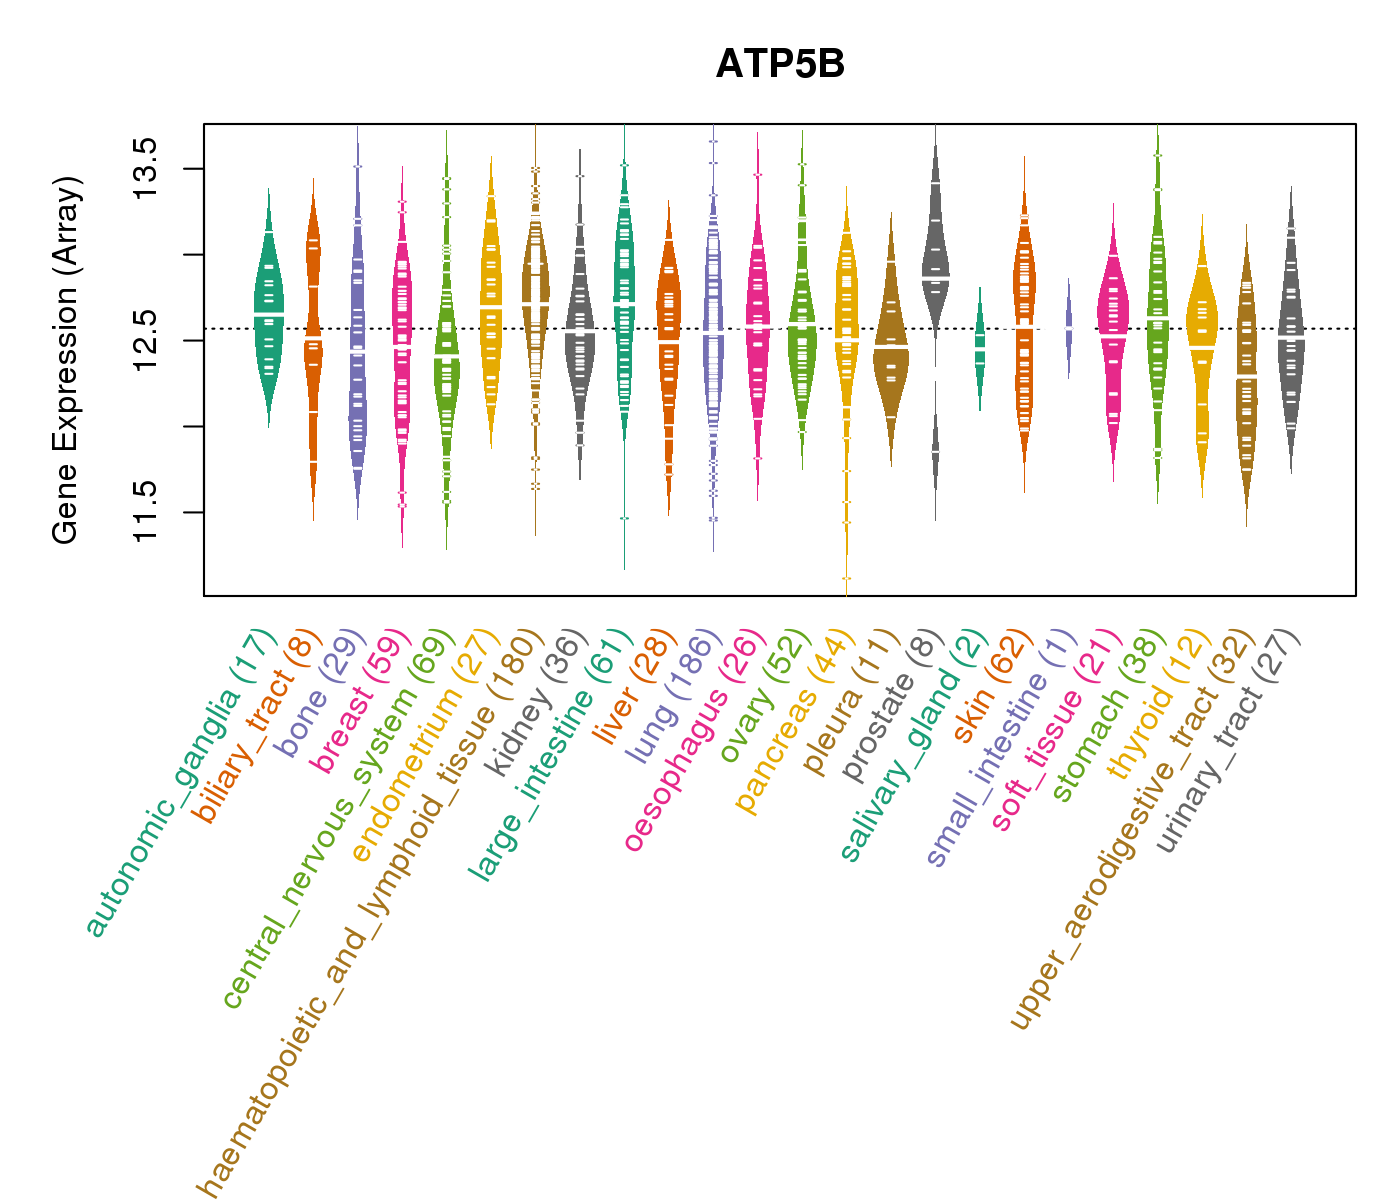
| Gene Expression for ATP5B |
| * CCLE gene expression data were extracted from CCLE_Expression_Entrez_2012-10-18.res: Gene-centric RMA-normalized mRNA expression data. |
 |
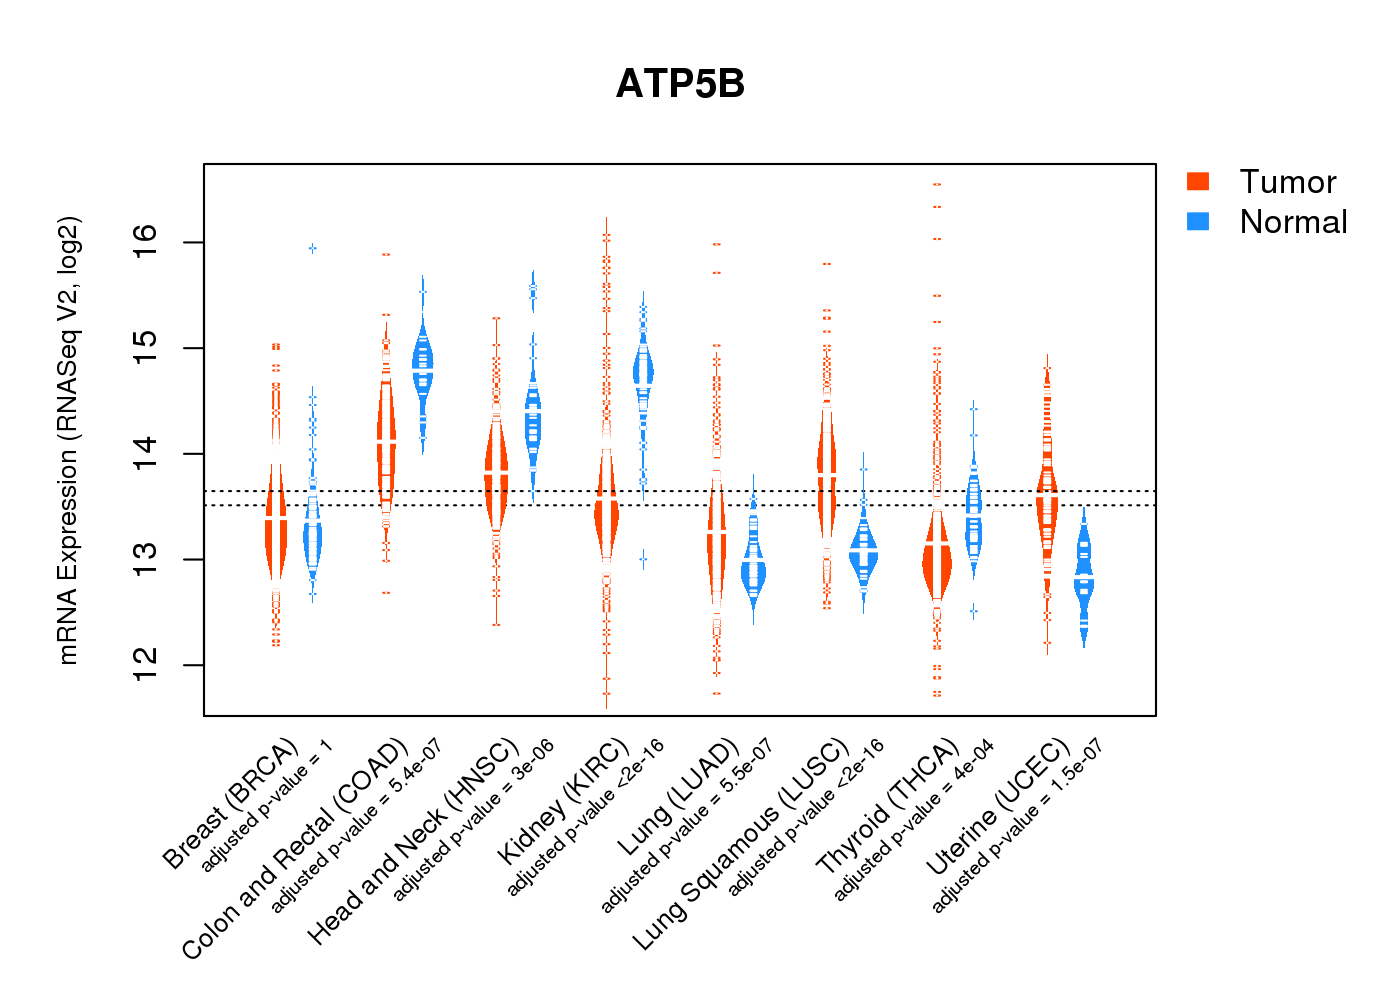
| * Normalized gene expression data of RNASeqV2 was extracted from TCGA using R package TCGA-Assembler. The URLs of all public data files on TCGA DCC data server were gathered at Jan-05-2015. Only eight cancer types have enough normal control samples for differential expression analysis. (t test, adjusted p<0.05 (using Benjamini-Hochberg FDR)) |
 |
| Top |
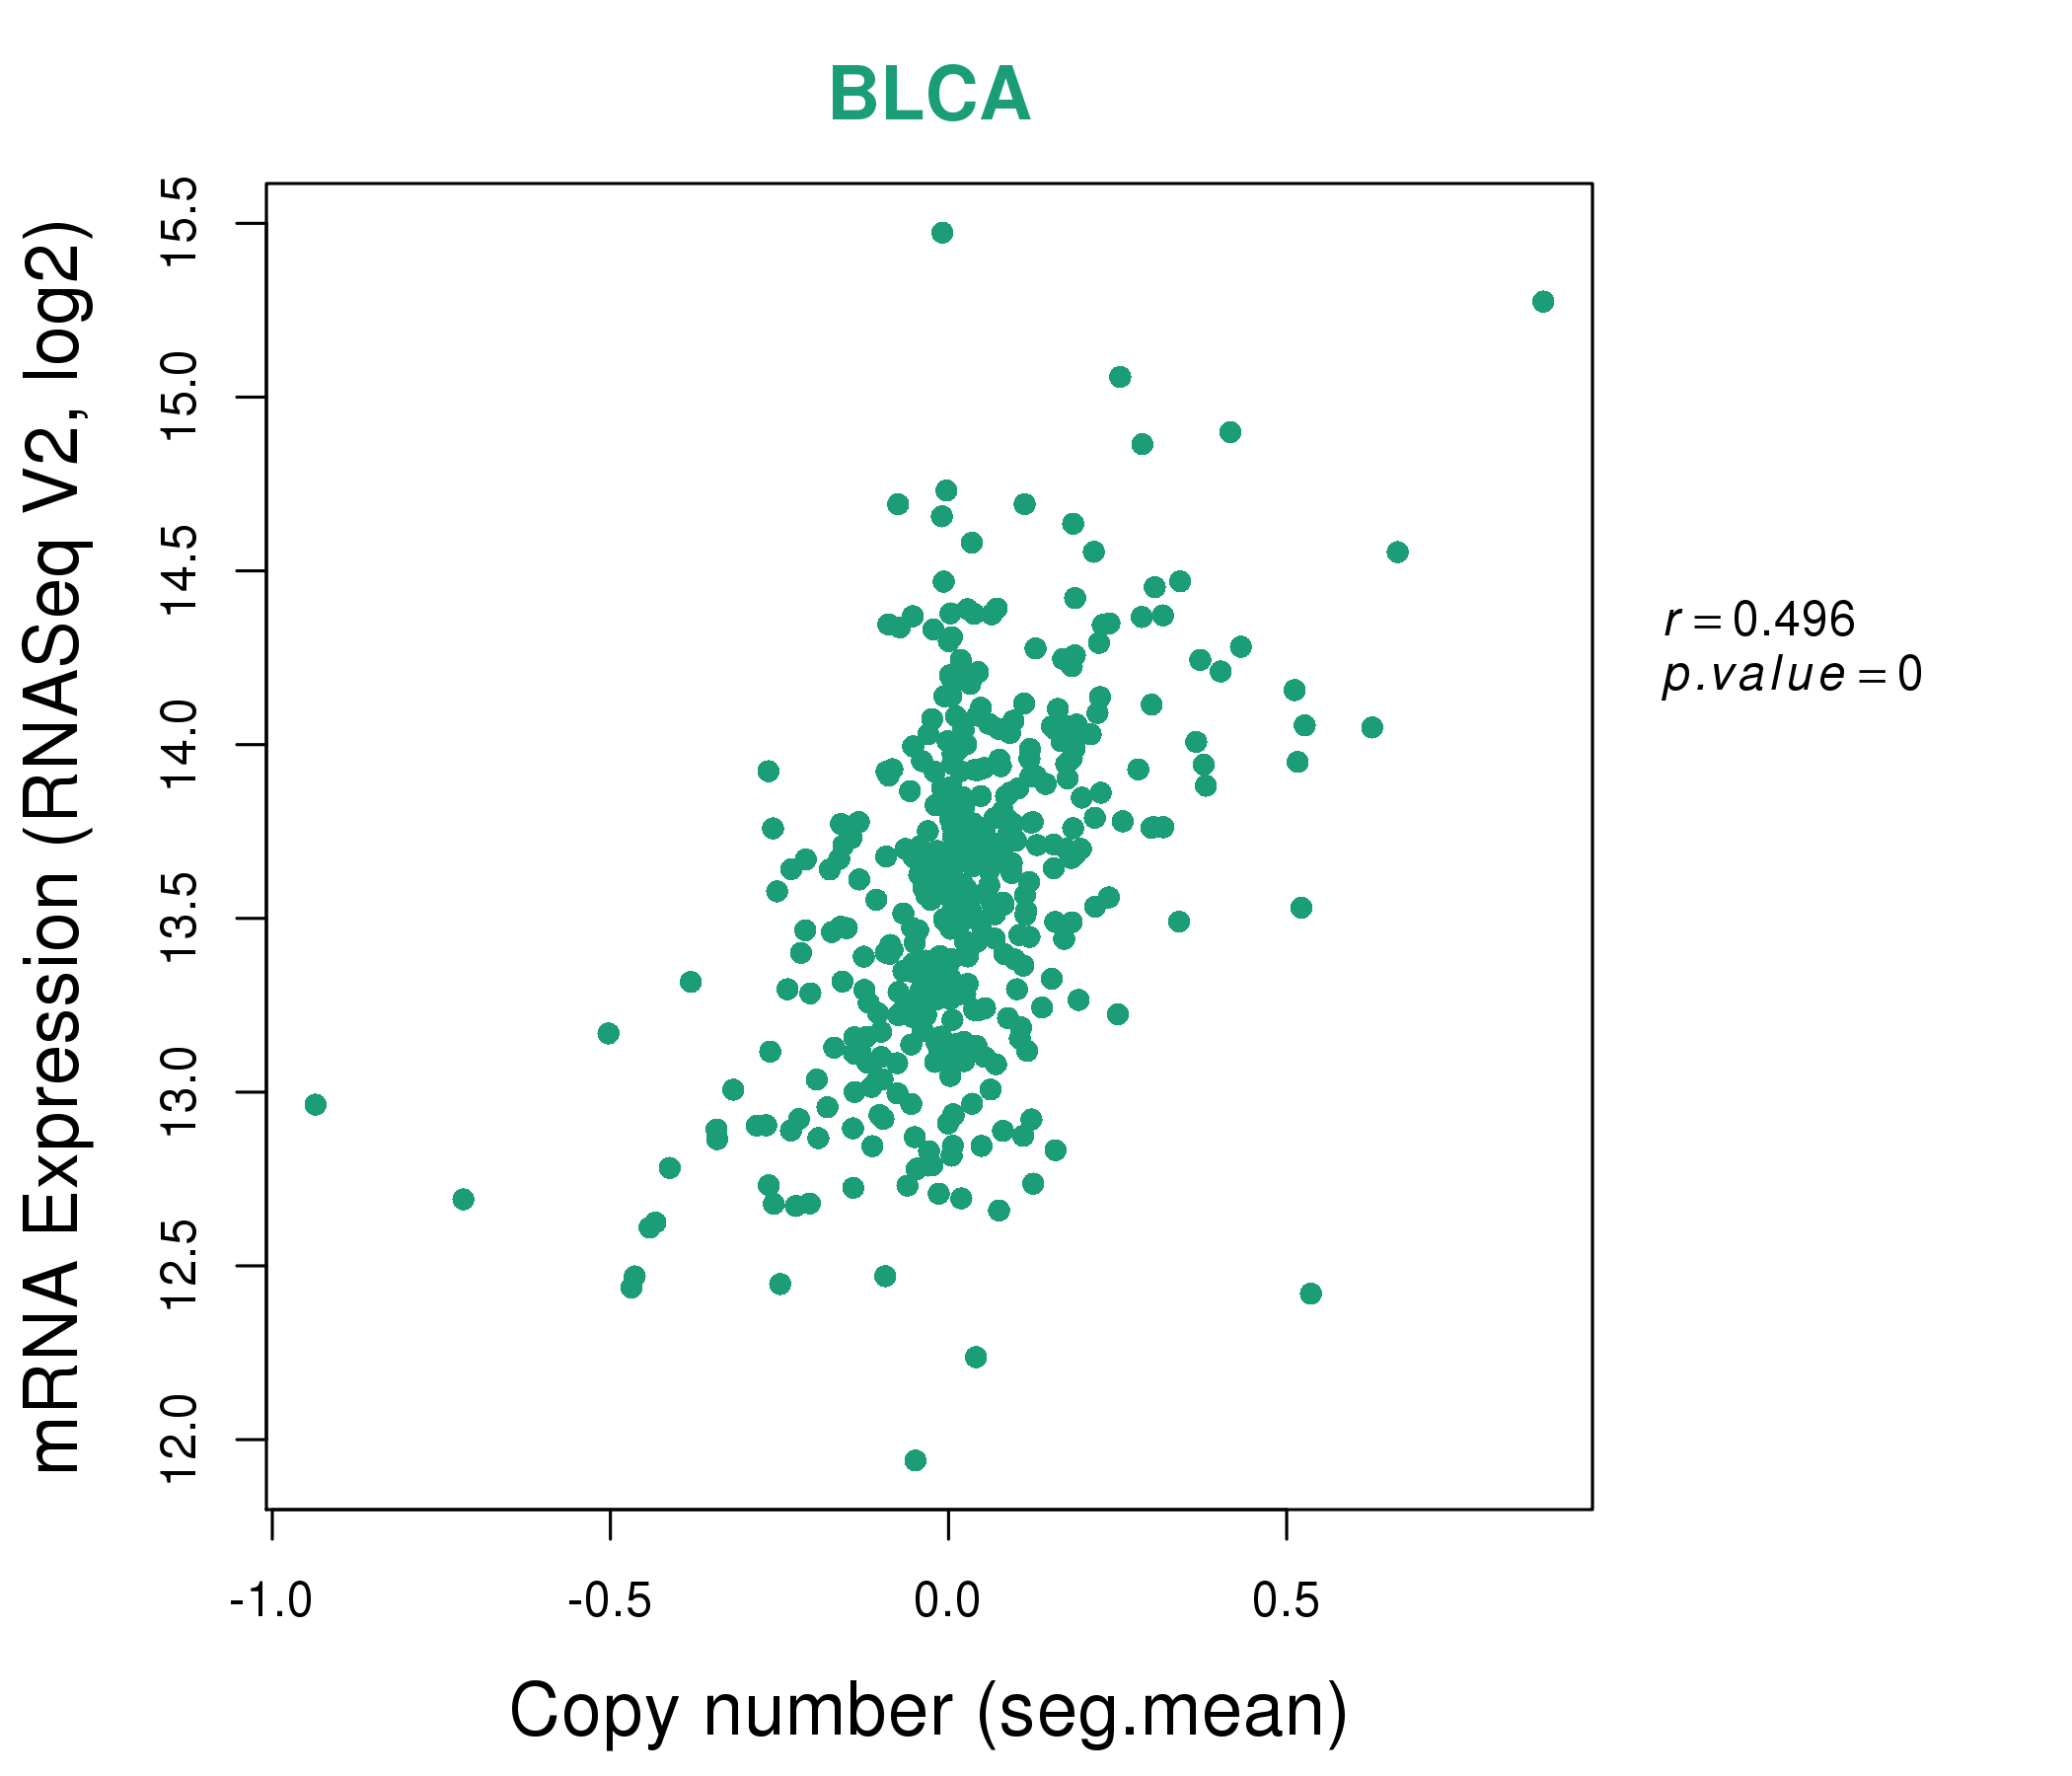
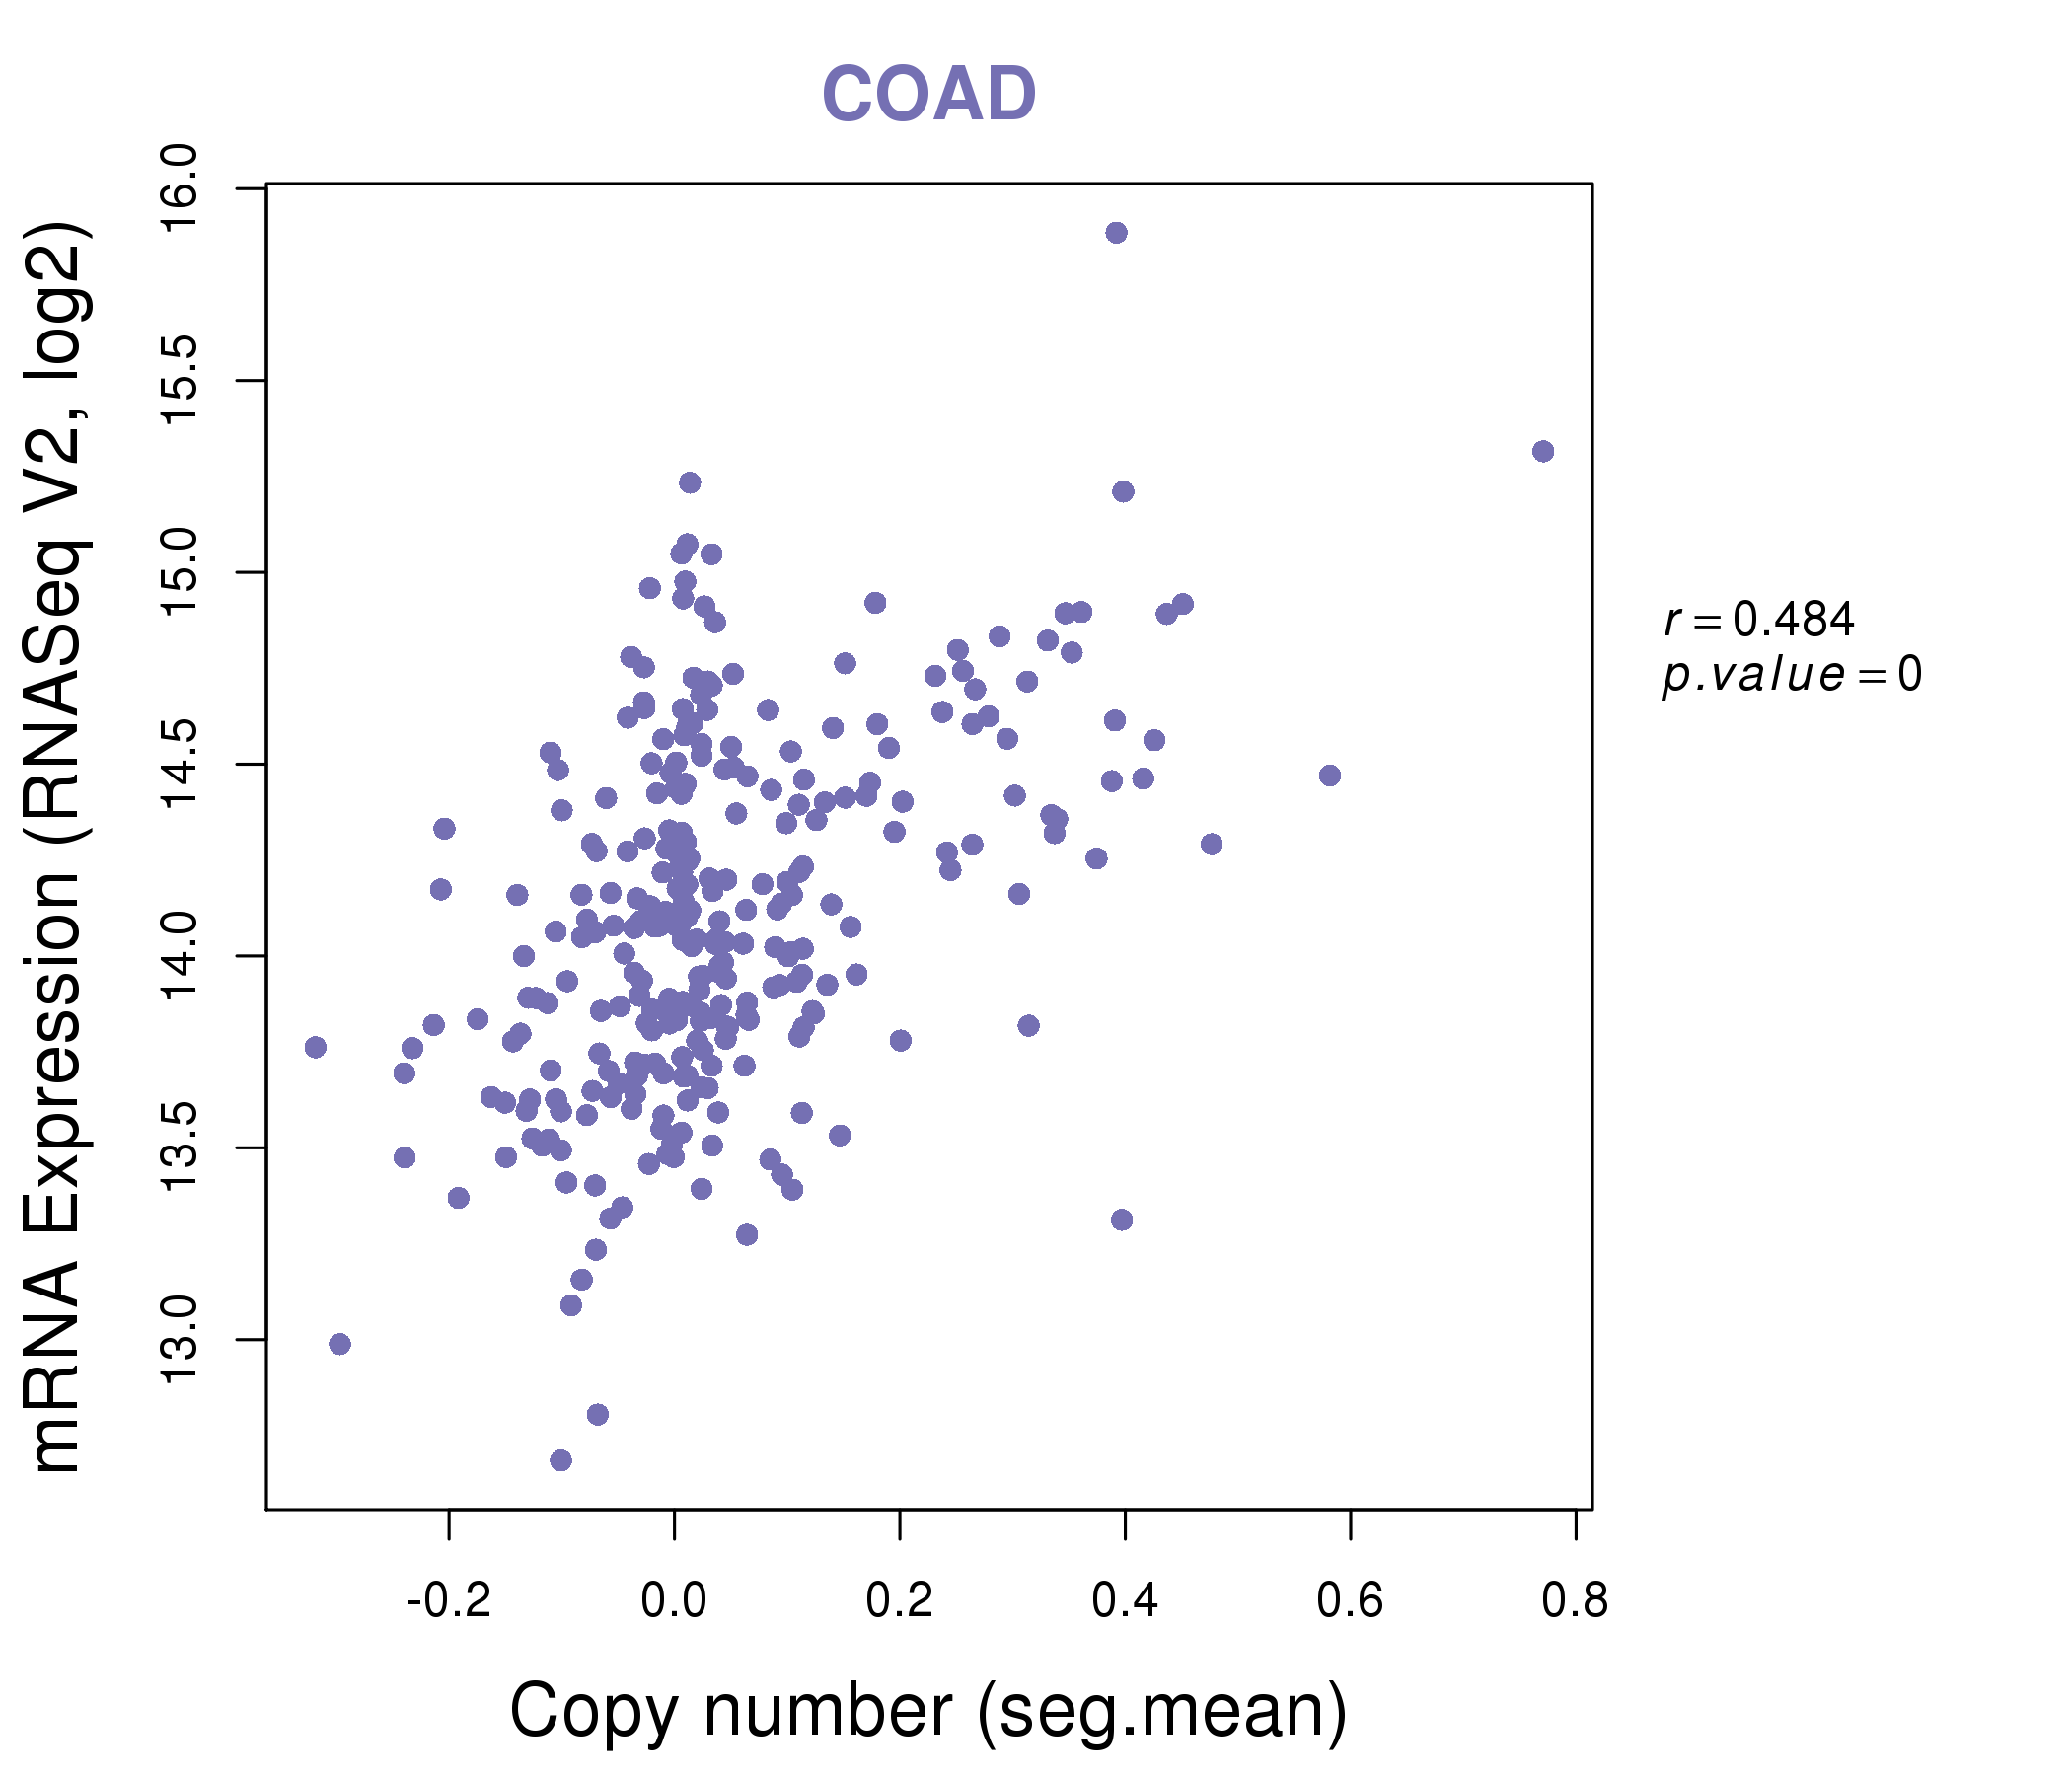
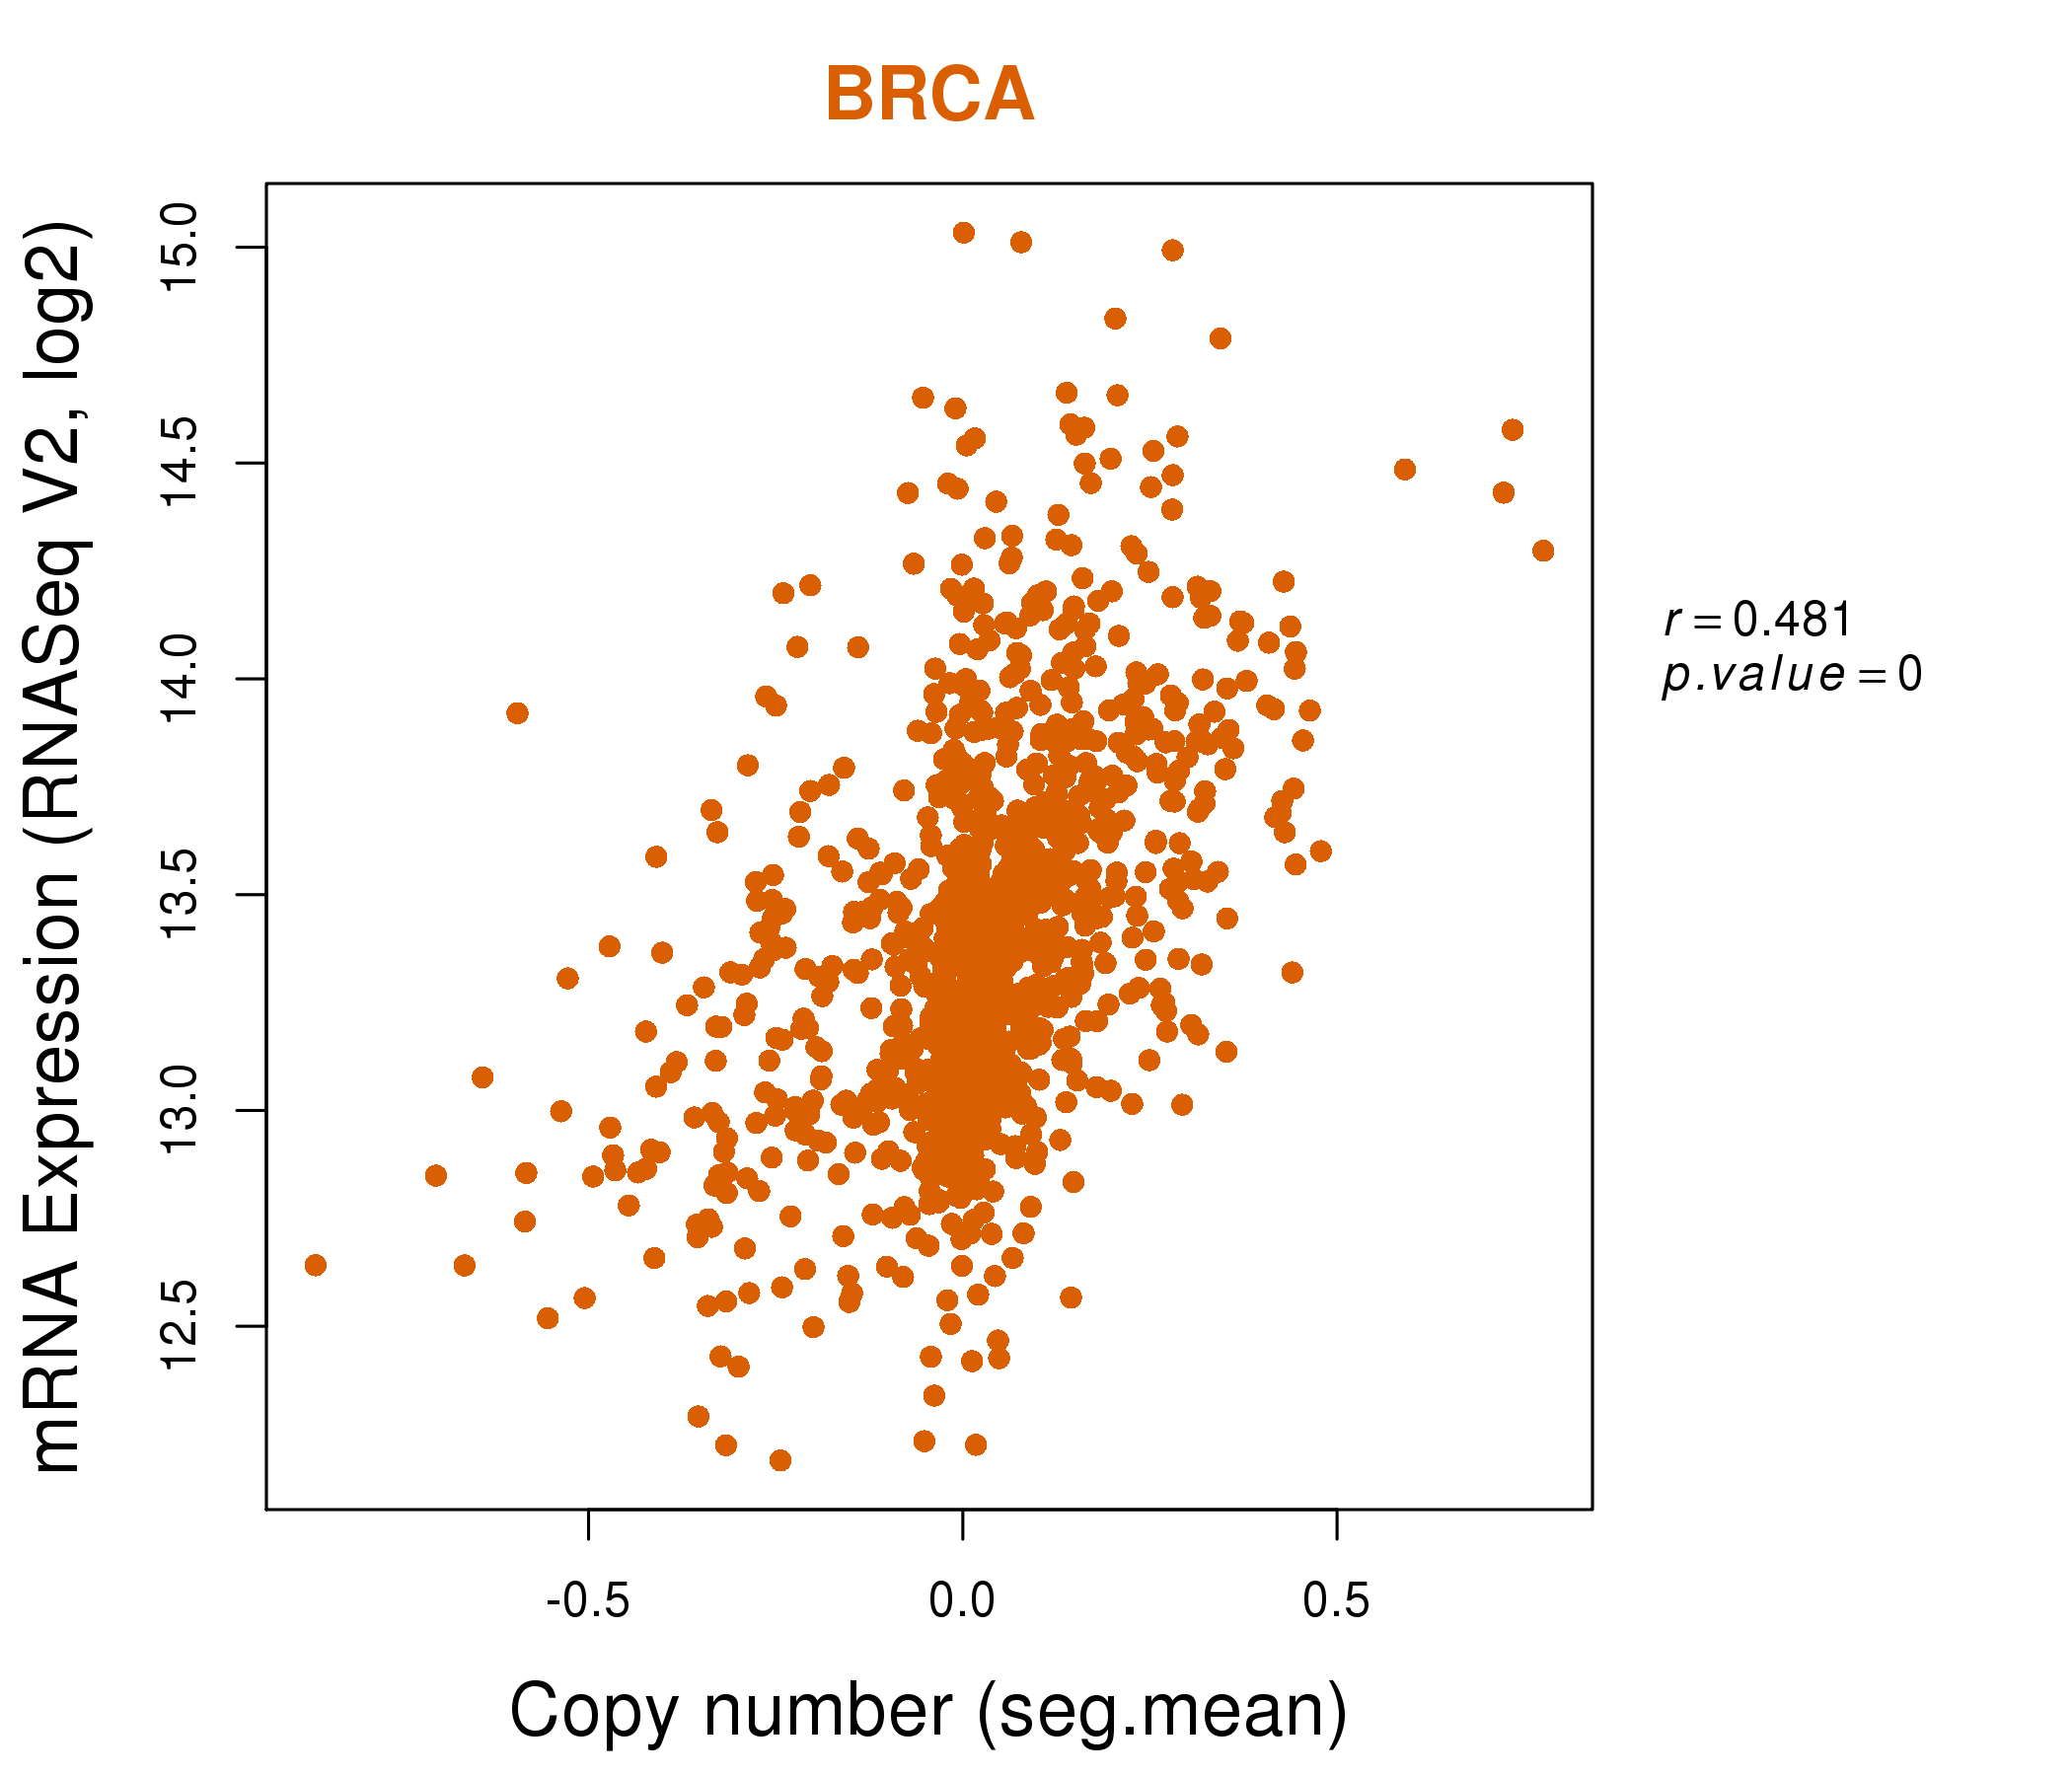
| * This plots show the correlation between CNV and gene expression. |
: Open all plots for all cancer types
 |
|
 |
|

| Top |
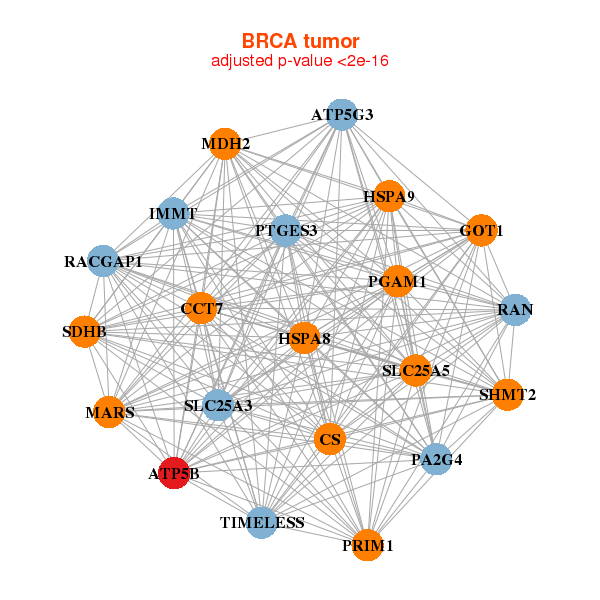
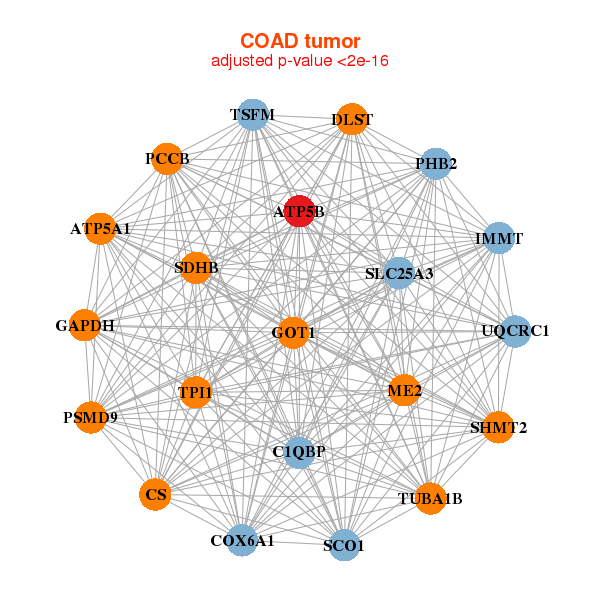
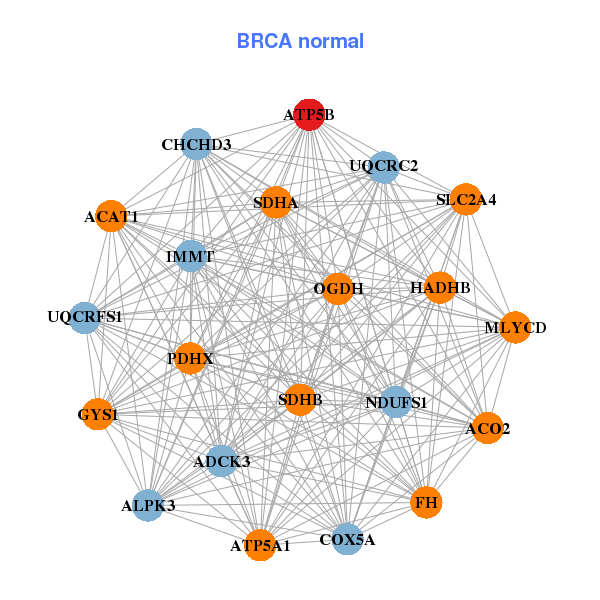
| Gene-Gene Network Information |
| * Co-Expression network figures were drawn using R package igraph. Only the top 20 genes with the highest correlations were shown. Red circle: input gene, orange circle: cell metabolism gene, sky circle: other gene |
: Open all plots for all cancer types
 |
| ||||
| ATP5B,ATP5G3,CCT7,CS,GOT1,HSPA8,HSPA9, IMMT,MARS,MDH2,PA2G4,PGAM1,PRIM1,PTGES3, RACGAP1,RAN,SDHB,SHMT2,SLC25A3,SLC25A5,TIMELESS | ACAT1,ACO2,ALPK3,ATP5A1,ATP5B,ADCK3,CHCHD3, COX5A,FH,GYS1,HADHB,IMMT,MLYCD,NDUFS1, OGDH,PDHX,SDHA,SDHB,SLC2A4,UQCRC2,UQCRFS1 | ||||
 |
| ||||
| ATP5A1,ATP5B,C1QBP,COX6A1,CS,DLST,GAPDH, GOT1,IMMT,ME2,PCCB,PHB2,PSMD9,SCO1, SDHB,SHMT2,SLC25A3,TPI1,TSFM,TUBA1B,UQCRC1 | ATP5A1,ATP5B,ATP5G3,C2orf47,COX5A,DBI,ETFA, GHITM,GOT1,HARBI1,HCCS,MYCBP,NDUFA9,NDUFS3, PSMD3,RTN4IP1,SCO1,SQRDL,UQCRC1,UQCRC2,UQCRFS1 |
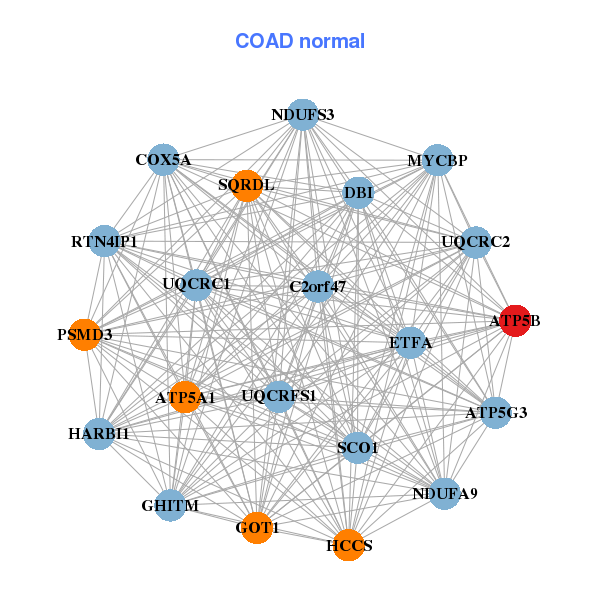
| * Co-Expression network figures were drawn using R package igraph. Only the top 20 genes with the highest correlations were shown. Red circle: input gene, orange circle: cell metabolism gene, sky circle: other gene |
: Open all plots for all cancer types
| Top |
: Open all interacting genes' information including KEGG pathway for all interacting genes from DAVID
| Top |
| Pharmacological Information for ATP5B |
| DB Category | DB Name | DB's ID and Url link |
| * Gene Centered Interaction Network. |
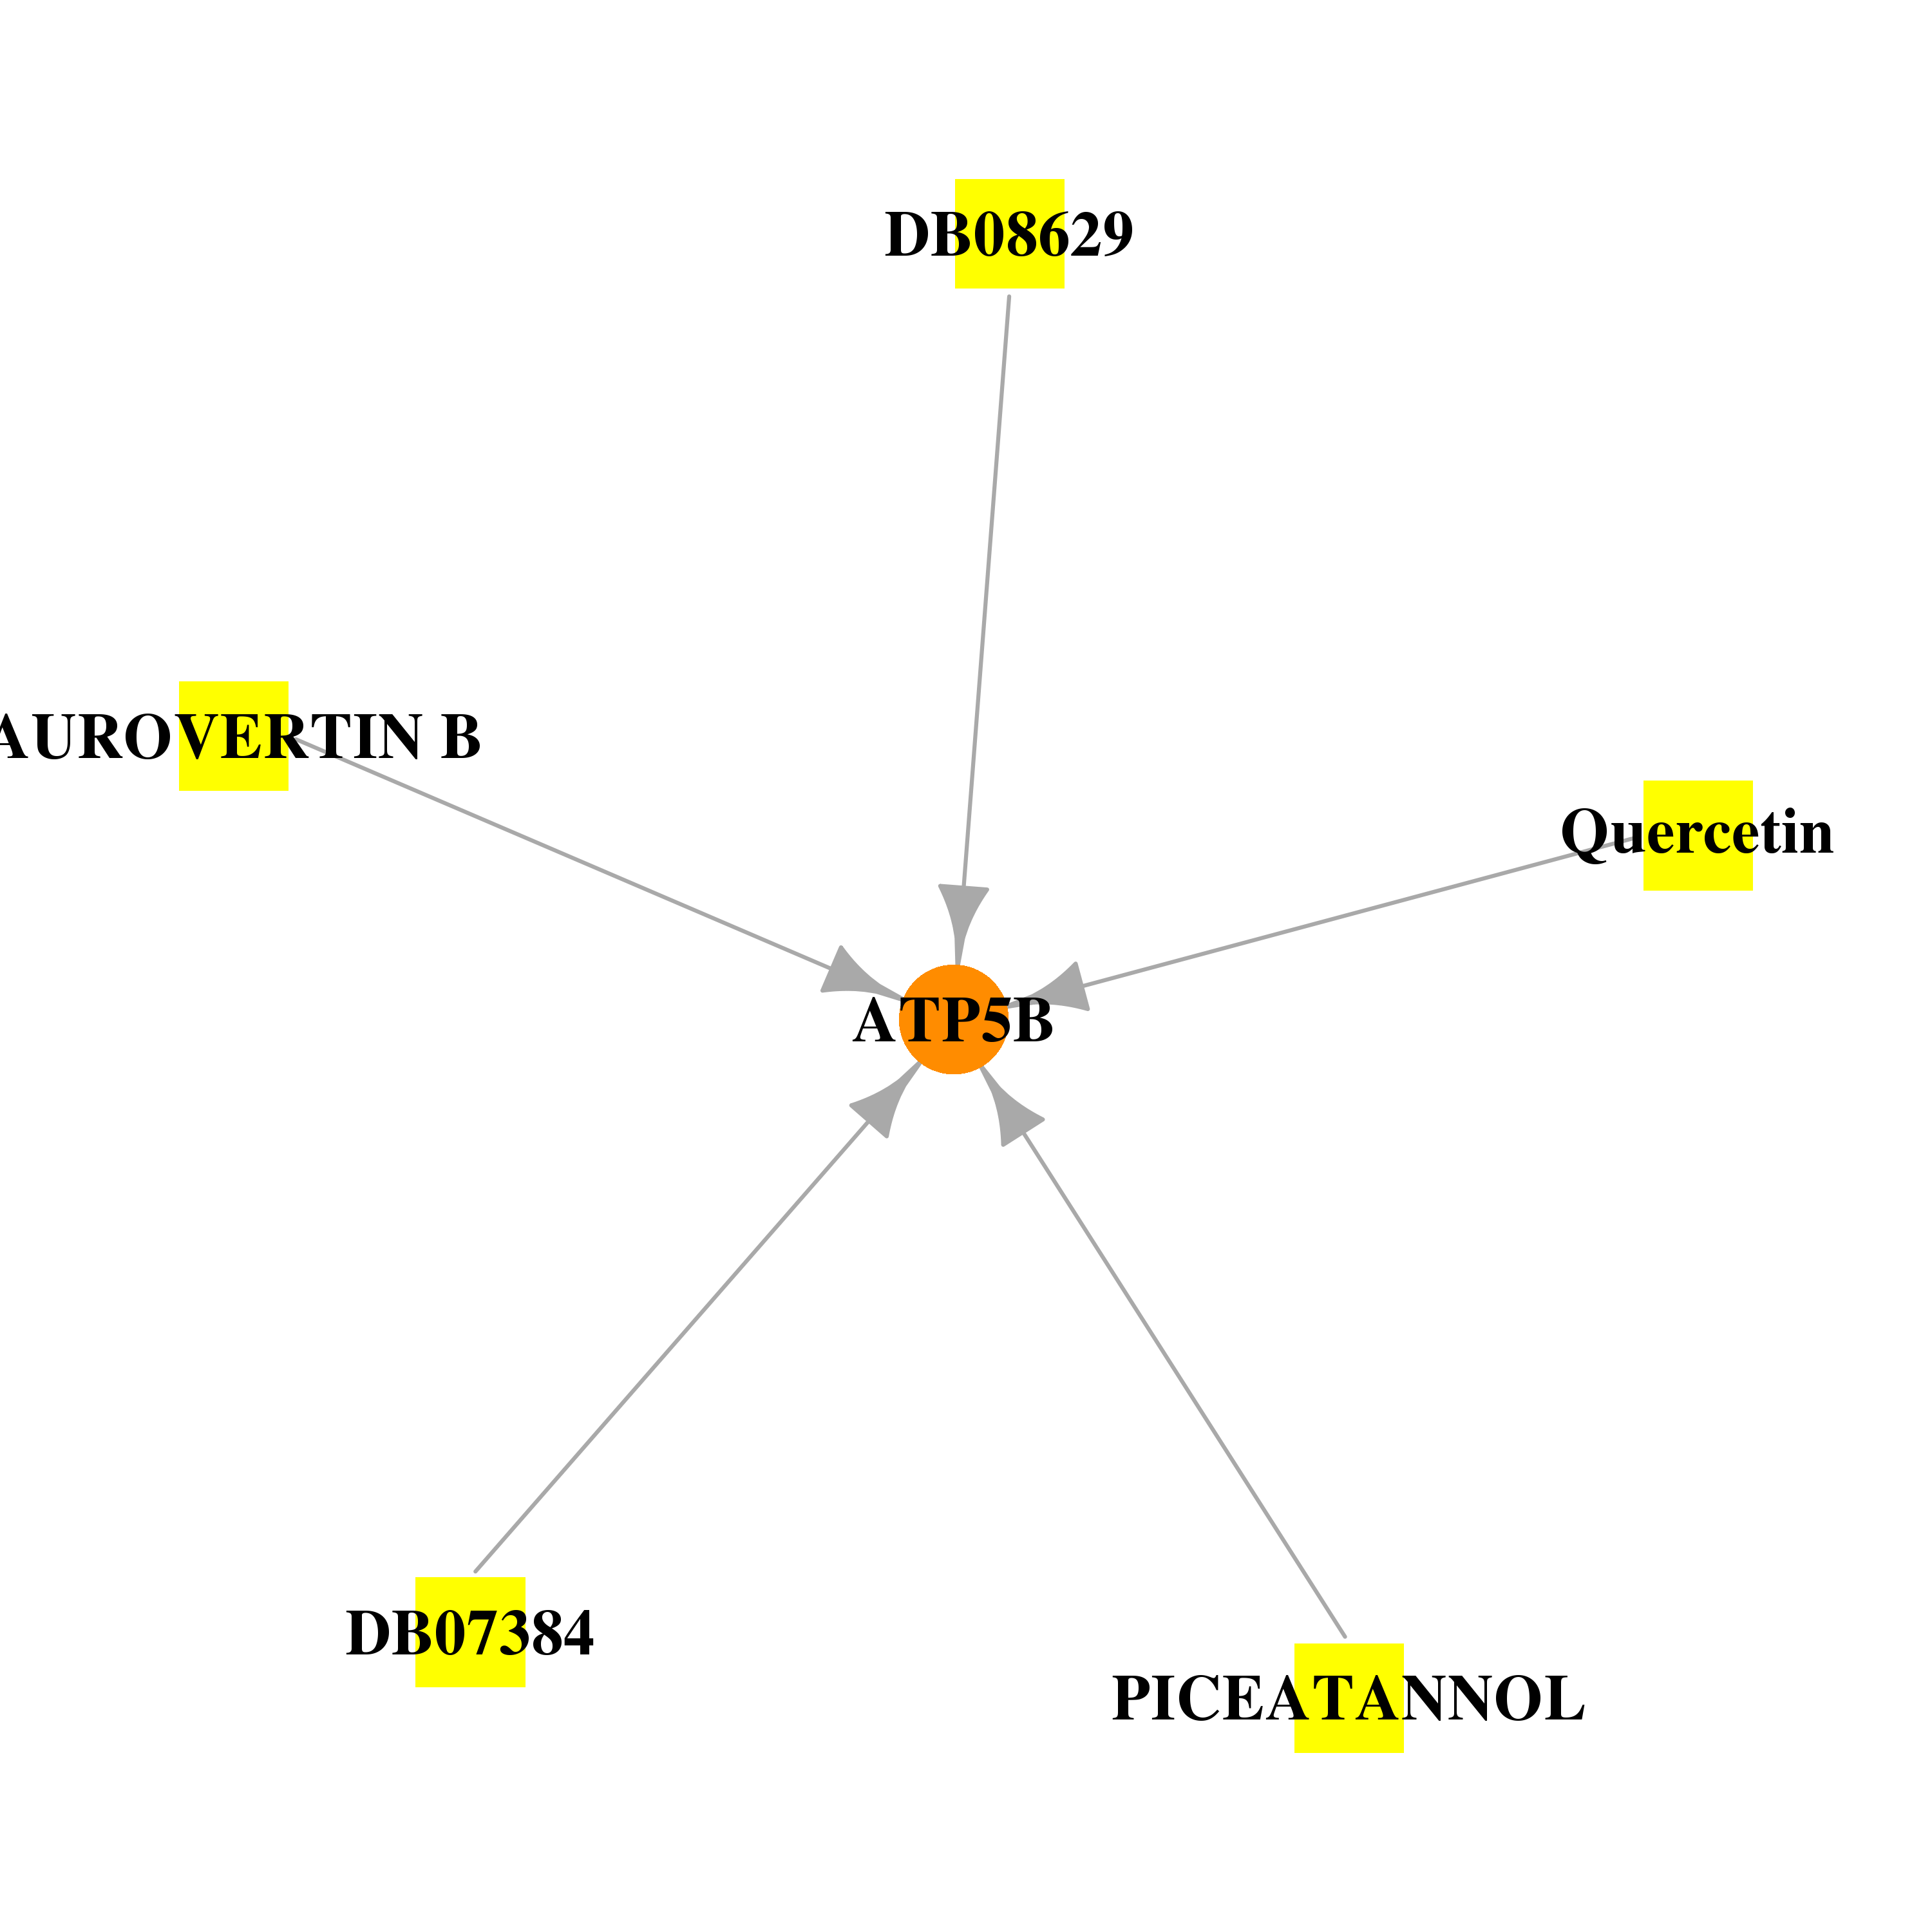 |
| * Drug Centered Interaction Network. |
| DrugBank ID | Target Name | Drug Groups | Generic Name | Drug Centered Network | Drug Structure |
| DB04216 | ATP synthase, H+ transporting, mitochondrial F1 complex, beta polypeptide | experimental | Quercetin | 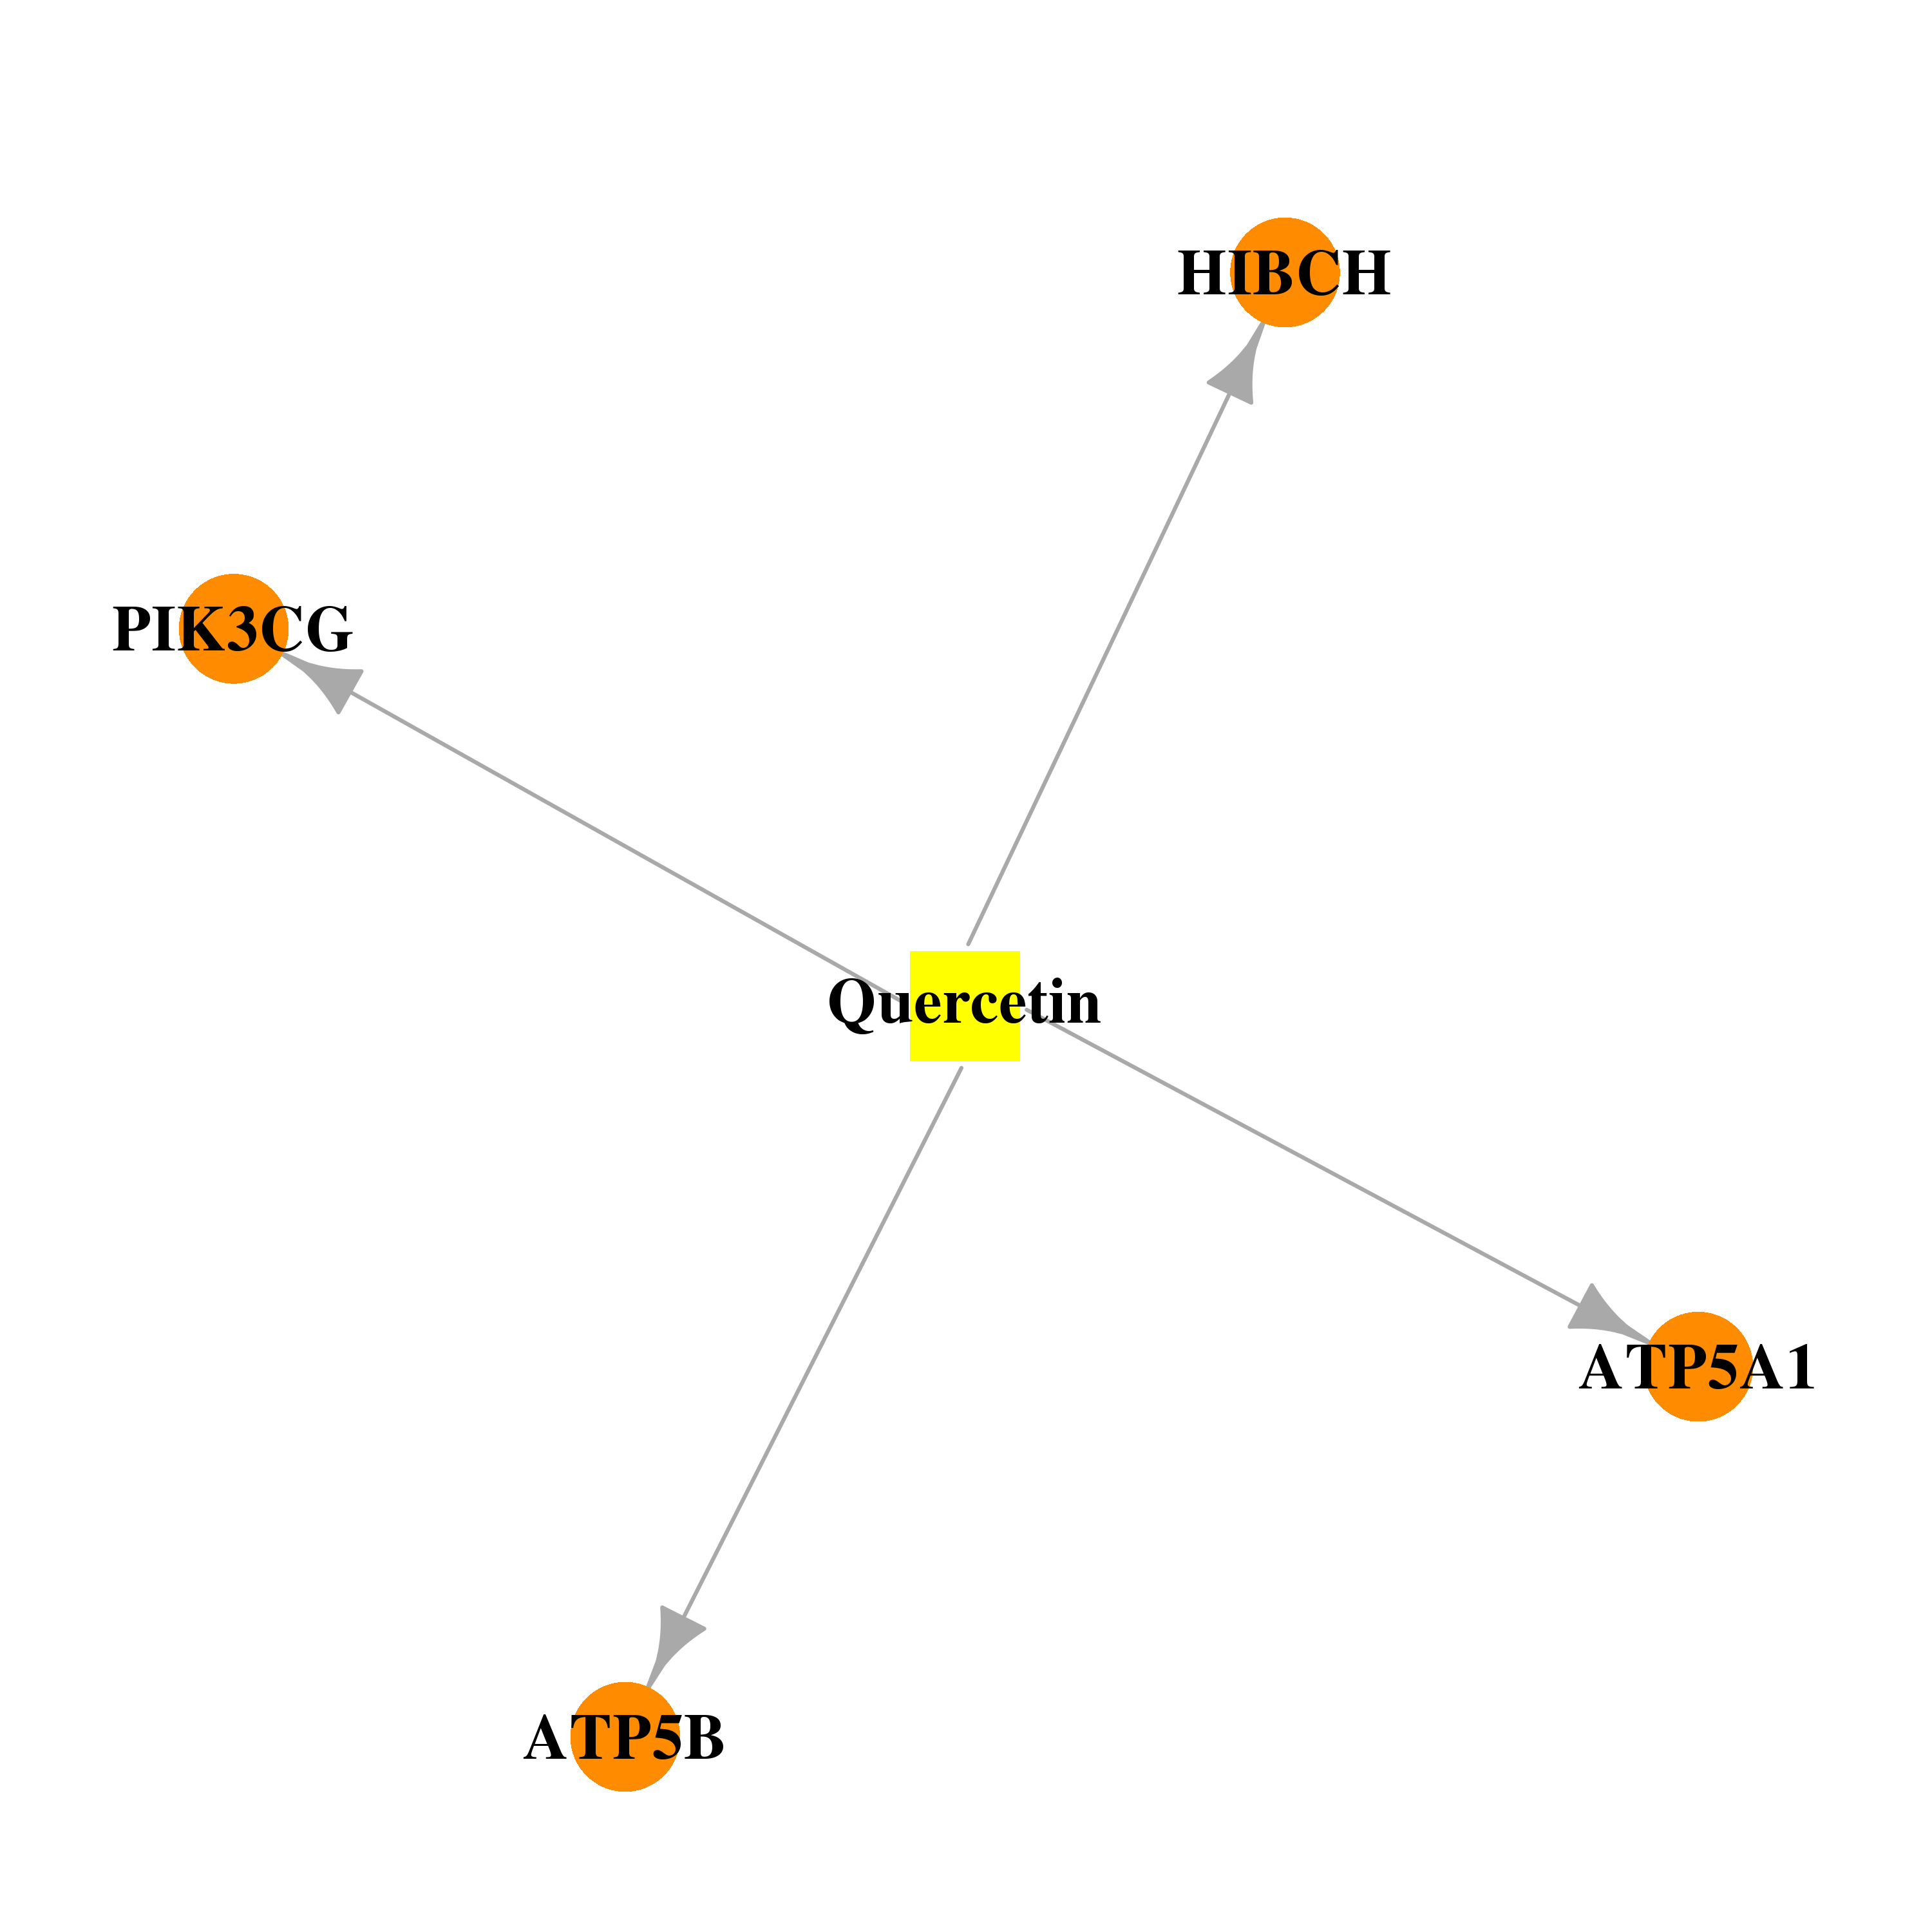 |  |
| DB07384 | ATP synthase, H+ transporting, mitochondrial F1 complex, beta polypeptide | experimental | 1-ACETYL-2-CARBOXYPIPERIDINE | 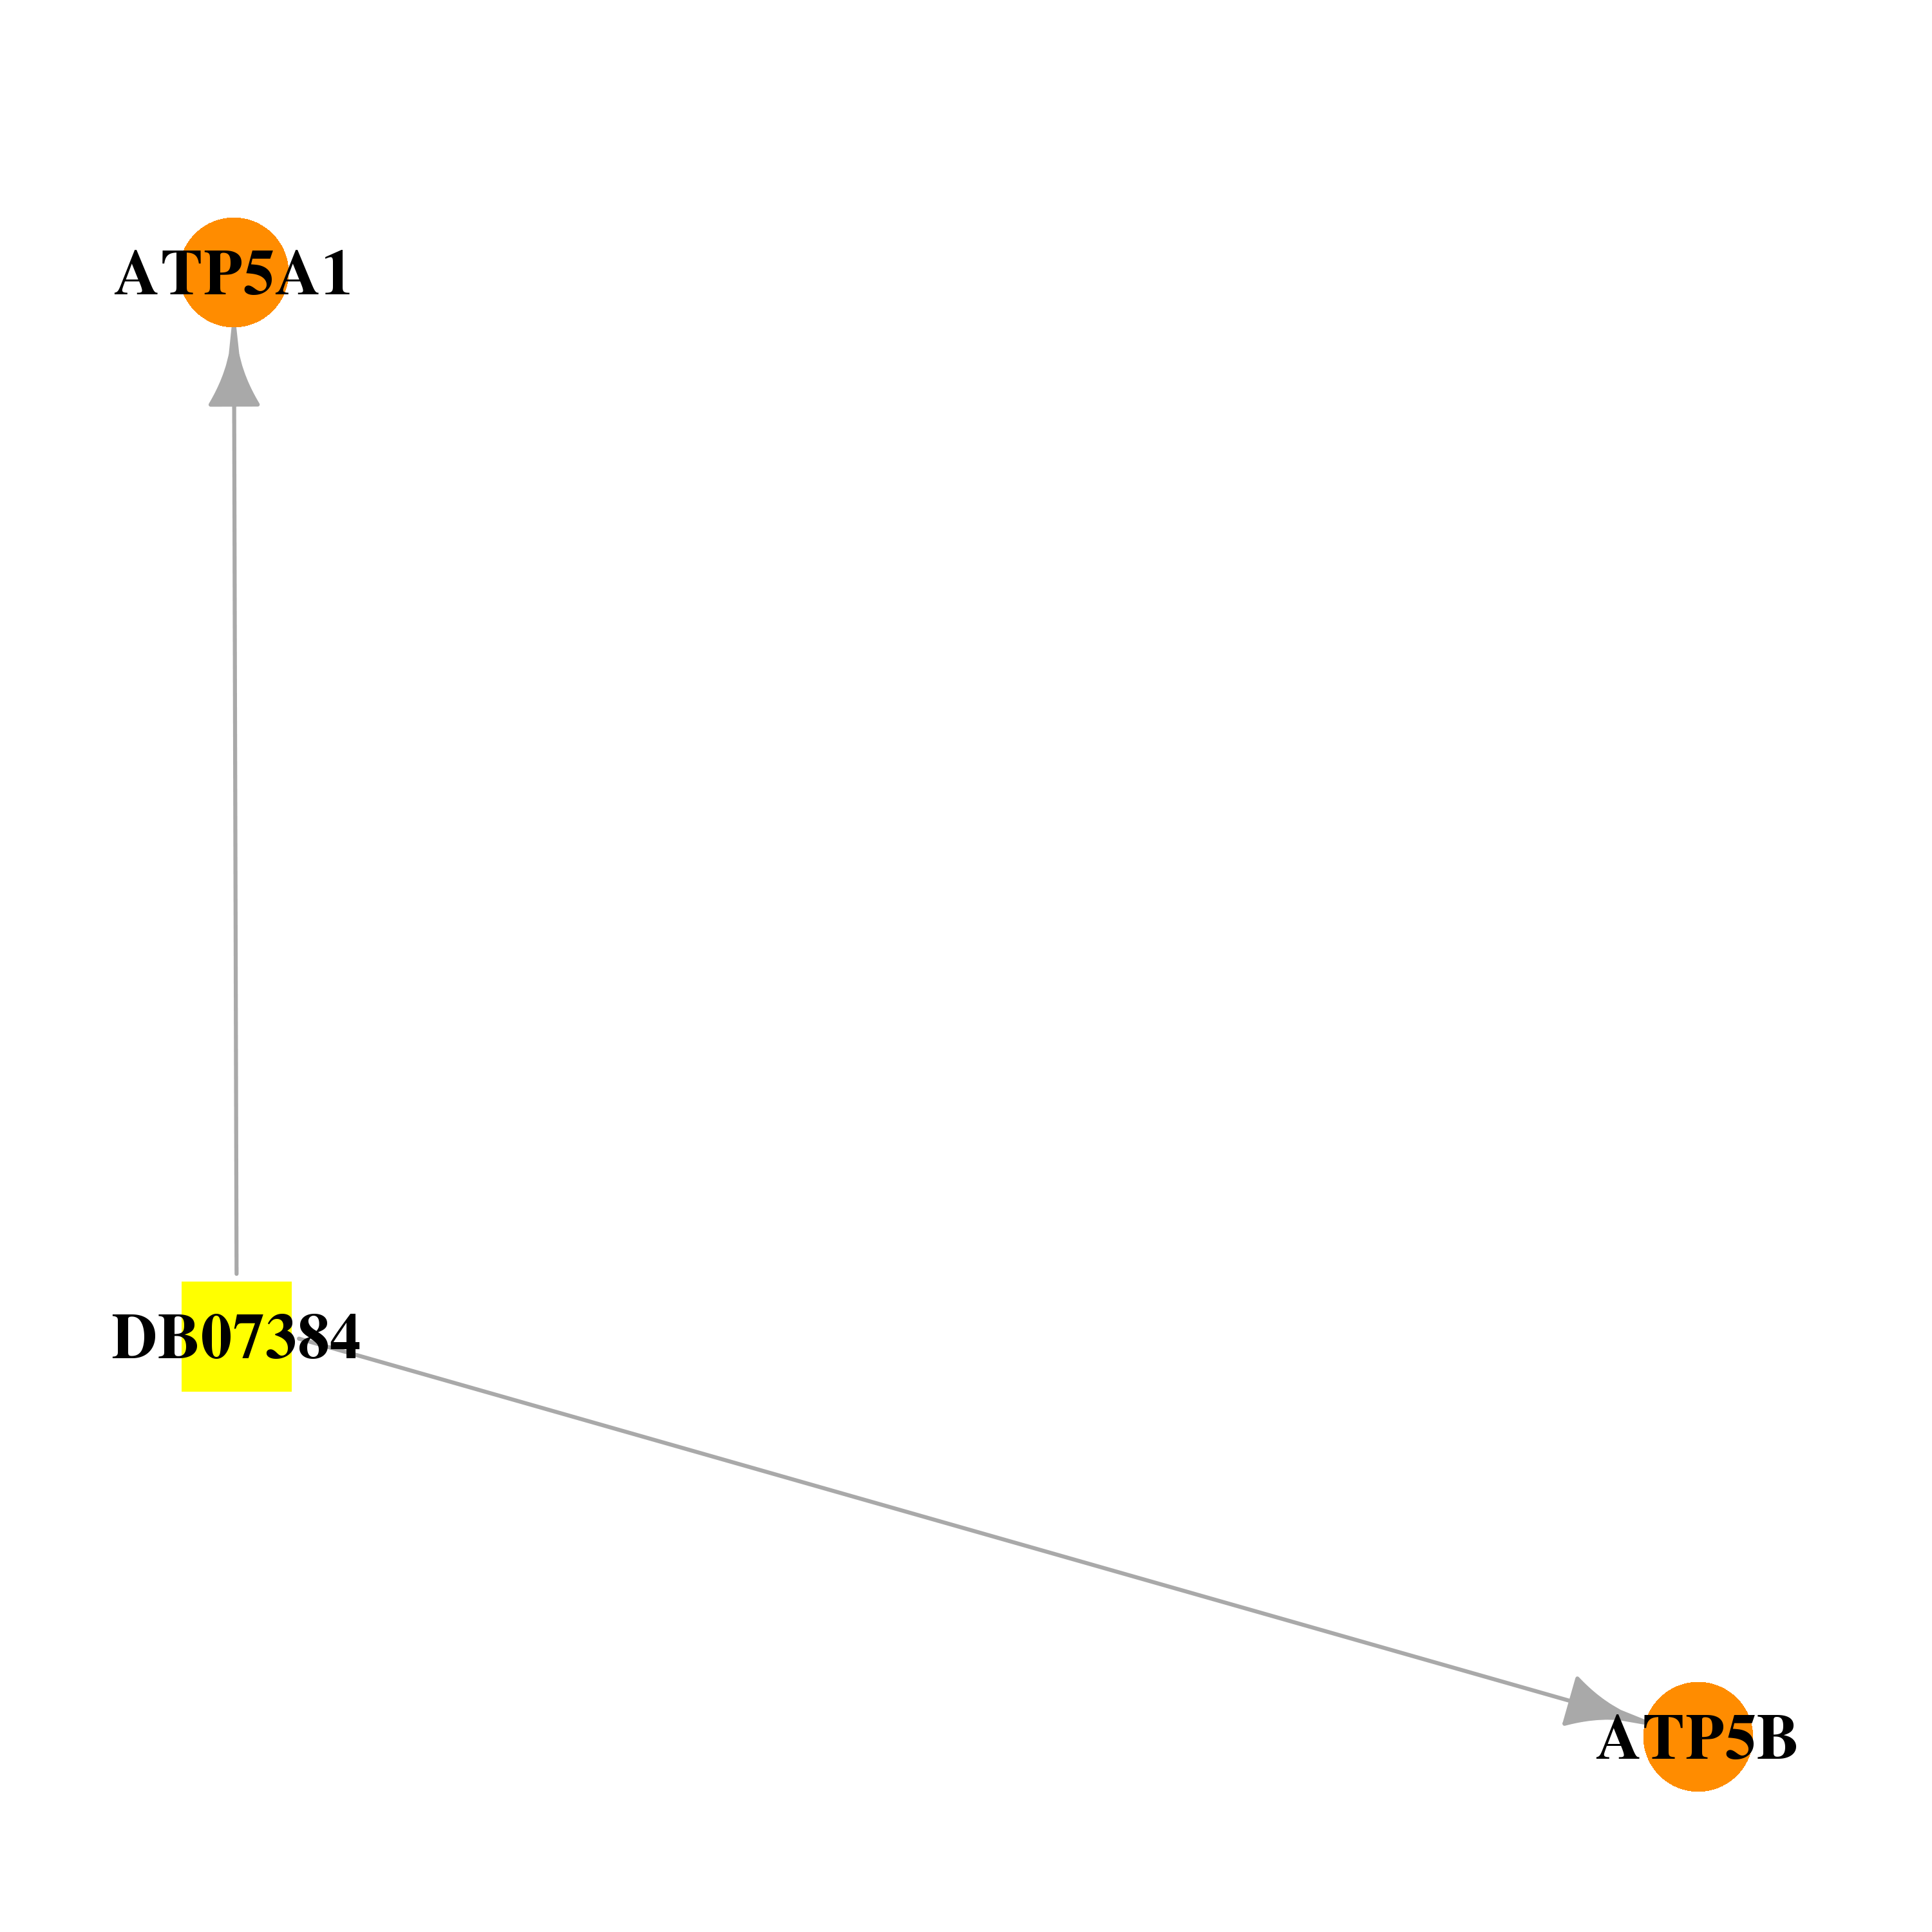 | 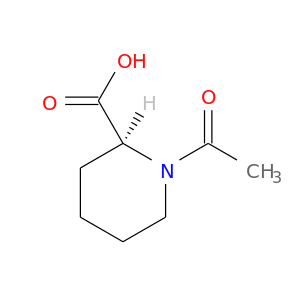 |
| DB07394 | ATP synthase, H+ transporting, mitochondrial F1 complex, beta polypeptide | experimental | AUROVERTIN B | 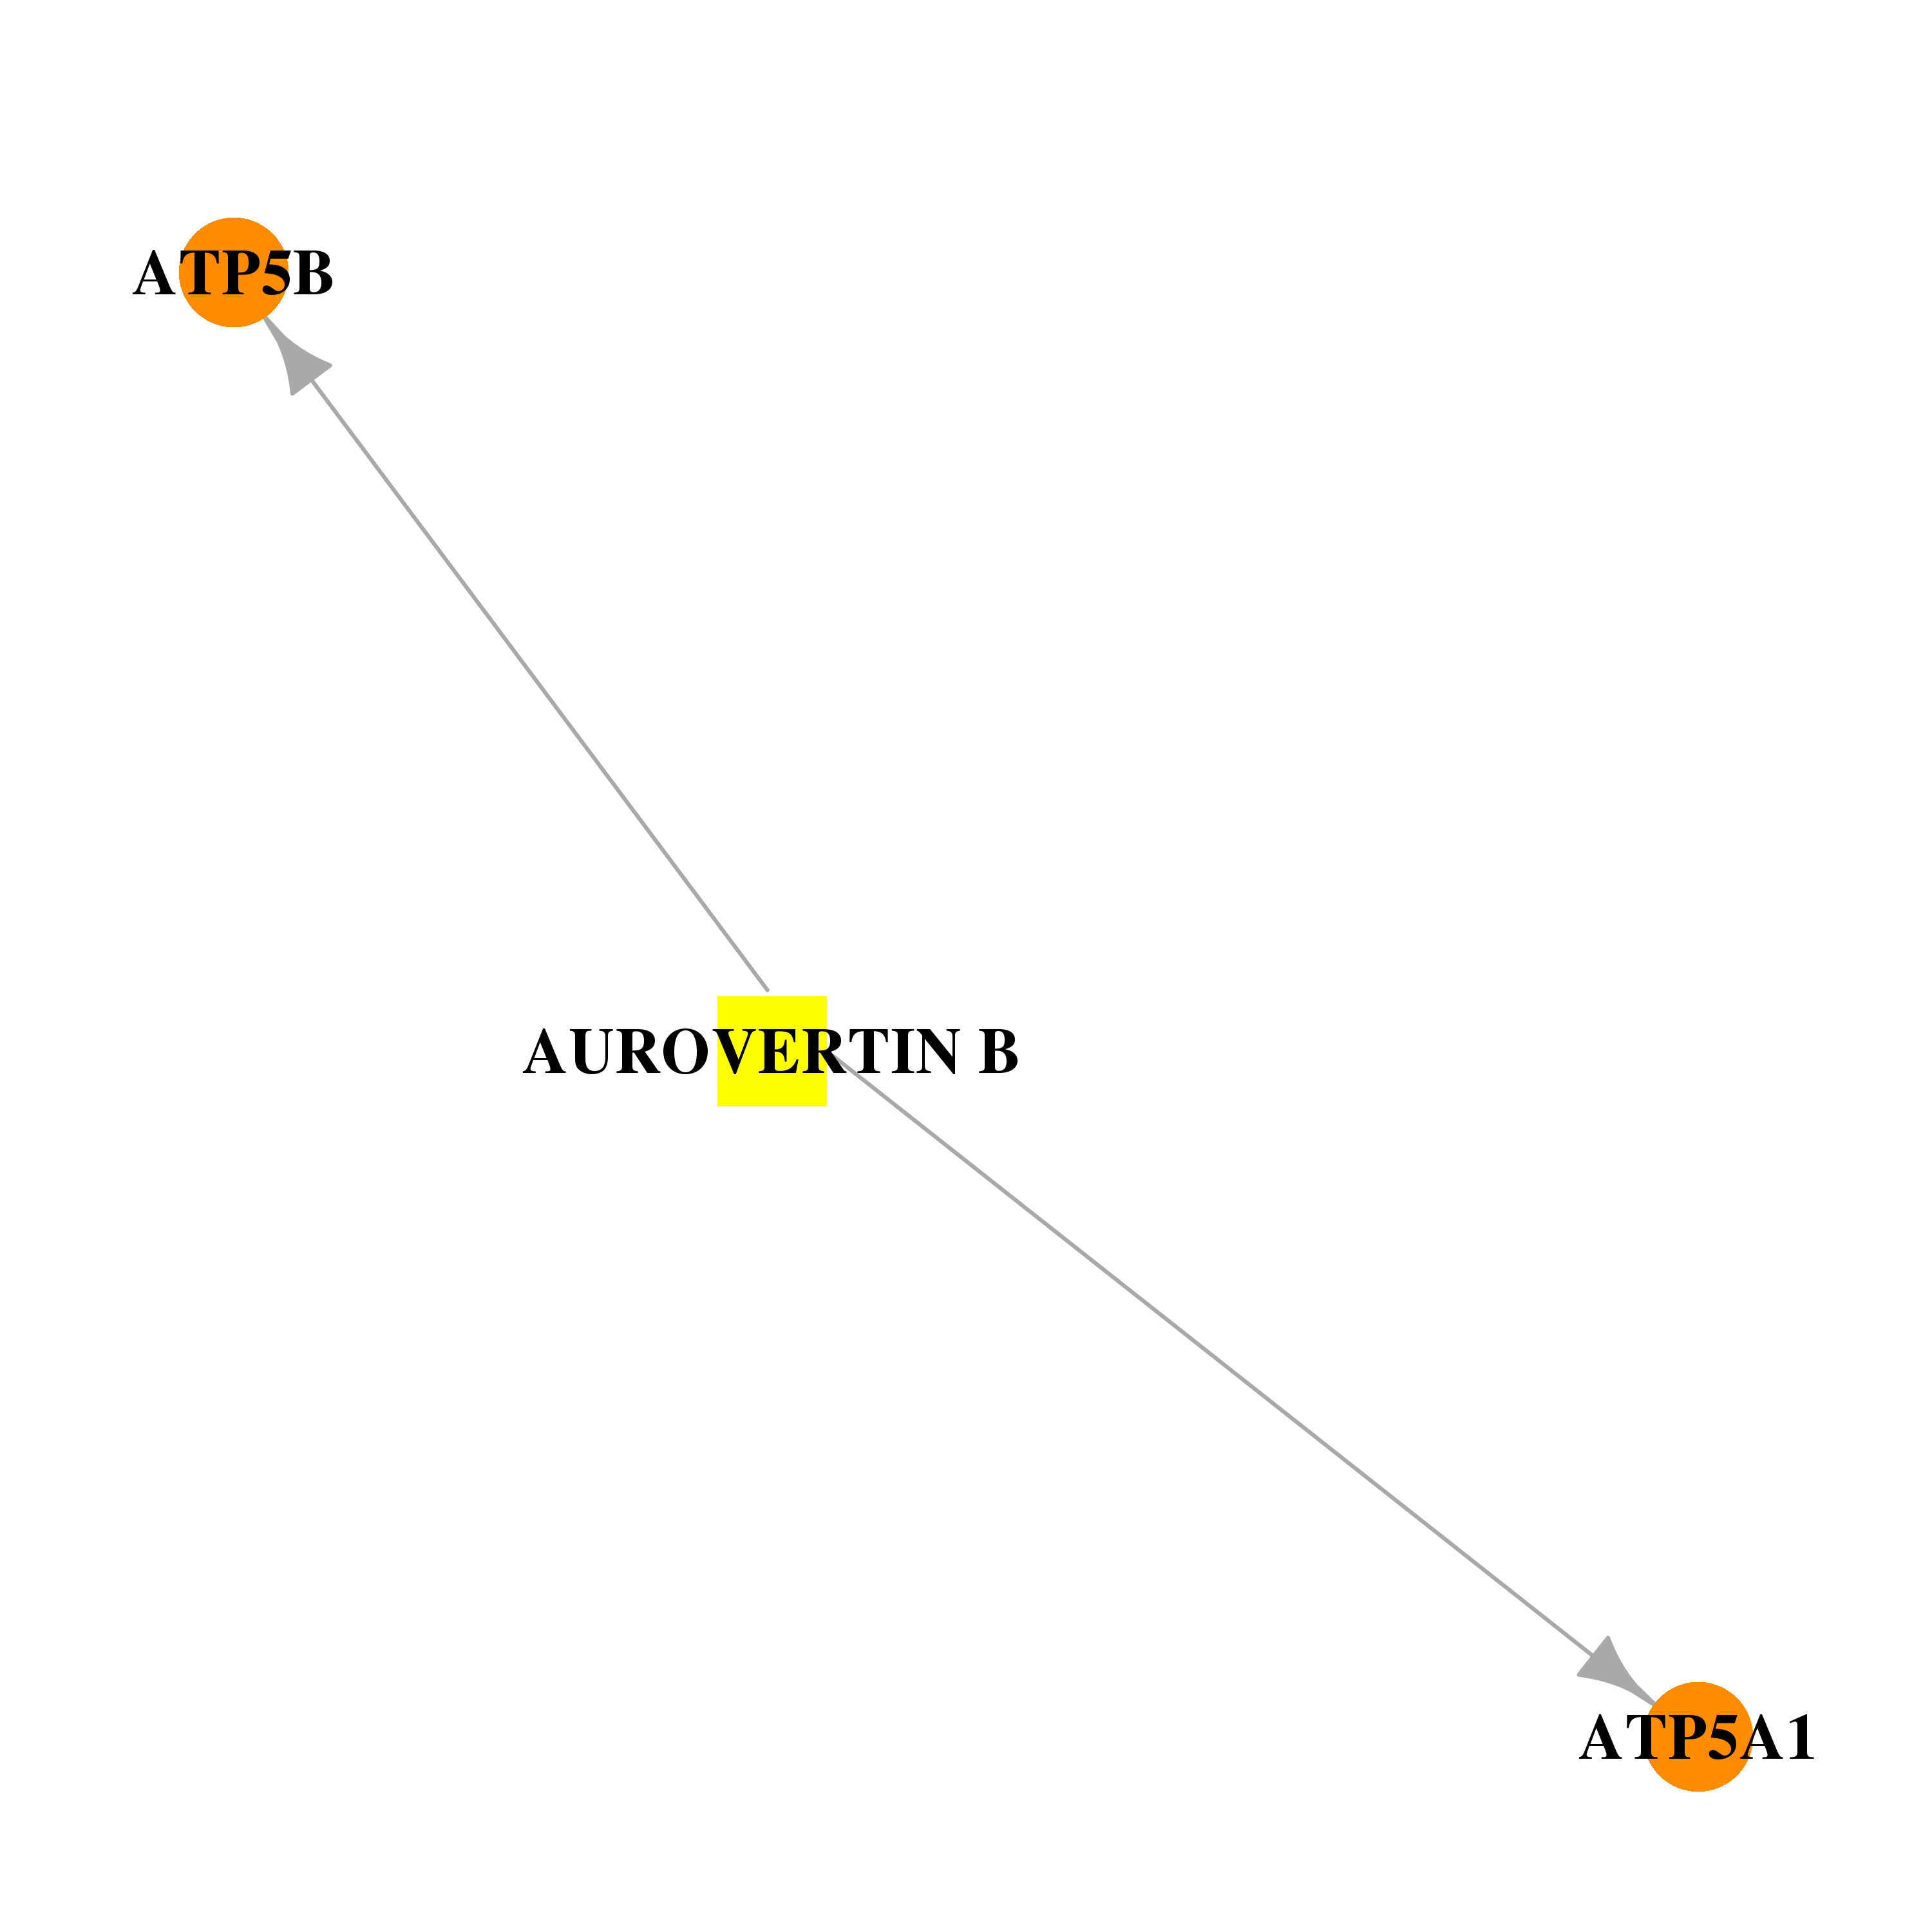 | 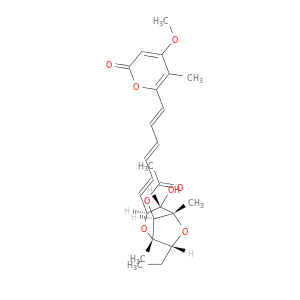 |
| DB08399 | ATP synthase, H+ transporting, mitochondrial F1 complex, beta polypeptide | experimental | PICEATANNOL | 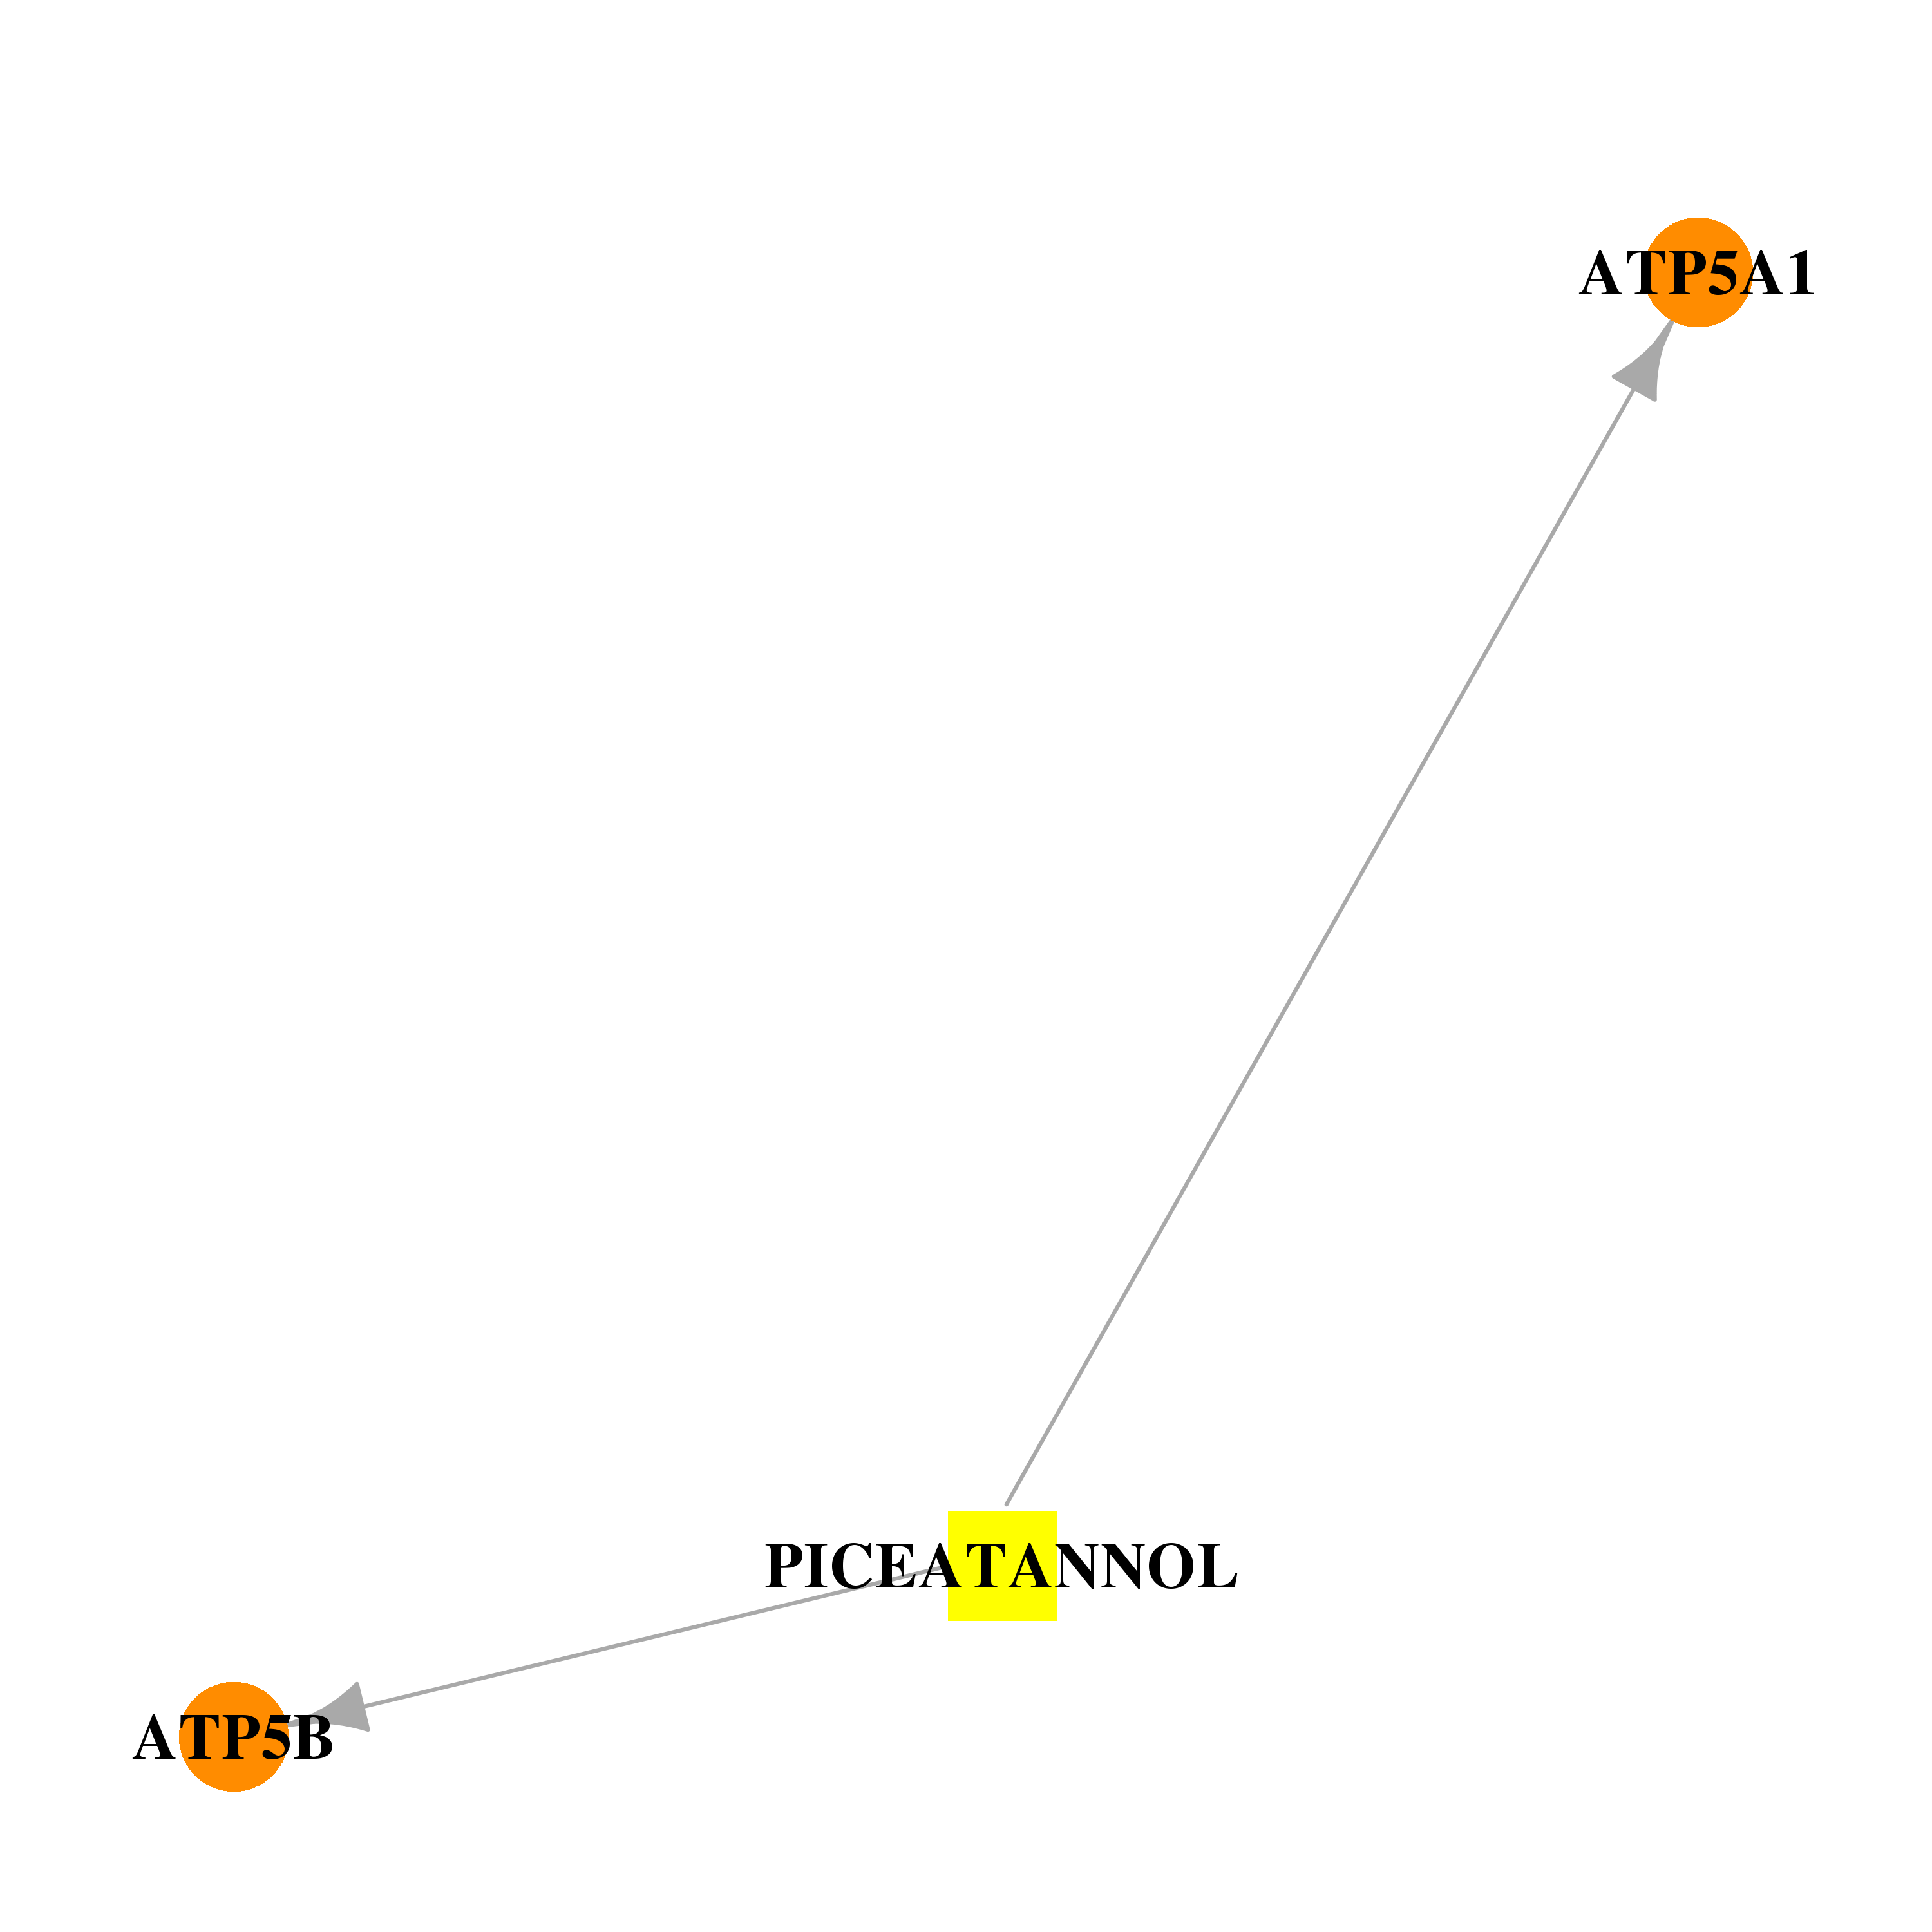 | 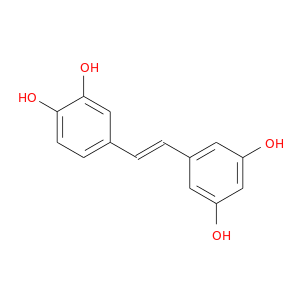 |
| DB08629 | ATP synthase, H+ transporting, mitochondrial F1 complex, beta polypeptide | experimental | N1-(2-AMINO-4-METHYLPENTYL)OCTAHYDRO-PYRROLO[1,2-A] PYRIMIDINE | 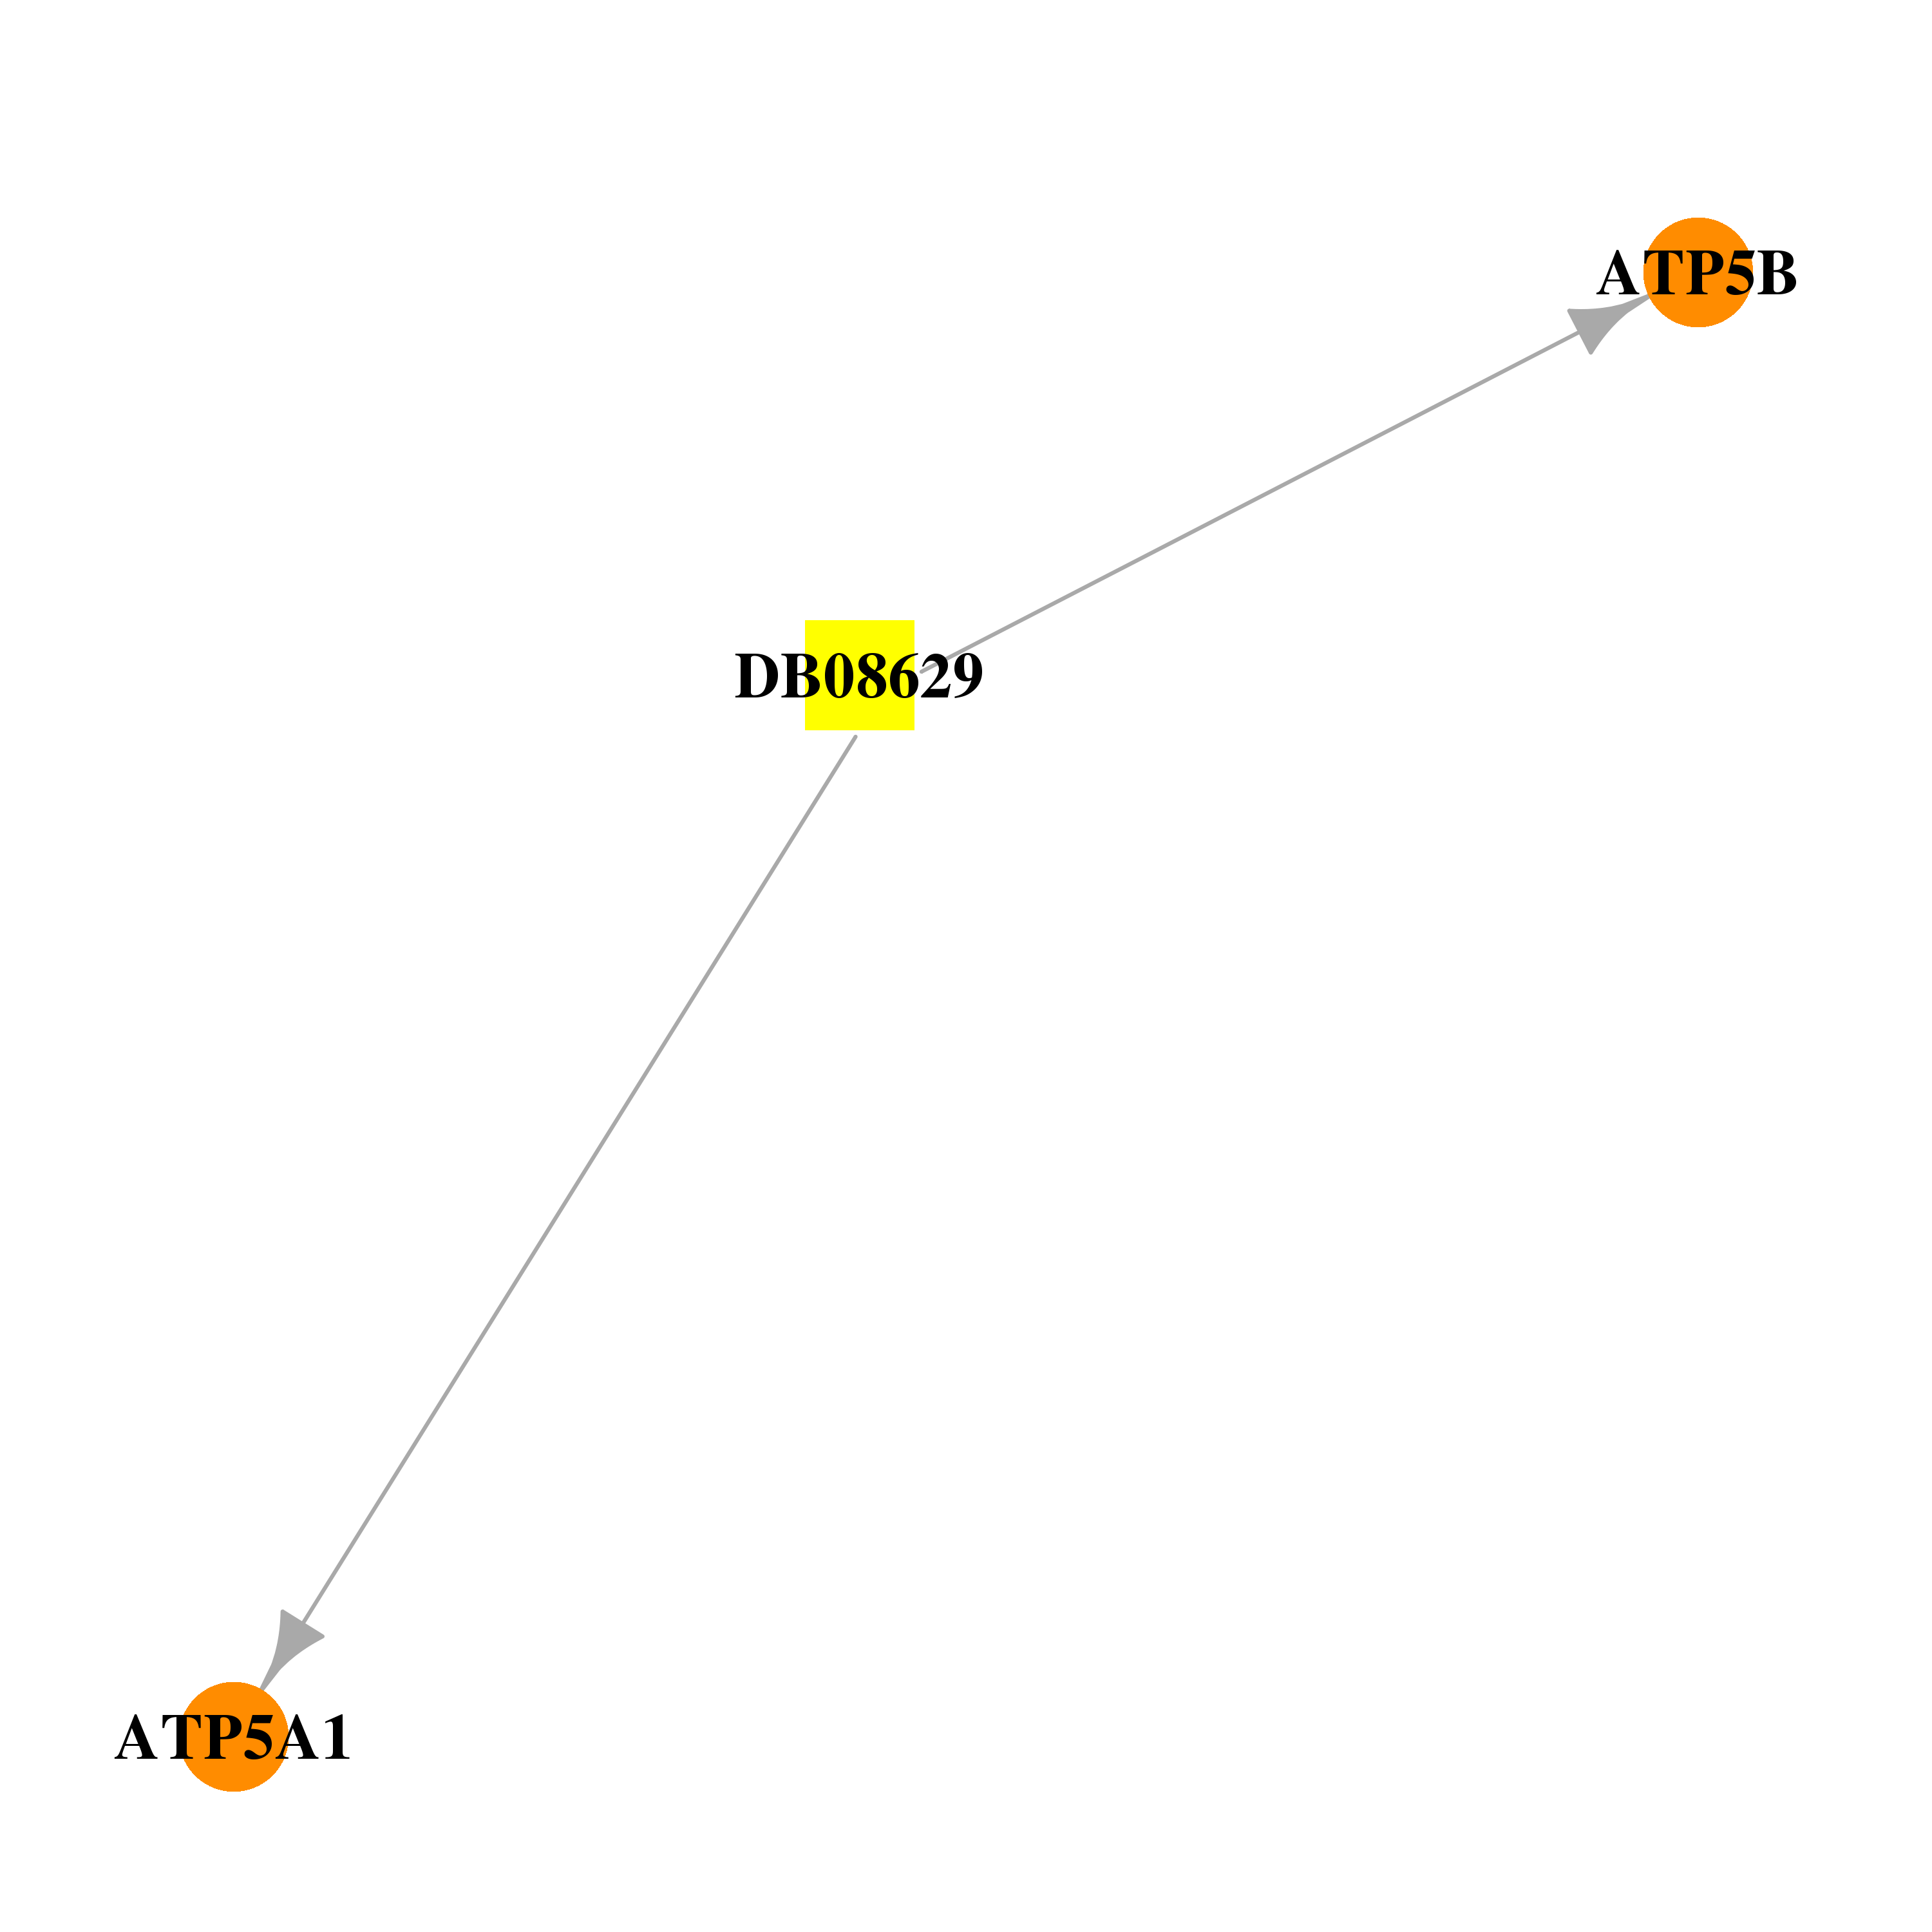 |  |
| Top |
| Cross referenced IDs for ATP5B |
| * We obtained these cross-references from Uniprot database. It covers 150 different DBs, 18 categories. http://www.uniprot.org/help/cross_references_section |
: Open all cross reference information
|
Copyright © 2016-Present - The Univsersity of Texas Health Science Center at Houston @ |