|
||||||||||||||||||||||||||||||||||||||||||||||||||||||||||||||||||||||||||||||||||||||||||||||||||||||||||||||||||||||||||||||||||||||||||||||||||||||||||||||||||||||||||||||||||||||||||||||||||||||||||||||||||||||||||||||||||||||||||||||||||||||||||||||||||||||||||||||||||||||||||||||||||||||||||||||||||||||||||
| |
| Phenotypic Information (metabolism pathway, cancer, disease, phenome) |
| |
| |
| Gene-Gene Network Information: Co-Expression Network, Interacting Genes & KEGG |
| |
|


| Gene Summary for PAX6 |
| Top |
| Phenotypic Information for PAX6(metabolism pathway, cancer, disease, phenome) |
| Cancer | CGAP: PAX6 |
| Familial Cancer Database: PAX6 | |
| * This gene is included in those cancer gene databases. |
|
|
|
|
|
| . | ||||||||||||||||||||||||||||||||||||||||||||||||||||||||||||||||||||||||||||||||||||||||||||||||||||||||||||||||||||||||||||||||||||||||||||||||||||||||||||||||||||||||||||||||||||||||||||||||||||||||||||||||||||||||||||||||||||||||||||||||||||||||||||||||||||||||||||||||||||||||||||||||||||||||||||||||||||
Oncogene 1 | Significant driver gene in | |||||||||||||||||||||||||||||||||||||||||||||||||||||||||||||||||||||||||||||||||||||||||||||||||||||||||||||||||||||||||||||||||||||||||||||||||||||||||||||||||||||||||||||||||||||||||||||||||||||||||||||||||||||||||||||||||||||||||||||||||||||||||||||||||||||||||||||||||||||||||||||||||||||||||||||||||||||||||
| cf) number; DB name 1 Oncogene; http://nar.oxfordjournals.org/content/35/suppl_1/D721.long, 2 Tumor Suppressor gene; https://bioinfo.uth.edu/TSGene/, 3 Cancer Gene Census; http://www.nature.com/nrc/journal/v4/n3/abs/nrc1299.html, 4 CancerGenes; http://nar.oxfordjournals.org/content/35/suppl_1/D721.long, 5 Network of Cancer Gene; http://ncg.kcl.ac.uk/index.php, 1Therapeutic Vulnerabilities in Cancer; http://cbio.mskcc.org/cancergenomics/statius/ |
| REACTOME_INTEGRATION_OF_ENERGY_METABOLISM | |
| OMIM | 106210; phenotype. 120200; phenotype. 120430; phenotype. 136520; phenotype. 148190; phenotype. 165550; phenotype. 206700; phenotype. 604229; phenotype. 607108; gene. |
| Orphanet | 1065; Aniridia - cerebellar ataxia - intellectual disability. 137902; Isolated optic nerve hypoplasia. 194; Ocular coloboma. 2253; Foveal hypoplasia - presenile cataract. 2334; Autosomal dominant keratitis. 250923; Isolated aniridia. 35737; Morning glory syndrome. 708; Peters anomaly. 893; WAGR syndrome. |
| Disease | KEGG Disease: PAX6 |
| MedGen: PAX6 (Human Medical Genetics with Condition) | |
| ClinVar: PAX6 | |
| Phenotype | MGI: PAX6 (International Mouse Phenotyping Consortium) |
| PhenomicDB: PAX6 | |
| Mutations for PAX6 |
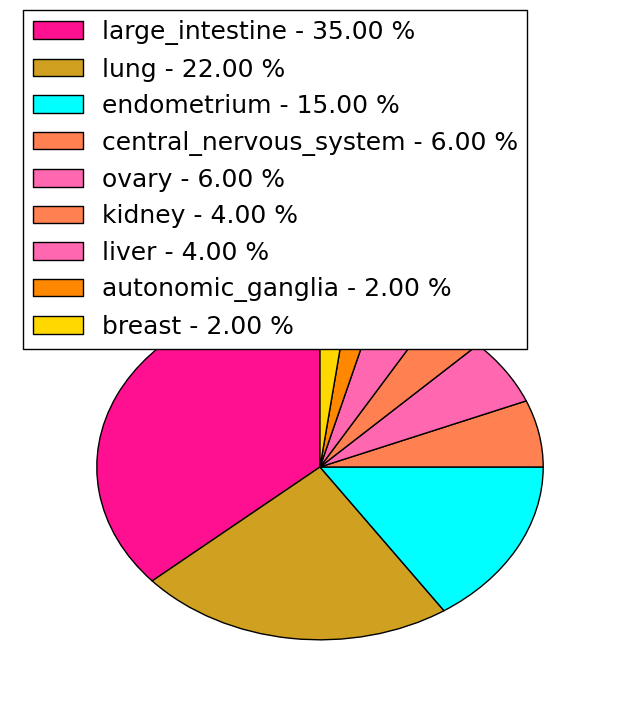
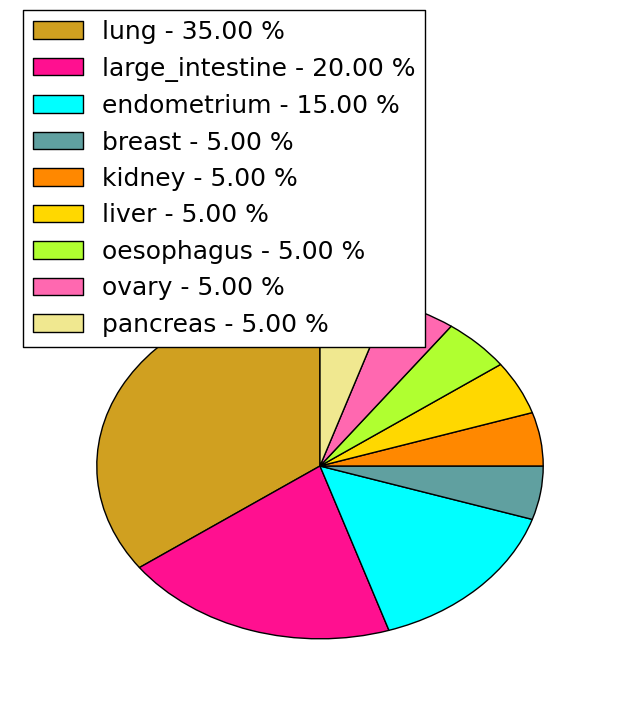
| * Under tables are showing count per each tissue to give us broad intuition about tissue specific mutation patterns.You can go to the detailed page for each mutation database's web site. |
| - Statistics for Tissue and Mutation type | Top |
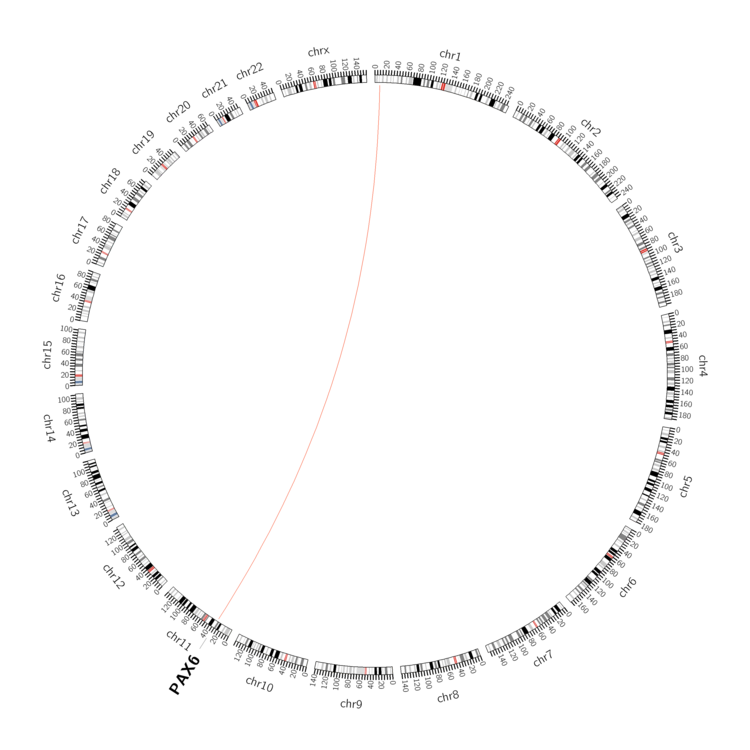 |
| - For Inter-chromosomal Variations |
| * Inter-chromosomal variantions includes 'interchromosomal amplicon to amplicon', 'interchromosomal amplicon to non-amplified dna', 'interchromosomal insertion', 'Interchromosomal unknown type'. |
 |
| - For Intra-chromosomal Variations |
| There's no intra-chromosomal structural variation. |
| Sample | Symbol_a | Chr_a | Start_a | End_a | Symbol_b | Chr_b | Start_b | End_b |
| cf) Tissue number; Tissue name (1;Breast, 2;Central_nervous_system, 3;Haematopoietic_and_lymphoid_tissue, 4;Large_intestine, 5;Liver, 6;Lung, 7;Ovary, 8;Pancreas, 9;Prostate, 10;Skin, 11;Soft_tissue, 12;Upper_aerodigestive_tract) |
| * From mRNA Sanger sequences, Chitars2.0 arranged chimeric transcripts. This table shows PAX6 related fusion information. |
| ID | Head Gene | Tail Gene | Accession | Gene_a | qStart_a | qEnd_a | Chromosome_a | tStart_a | tEnd_a | Gene_a | qStart_a | qEnd_a | Chromosome_a | tStart_a | tEnd_a |
| M86017 | PAX6 | 1 | 119 | 11 | 31811059 | 31811177 | CTNNA1 | 120 | 311 | 5 | 138124956 | 138125147 | |
| W21798 | PAX6 | 65 | 240 | 11 | 31832695 | 31832870 | PAX6 | 232 | 464 | 11 | 31828397 | 31832531 | |
| EB361003 | PAX6 | 1 | 391 | 11 | 31811465 | 31815220 | PAX6 | 387 | 681 | 11 | 31810938 | 31811232 | |
| Top |
| Mutation type/ Tissue ID | brca | cns | cerv | endome | haematopo | kidn | Lintest | liver | lung | ns | ovary | pancre | prost | skin | stoma | thyro | urina | |||
| Total # sample | 1 | |||||||||||||||||||
| GAIN (# sample) | 1 | |||||||||||||||||||
| LOSS (# sample) |
| cf) Tissue ID; Tissue type (1; Breast, 2; Central_nervous_system, 3; Cervix, 4; Endometrium, 5; Haematopoietic_and_lymphoid_tissue, 6; Kidney, 7; Large_intestine, 8; Liver, 9; Lung, 10; NS, 11; Ovary, 12; Pancreas, 13; Prostate, 14; Skin, 15; Stomach, 16; Thyroid, 17; Urinary_tract) |
| Top |
|
 |
| Top |
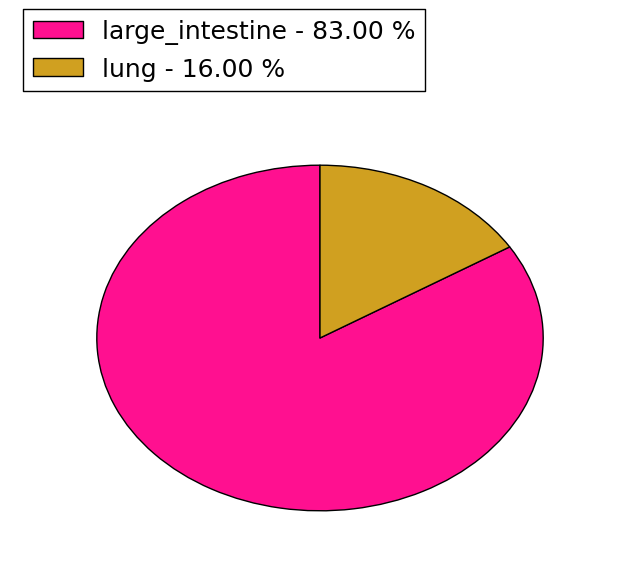
| Stat. for Non-Synonymous SNVs (# total SNVs=45) | (# total SNVs=20) |
 |  |
(# total SNVs=6) | (# total SNVs=4) |
 | 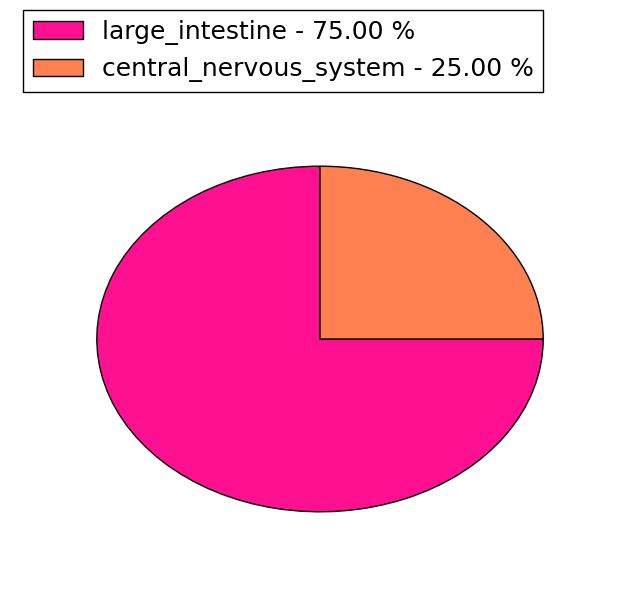 |
| Top |
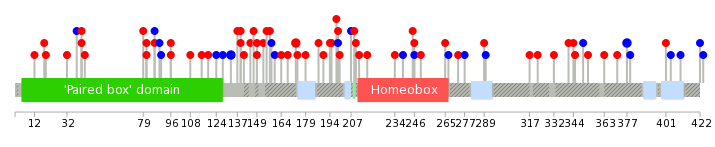
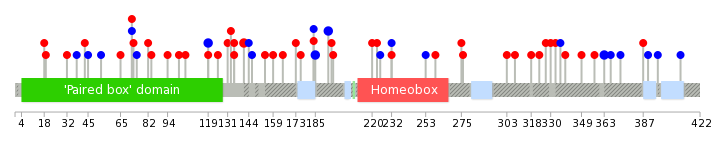
| * When you move the cursor on each content, you can see more deailed mutation information on the Tooltip. Those are primary_site,primary_histology,mutation(aa),pubmedID. |
| GRCh37 position | Mutation(aa) | Unique sampleID count |
| chr11:31812317-31812317 | p.P389fs*7 | 6 |
| chr11:31812316-31812317 | p.H390fs*36 | 2 |
| chr11:31823109-31823109 | p.S133S | 2 |
| chr11:31823266-31823266 | p.R81I | 2 |
| chr11:31812352-31812352 | p.S377S | 2 |
| chr11:31815103-31815103 | p.? | 2 |
| chr11:31822286-31822286 | p.R173H | 2 |
| chr11:31812409-31812409 | p.? | 2 |
| chr11:31822388-31822388 | p.R139I | 1 |
| chr11:31811563-31811563 | p.L410L | 1 |
| Top |
|
 |
| Point Mutation/ Tissue ID | 1 | 2 | 3 | 4 | 5 | 6 | 7 | 8 | 9 | 10 | 11 | 12 | 13 | 14 | 15 | 16 | 17 | 18 | 19 | 20 |
| # sample | 1 | 1 | 14 | 1 | 3 | 1 | 13 | 3 | 3 | 5 | 10 | 8 | ||||||||
| # mutation | 1 | 1 | 15 | 1 | 3 | 1 | 14 | 3 | 3 | 5 | 11 | 10 | ||||||||
| nonsynonymous SNV | 11 | 1 | 2 | 8 | 1 | 2 | 5 | 7 | 7 | |||||||||||
| synonymous SNV | 1 | 1 | 4 | 1 | 1 | 6 | 2 | 1 | 4 | 3 |
| cf) Tissue ID; Tissue type (1; BLCA[Bladder Urothelial Carcinoma], 2; BRCA[Breast invasive carcinoma], 3; CESC[Cervical squamous cell carcinoma and endocervical adenocarcinoma], 4; COAD[Colon adenocarcinoma], 5; GBM[Glioblastoma multiforme], 6; Glioma Low Grade, 7; HNSC[Head and Neck squamous cell carcinoma], 8; KICH[Kidney Chromophobe], 9; KIRC[Kidney renal clear cell carcinoma], 10; KIRP[Kidney renal papillary cell carcinoma], 11; LAML[Acute Myeloid Leukemia], 12; LUAD[Lung adenocarcinoma], 13; LUSC[Lung squamous cell carcinoma], 14; OV[Ovarian serous cystadenocarcinoma ], 15; PAAD[Pancreatic adenocarcinoma], 16; PRAD[Prostate adenocarcinoma], 17; SKCM[Skin Cutaneous Melanoma], 18:STAD[Stomach adenocarcinoma], 19:THCA[Thyroid carcinoma], 20:UCEC[Uterine Corpus Endometrial Carcinoma]) |
| Top |
| * We represented just top 10 SNVs. When you move the cursor on each content, you can see more deailed mutation information on the Tooltip. Those are primary_site, primary_histology, mutation(aa), pubmedID. |
| Genomic Position | Mutation(aa) | Unique sampleID count |
| chr11:31823109 | p.S119S,PAX6 | 3 |
| chr11:31812352 | p.S363S,PAX6 | 2 |
| chr11:31816281 | p.G141S,PAX6 | 2 |
| chr11:31822341 | p.N193N,PAX6 | 2 |
| chr11:31812271 | p.G165V,PAX6 | 1 |
| chr11:31816333 | p.E82K,PAX6 | 1 |
| chr11:31822371 | p.T373T,PAX6 | 1 |
| chr11:31815038 | p.S259P,PAX6 | 1 |
| chr11:31823252 | p.R159L,PAX6 | 1 |
| chr11:31816185 | p.K75K,PAX6 | 1 |
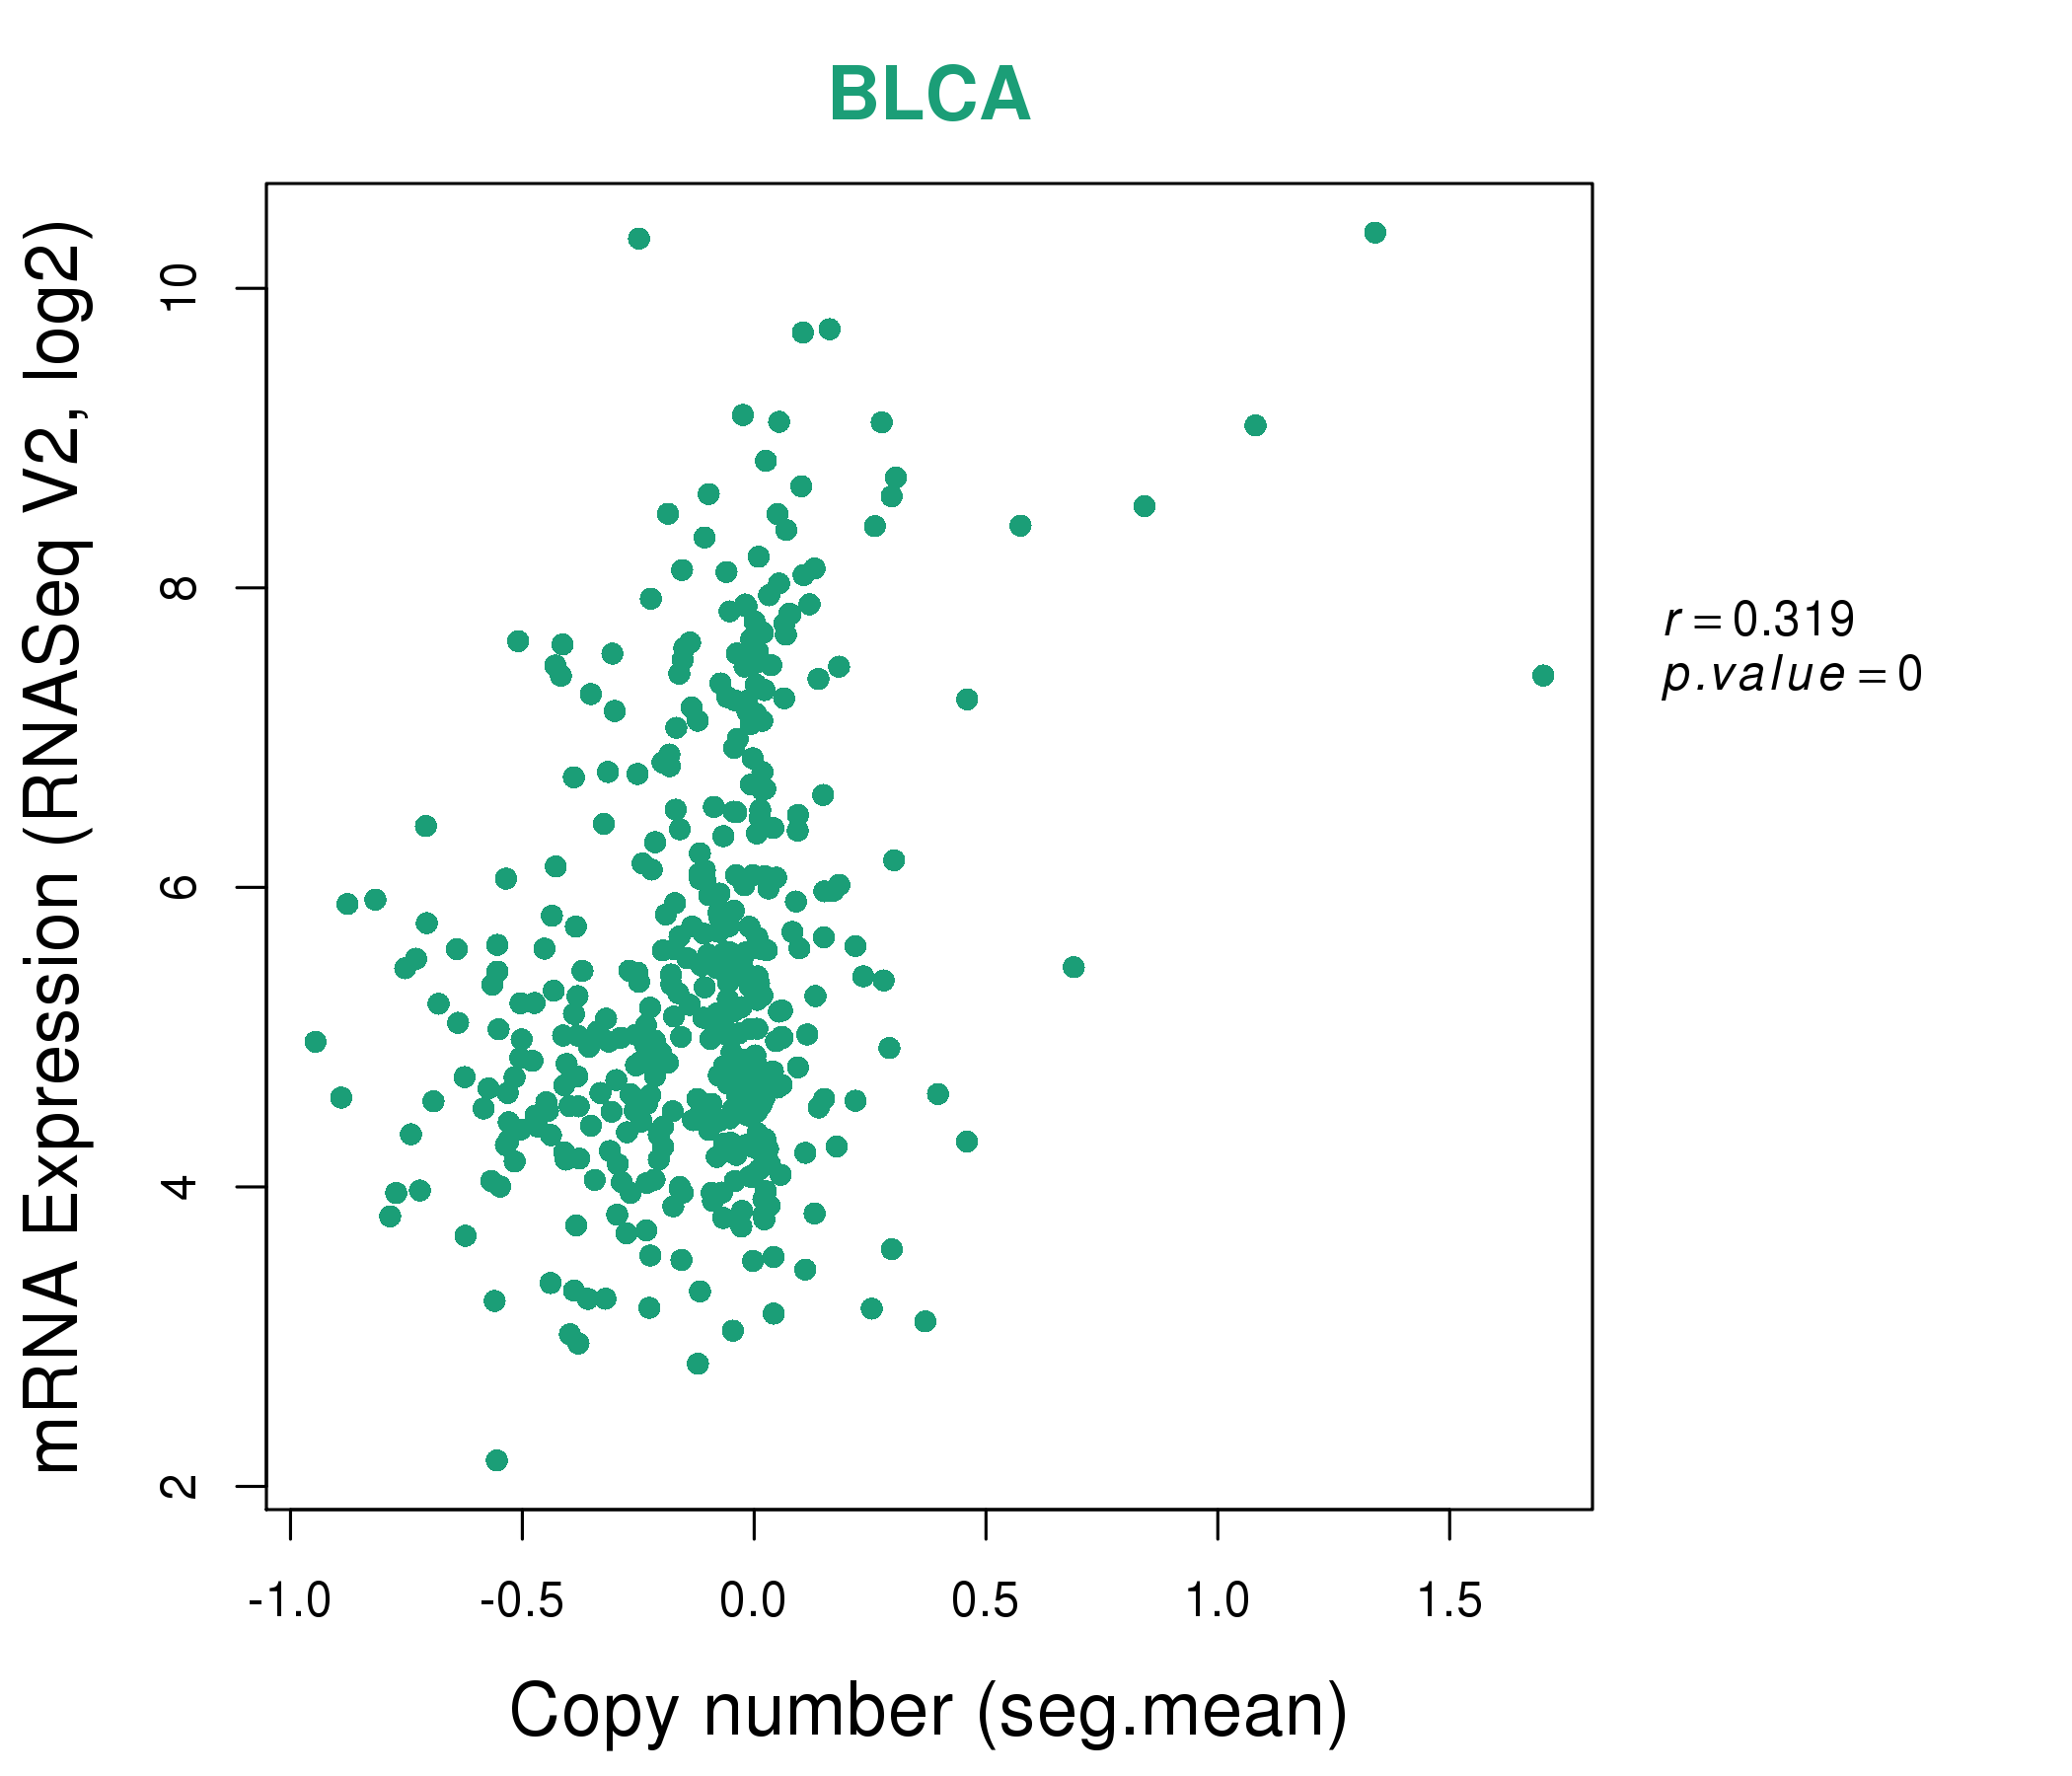
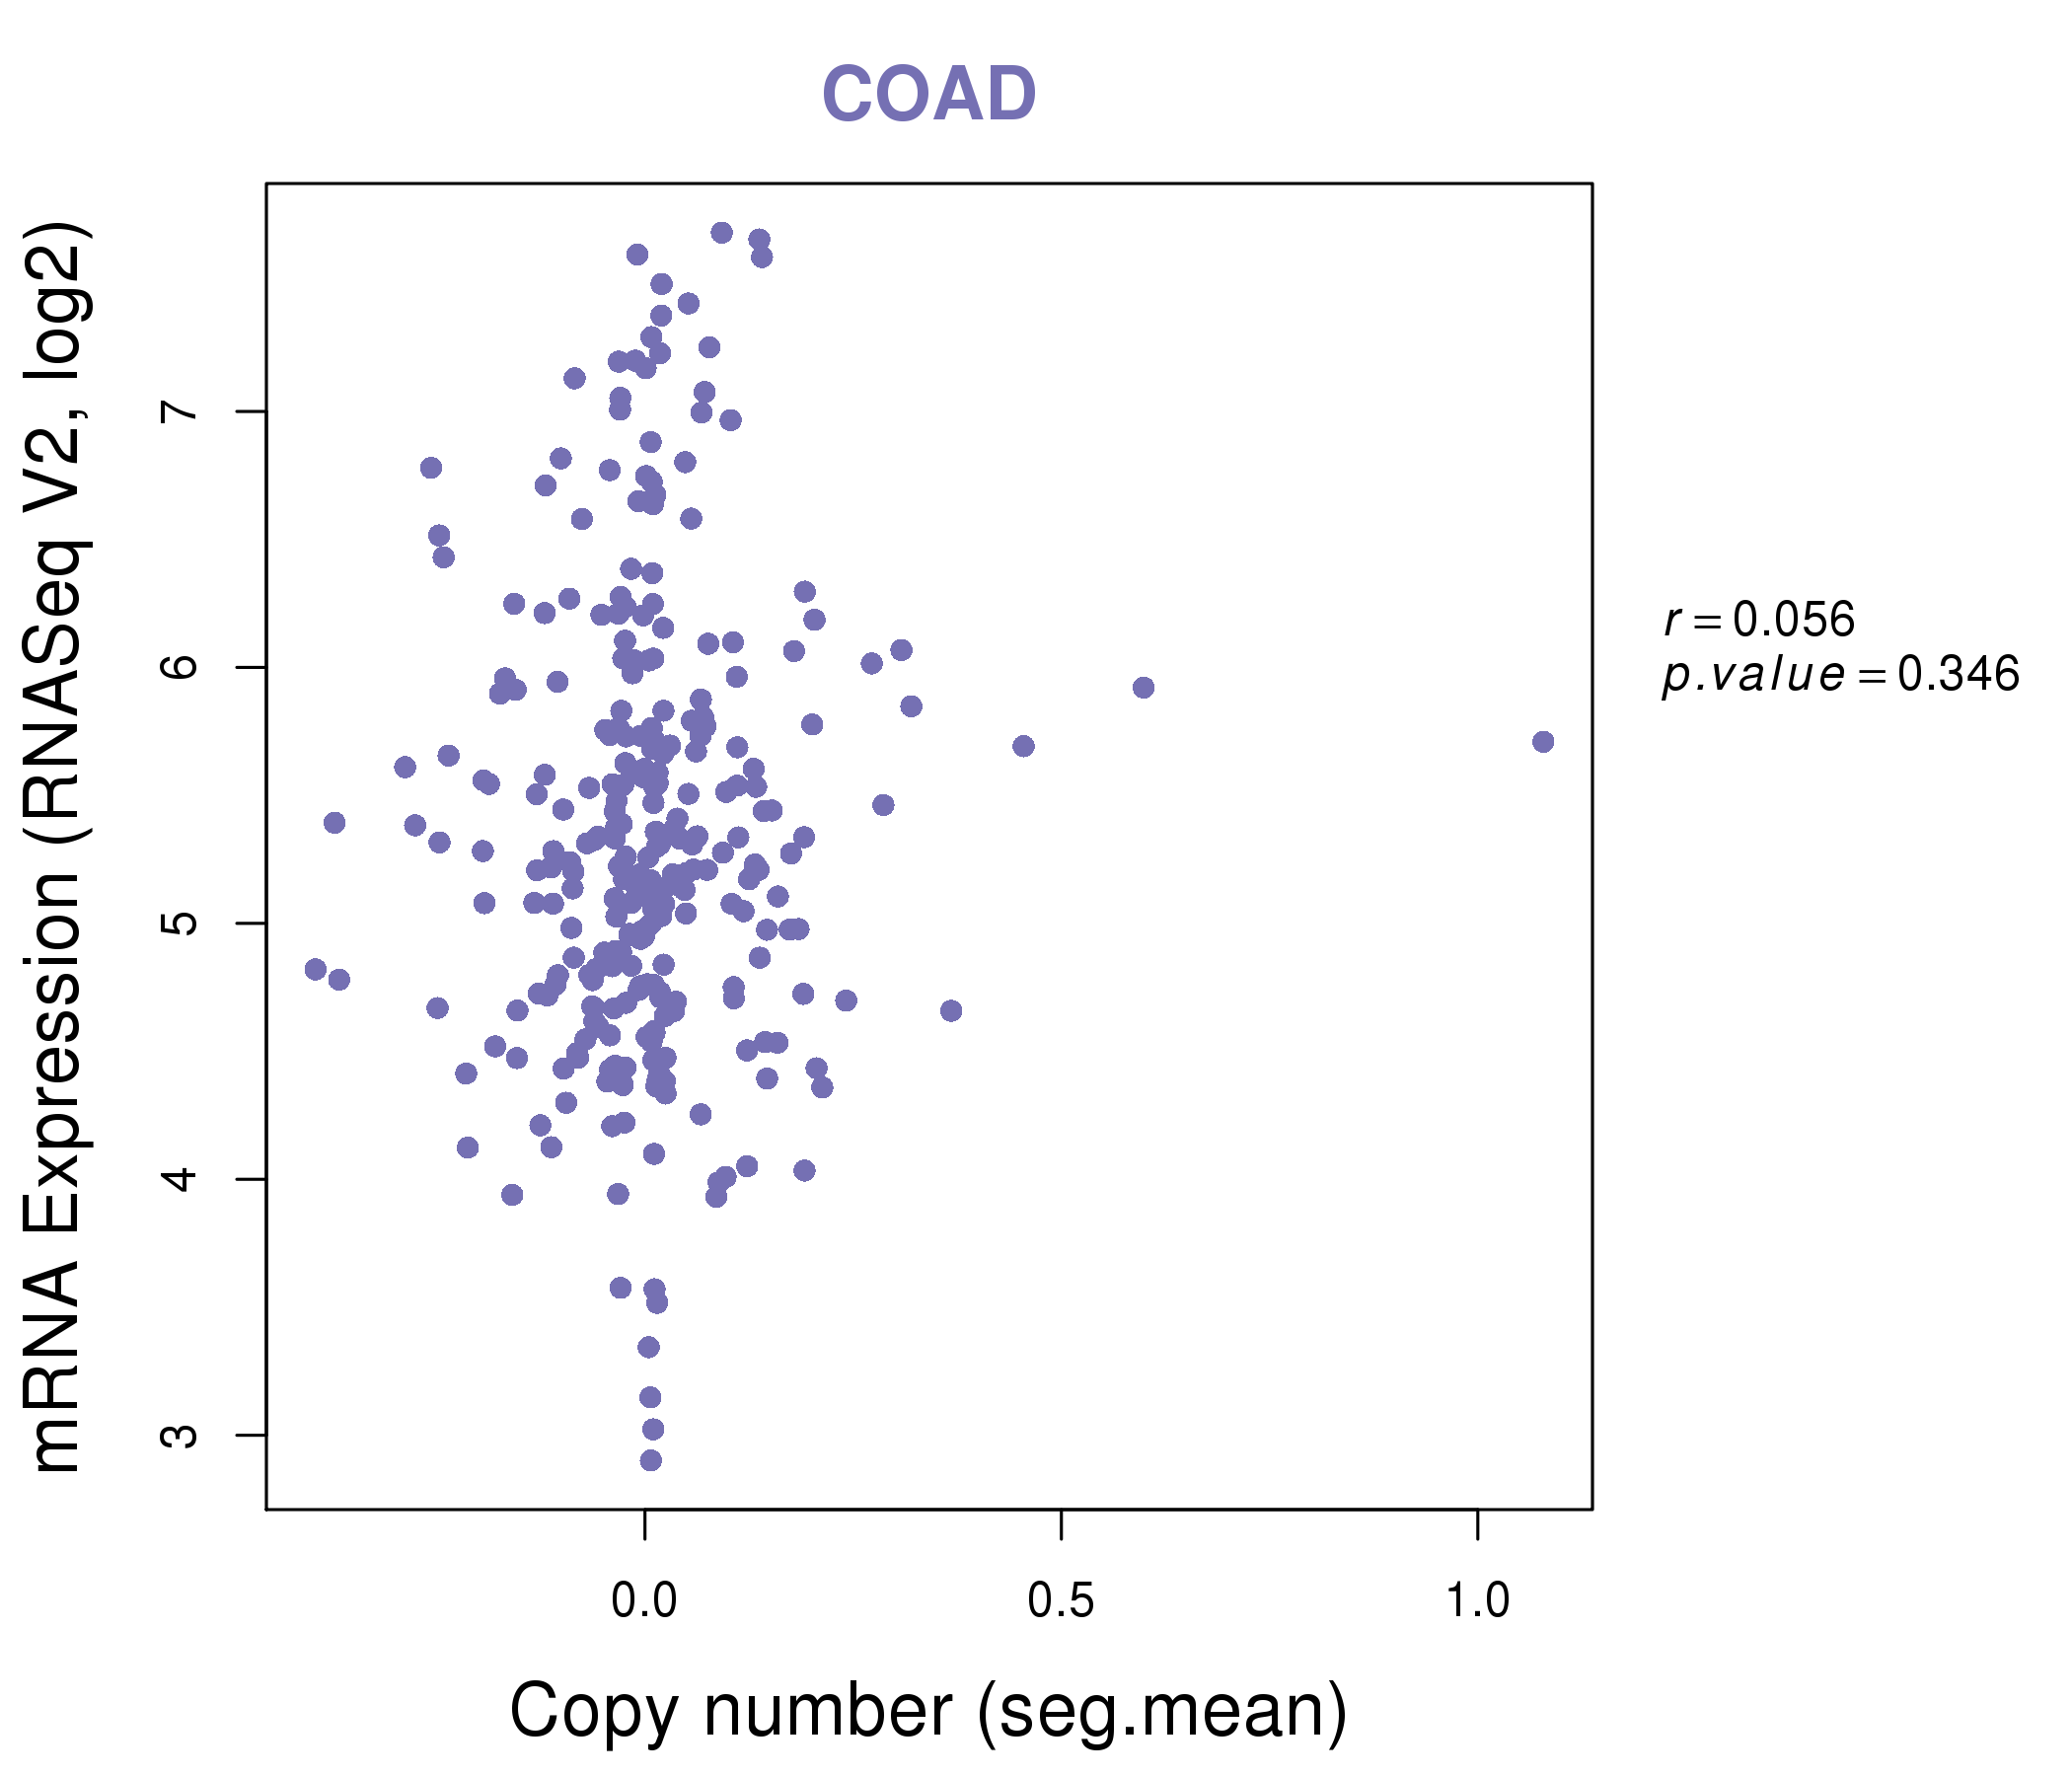
| * Copy number data were extracted from TCGA using R package TCGA-Assembler. The URLs of all public data files on TCGA DCC data server were gathered on Jan-05-2015. Function ProcessCNAData in TCGA-Assembler package was used to obtain gene-level copy number value which is calculated as the average copy number of the genomic region of a gene. |
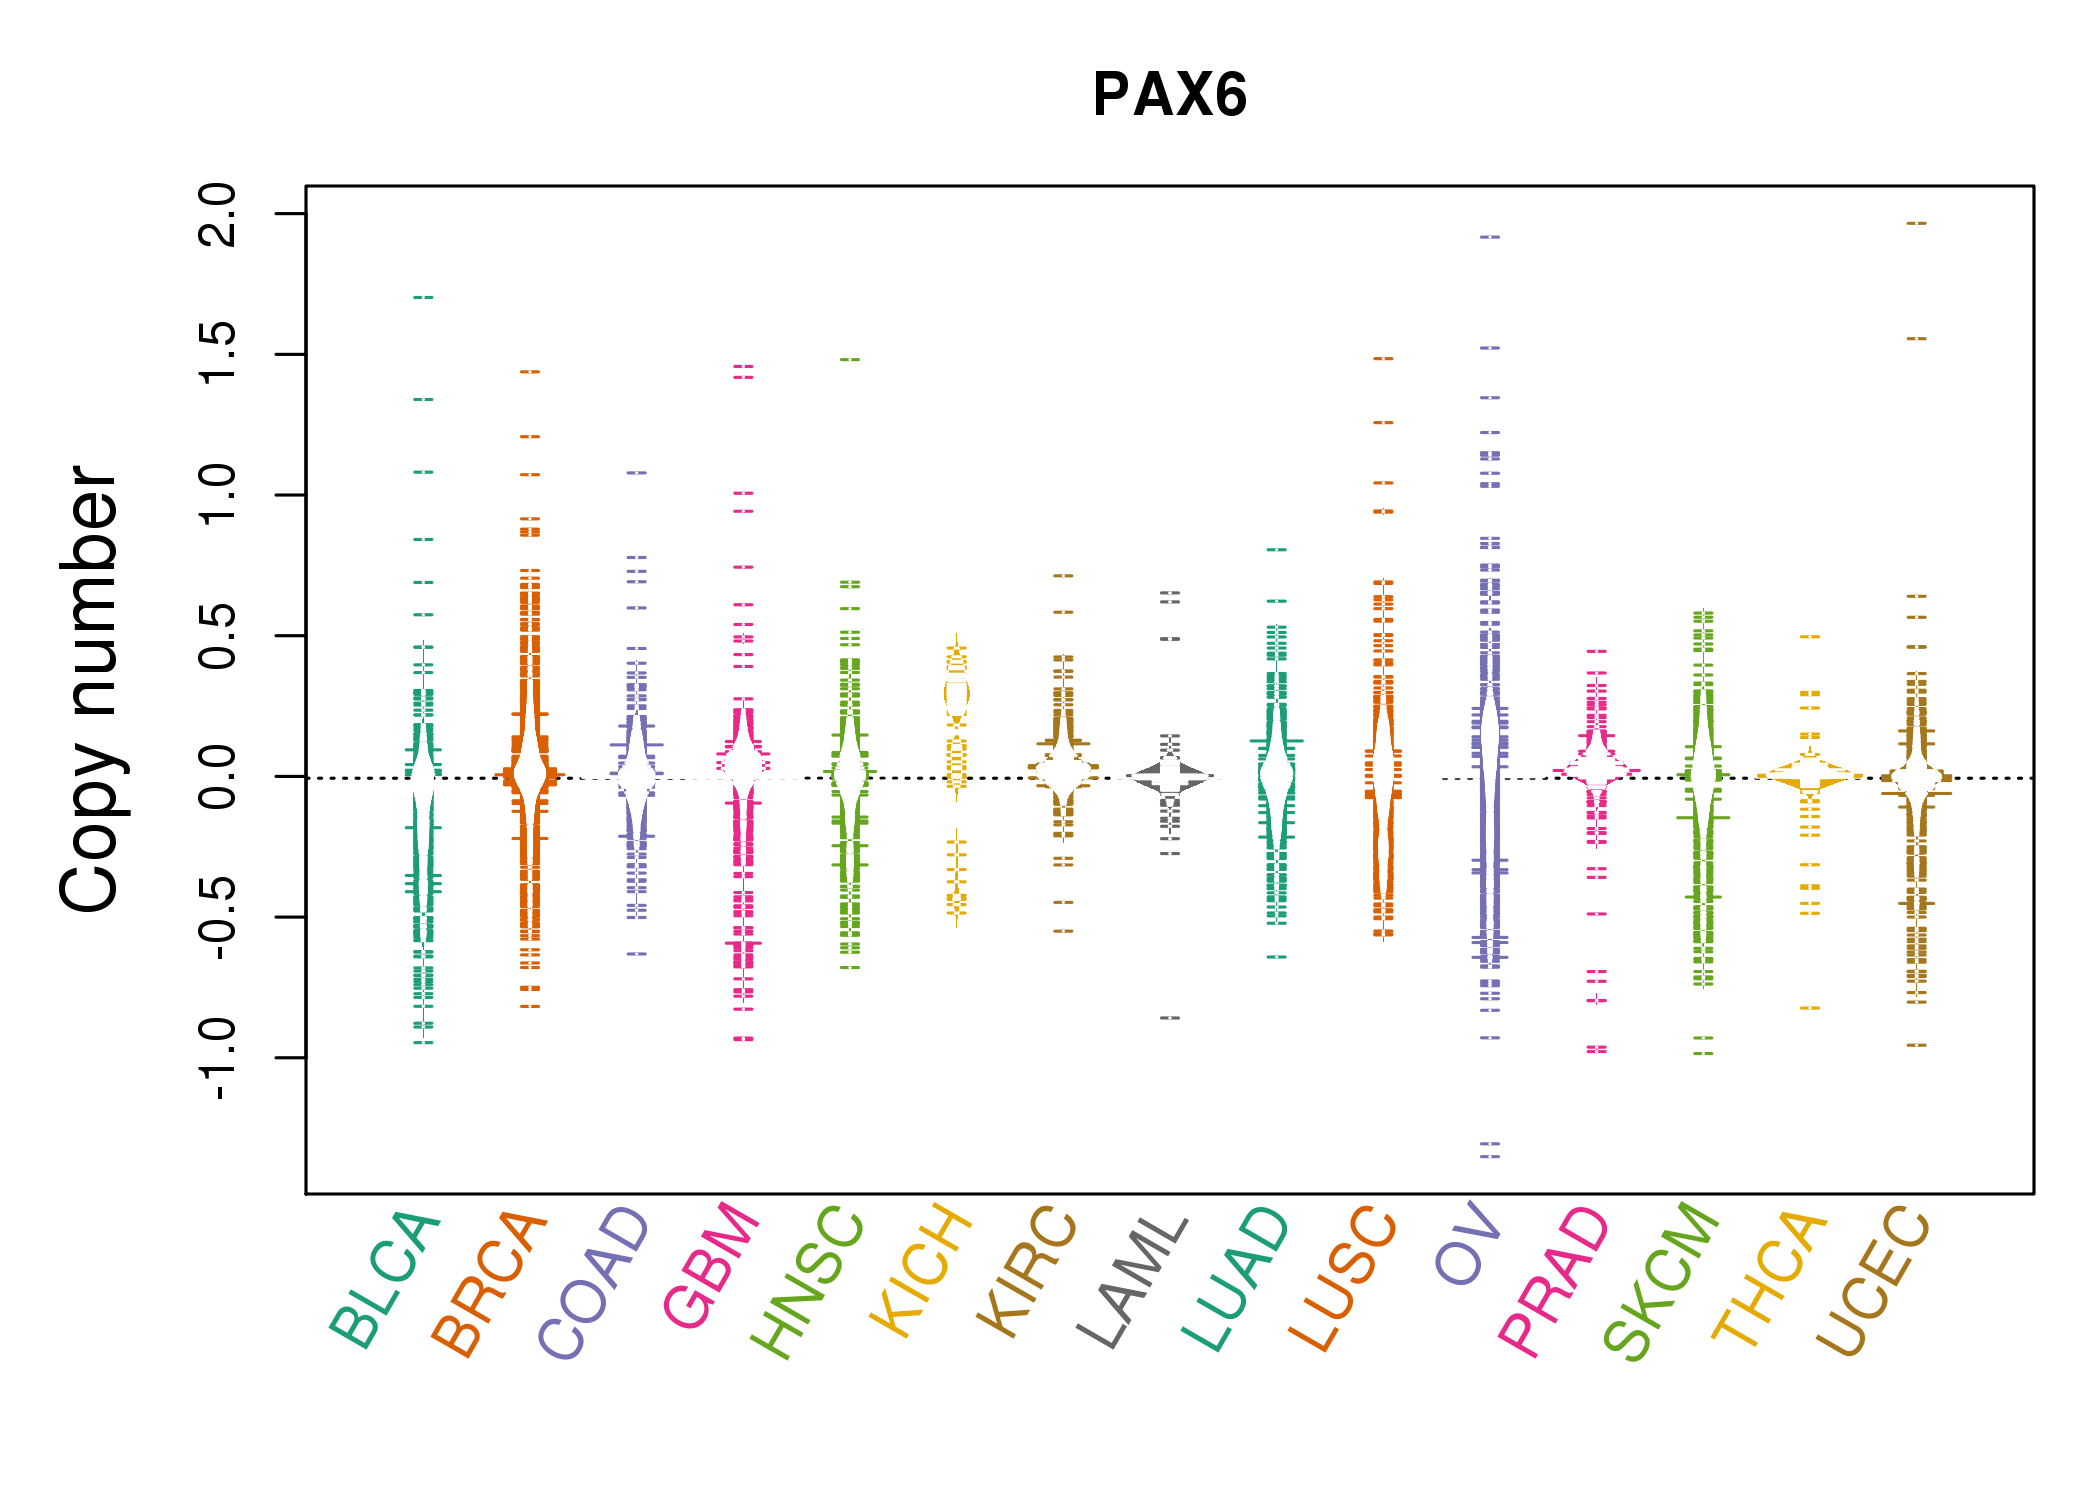 |
| cf) Tissue ID[Tissue type]: BLCA[Bladder Urothelial Carcinoma], BRCA[Breast invasive carcinoma], CESC[Cervical squamous cell carcinoma and endocervical adenocarcinoma], COAD[Colon adenocarcinoma], GBM[Glioblastoma multiforme], Glioma Low Grade, HNSC[Head and Neck squamous cell carcinoma], KICH[Kidney Chromophobe], KIRC[Kidney renal clear cell carcinoma], KIRP[Kidney renal papillary cell carcinoma], LAML[Acute Myeloid Leukemia], LUAD[Lung adenocarcinoma], LUSC[Lung squamous cell carcinoma], OV[Ovarian serous cystadenocarcinoma ], PAAD[Pancreatic adenocarcinoma], PRAD[Prostate adenocarcinoma], SKCM[Skin Cutaneous Melanoma], STAD[Stomach adenocarcinoma], THCA[Thyroid carcinoma], UCEC[Uterine Corpus Endometrial Carcinoma] |
| Top |
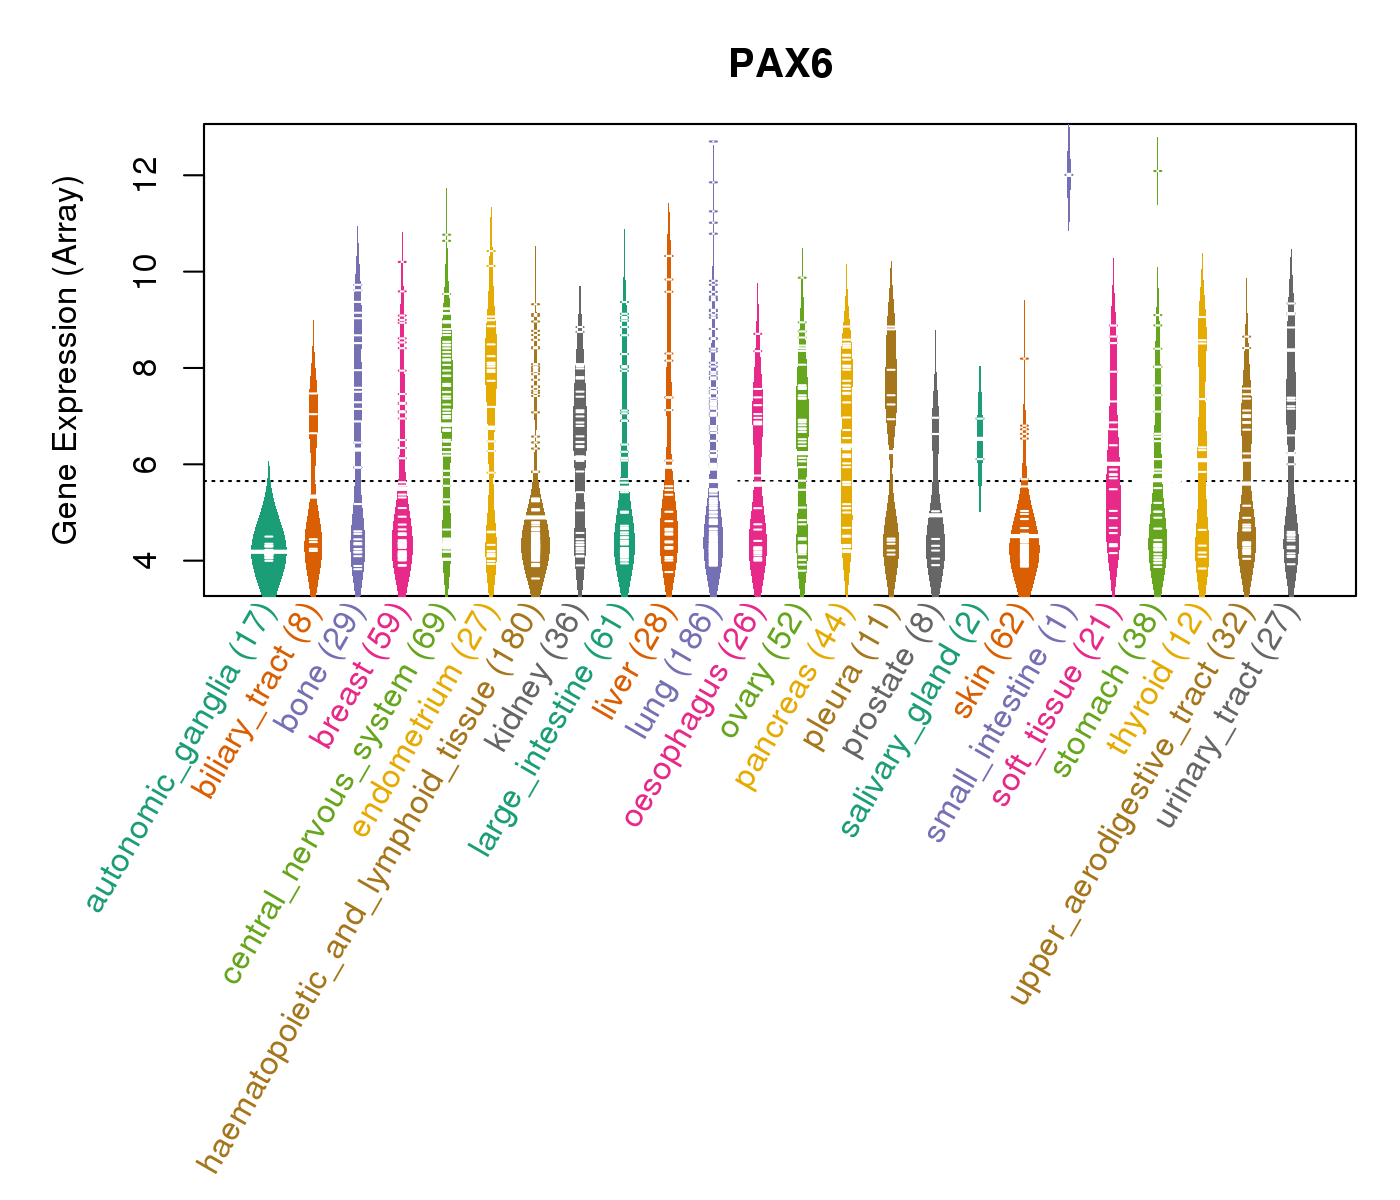
| Gene Expression for PAX6 |
| * CCLE gene expression data were extracted from CCLE_Expression_Entrez_2012-10-18.res: Gene-centric RMA-normalized mRNA expression data. |
 |
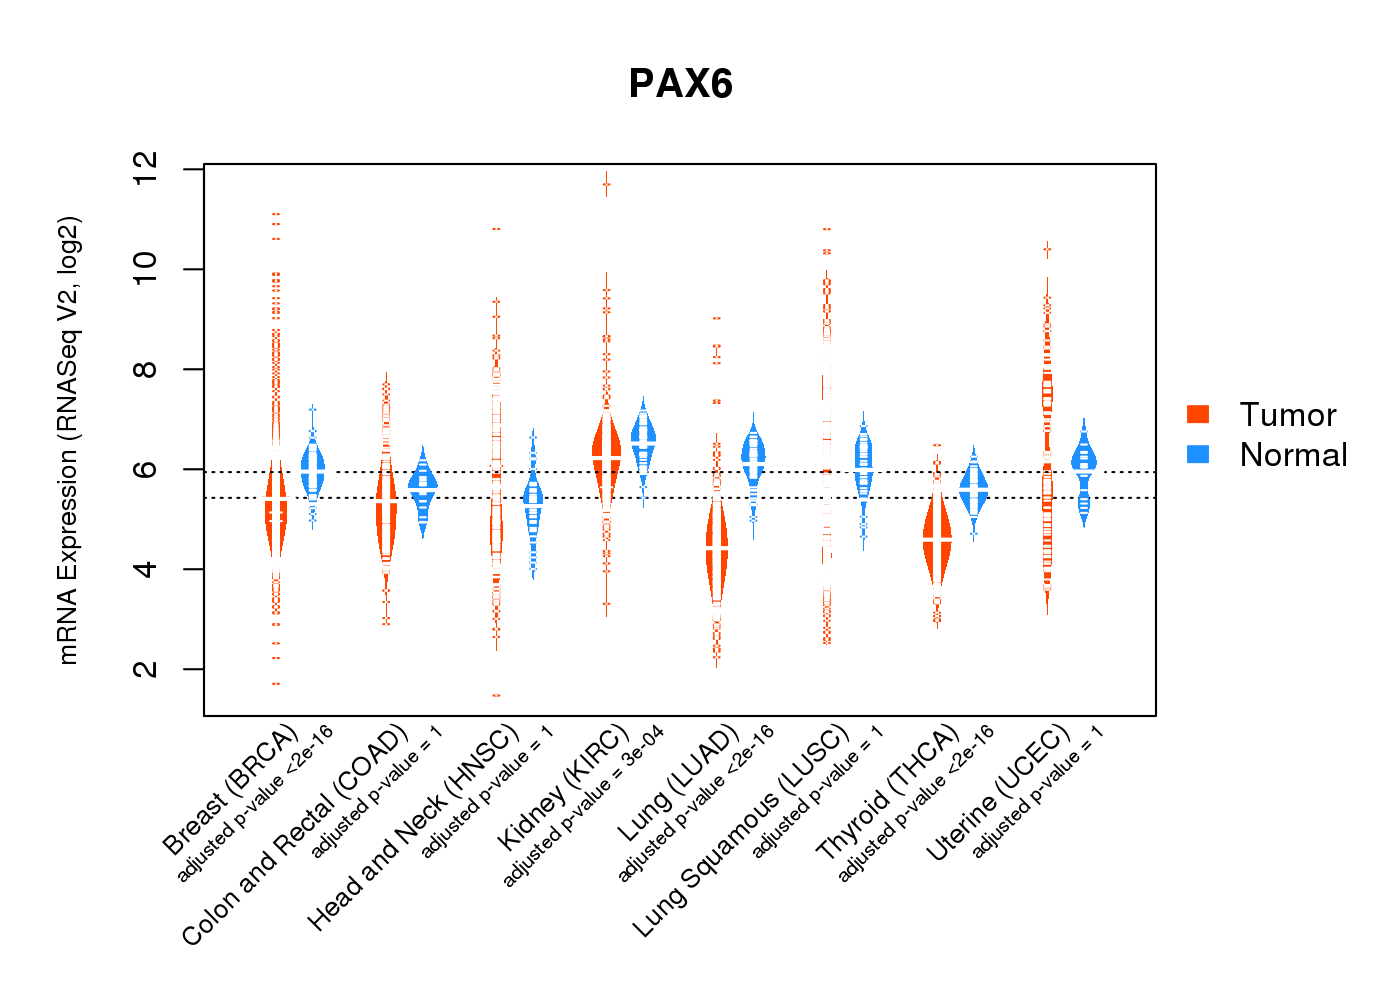
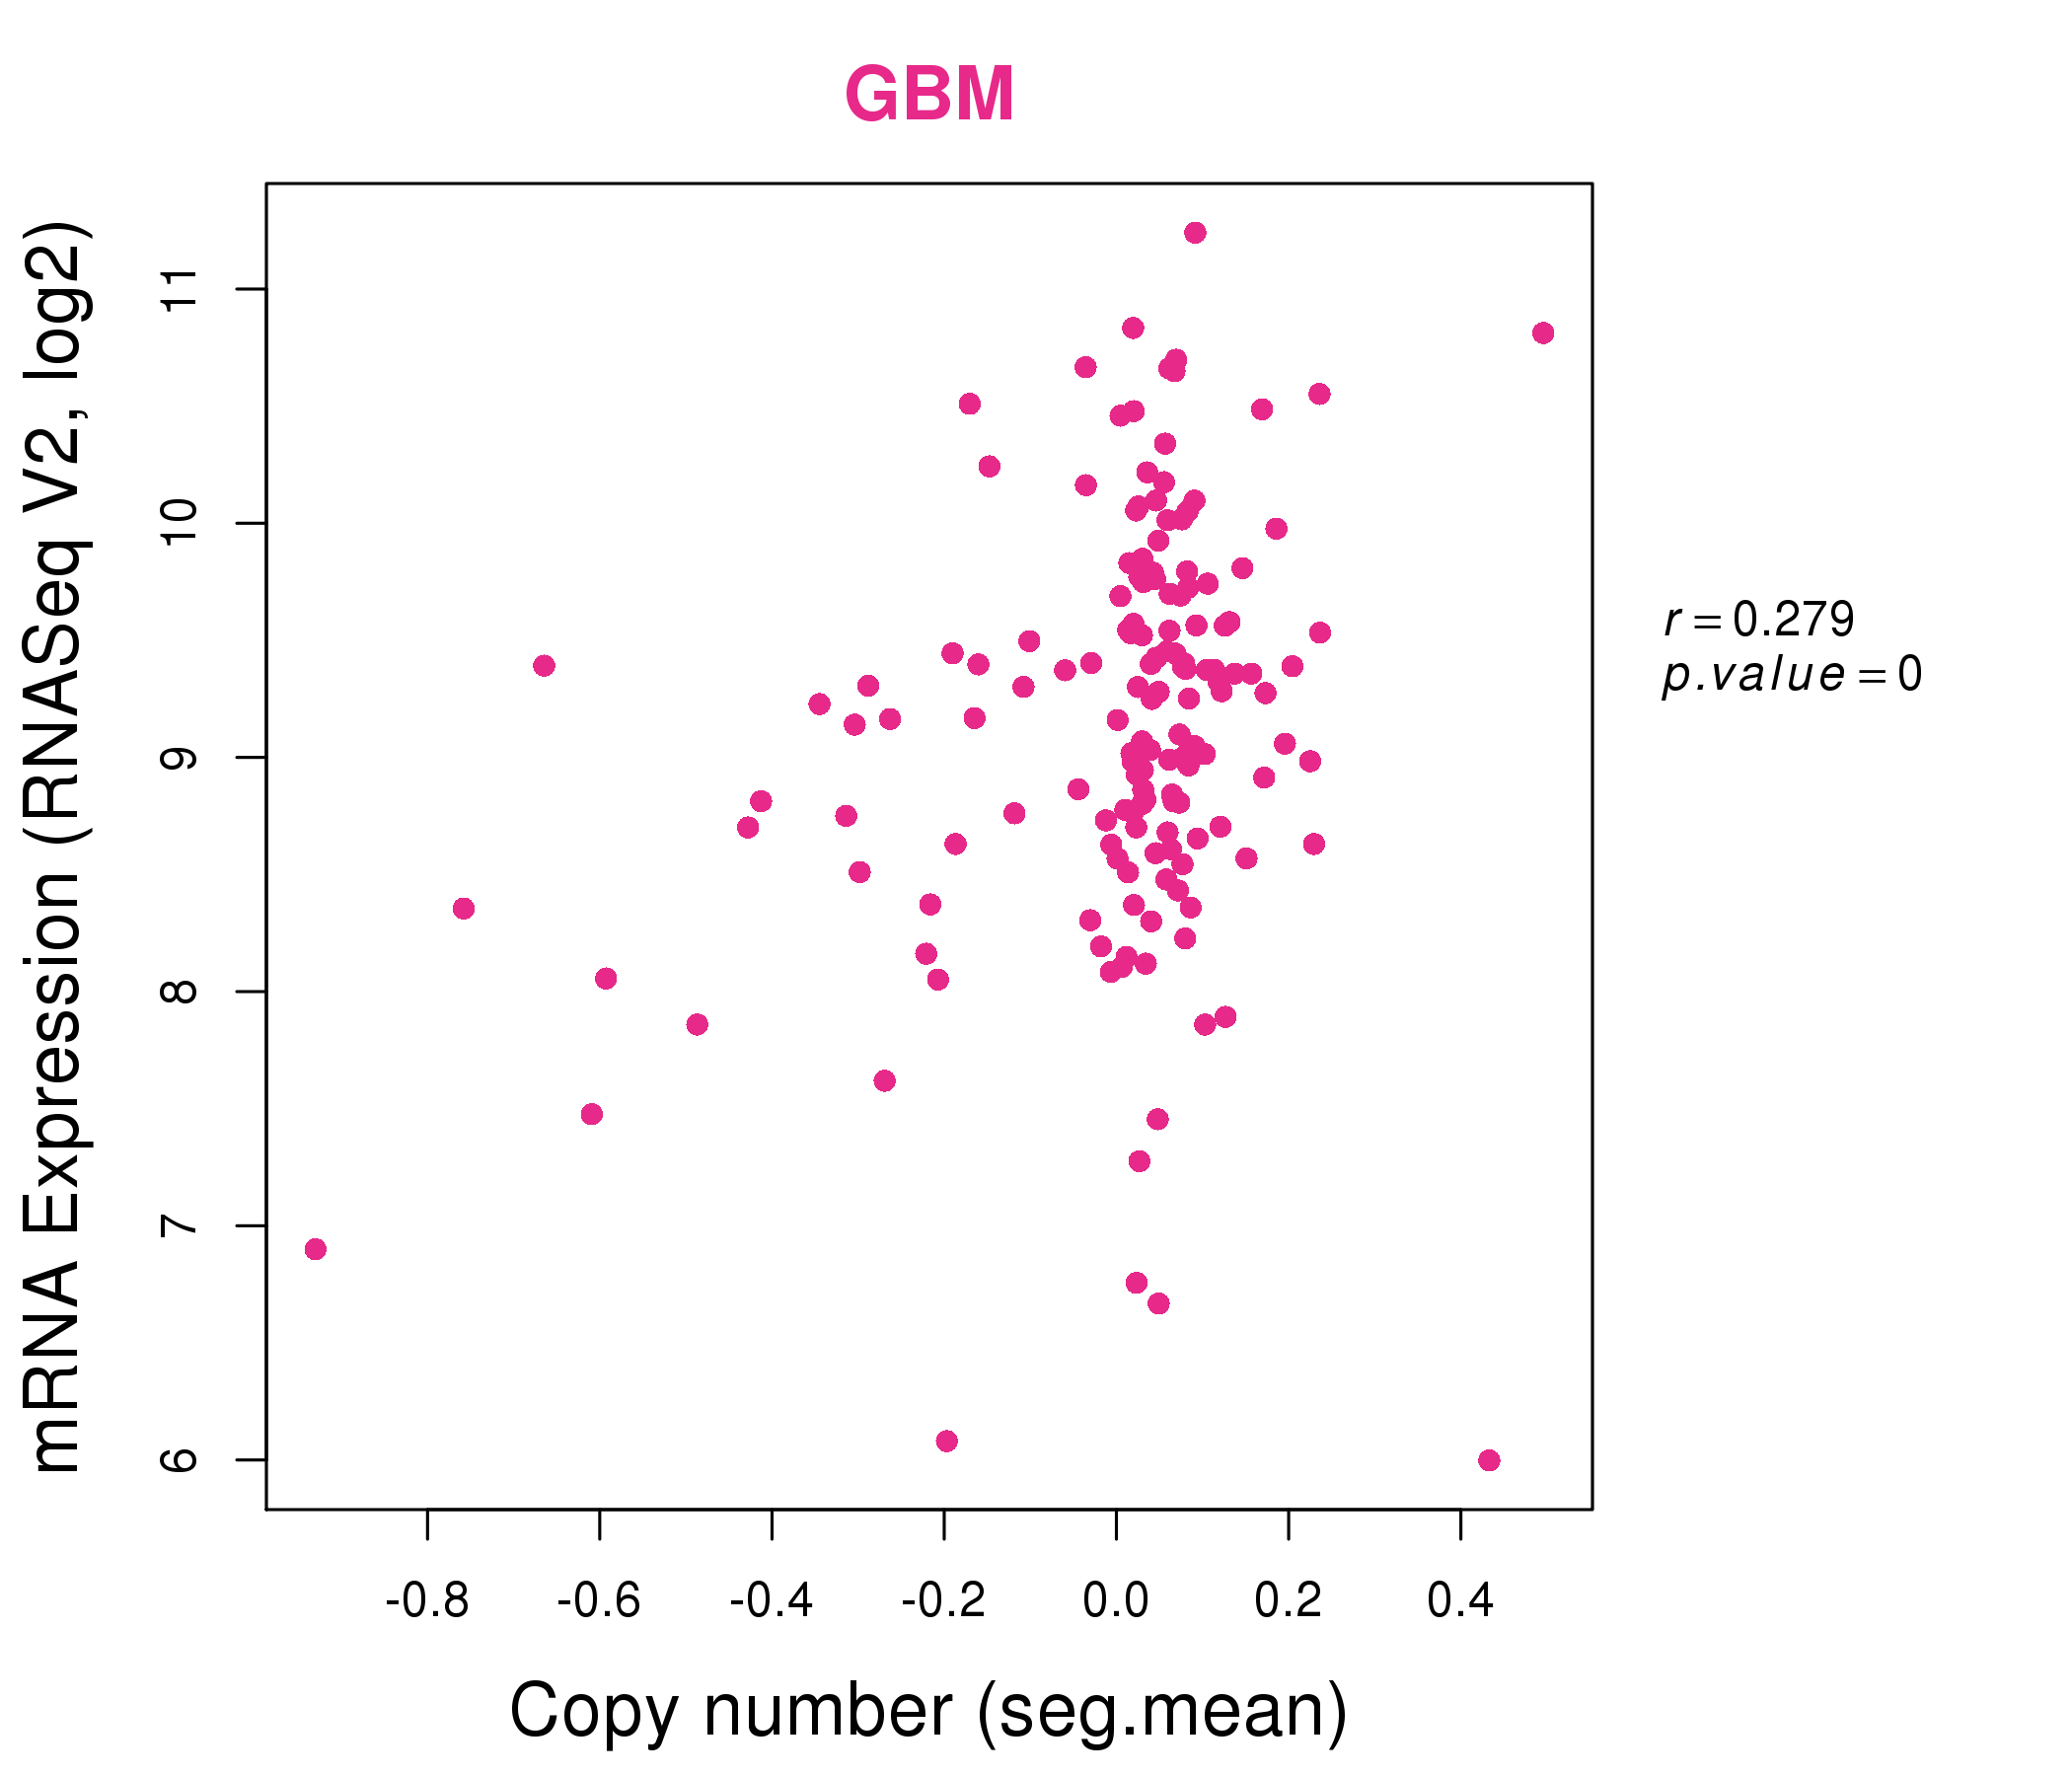
| * Normalized gene expression data of RNASeqV2 was extracted from TCGA using R package TCGA-Assembler. The URLs of all public data files on TCGA DCC data server were gathered at Jan-05-2015. Only eight cancer types have enough normal control samples for differential expression analysis. (t test, adjusted p<0.05 (using Benjamini-Hochberg FDR)) |
 |
| Top |
| * This plots show the correlation between CNV and gene expression. |
: Open all plots for all cancer types
 |
|
 |
|

| Top |
| Gene-Gene Network Information |
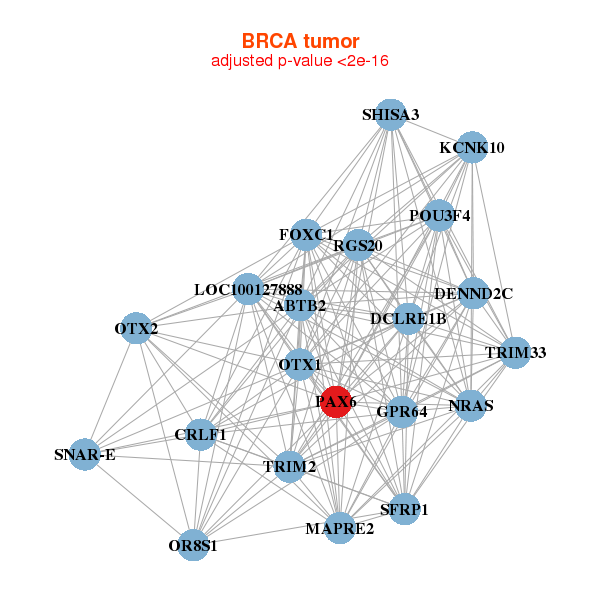
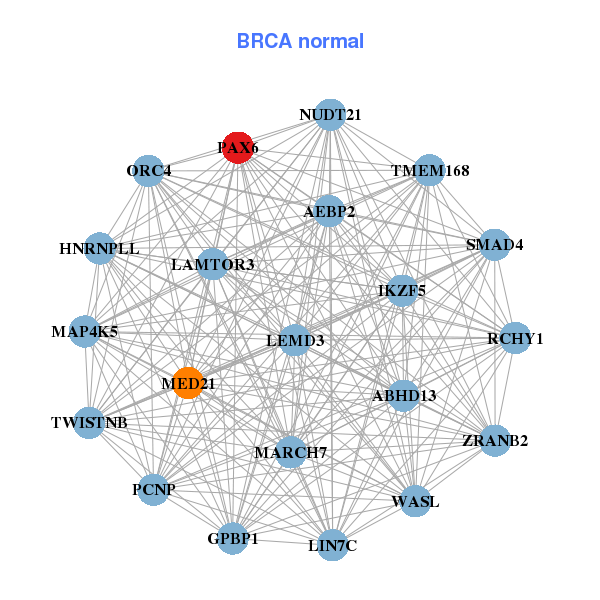
| * Co-Expression network figures were drawn using R package igraph. Only the top 20 genes with the highest correlations were shown. Red circle: input gene, orange circle: cell metabolism gene, sky circle: other gene |
: Open all plots for all cancer types
 |
|
| ABTB2,CRLF1,DCLRE1B,DENND2C,FOXC1,GPR64,KCNK10, LOC100127888,MAPRE2,NRAS,OR8S1,OTX1,OTX2,PAX6, POU3F4,RGS20,SFRP1,SHISA3,SNAR-E,TRIM2,TRIM33 | ABHD13,AEBP2,GPBP1,HNRNPLL,IKZF5,LEMD3,LIN7C, MAP4K5,LAMTOR3,MARCH7,MED21,NUDT21,ORC4,PAX6, PCNP,RCHY1,SMAD4,TMEM168,TWISTNB,WASL,ZRANB2 |
 |
|
| ACTR6,BUB3,CFAP46,C9orf116,CEP55,CPSF6,CRYZL1, HJURP,LOC100130238,LOC144438,METTL10,NACA,NACAP1,PA2G4, PAX6,PLA2G3,PTGES3,RACGAP1,SPINK2,TROAP,WIBG | AEBP2,ARID5B,ACKR3,ELFN2,FAM155A,GNRHR2,GPR125, HGSNAT,KLHL15,LINC00312,LTBP4,MOB1B,HNRNPU-AS1,PAN3, PAX6,PGAP1,PPIL6,TMEM8B,TROVE2,ZNF793,ZNF805 |
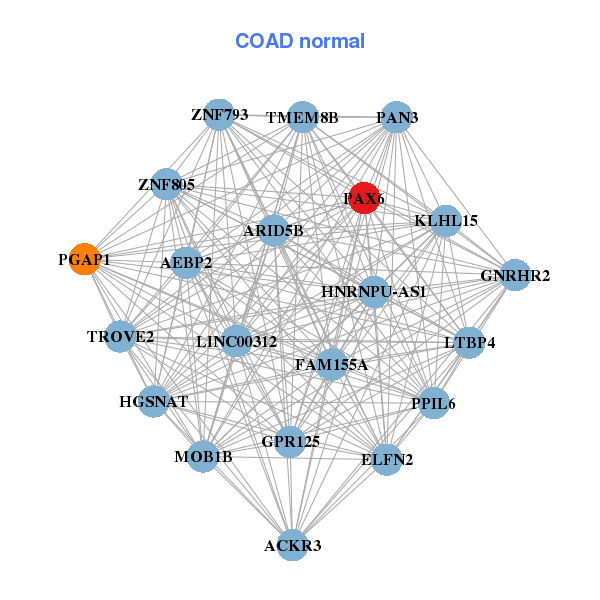
| * Co-Expression network figures were drawn using R package igraph. Only the top 20 genes with the highest correlations were shown. Red circle: input gene, orange circle: cell metabolism gene, sky circle: other gene |
: Open all plots for all cancer types
| Top |
: Open all interacting genes' information including KEGG pathway for all interacting genes from DAVID
| Top |
| Pharmacological Information for PAX6 |
| There's no related Drug. |
| Top |
| Cross referenced IDs for PAX6 |
| * We obtained these cross-references from Uniprot database. It covers 150 different DBs, 18 categories. http://www.uniprot.org/help/cross_references_section |
: Open all cross reference information
|
Copyright © 2016-Present - The Univsersity of Texas Health Science Center at Houston @ |