|
|||||||||||||||||||||||||||||||||||||||||||||||||||||||||||||||||||||||||||||||||||||||||||||||||||||||||||||||||||||||||||||||||||||||||||||||||||||||||||||||||||||||||||||||||||||||||||||||||||||||||||||||||||||||||||||||||||||||||||||||||||||||||||||||||||||||||||||||||||||||||||||||||||||||||||||||||||||||||||||||||||||||||||||||||||
| |
| Phenotypic Information (metabolism pathway, cancer, disease, phenome) |
| |
| |
| Gene-Gene Network Information: Co-Expression Network, Interacting Genes & KEGG |
| |
|


| Gene Summary for PDE11A |
| Top |
| Phenotypic Information for PDE11A(metabolism pathway, cancer, disease, phenome) |
| Cancer | CGAP: PDE11A |
| Familial Cancer Database: PDE11A | |
| * This gene is included in those cancer gene databases. |
|
|
|
|
|
| . | |||||||||||||||||||||||||||||||||||||||||||||||||||||||||||||||||||||||||||||||||||||||||||||||||||||||||||||||||||||||||||||||||||||||||||||||||||||||||||||||||||||||||||||||||||||||||||||||||||||||||||||||||||||||||||||||||||||||||||||||||||||||||||||||||||||||||||||||||||||||||||||||||||||||||||||||||||||||||||||||||||||||||||||
Oncogene 1 | Significant driver gene in | ||||||||||||||||||||||||||||||||||||||||||||||||||||||||||||||||||||||||||||||||||||||||||||||||||||||||||||||||||||||||||||||||||||||||||||||||||||||||||||||||||||||||||||||||||||||||||||||||||||||||||||||||||||||||||||||||||||||||||||||||||||||||||||||||||||||||||||||||||||||||||||||||||||||||||||||||||||||||||||||||||||||||||||||||||
| cf) number; DB name 1 Oncogene; http://nar.oxfordjournals.org/content/35/suppl_1/D721.long, 2 Tumor Suppressor gene; https://bioinfo.uth.edu/TSGene/, 3 Cancer Gene Census; http://www.nature.com/nrc/journal/v4/n3/abs/nrc1299.html, 4 CancerGenes; http://nar.oxfordjournals.org/content/35/suppl_1/D721.long, 5 Network of Cancer Gene; http://ncg.kcl.ac.uk/index.php, 1Therapeutic Vulnerabilities in Cancer; http://cbio.mskcc.org/cancergenomics/statius/ |
| KEGG_PURINE_METABOLISM | |
| OMIM | |
| Orphanet | |
| Disease | KEGG Disease: PDE11A |
| MedGen: PDE11A (Human Medical Genetics with Condition) | |
| ClinVar: PDE11A | |
| Phenotype | MGI: PDE11A (International Mouse Phenotyping Consortium) |
| PhenomicDB: PDE11A | |
| Mutations for PDE11A |
| * Under tables are showing count per each tissue to give us broad intuition about tissue specific mutation patterns.You can go to the detailed page for each mutation database's web site. |
| - Statistics for Tissue and Mutation type | Top |
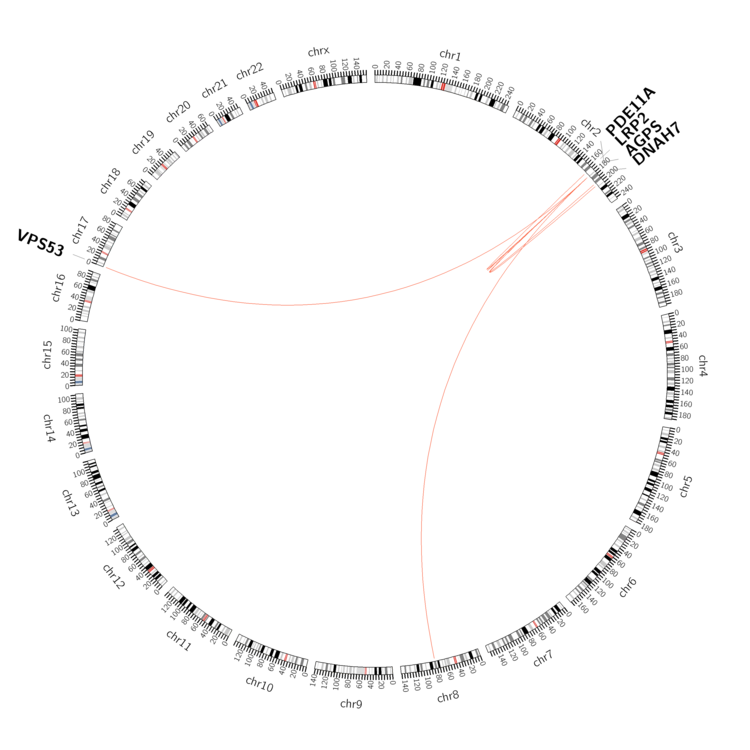 |
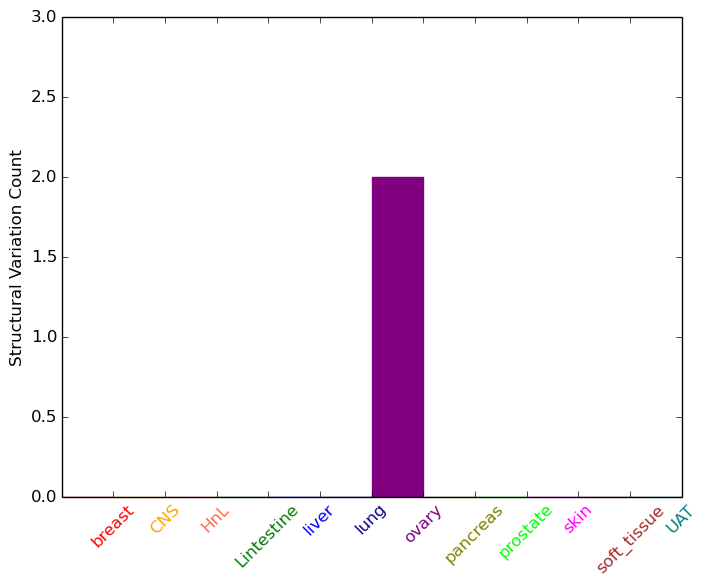
| - For Inter-chromosomal Variations |
| * Inter-chromosomal variantions includes 'interchromosomal amplicon to amplicon', 'interchromosomal amplicon to non-amplified dna', 'interchromosomal insertion', 'Interchromosomal unknown type'. |
 |
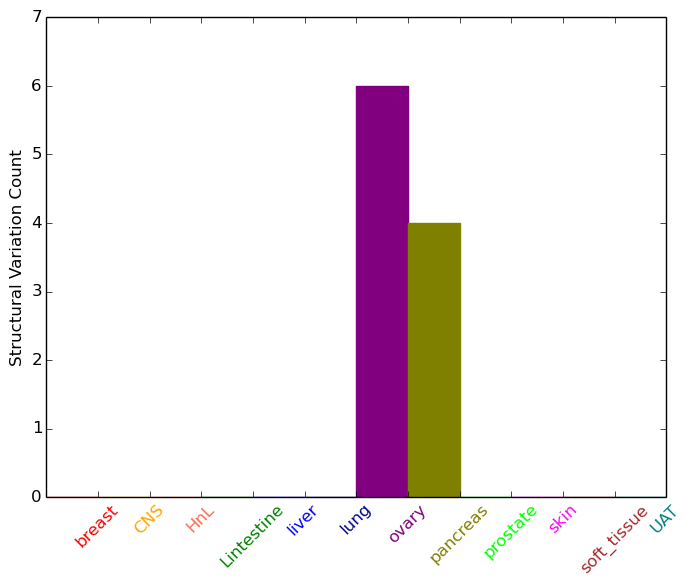
| - For Intra-chromosomal Variations |
| * Intra-chromosomal variantions includes 'intrachromosomal amplicon to amplicon', 'intrachromosomal amplicon to non-amplified dna', 'intrachromosomal deletion', 'intrachromosomal fold-back inversion', 'intrachromosomal inversion', 'intrachromosomal tandem duplication', 'Intrachromosomal unknown type', 'intrachromosomal with inverted orientation', 'intrachromosomal with non-inverted orientation'. |
 |
| Sample | Symbol_a | Chr_a | Start_a | End_a | Symbol_b | Chr_b | Start_b | End_b |
| ovary | PDE11A | chr2 | 178540994 | 178541014 | AGPS | chr2 | 178333736 | 178333756 |
| ovary | PDE11A | chr2 | 178564144 | 178564164 | chr2 | 178474299 | 178474319 | |
| ovary | PDE11A | chr2 | 178586196 | 178586216 | PDE11A | chr2 | 178611116 | 178611136 |
| ovary | PDE11A | chr2 | 178599056 | 178599076 | PDE11A | chr2 | 178589388 | 178589408 |
| ovary | PDE11A | chr2 | 178710162 | 178710362 | VPS53 | chr17 | 501500 | 501700 |
| ovary | PDE11A | chr2 | 178712953 | 178712973 | PDE11A | chr2 | 178713040 | 178713060 |
| ovary | PDE11A | chr2 | 178716794 | 178716814 | chr8 | 82314283 | 82314303 | |
| ovary | PDE11A | chr2 | 178747048 | 178747068 | PDE11A | chr2 | 178747635 | 178747655 |
| pancreas | PDE11A | chr2 | 178506304 | 178506324 | chr2 | 201026809 | 201026829 | |
| pancreas | PDE11A | chr2 | 178713937 | 178713957 | DNAH7 | chr2 | 196766693 | 196766713 |
| pancreas | PDE11A | chr2 | 178724084 | 178724104 | AGPS | chr2 | 178393876 | 178393896 |
| pancreas | PDE11A | chr2 | 178729550 | 178729570 | LRP2 | chr2 | 170122894 | 170122914 |
| cf) Tissue number; Tissue name (1;Breast, 2;Central_nervous_system, 3;Haematopoietic_and_lymphoid_tissue, 4;Large_intestine, 5;Liver, 6;Lung, 7;Ovary, 8;Pancreas, 9;Prostate, 10;Skin, 11;Soft_tissue, 12;Upper_aerodigestive_tract) |
| * From mRNA Sanger sequences, Chitars2.0 arranged chimeric transcripts. This table shows PDE11A related fusion information. |
| ID | Head Gene | Tail Gene | Accession | Gene_a | qStart_a | qEnd_a | Chromosome_a | tStart_a | tEnd_a | Gene_a | qStart_a | qEnd_a | Chromosome_a | tStart_a | tEnd_a |
| Top |
| Mutation type/ Tissue ID | brca | cns | cerv | endome | haematopo | kidn | Lintest | liver | lung | ns | ovary | pancre | prost | skin | stoma | thyro | urina | |||
| Total # sample | 2 | 1 | 1 | 1 | 3 | 1 | ||||||||||||||
| GAIN (# sample) | 2 | 1 | 1 | 3 | 1 | |||||||||||||||
| LOSS (# sample) | 1 |
| cf) Tissue ID; Tissue type (1; Breast, 2; Central_nervous_system, 3; Cervix, 4; Endometrium, 5; Haematopoietic_and_lymphoid_tissue, 6; Kidney, 7; Large_intestine, 8; Liver, 9; Lung, 10; NS, 11; Ovary, 12; Pancreas, 13; Prostate, 14; Skin, 15; Stomach, 16; Thyroid, 17; Urinary_tract) |
| Top |
|
 |
| Top |
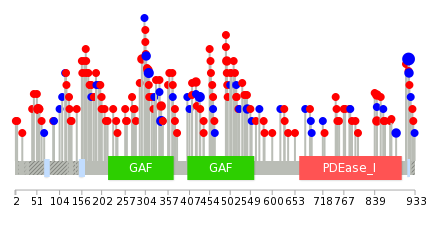
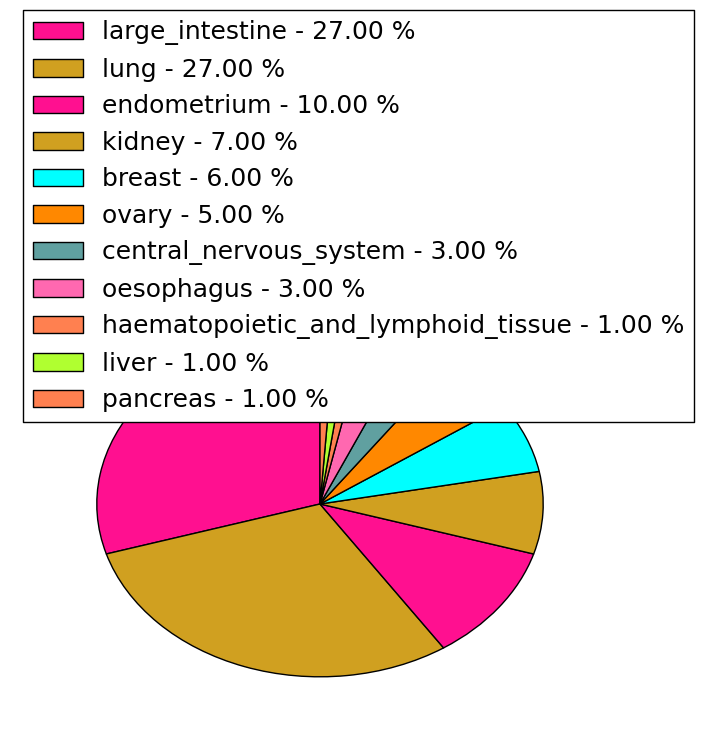
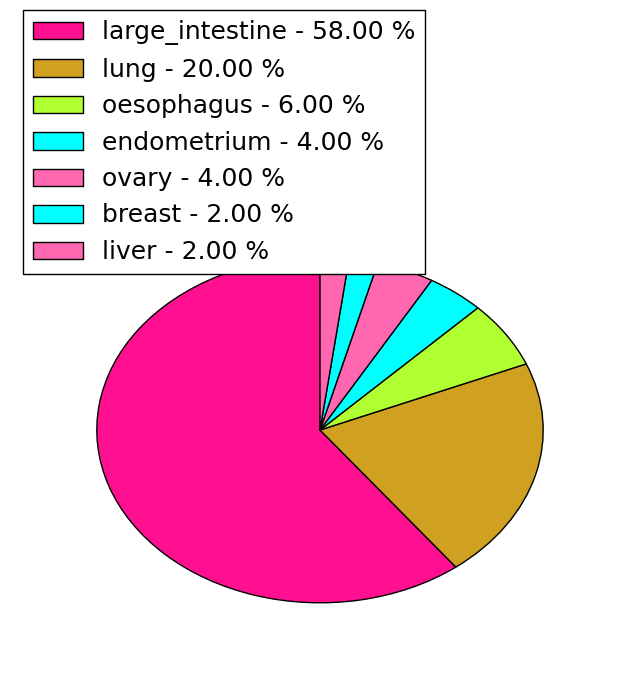
| Stat. for Non-Synonymous SNVs (# total SNVs=104) | (# total SNVs=43) |
 |  |
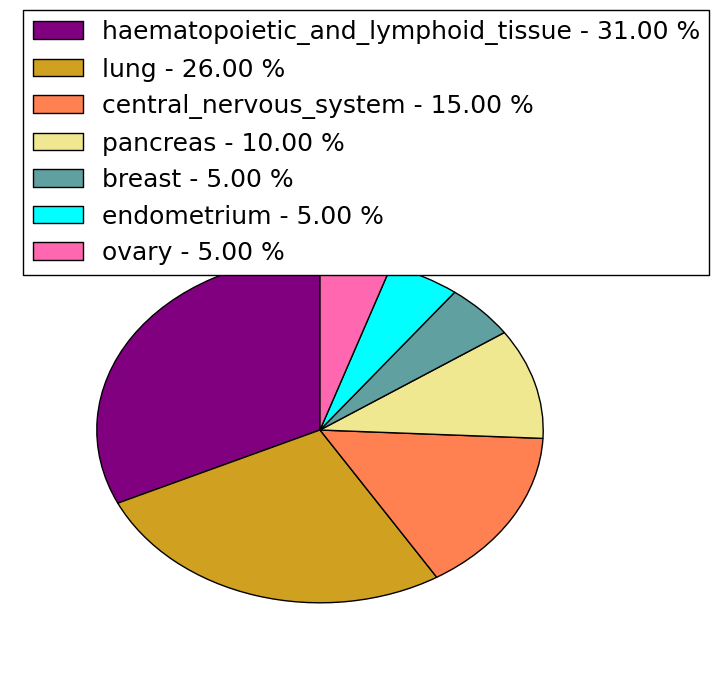
(# total SNVs=0) | (# total SNVs=19) |
 |
| Top |
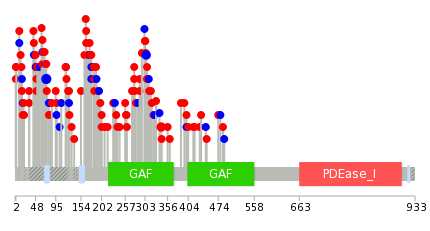
| * When you move the cursor on each content, you can see more deailed mutation information on the Tooltip. Those are primary_site,primary_histology,mutation(aa),pubmedID. |
| GRCh37 position | Mutation(aa) | Unique sampleID count |
| chr2:178494183-178494183 | p.A918A | 11 |
| chr2:178494178-178494179 | p.S920_S921insA | 10 |
| chr2:178937004-178937004 | p.S54F | 3 |
| chr2:178494179-178494180 | p.S919_S920insP | 3 |
| chr2:178879164-178879164 | p.I312I | 3 |
| chr2:178879077-178879077 | p.A341A | 3 |
| chr2:178762794-178762794 | p.I431I | 3 |
| chr2:178545555-178545555 | p.R808* | 2 |
| chr2:178682603-178682603 | p.A542A | 2 |
| chr2:178762823-178762823 | p.R422C | 2 |
| Top |
|
 |
| Point Mutation/ Tissue ID | 1 | 2 | 3 | 4 | 5 | 6 | 7 | 8 | 9 | 10 | 11 | 12 | 13 | 14 | 15 | 16 | 17 | 18 | 19 | 20 |
| # sample | 8 | 4 | 2 | 18 | 2 | 4 | 4 | 1 | 18 | 12 | 7 | 19 | 6 | 12 | ||||||
| # mutation | 8 | 4 | 2 | 20 | 2 | 4 | 4 | 1 | 21 | 13 | 7 | 25 | 7 | 12 | ||||||
| nonsynonymous SNV | 7 | 4 | 2 | 14 | 2 | 2 | 4 | 1 | 16 | 12 | 5 | 18 | 3 | 10 | ||||||
| synonymous SNV | 1 | 6 | 2 | 5 | 1 | 2 | 7 | 4 | 2 |
| cf) Tissue ID; Tissue type (1; BLCA[Bladder Urothelial Carcinoma], 2; BRCA[Breast invasive carcinoma], 3; CESC[Cervical squamous cell carcinoma and endocervical adenocarcinoma], 4; COAD[Colon adenocarcinoma], 5; GBM[Glioblastoma multiforme], 6; Glioma Low Grade, 7; HNSC[Head and Neck squamous cell carcinoma], 8; KICH[Kidney Chromophobe], 9; KIRC[Kidney renal clear cell carcinoma], 10; KIRP[Kidney renal papillary cell carcinoma], 11; LAML[Acute Myeloid Leukemia], 12; LUAD[Lung adenocarcinoma], 13; LUSC[Lung squamous cell carcinoma], 14; OV[Ovarian serous cystadenocarcinoma ], 15; PAAD[Pancreatic adenocarcinoma], 16; PRAD[Prostate adenocarcinoma], 17; SKCM[Skin Cutaneous Melanoma], 18:STAD[Stomach adenocarcinoma], 19:THCA[Thyroid carcinoma], 20:UCEC[Uterine Corpus Endometrial Carcinoma]) |
| Top |
| * We represented just top 10 SNVs. When you move the cursor on each content, you can see more deailed mutation information on the Tooltip. Those are primary_site, primary_histology, mutation(aa), pubmedID. |
| Genomic Position | Mutation(aa) | Unique sampleID count |
| chr2:178762794 | p.I73I,PDE11A | 3 |
| chr2:178592803 | p.R185L,PDE11A | 2 |
| chr2:178705092 | p.R306R,PDE11A | 2 |
| chr2:178936561 | p.R202C | 2 |
| chr2:178565928 | p.Y48C,PDE11A | 2 |
| chr2:178879182 | p.E18E,PDE11A | 2 |
| chr2:178879078 | p.A341V,PDE11A | 2 |
| chr2:178705003 | p.A278V,PDE11A | 2 |
| chr2:178762866 | p.I171V | 1 |
| chr2:178936459 | p.I244N,PDE11A | 1 |
| * Copy number data were extracted from TCGA using R package TCGA-Assembler. The URLs of all public data files on TCGA DCC data server were gathered on Jan-05-2015. Function ProcessCNAData in TCGA-Assembler package was used to obtain gene-level copy number value which is calculated as the average copy number of the genomic region of a gene. |
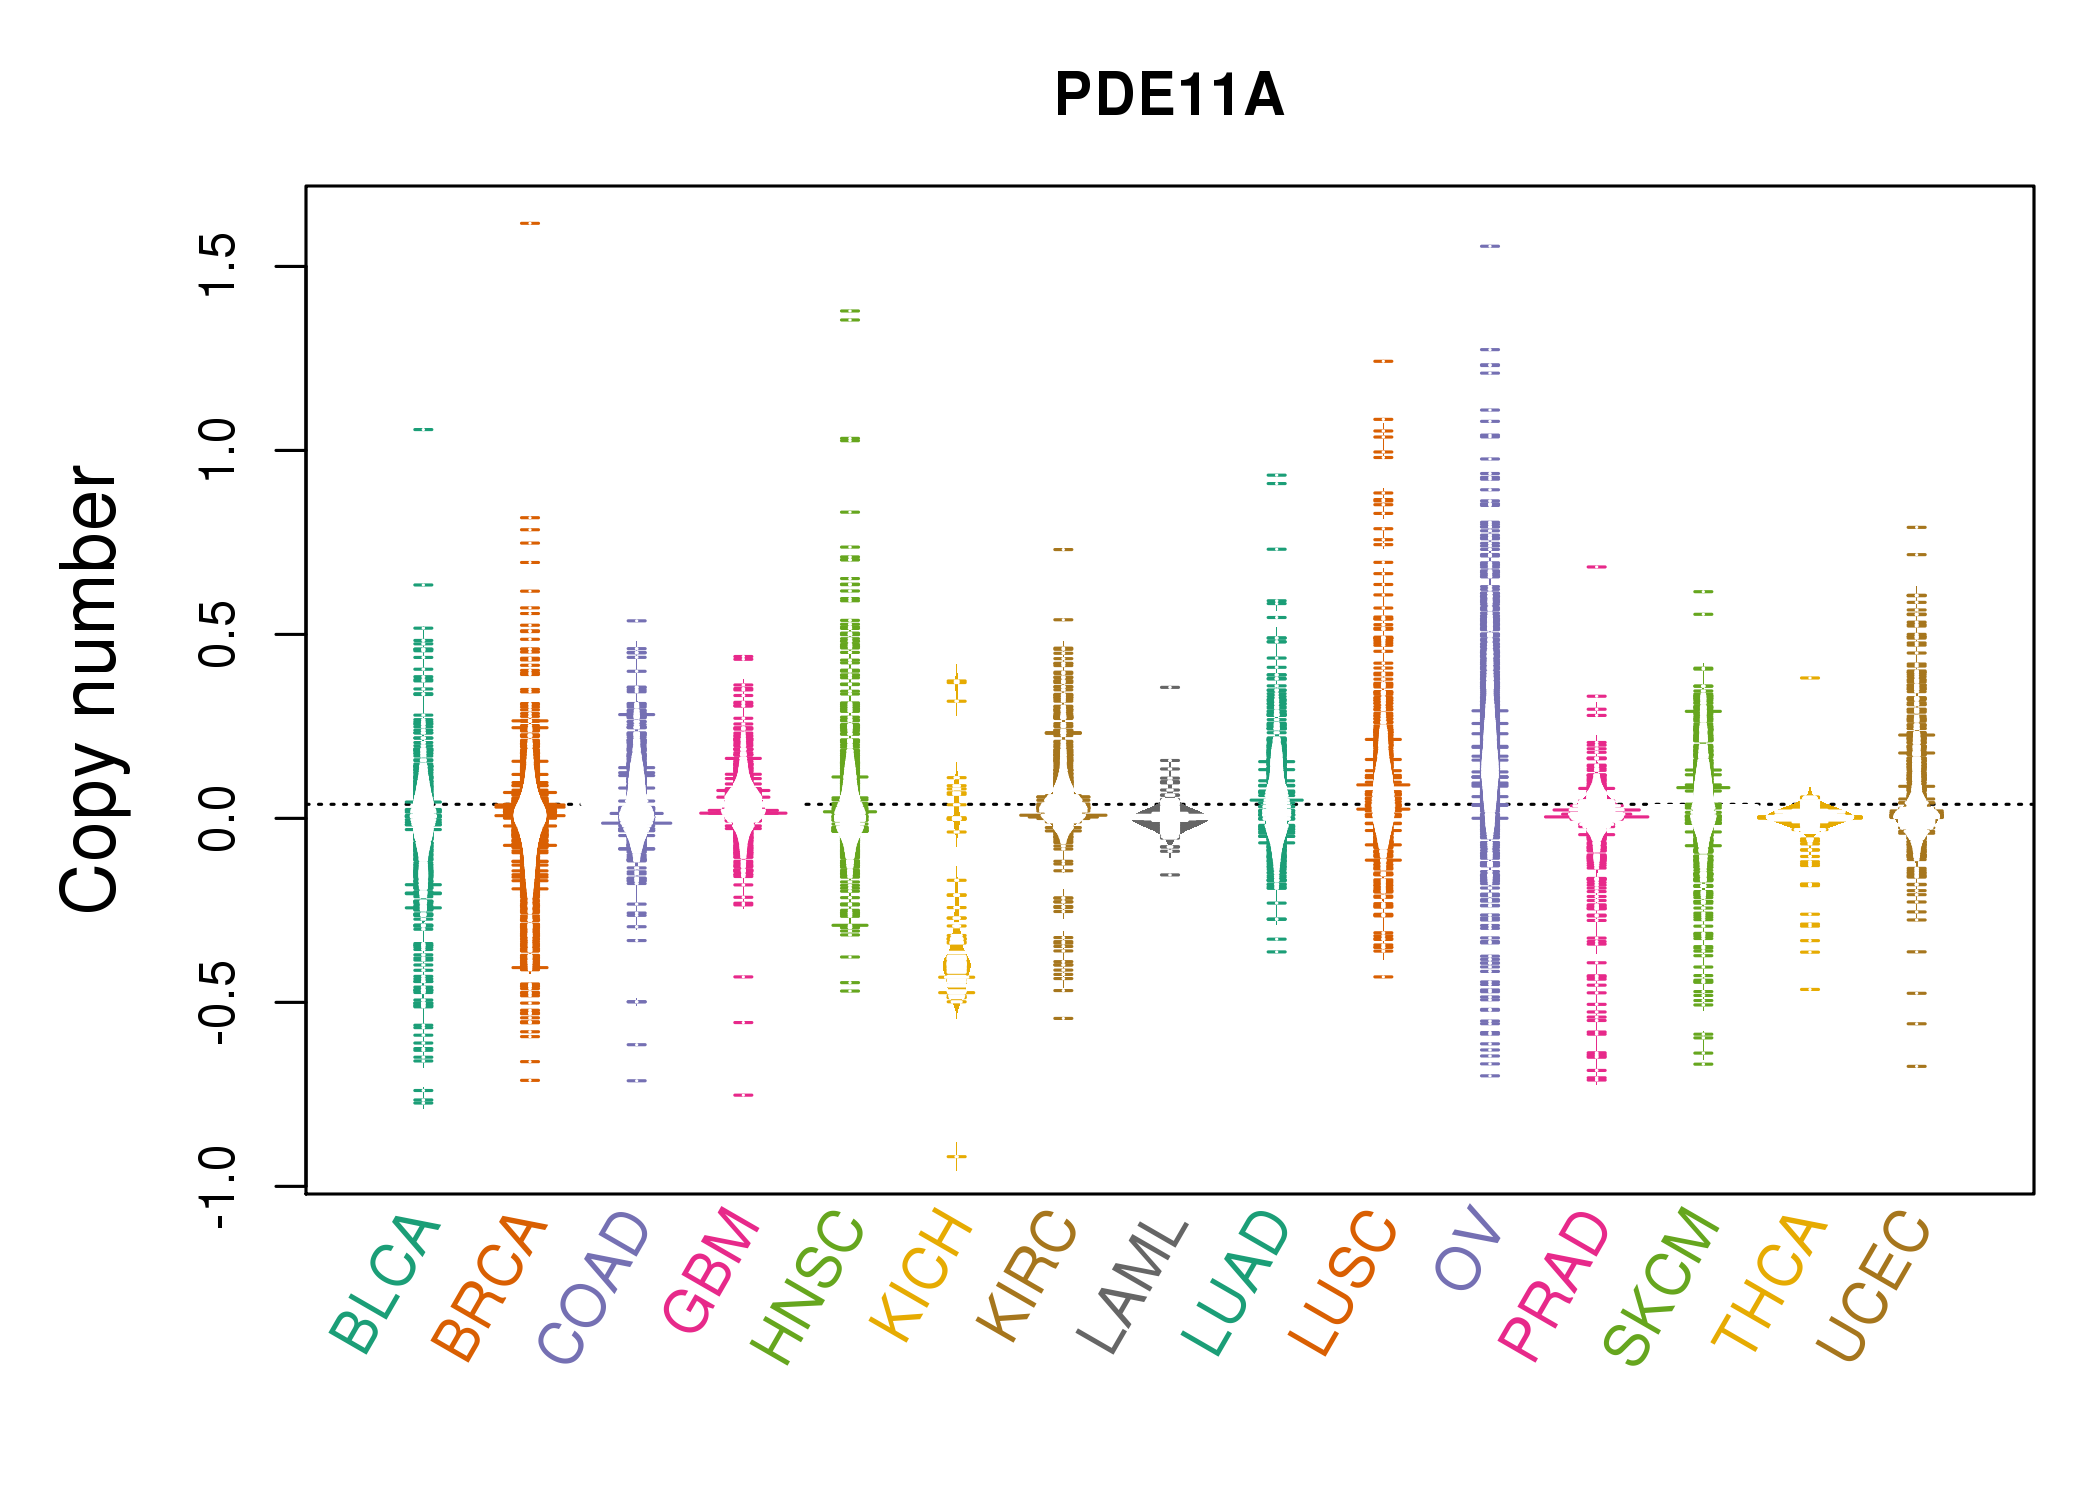 |
| cf) Tissue ID[Tissue type]: BLCA[Bladder Urothelial Carcinoma], BRCA[Breast invasive carcinoma], CESC[Cervical squamous cell carcinoma and endocervical adenocarcinoma], COAD[Colon adenocarcinoma], GBM[Glioblastoma multiforme], Glioma Low Grade, HNSC[Head and Neck squamous cell carcinoma], KICH[Kidney Chromophobe], KIRC[Kidney renal clear cell carcinoma], KIRP[Kidney renal papillary cell carcinoma], LAML[Acute Myeloid Leukemia], LUAD[Lung adenocarcinoma], LUSC[Lung squamous cell carcinoma], OV[Ovarian serous cystadenocarcinoma ], PAAD[Pancreatic adenocarcinoma], PRAD[Prostate adenocarcinoma], SKCM[Skin Cutaneous Melanoma], STAD[Stomach adenocarcinoma], THCA[Thyroid carcinoma], UCEC[Uterine Corpus Endometrial Carcinoma] |
| Top |
| Gene Expression for PDE11A |
| * CCLE gene expression data were extracted from CCLE_Expression_Entrez_2012-10-18.res: Gene-centric RMA-normalized mRNA expression data. |
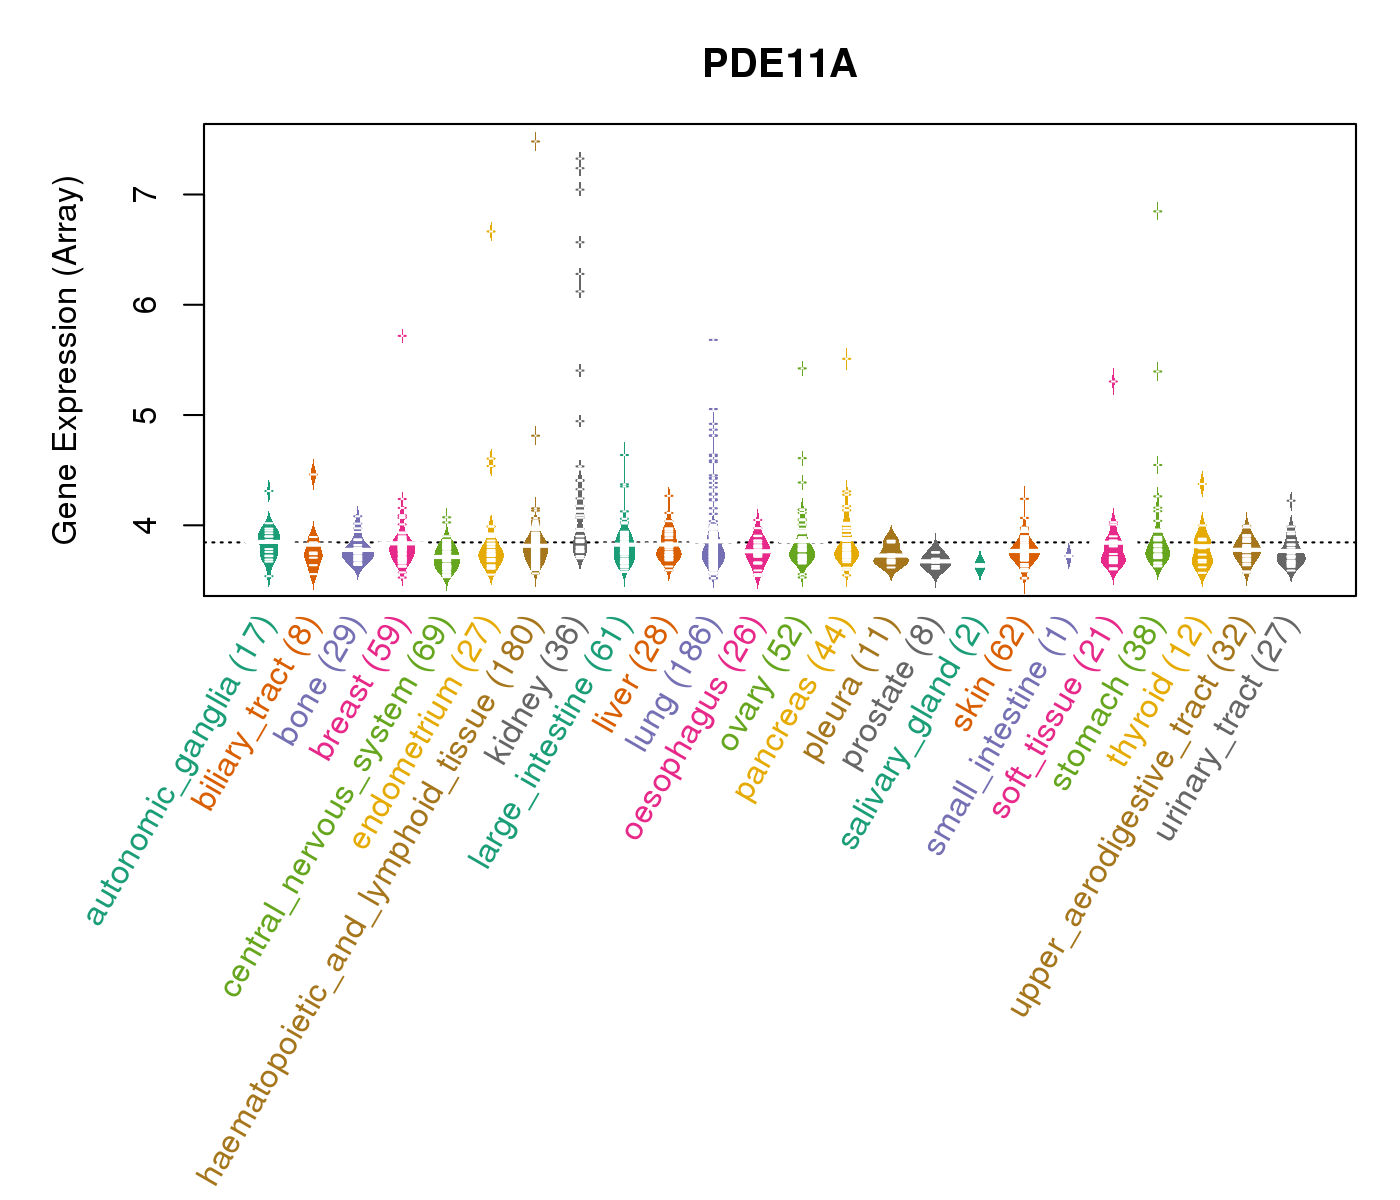 |
| * Normalized gene expression data of RNASeqV2 was extracted from TCGA using R package TCGA-Assembler. The URLs of all public data files on TCGA DCC data server were gathered at Jan-05-2015. Only eight cancer types have enough normal control samples for differential expression analysis. (t test, adjusted p<0.05 (using Benjamini-Hochberg FDR)) |
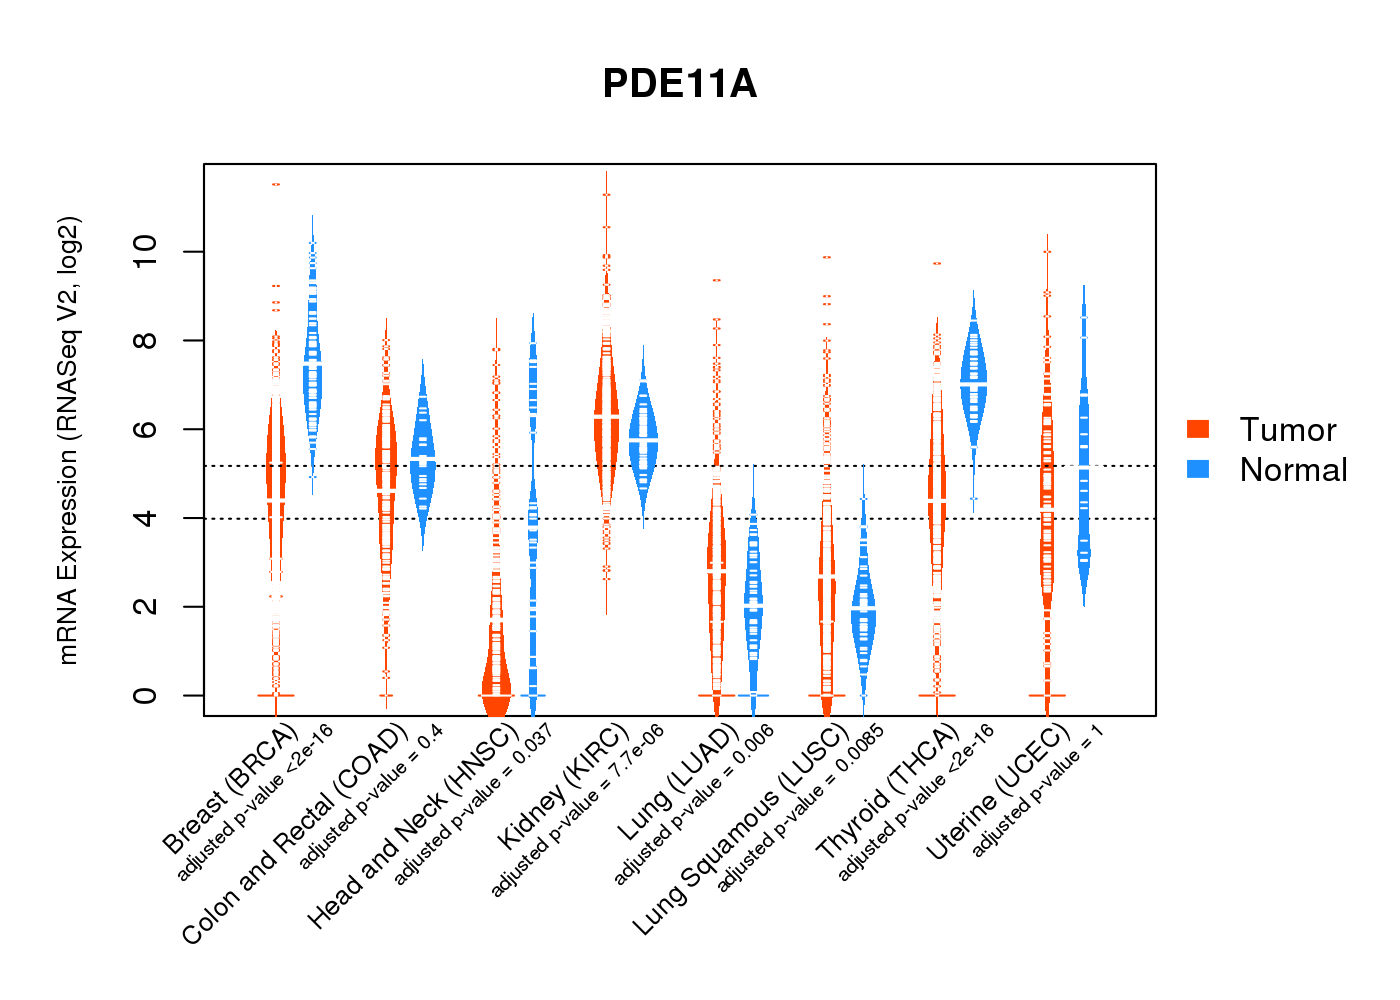 |
| Top |
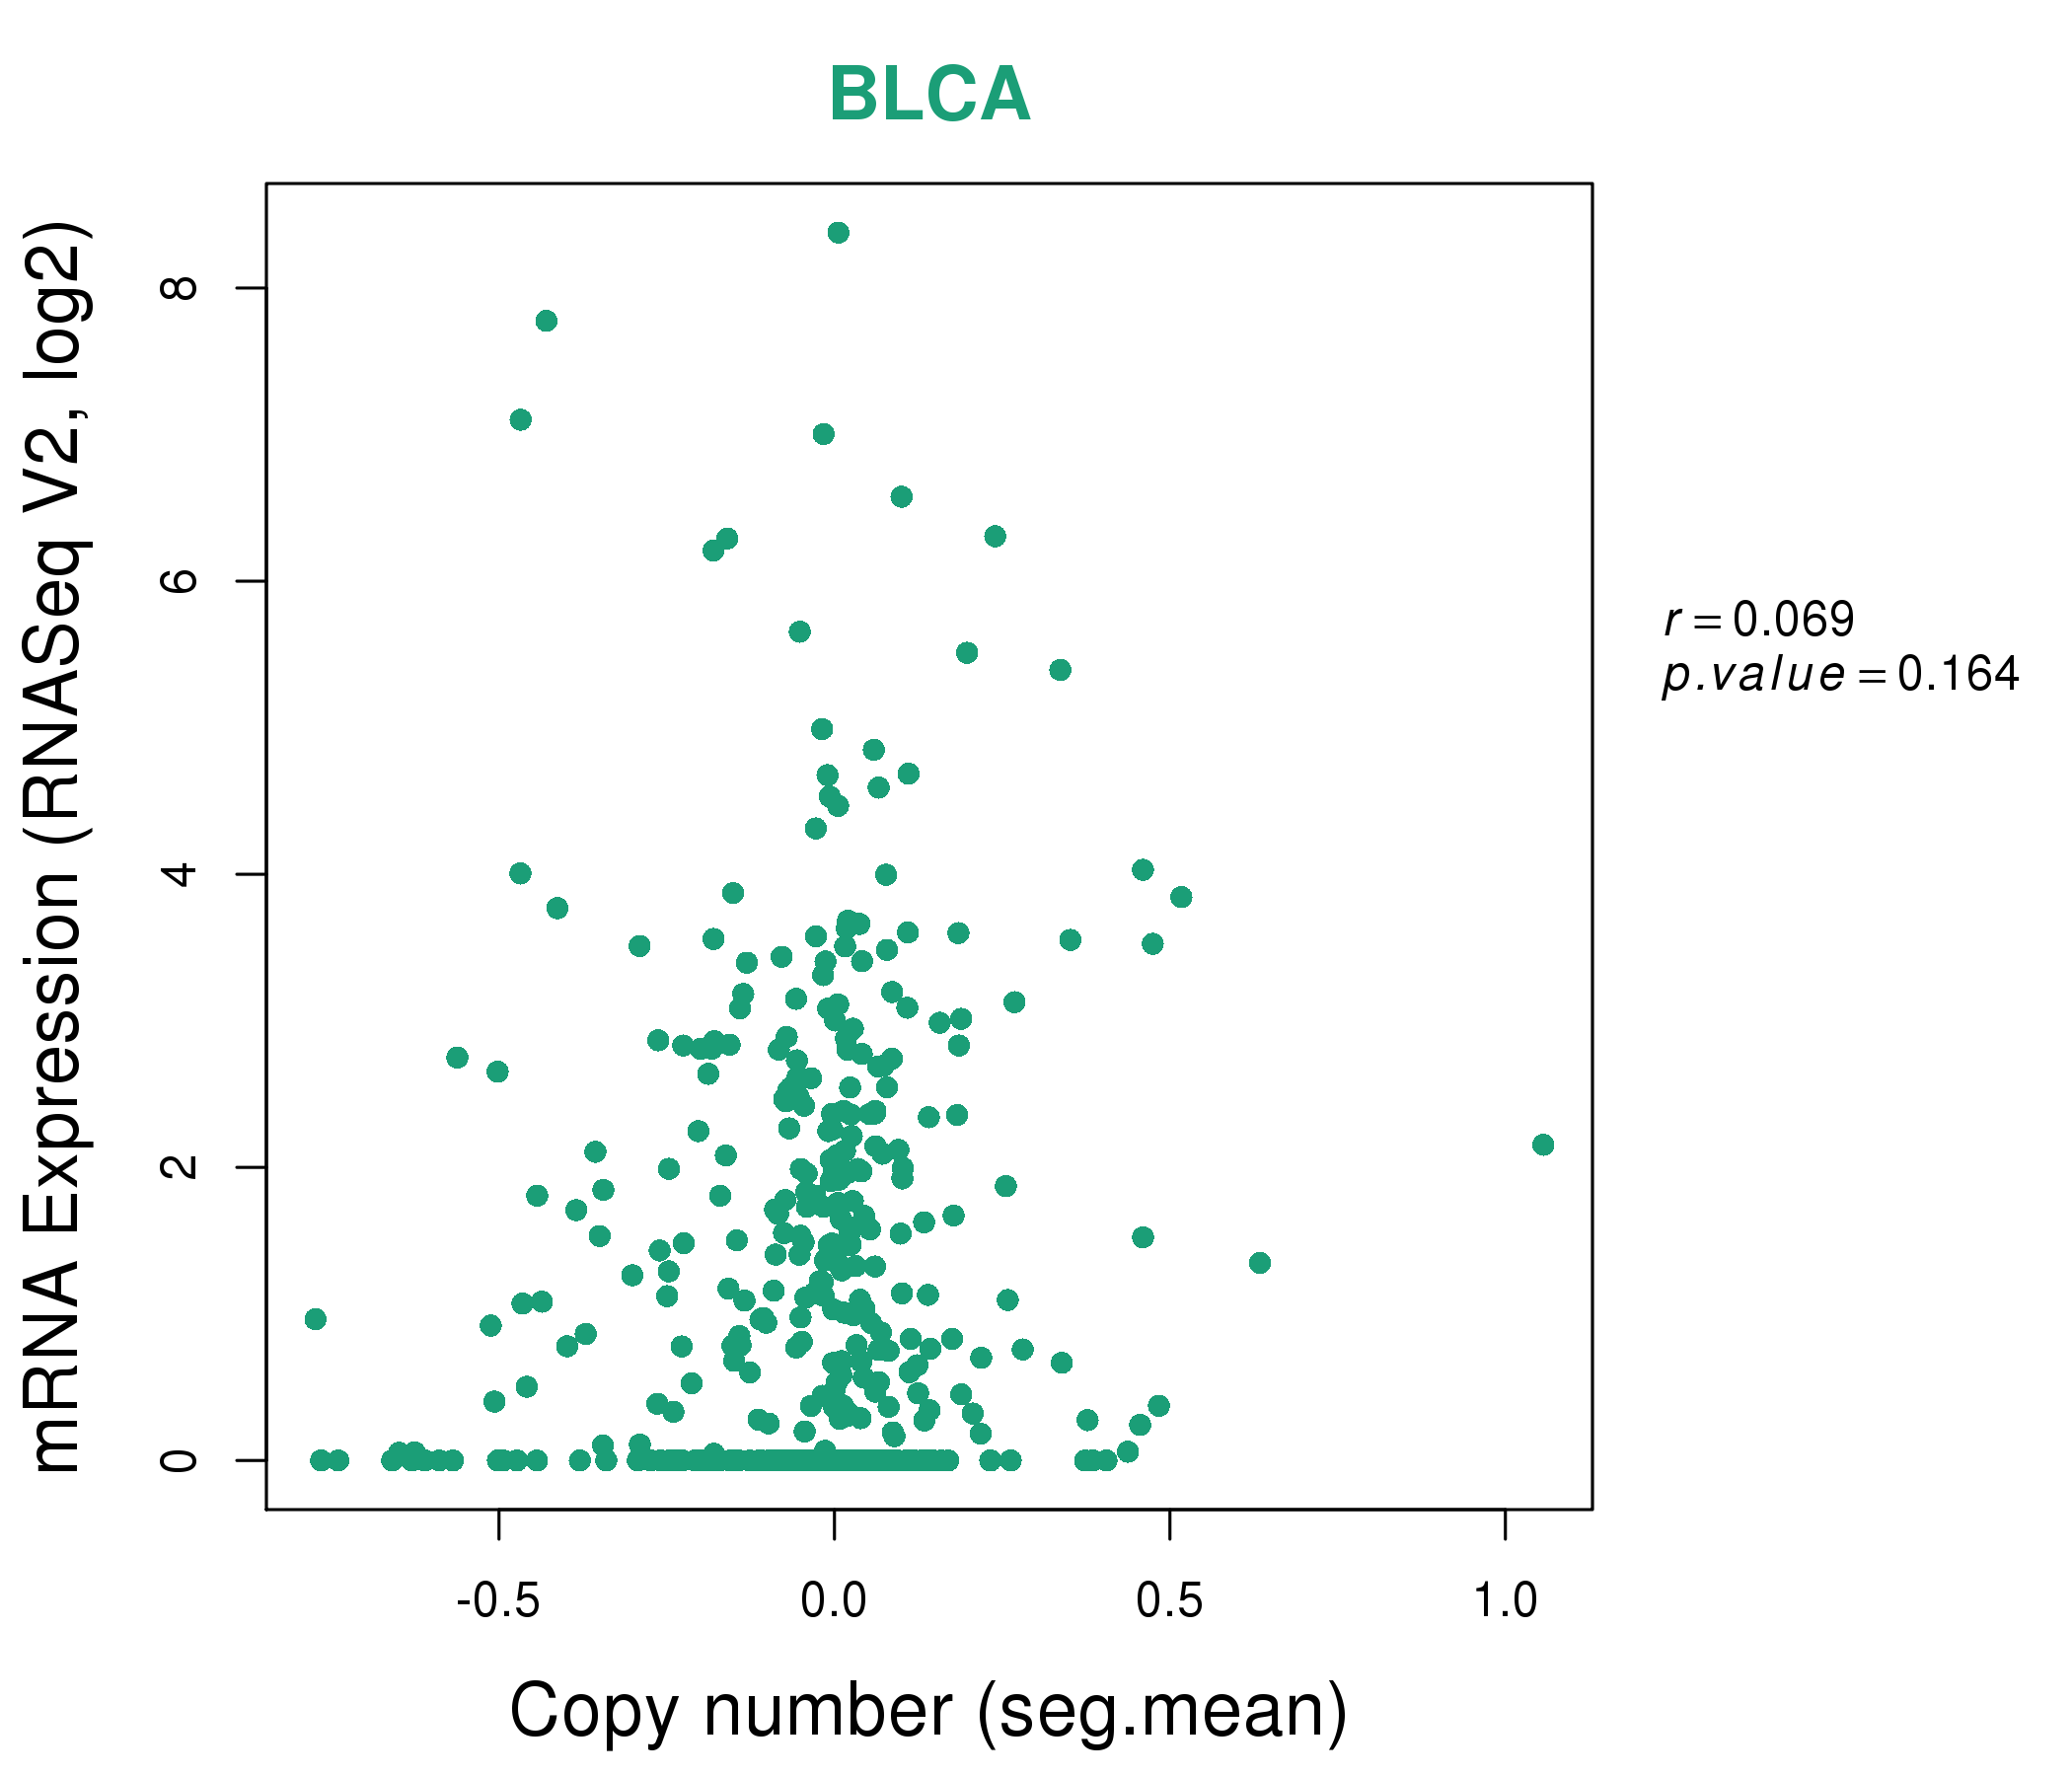
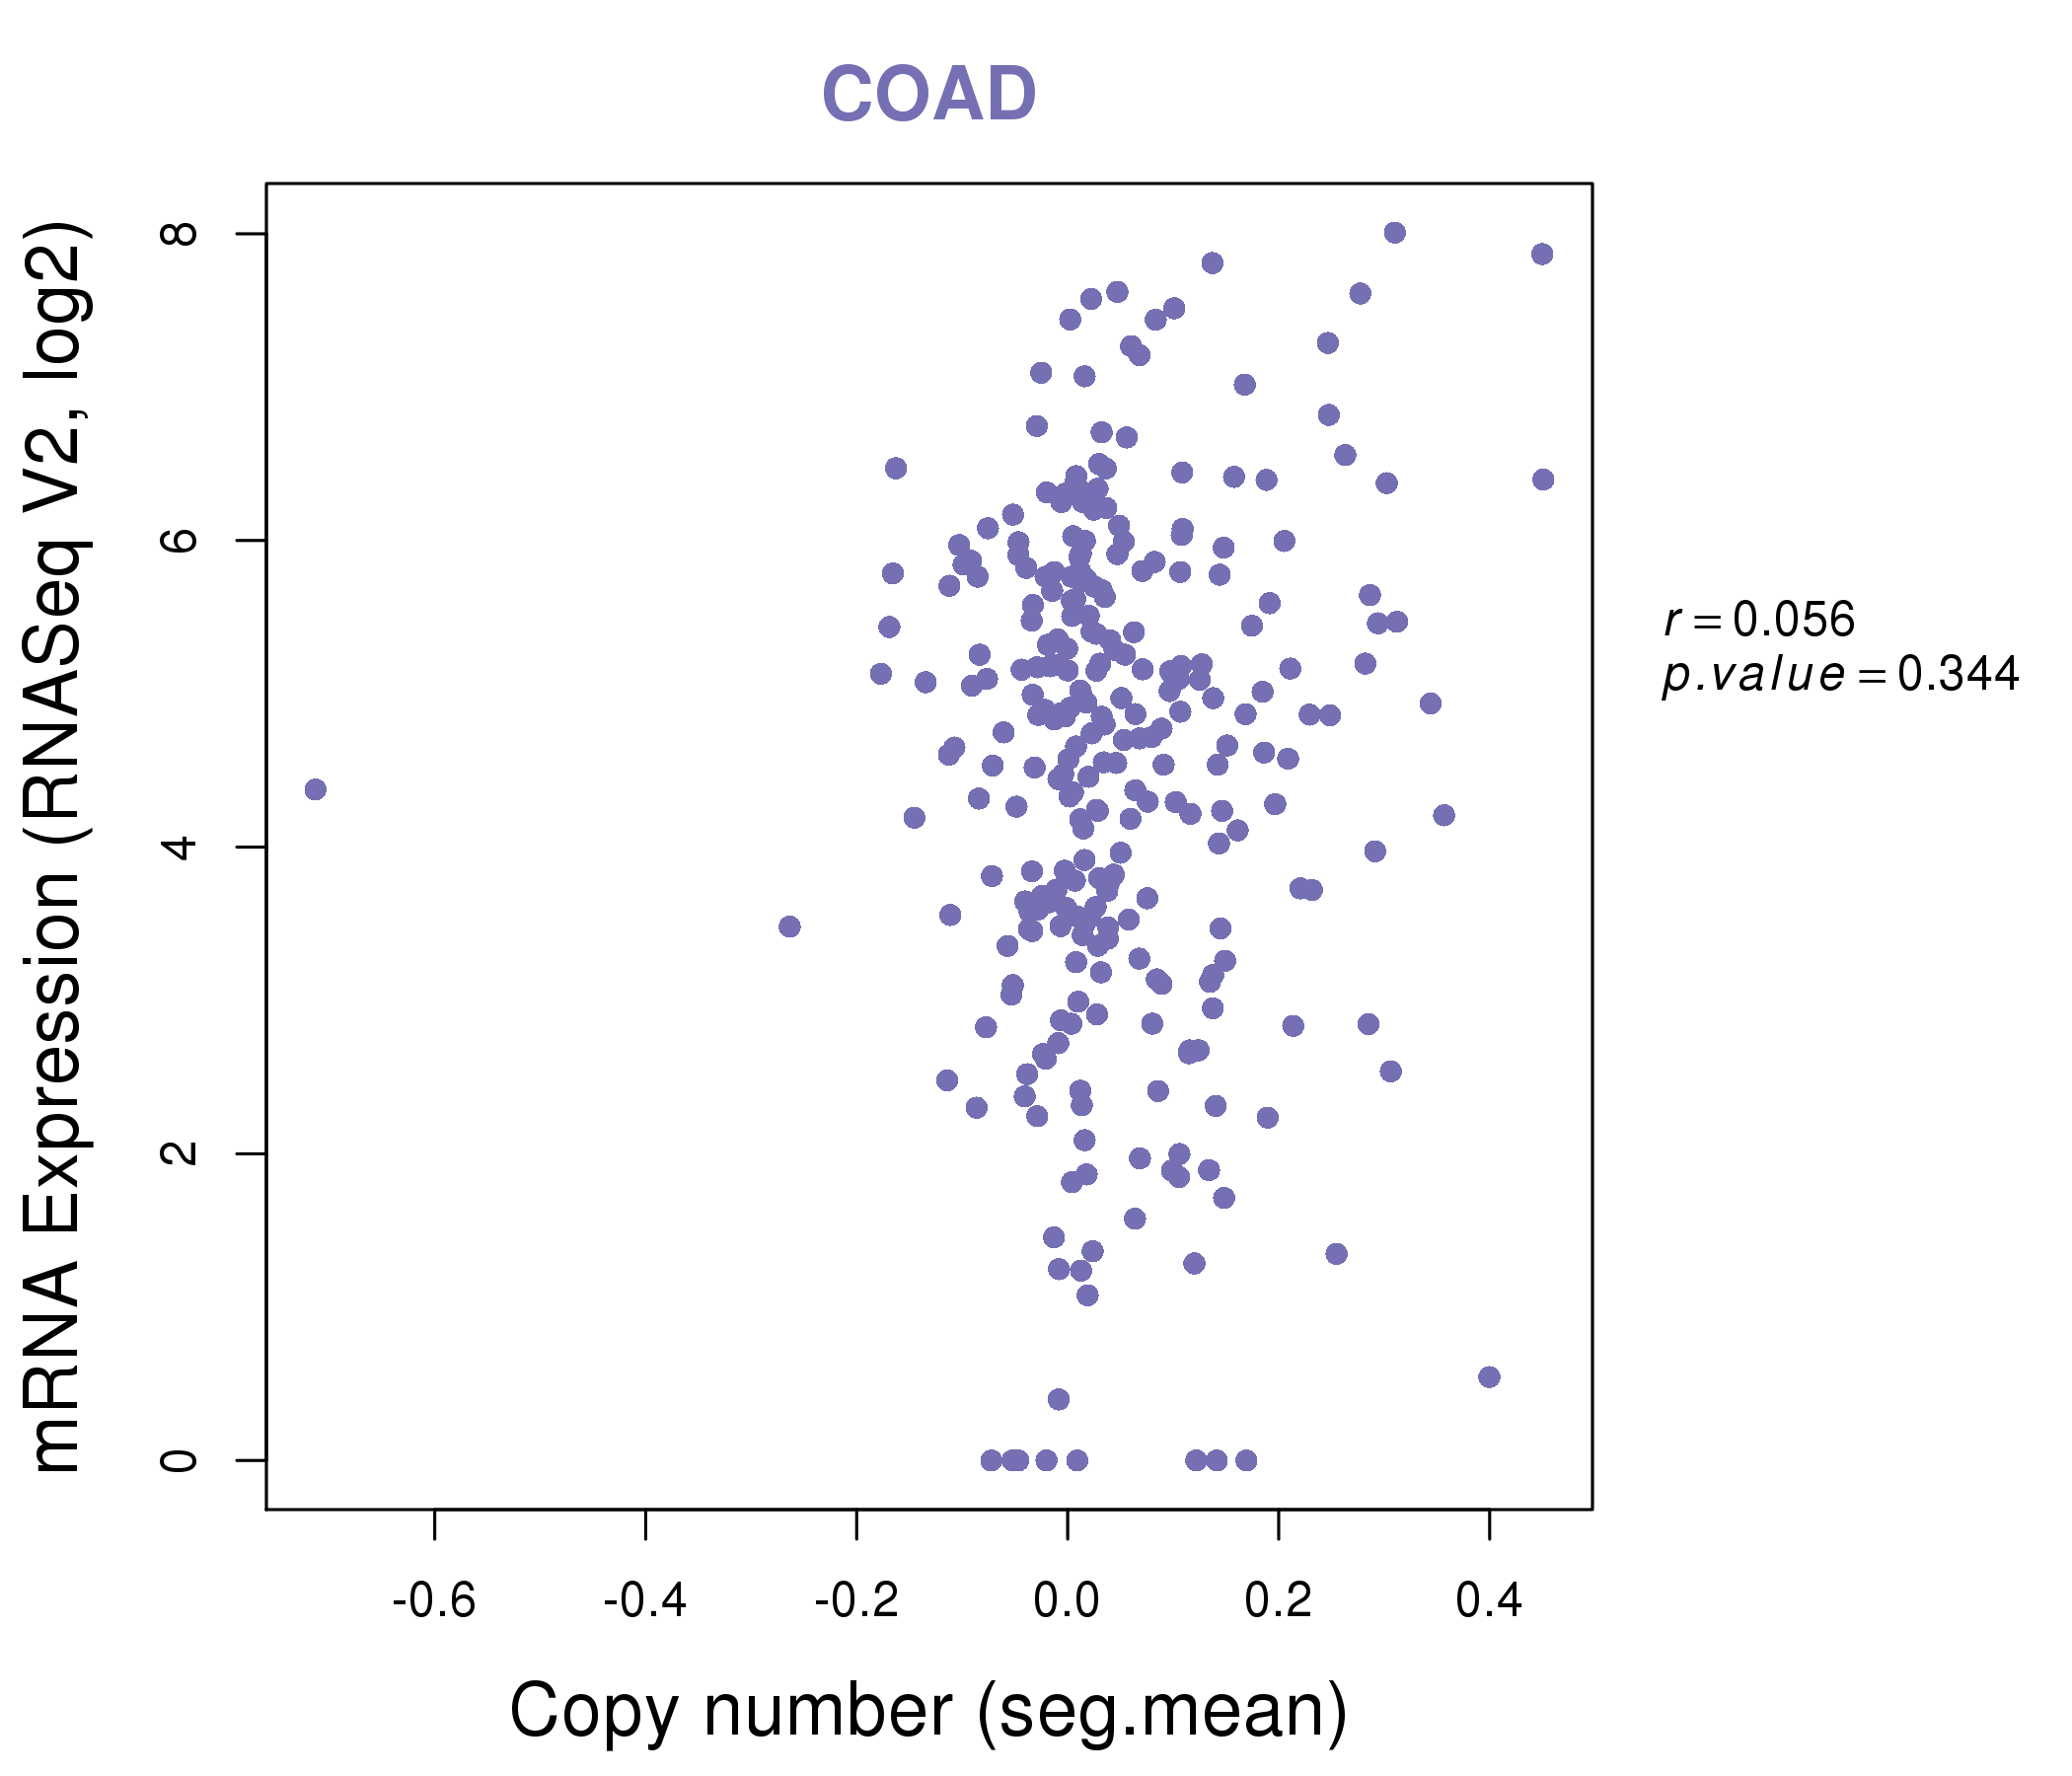
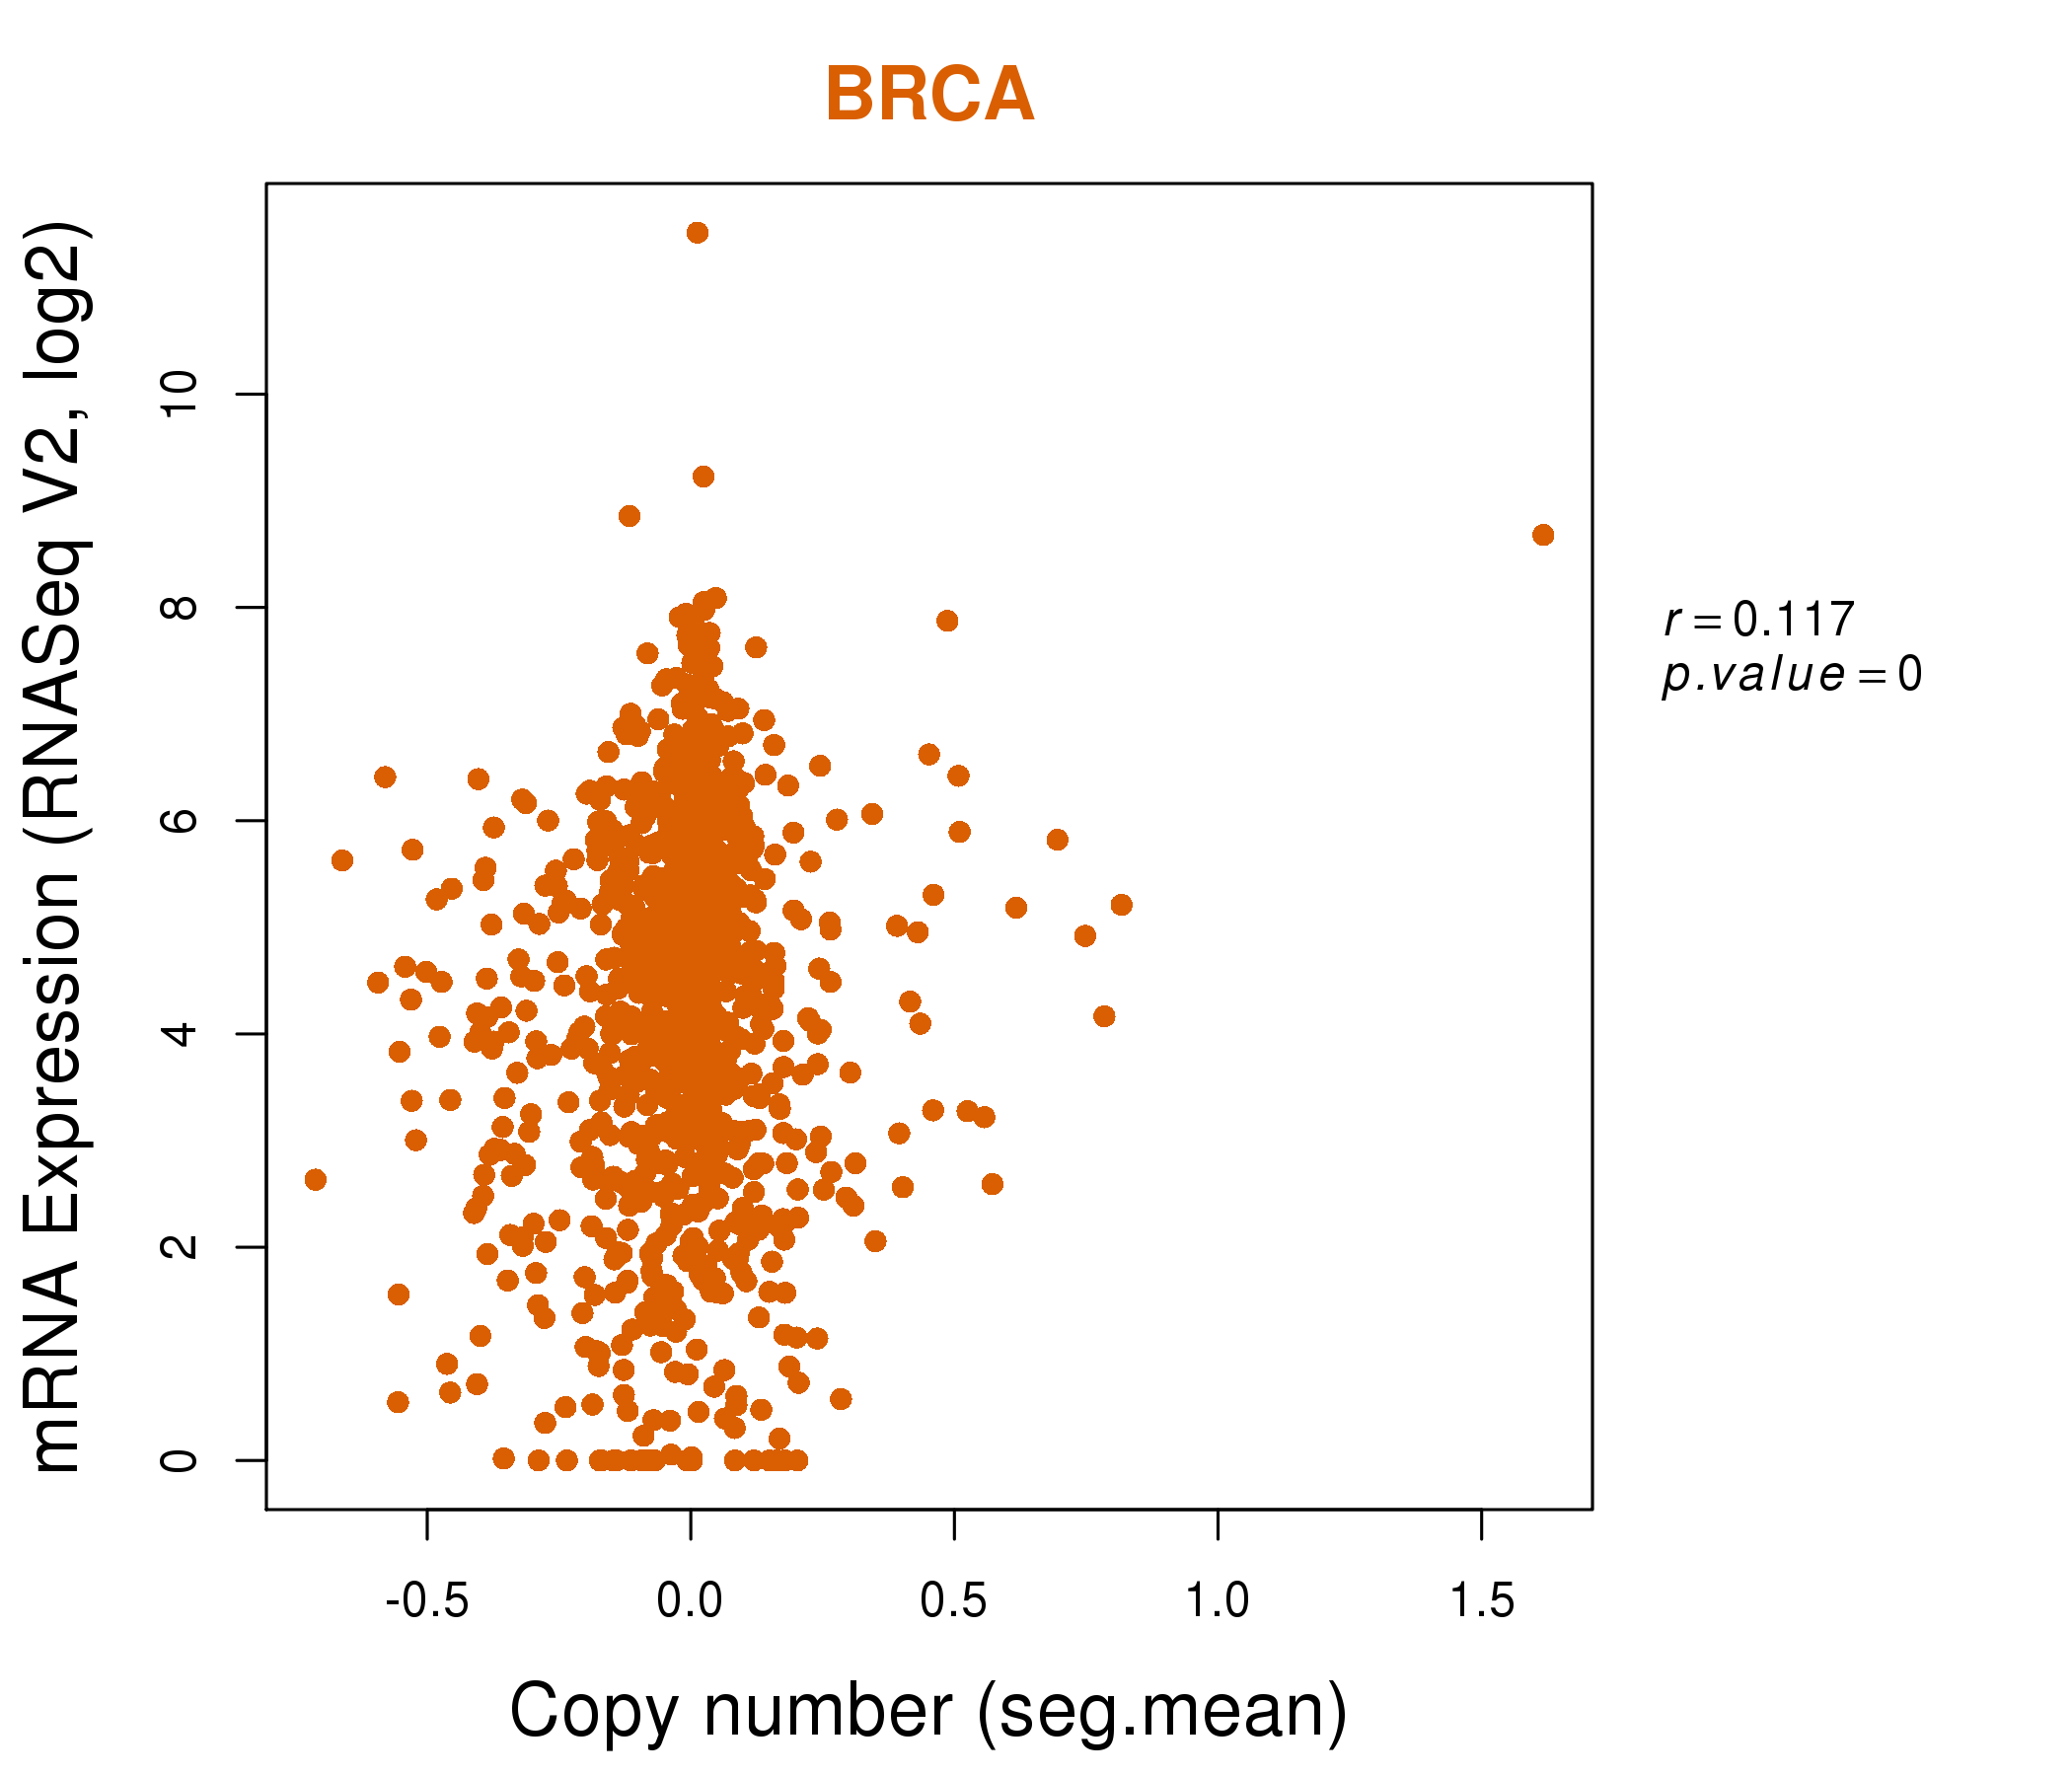
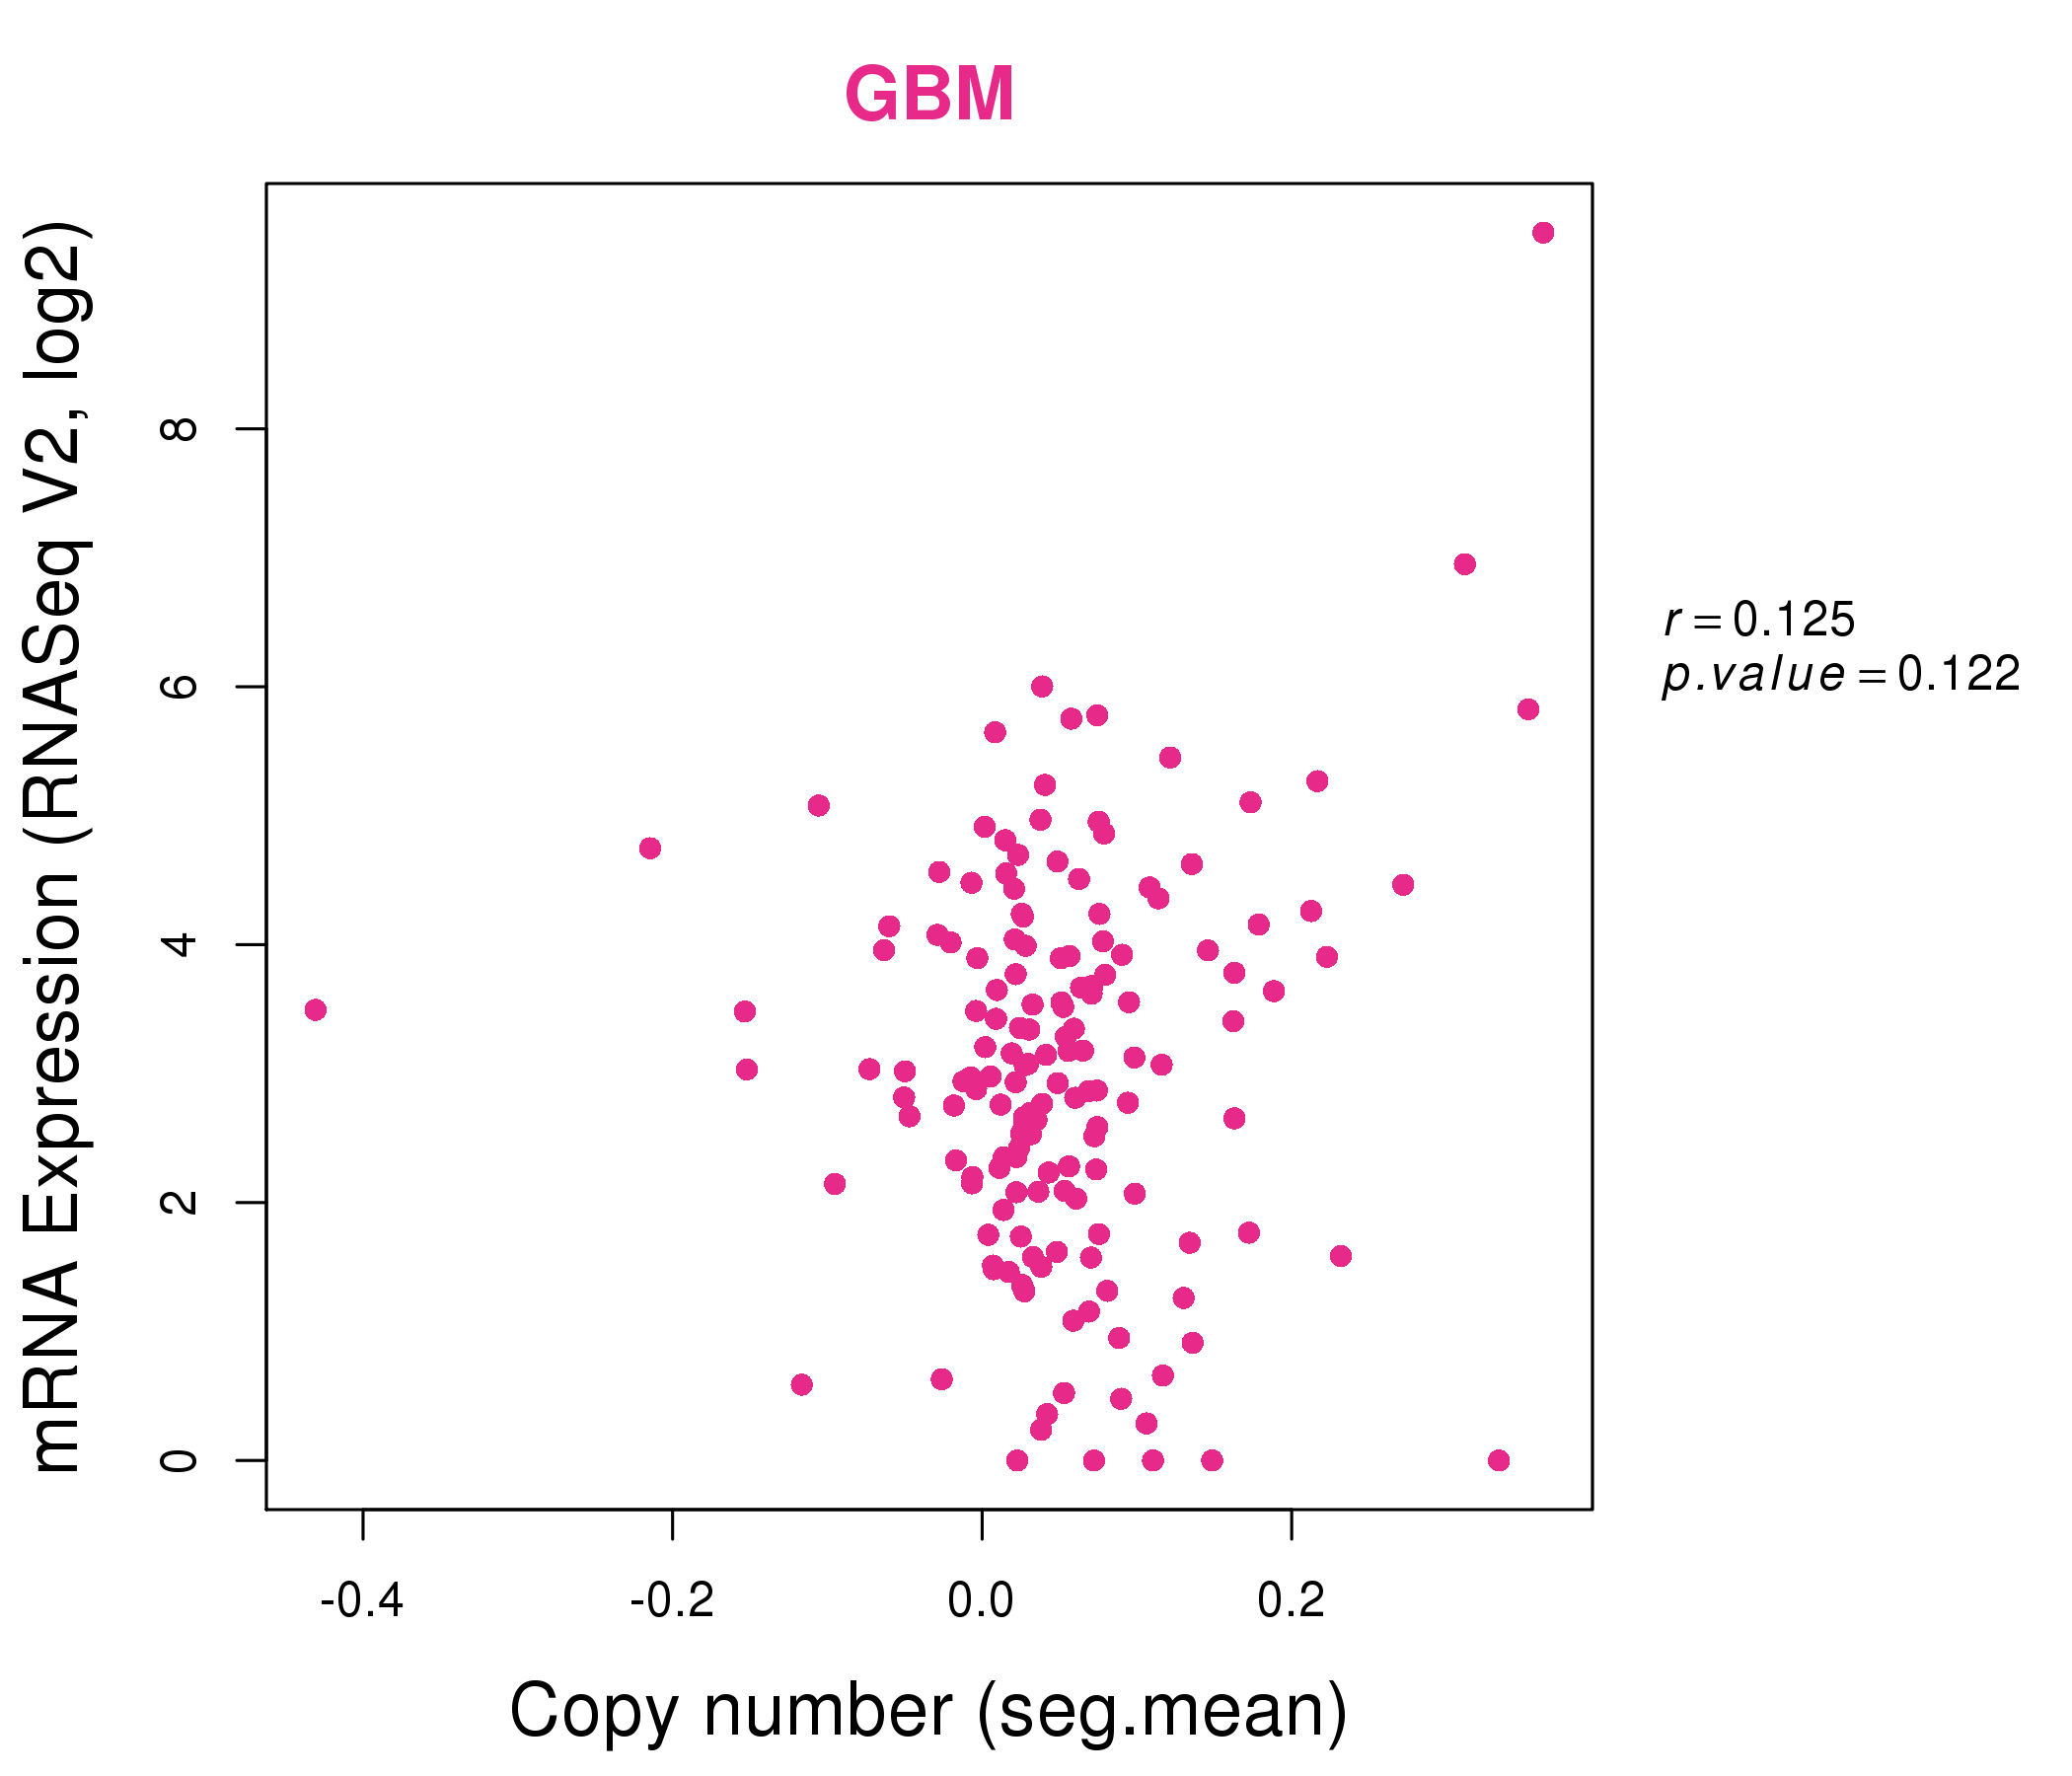
| * This plots show the correlation between CNV and gene expression. |
: Open all plots for all cancer types
 |
|
 |
|
| Top |
| Gene-Gene Network Information |
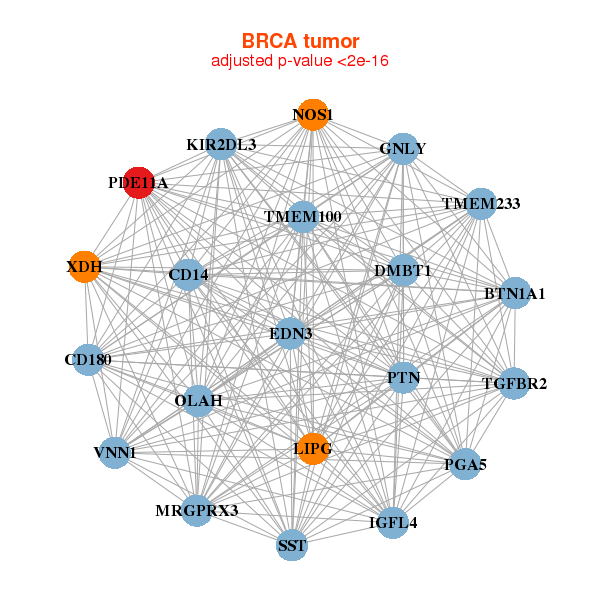
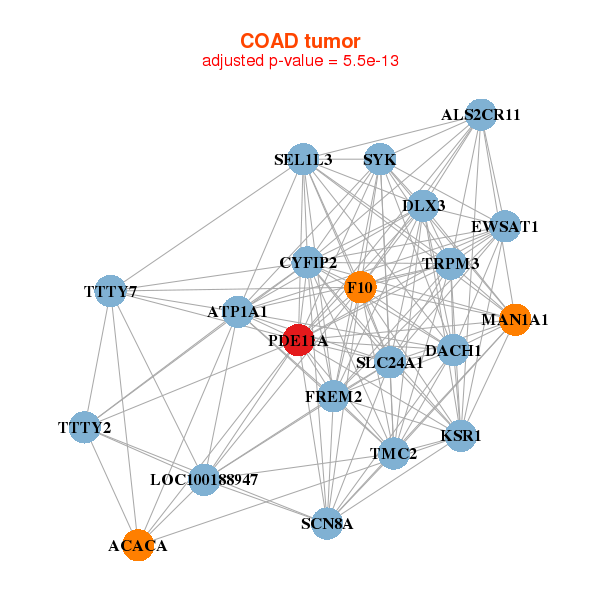
| * Co-Expression network figures were drawn using R package igraph. Only the top 20 genes with the highest correlations were shown. Red circle: input gene, orange circle: cell metabolism gene, sky circle: other gene |
: Open all plots for all cancer types
 |
| ||||
| BTN1A1,CD14,CD180,DMBT1,EDN3,GNLY,IGFL4, KIR2DL3,LIPG,MRGPRX3,NOS1,OLAH,PDE11A,PGA5, PTN,SST,TGFBR2,TMEM100,TMEM233,VNN1,XDH | ANKRD40,EPDR1,HSDL2,IDH3A,LOC100128164,MAP2K1,PDE11A, QKI,RAD23B,RTN4,SAMD4A,SEC23A,SETD7,SGCB, SH3GLB1,TMEM56,TTC7B,UGP2,YPEL2,YWHAG,ZEB1 | ||||
 |
| ||||
| ACACA,ALS2CR11,ATP1A1,CYFIP2,DACH1,DLX3,F10, FREM2,KSR1,LOC100188947,MAN1A1,PDE11A,SCN8A,SEL1L3, SLC24A1,SYK,TMC2,EWSAT1,TRPM3,TTTY2,TTTY7 | ACSL3,ADAMTS9,C6orf223,DHCR7,DNAJC10,DPY19L1,HIF1A, IL1RL1,INSIG1,LARP4,LIPG,LRP8,MUC4,MUC5B, NRGN,PCSK9,PDE11A,SEC23IP,SLC7A1,SQLE,SYNCRIP |
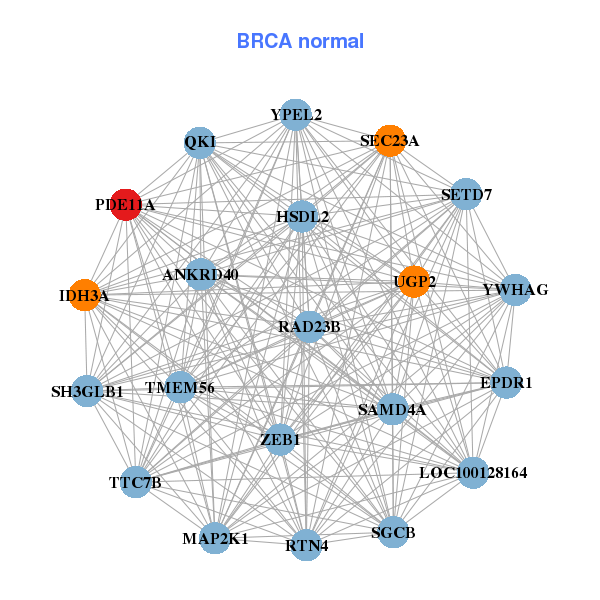
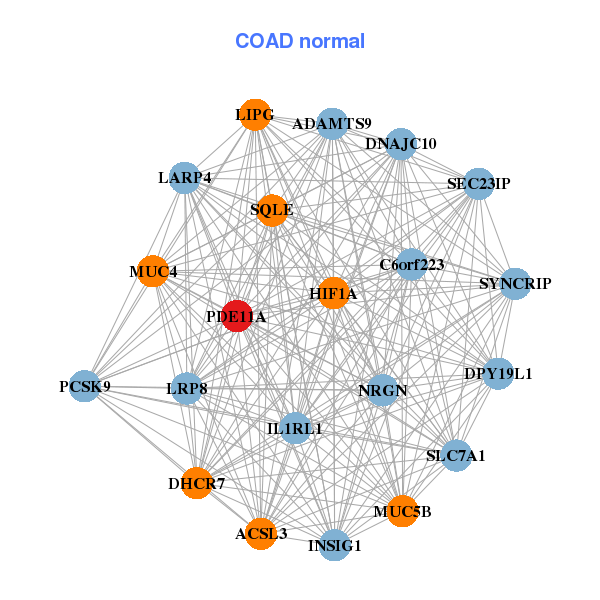
| * Co-Expression network figures were drawn using R package igraph. Only the top 20 genes with the highest correlations were shown. Red circle: input gene, orange circle: cell metabolism gene, sky circle: other gene |
: Open all plots for all cancer types
| Top |
: Open all interacting genes' information including KEGG pathway for all interacting genes from DAVID
| Top |
| Pharmacological Information for PDE11A |
| DB Category | DB Name | DB's ID and Url link |
| * Gene Centered Interaction Network. |
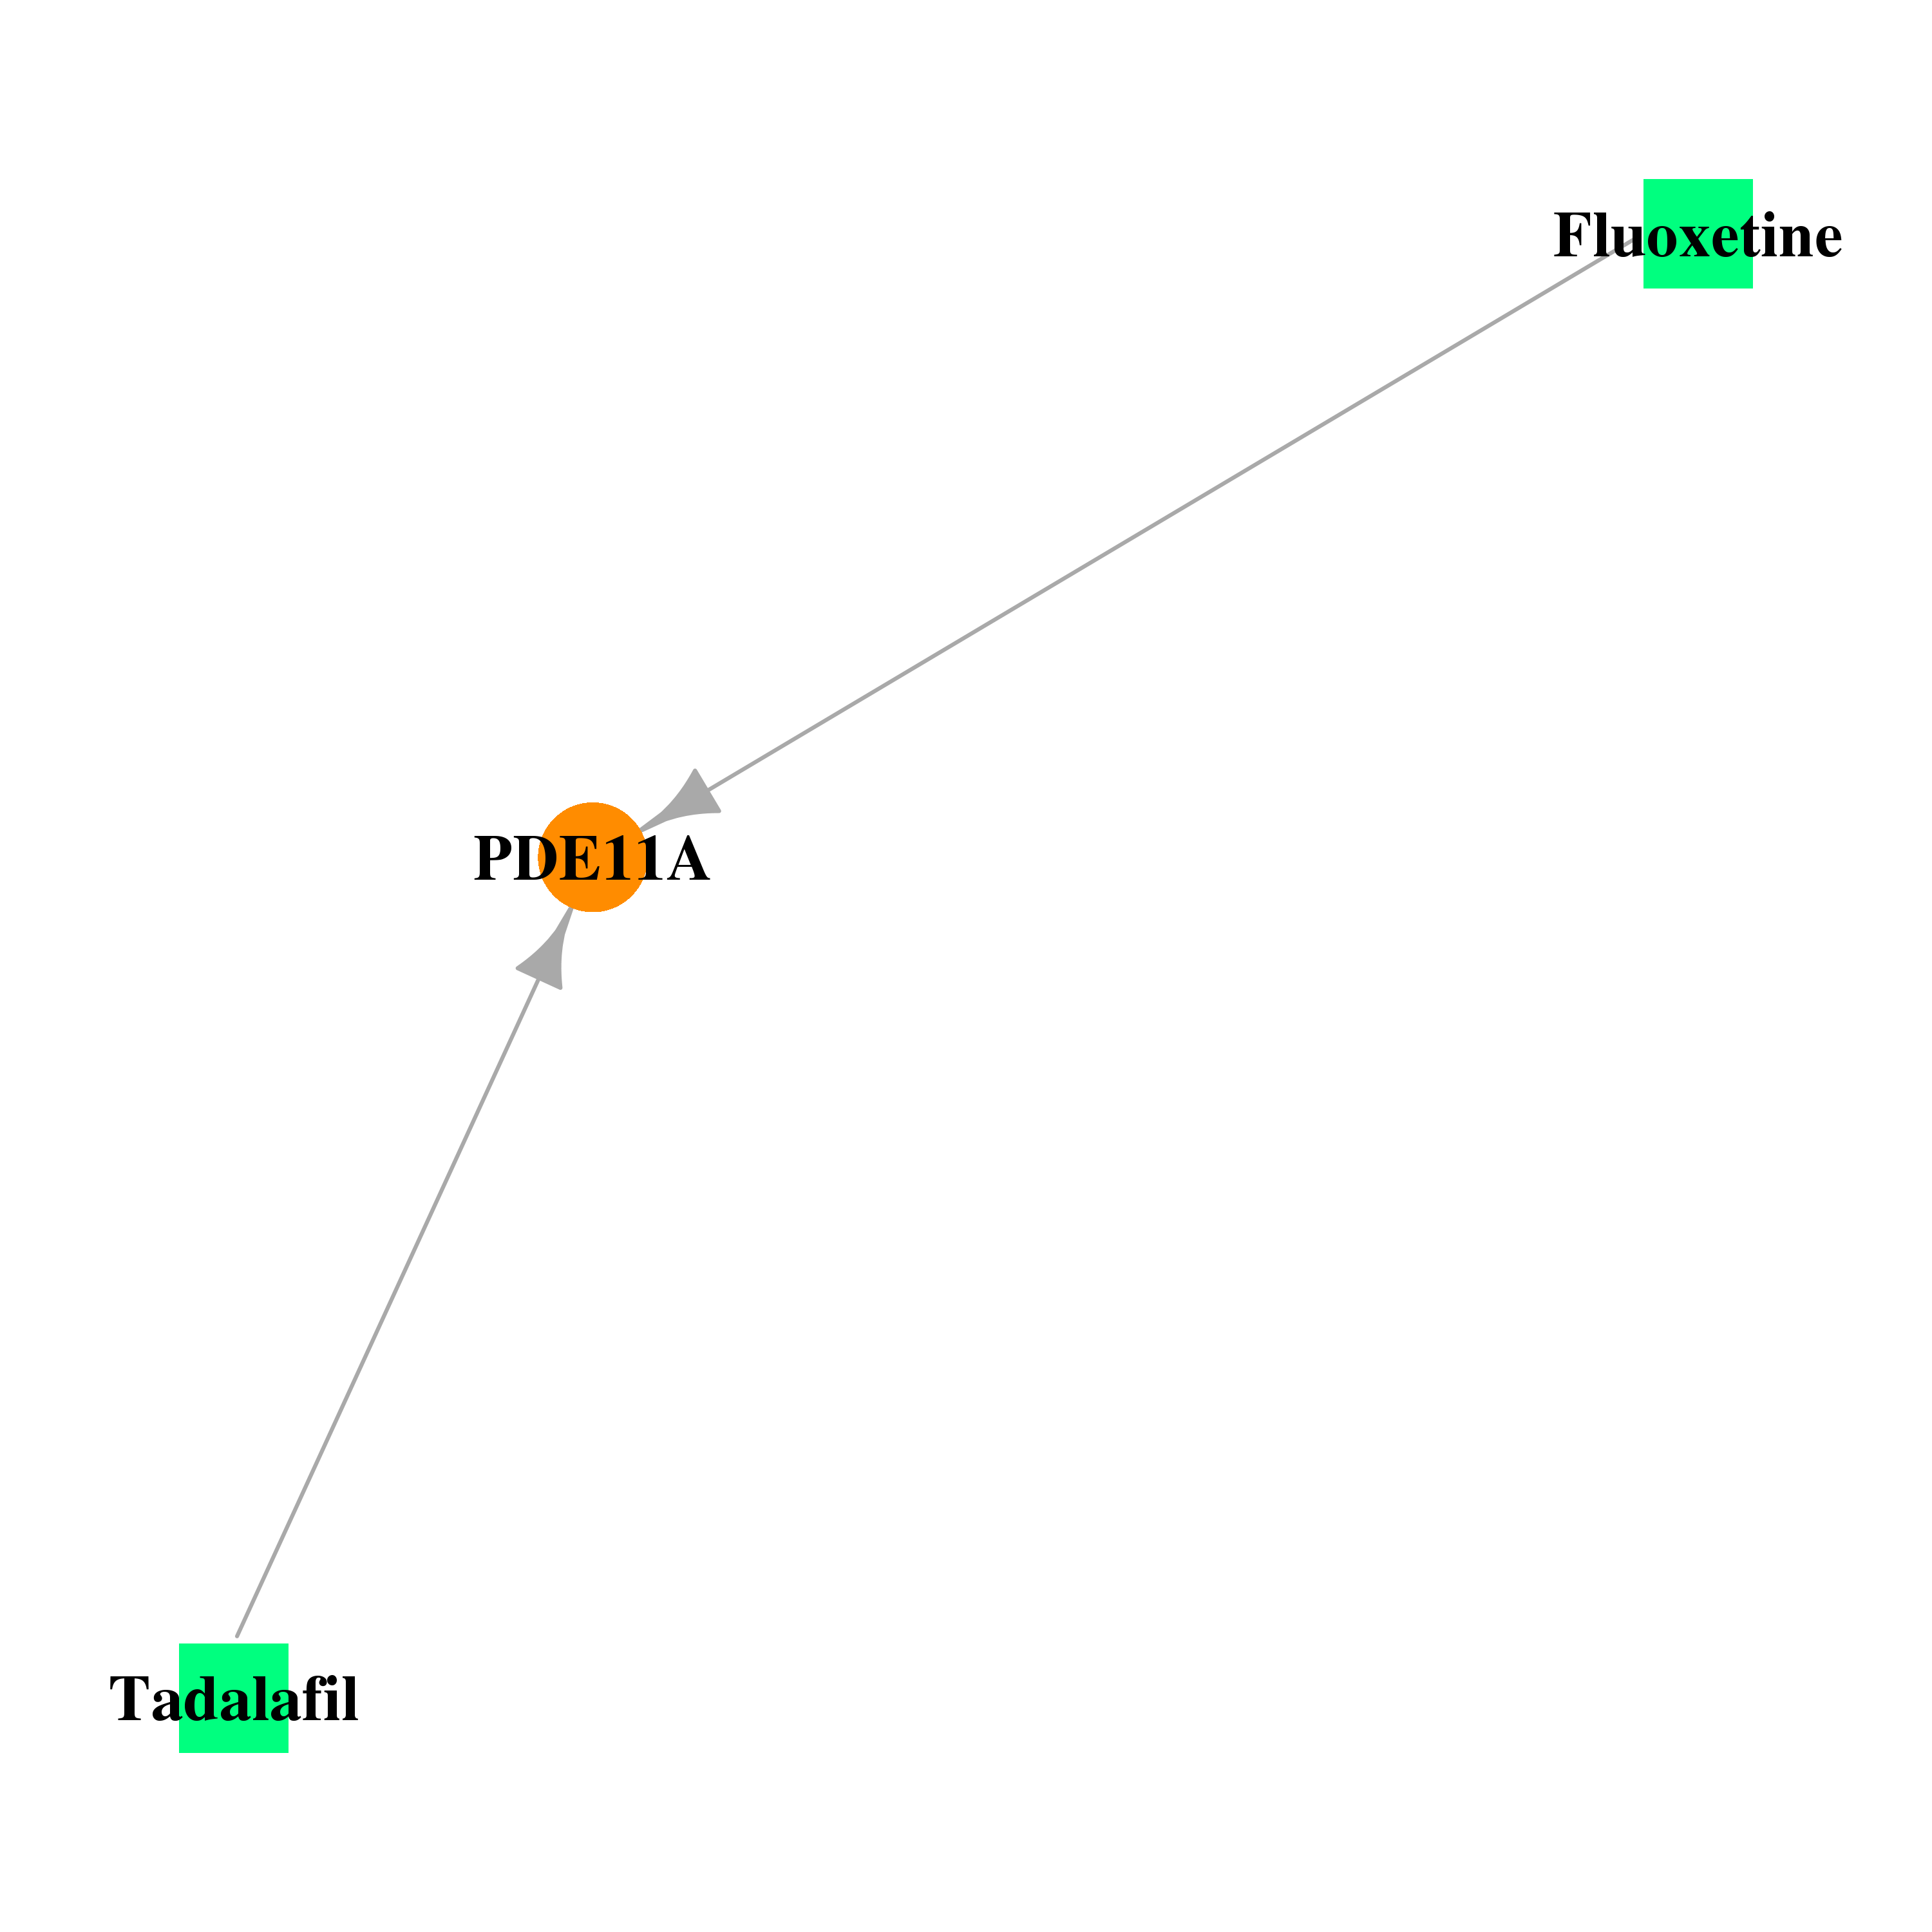 |
| * Drug Centered Interaction Network. |
| DrugBank ID | Target Name | Drug Groups | Generic Name | Drug Centered Network | Drug Structure |
| DB00820 | phosphodiesterase 11A | approved; investigational | Tadalafil | 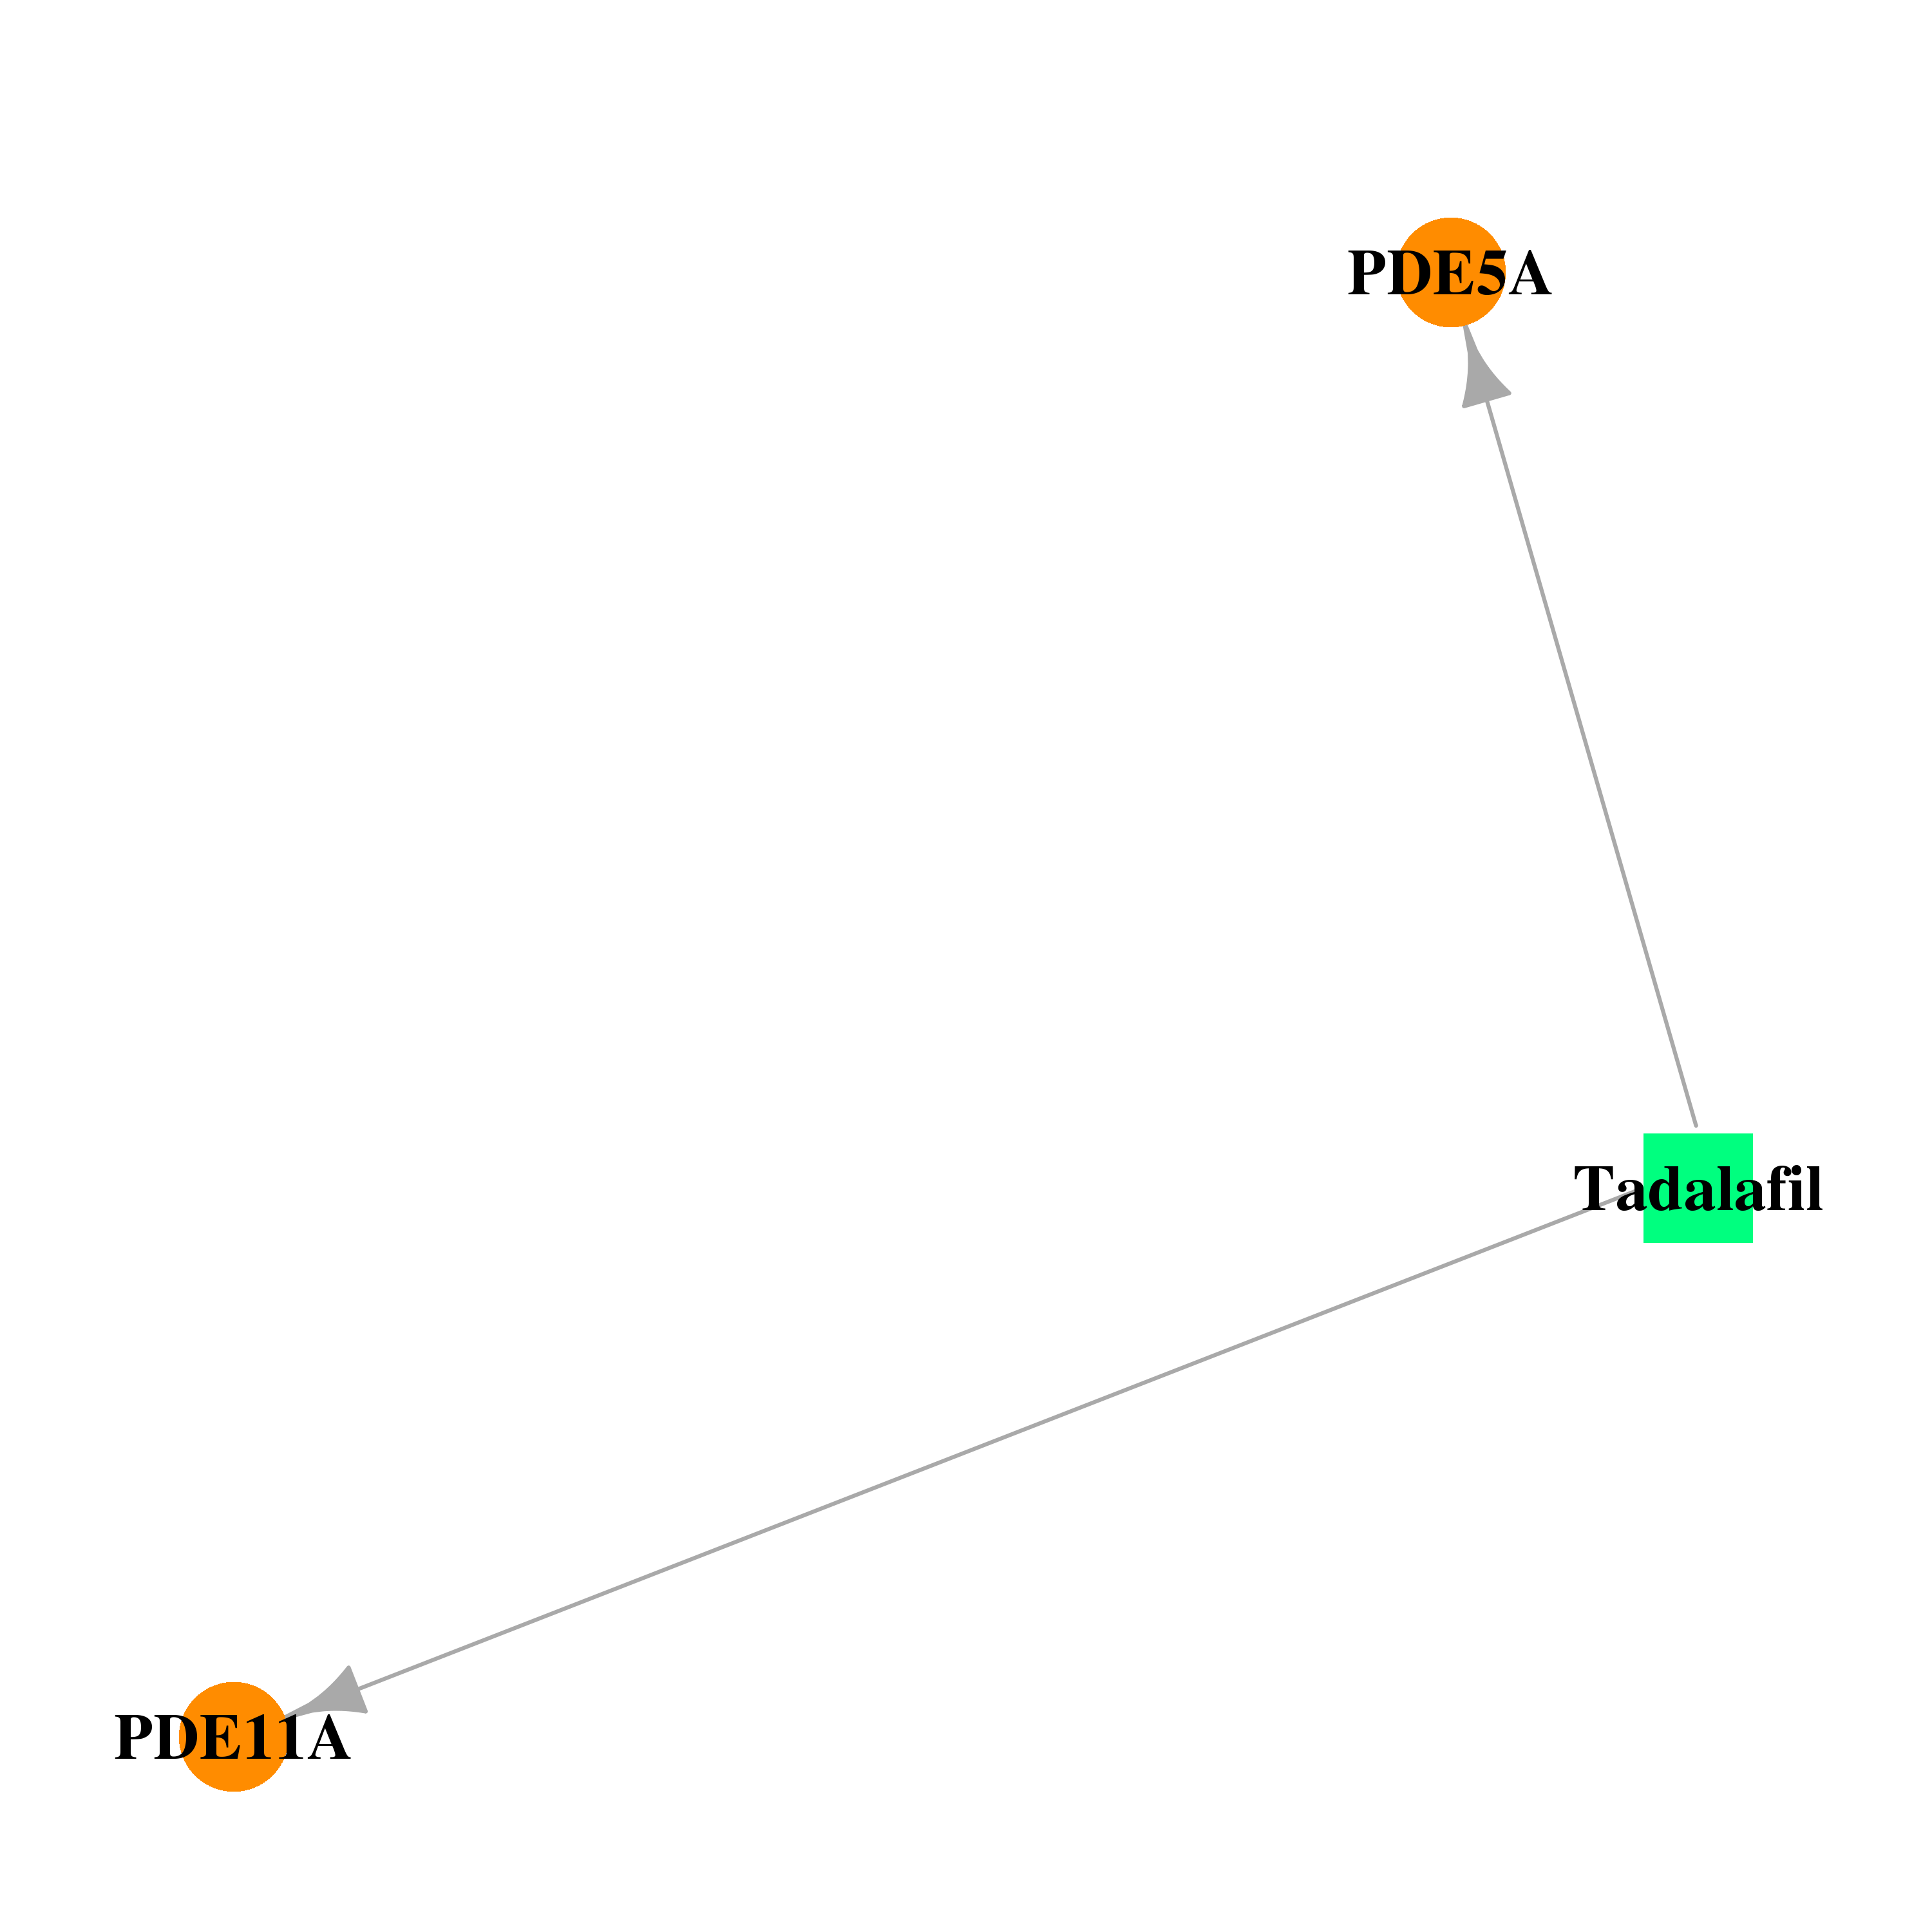 | 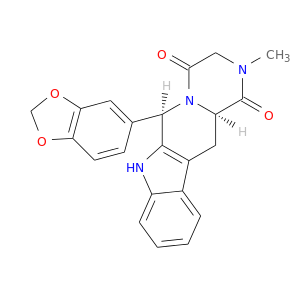 |
| DB00472 | phosphodiesterase 11A | approved | Fluoxetine | 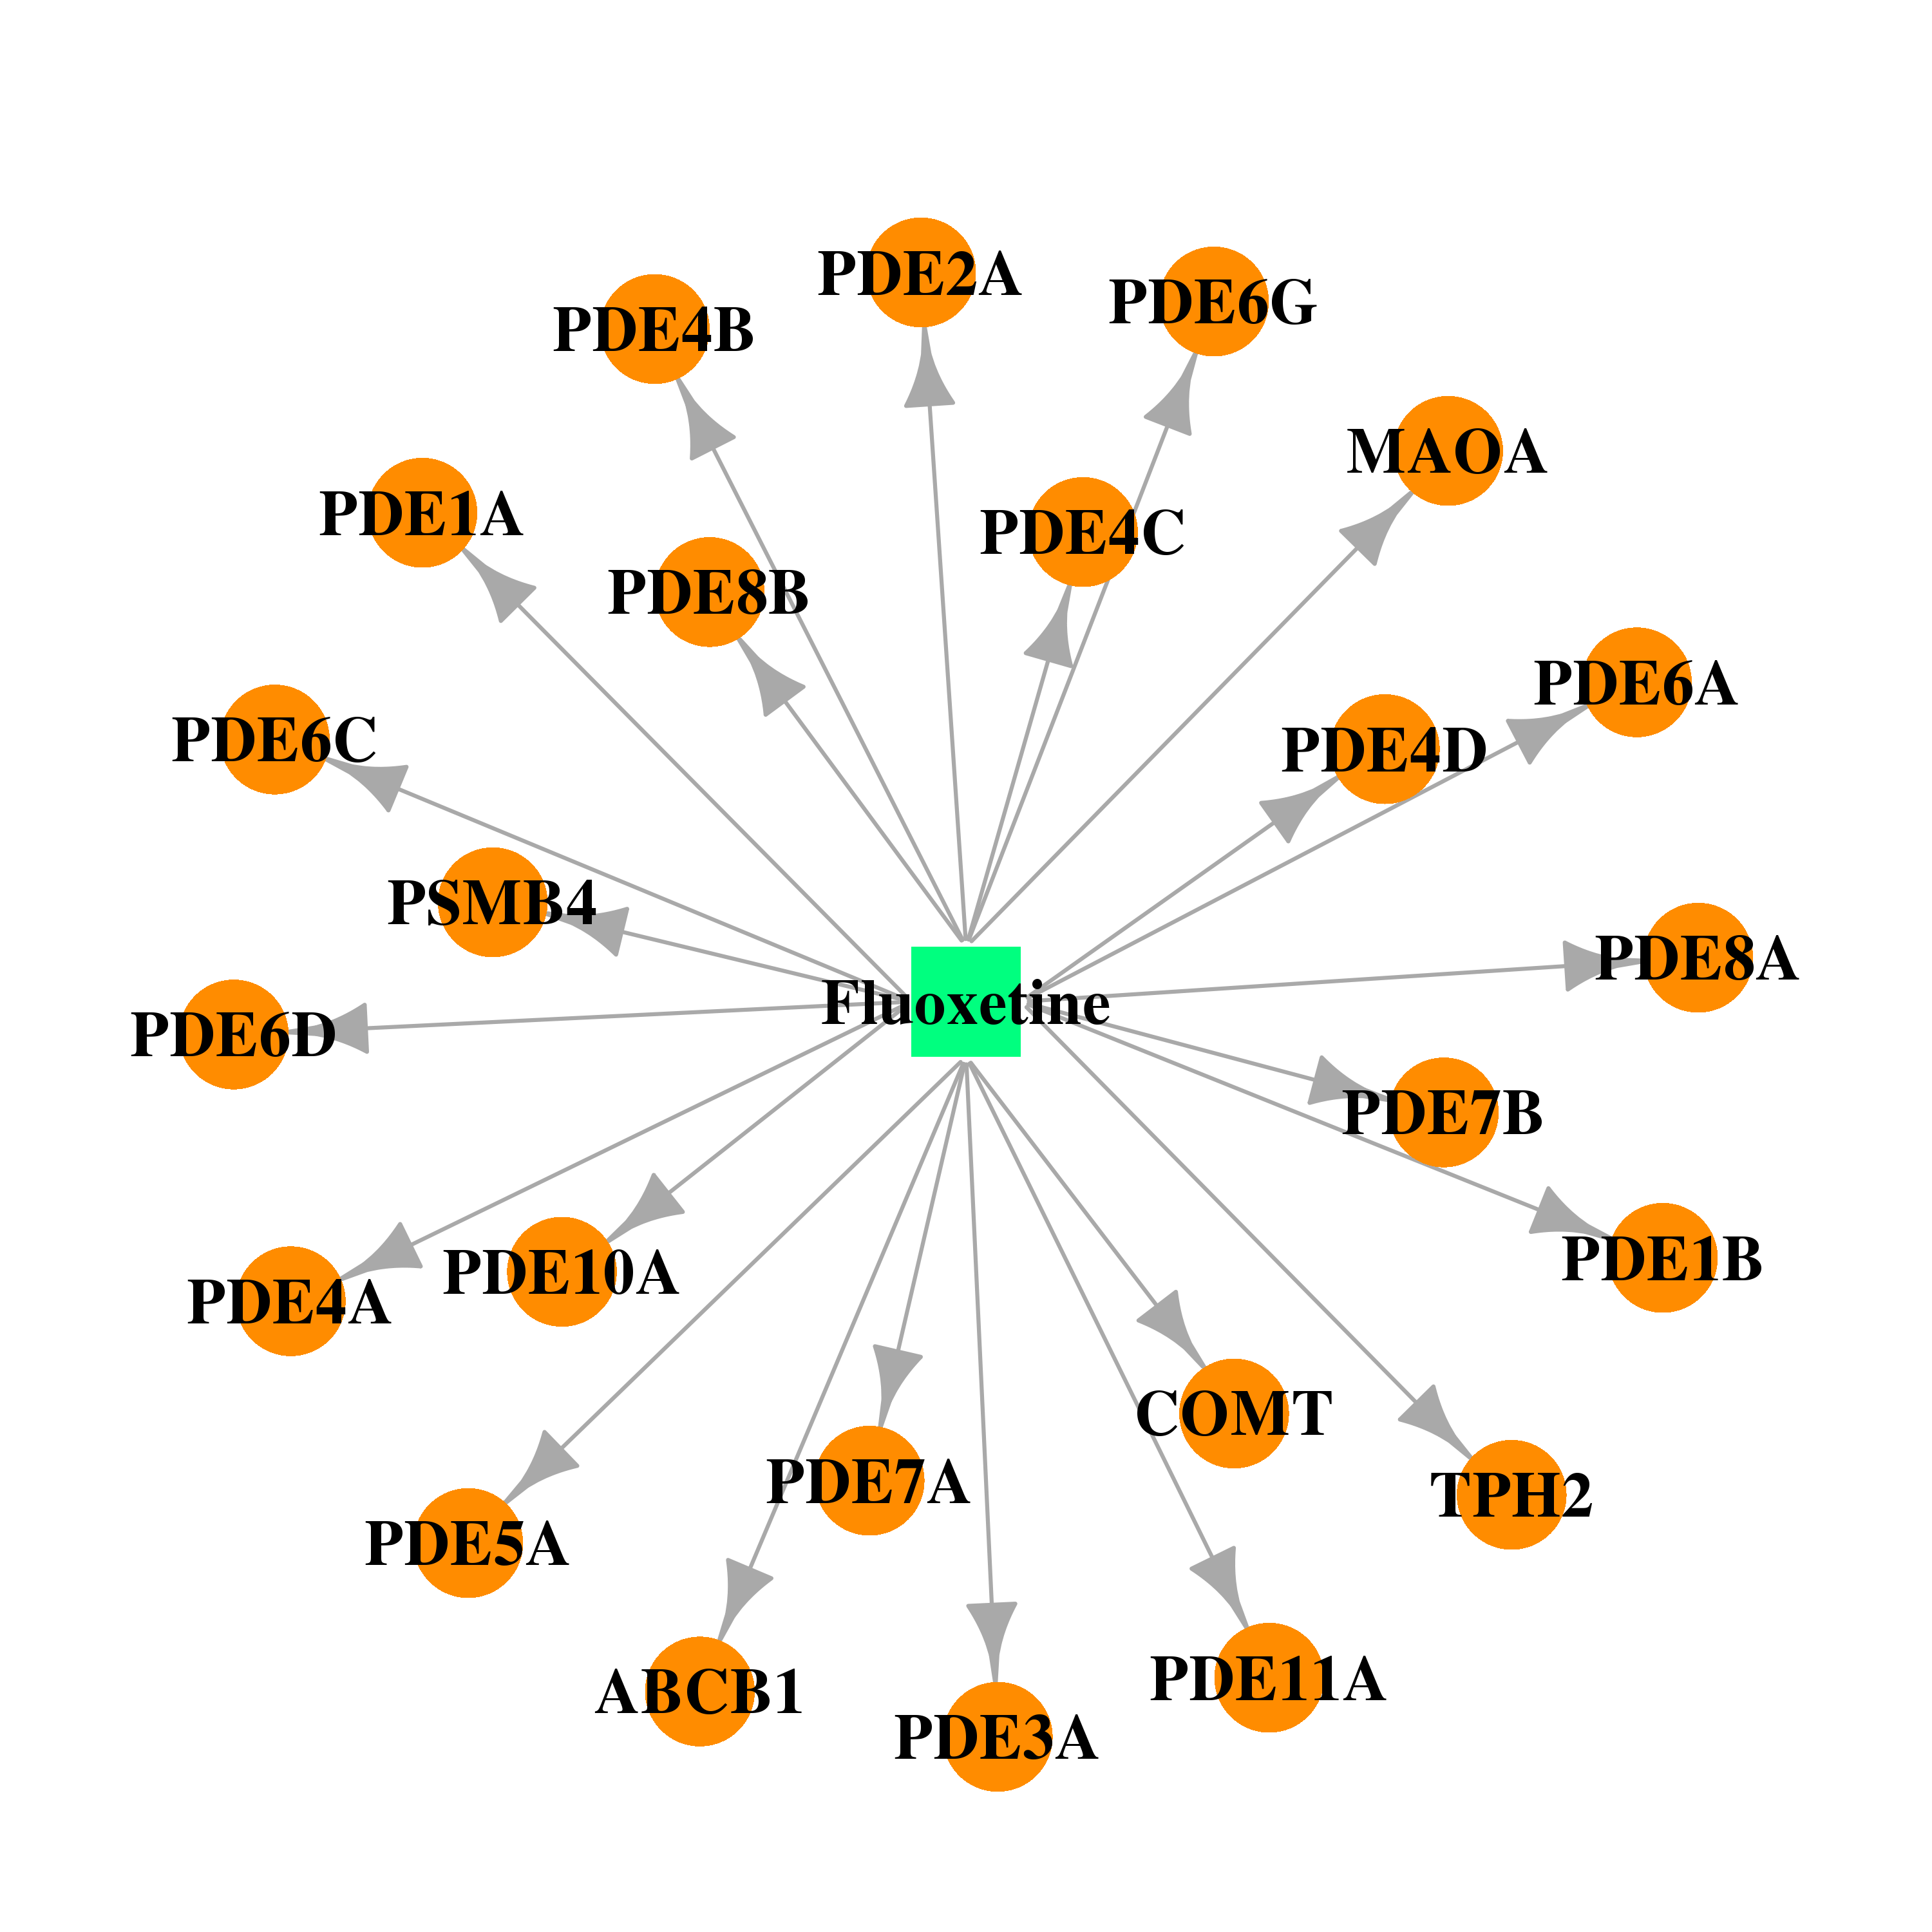 | 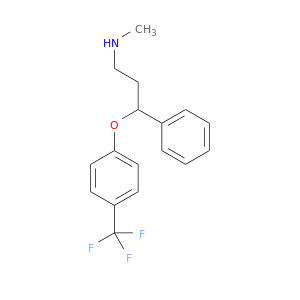 |
| Top |
| Cross referenced IDs for PDE11A |
| * We obtained these cross-references from Uniprot database. It covers 150 different DBs, 18 categories. http://www.uniprot.org/help/cross_references_section |
: Open all cross reference information
|
Copyright © 2016-Present - The Univsersity of Texas Health Science Center at Houston @ |