|
||||||||||||||||||||
| |
| Phenotypic Information (metabolism pathway, cancer, disease, phenome) |
| |
| |
| Gene-Gene Network Information: Co-Expression Network, Interacting Genes & KEGG |
| |
|


| Gene Summary for ST8SIA3 |
| Basic gene info. | Gene symbol | ST8SIA3 |
| Gene name | ST8 alpha-N-acetyl-neuraminide alpha-2,8-sialyltransferase 3 | |
| Synonyms | SIAT8C|ST8SiaIII | |
| Cytomap | UCSC genome browser: 18q21.31 | |
| Genomic location | chr18 :55019720-55036161 | |
| Type of gene | protein-coding | |
| RefGenes | NM_015879.2, | |
| Ensembl id | ENSG00000177511 | |
| Description | SIAT8-Calpha-2,8-sialyltransferase 8Calpha-2,8-sialyltransferase IIIsia-alpha-2,3-Gal-beta-1,4-GlcNAc-R:alpha 2,8-sialyltransferasesialyltransferase 8C (alpha2,3Galbeta1,4GlcNAcalpha 2,8-sialyltransferase)sialyltransferase St8Sia IIIsialytransferase | |
| Modification date | 20141207 | |
| dbXrefs | MIM : 609478 | |
| HGNC : HGNC | ||
| Ensembl : ENSG00000177511 | ||
| HPRD : 15343 | ||
| Vega : OTTHUMG00000180101 | ||
| Protein | UniProt: go to UniProt's Cross Reference DB Table | |
| Expression | CleanEX: HS_ST8SIA3 | |
| BioGPS: 51046 | ||
| Gene Expression Atlas: ENSG00000177511 | ||
| The Human Protein Atlas: ENSG00000177511 | ||
| Pathway | NCI Pathway Interaction Database: ST8SIA3 | |
| KEGG: ST8SIA3 | ||
| REACTOME: ST8SIA3 | ||
| ConsensusPathDB | ||
| Pathway Commons: ST8SIA3 | ||
| Metabolism | MetaCyc: ST8SIA3 | |
| HUMANCyc: ST8SIA3 | ||
| Regulation | Ensembl's Regulation: ENSG00000177511 | |
| miRBase: chr18 :55,019,720-55,036,161 | ||
| TargetScan: NM_015879 | ||
| cisRED: ENSG00000177511 | ||
| Context | iHOP: ST8SIA3 | |
| cancer metabolism search in PubMed: ST8SIA3 | ||
| UCL Cancer Institute: ST8SIA3 | ||
| Assigned class in ccmGDB | C | |
| Top |
| Phenotypic Information for ST8SIA3(metabolism pathway, cancer, disease, phenome) |
| Cancer | CGAP: ST8SIA3 |
| Familial Cancer Database: ST8SIA3 | |
| * This gene is included in those cancer gene databases. |
|
|
|
|
|
| . | ||||||||||||||
Oncogene 1 | Significant driver gene in | |||||||||||||||||||
| cf) number; DB name 1 Oncogene; http://nar.oxfordjournals.org/content/35/suppl_1/D721.long, 2 Tumor Suppressor gene; https://bioinfo.uth.edu/TSGene/, 3 Cancer Gene Census; http://www.nature.com/nrc/journal/v4/n3/abs/nrc1299.html, 4 CancerGenes; http://nar.oxfordjournals.org/content/35/suppl_1/D721.long, 5 Network of Cancer Gene; http://ncg.kcl.ac.uk/index.php, 1Therapeutic Vulnerabilities in Cancer; http://cbio.mskcc.org/cancergenomics/statius/ |
| REACTOME_METABOLISM_OF_PROTEINS | |
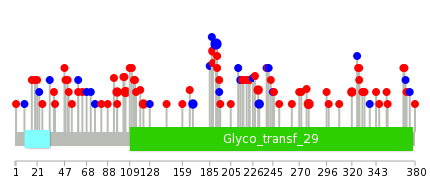
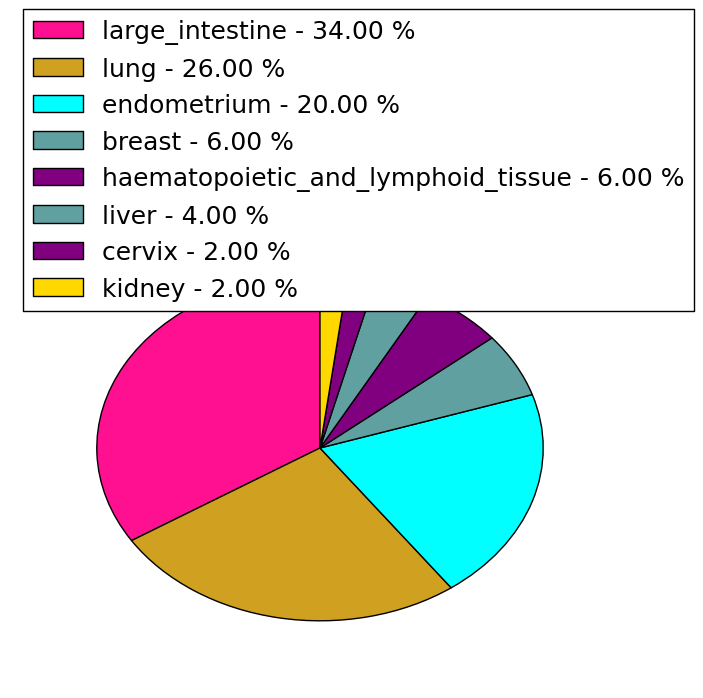
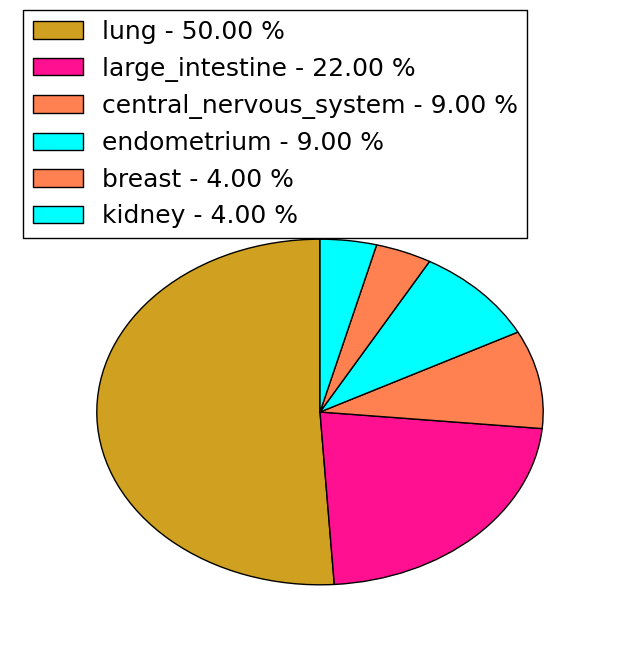
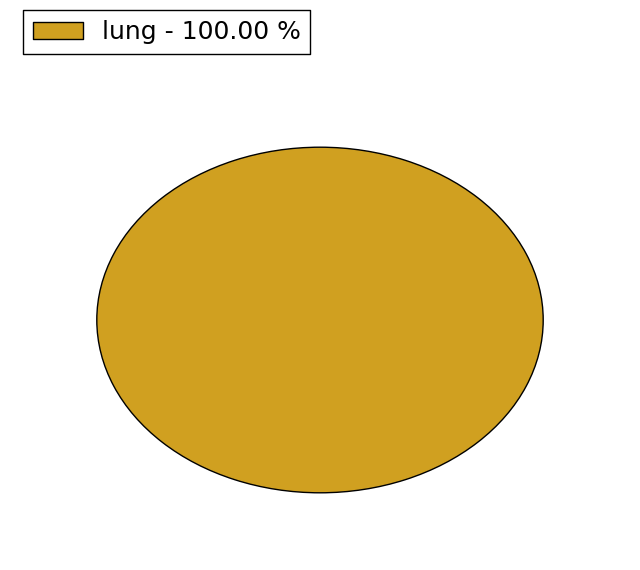
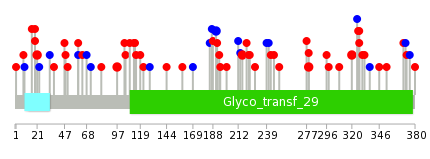
| Mutations for ST8SIA3 |
| * Under tables are showing count per each tissue to give us broad intuition about tissue specific mutation patterns.You can go to the detailed page for each mutation database's web site. |
| There's no structural variation information in COSMIC data for this gene. |
| * From mRNA Sanger sequences, Chitars2.0 arranged chimeric transcripts. This table shows ST8SIA3 related fusion information. |
| ID | Head Gene | Tail Gene | Accession | Gene_a | qStart_a | qEnd_a | Chromosome_a | tStart_a | tEnd_a | Gene_a | qStart_a | qEnd_a | Chromosome_a | tStart_a | tEnd_a |
| CA773823 | ST8SIA3 | 4 | 278 | 18 | 55030334 | 55030607 | ST8SIA3 | 274 | 347 | 18 | 55028520 | 55028593 | |
| Top |
| There's no copy number variation information in COSMIC data for this gene. |
| Top |
|
 |
| Top |
| Stat. for Non-Synonymous SNVs (# total SNVs=50) | (# total SNVs=22) |
 |  |
(# total SNVs=1) | (# total SNVs=0) |
 |
| Top |
| * When you move the cursor on each content, you can see more deailed mutation information on the Tooltip. Those are primary_site,primary_histology,mutation(aa),pubmedID. |
| GRCh37 position | Mutation(aa) | Unique sampleID count |
| chr18:55024414-55024414 | p.F191F | 5 |
| chr18:55024154-55024154 | p.L105I | 3 |
| chr18:55024677-55024677 | p.G279E | 3 |
| chr18:55021743-55021743 | p.F97C | 3 |
| chr18:55024534-55024534 | p.F231L | 2 |
| chr18:55024348-55024348 | p.G169G | 2 |
| chr18:55024537-55024537 | p.F232F | 2 |
| chr18:55024403-55024403 | p.R188C | 2 |
| chr18:55024205-55024205 | p.R122W | 2 |
| chr18:55027323-55027323 | p.G320R | 2 |
| Top |
|
 |
| Point Mutation/ Tissue ID | 1 | 2 | 3 | 4 | 5 | 6 | 7 | 8 | 9 | 10 | 11 | 12 | 13 | 14 | 15 | 16 | 17 | 18 | 19 | 20 |
| # sample | 1 | 2 | 1 | 13 | 1 | 2 | 2 | 8 | 8 | 1 | 18 | 3 | 7 | |||||||
| # mutation | 1 | 2 | 1 | 15 | 1 | 2 | 2 | 8 | 10 | 1 | 20 | 2 | 10 | |||||||
| nonsynonymous SNV | 1 | 1 | 1 | 13 | 2 | 1 | 8 | 3 | 1 | 14 | 2 | 8 | ||||||||
| synonymous SNV | 1 | 2 | 1 | 1 | 7 | 6 | 2 |
| cf) Tissue ID; Tissue type (1; BLCA[Bladder Urothelial Carcinoma], 2; BRCA[Breast invasive carcinoma], 3; CESC[Cervical squamous cell carcinoma and endocervical adenocarcinoma], 4; COAD[Colon adenocarcinoma], 5; GBM[Glioblastoma multiforme], 6; Glioma Low Grade, 7; HNSC[Head and Neck squamous cell carcinoma], 8; KICH[Kidney Chromophobe], 9; KIRC[Kidney renal clear cell carcinoma], 10; KIRP[Kidney renal papillary cell carcinoma], 11; LAML[Acute Myeloid Leukemia], 12; LUAD[Lung adenocarcinoma], 13; LUSC[Lung squamous cell carcinoma], 14; OV[Ovarian serous cystadenocarcinoma ], 15; PAAD[Pancreatic adenocarcinoma], 16; PRAD[Prostate adenocarcinoma], 17; SKCM[Skin Cutaneous Melanoma], 18:STAD[Stomach adenocarcinoma], 19:THCA[Thyroid carcinoma], 20:UCEC[Uterine Corpus Endometrial Carcinoma]) |
| Top |
| * We represented just top 10 SNVs. When you move the cursor on each content, you can see more deailed mutation information on the Tooltip. Those are primary_site, primary_histology, mutation(aa), pubmedID. |
| Genomic Position | Mutation(aa) | Unique sampleID count |
| chr18:55027323 | p.A21T | 2 |
| chr18:55020138 | p.G279E | 2 |
| chr18:55021743 | p.E216K | 2 |
| chr18:55024487 | p.G320R | 2 |
| chr18:55024677 | p.F97C | 2 |
| chr18:55024414 | p.F191F | 2 |
| chr18:55020133 | p.D109N | 1 |
| chr18:55024415 | p.E195K | 1 |
| chr18:55027470 | p.T372N | 1 |
| chr18:55021644 | p.L23L | 1 |
| * Copy number data were extracted from TCGA using R package TCGA-Assembler. The URLs of all public data files on TCGA DCC data server were gathered on Jan-05-2015. Function ProcessCNAData in TCGA-Assembler package was used to obtain gene-level copy number value which is calculated as the average copy number of the genomic region of a gene. |
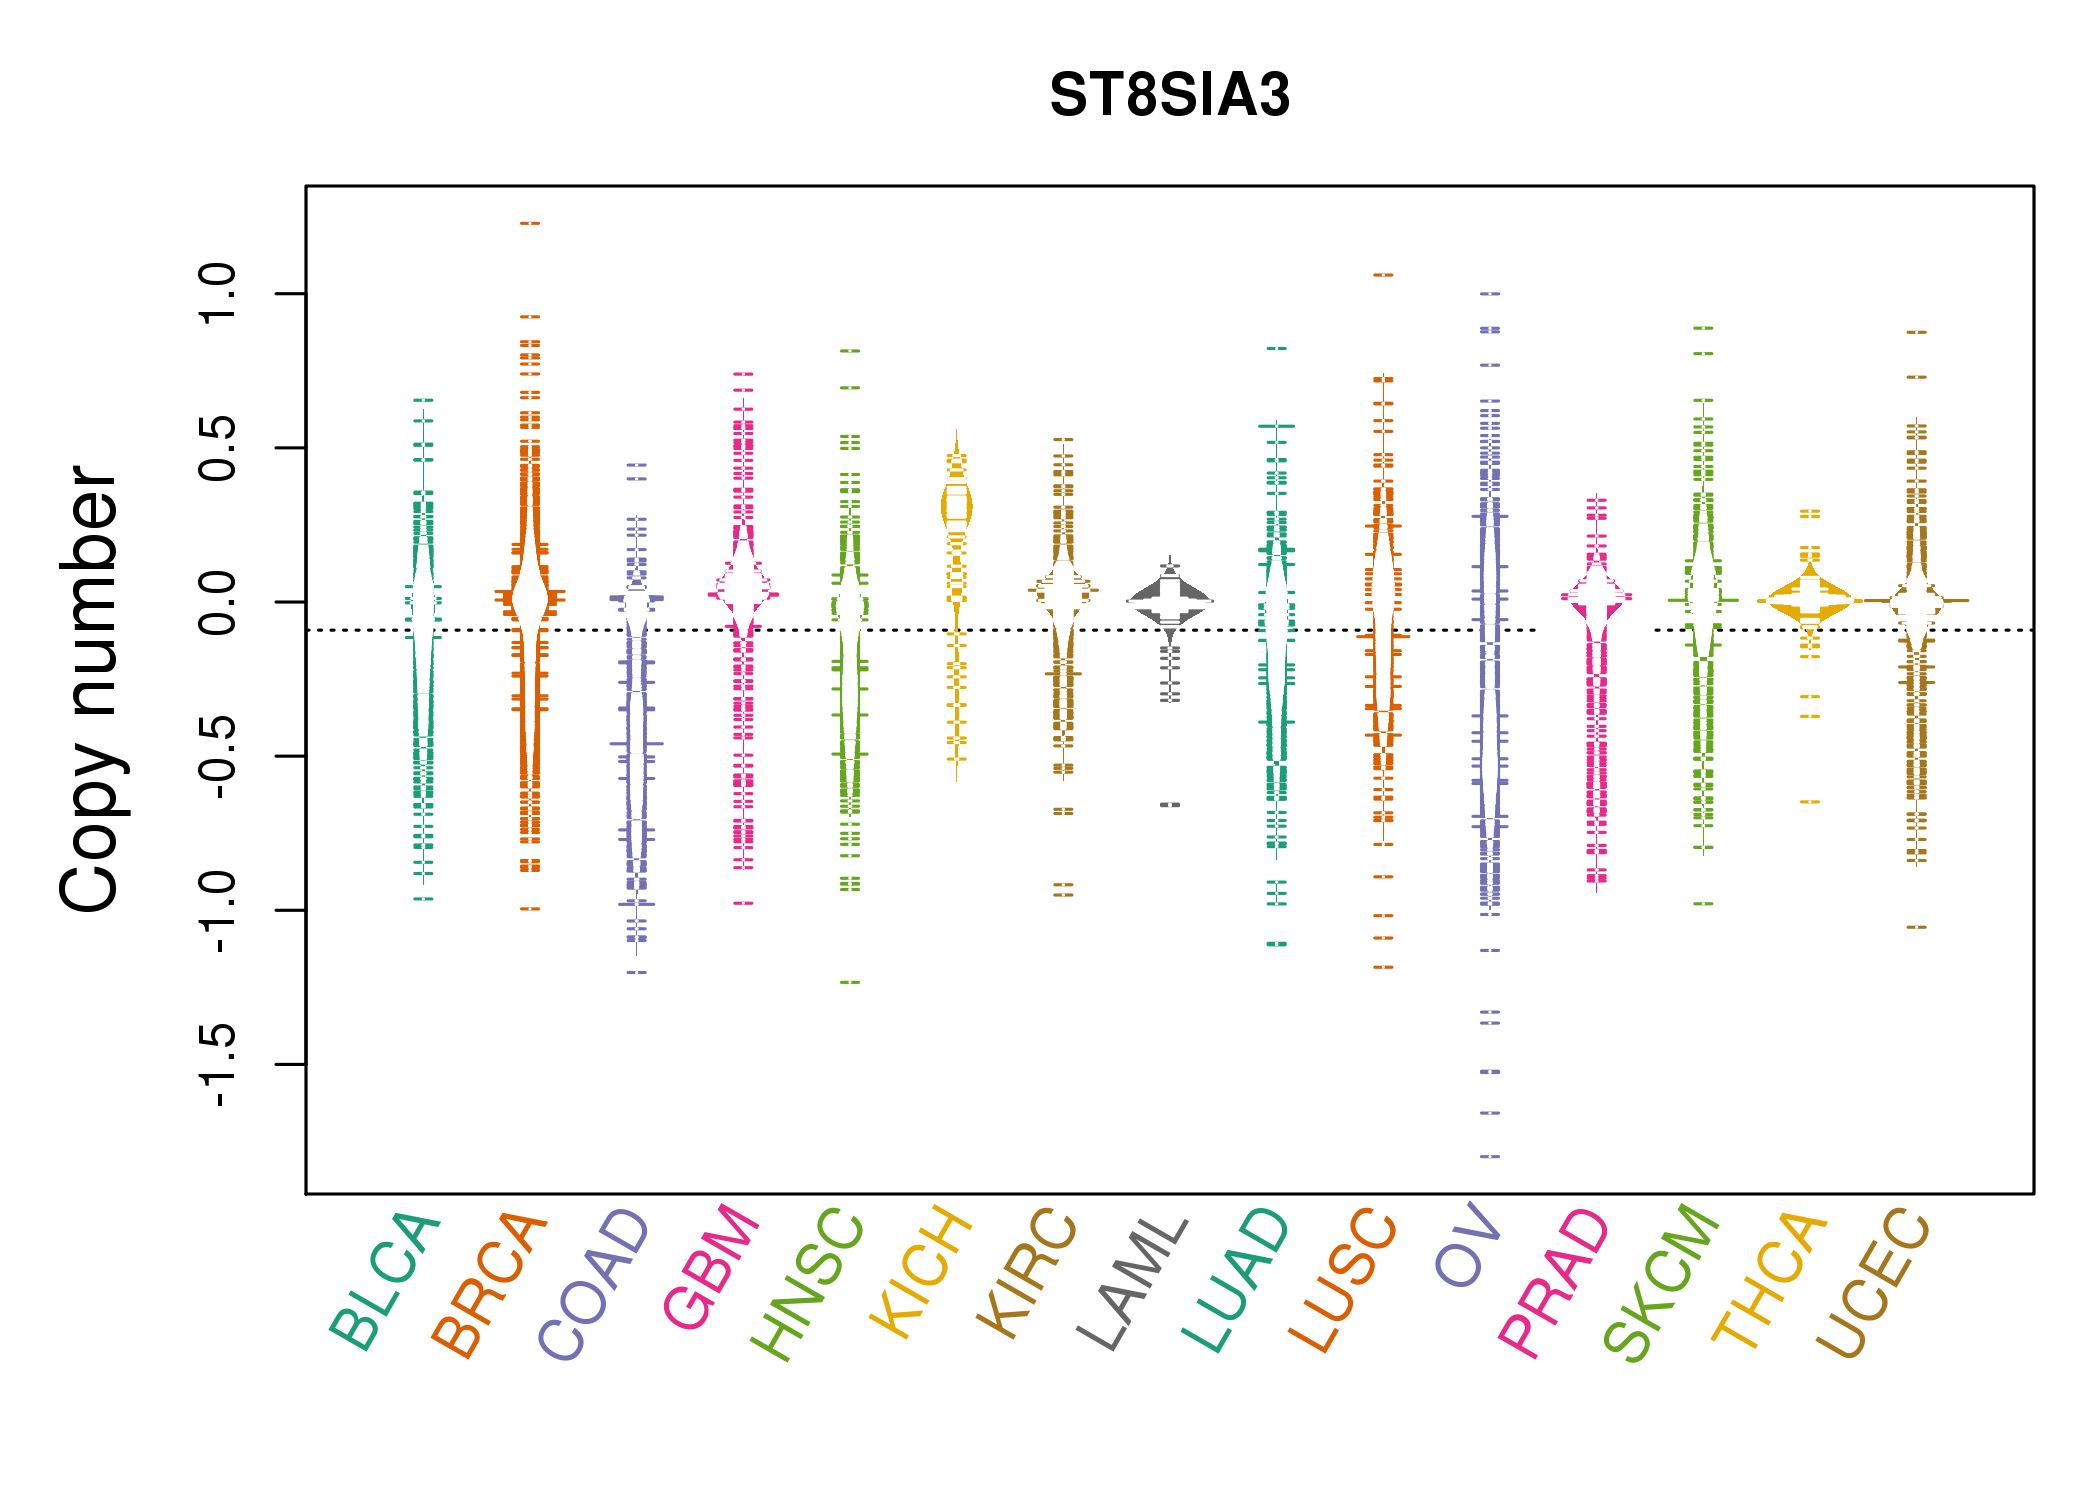 |
| cf) Tissue ID[Tissue type]: BLCA[Bladder Urothelial Carcinoma], BRCA[Breast invasive carcinoma], CESC[Cervical squamous cell carcinoma and endocervical adenocarcinoma], COAD[Colon adenocarcinoma], GBM[Glioblastoma multiforme], Glioma Low Grade, HNSC[Head and Neck squamous cell carcinoma], KICH[Kidney Chromophobe], KIRC[Kidney renal clear cell carcinoma], KIRP[Kidney renal papillary cell carcinoma], LAML[Acute Myeloid Leukemia], LUAD[Lung adenocarcinoma], LUSC[Lung squamous cell carcinoma], OV[Ovarian serous cystadenocarcinoma ], PAAD[Pancreatic adenocarcinoma], PRAD[Prostate adenocarcinoma], SKCM[Skin Cutaneous Melanoma], STAD[Stomach adenocarcinoma], THCA[Thyroid carcinoma], UCEC[Uterine Corpus Endometrial Carcinoma] |
| Top |
| Gene Expression for ST8SIA3 |
| * CCLE gene expression data were extracted from CCLE_Expression_Entrez_2012-10-18.res: Gene-centric RMA-normalized mRNA expression data. |
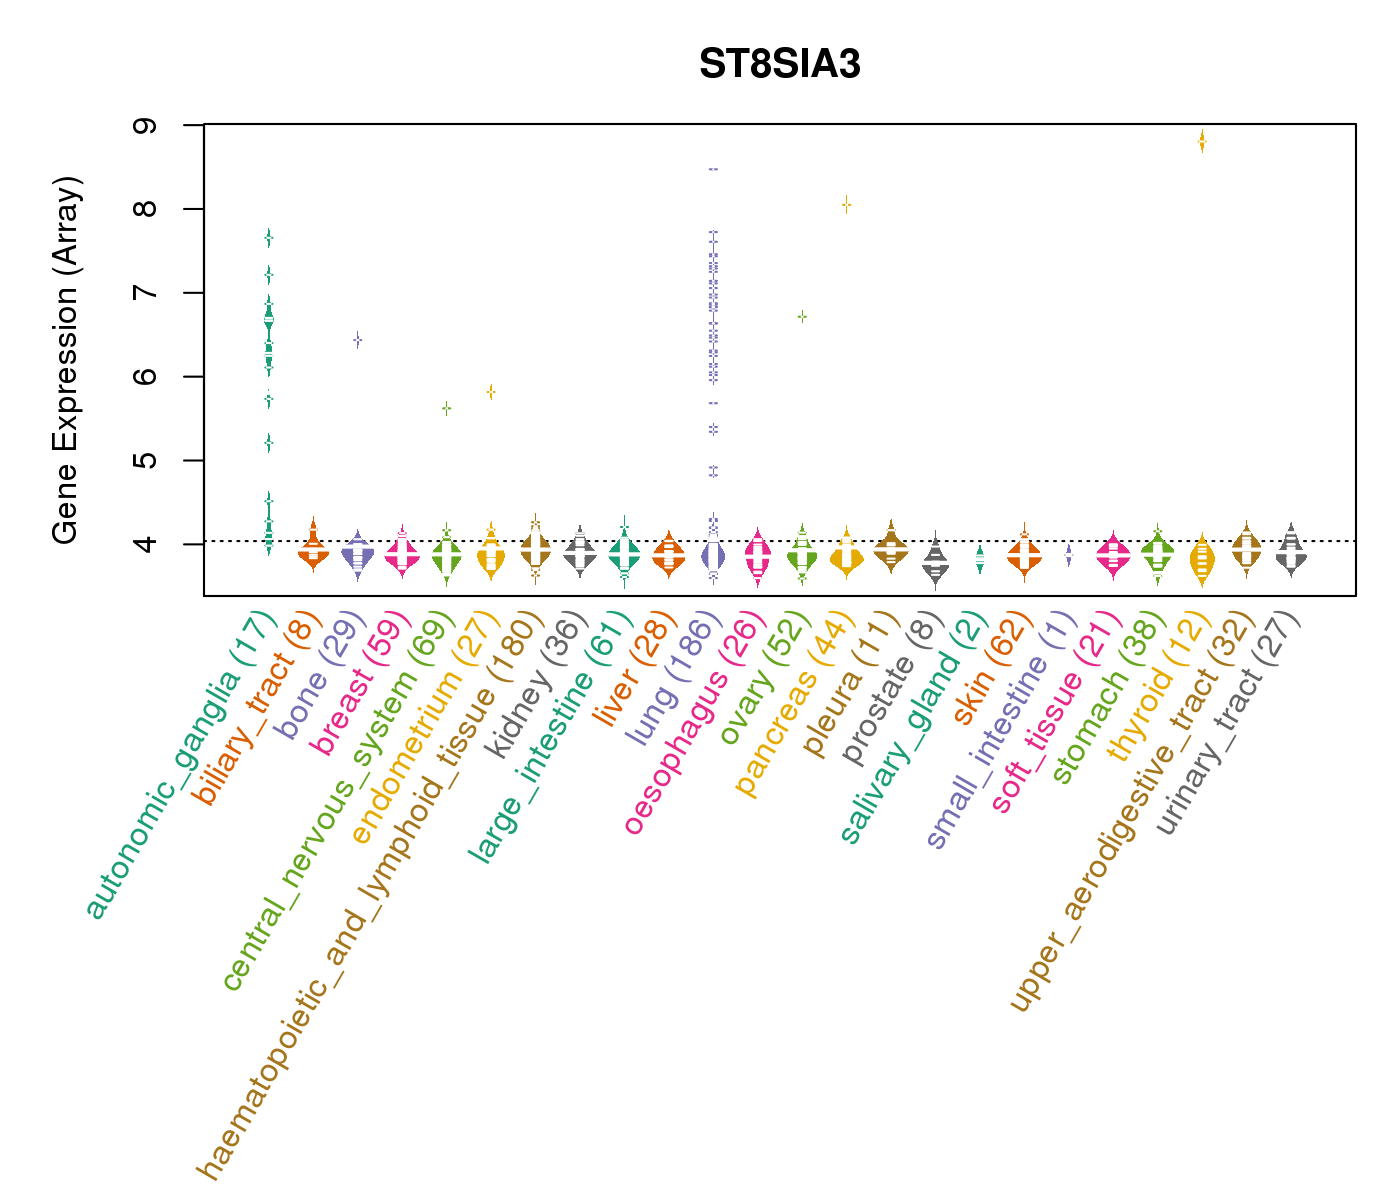 |
| * Normalized gene expression data of RNASeqV2 was extracted from TCGA using R package TCGA-Assembler. The URLs of all public data files on TCGA DCC data server were gathered at Jan-05-2015. Only eight cancer types have enough normal control samples for differential expression analysis. (t test, adjusted p<0.05 (using Benjamini-Hochberg FDR)) |
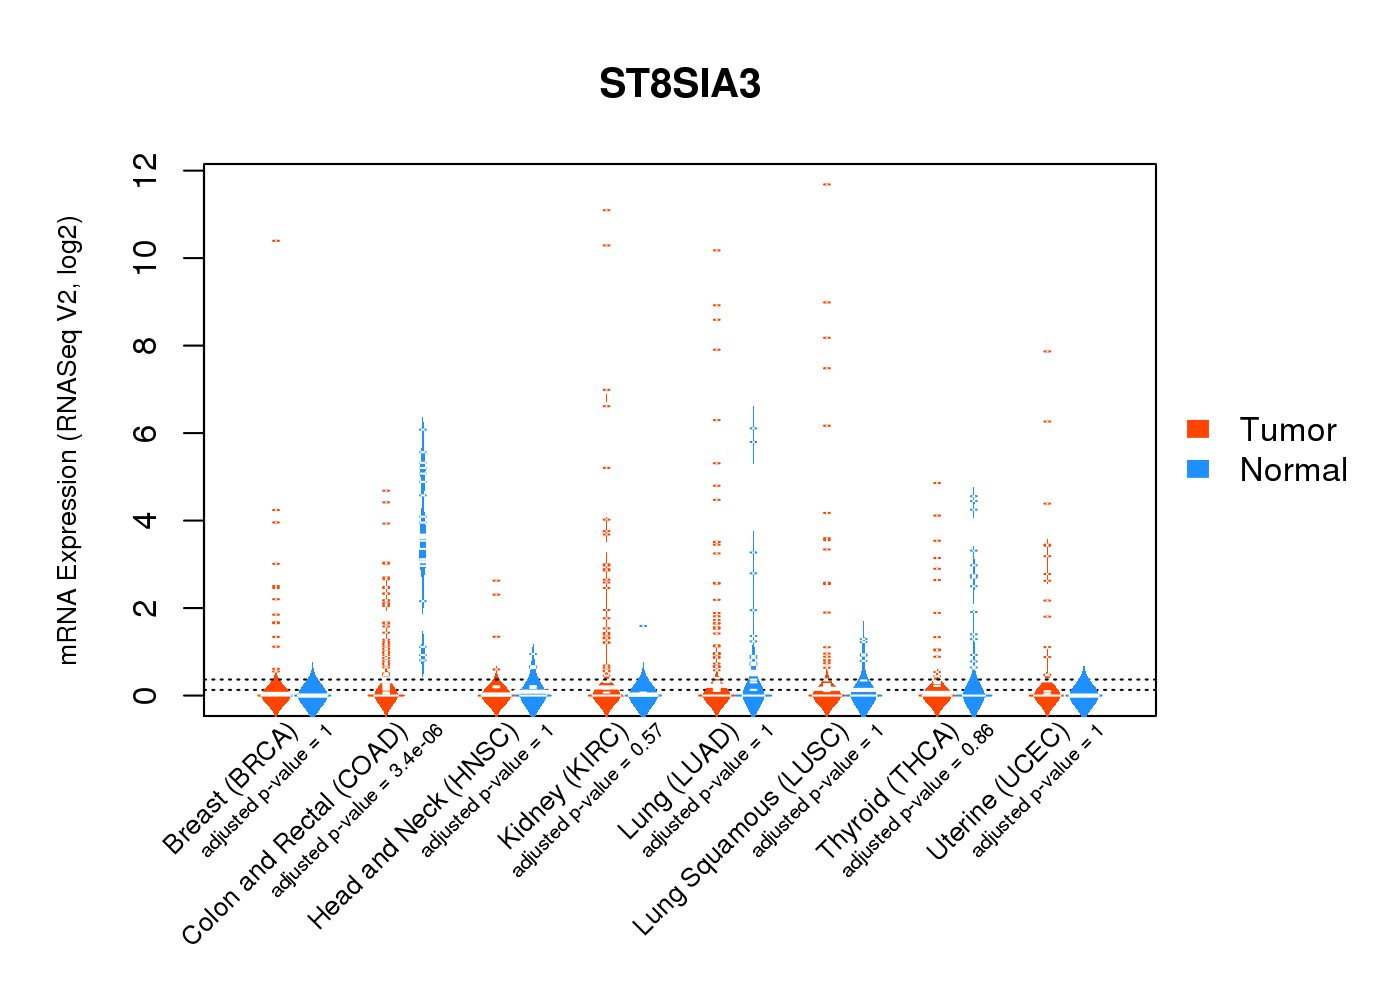 |
| Top |
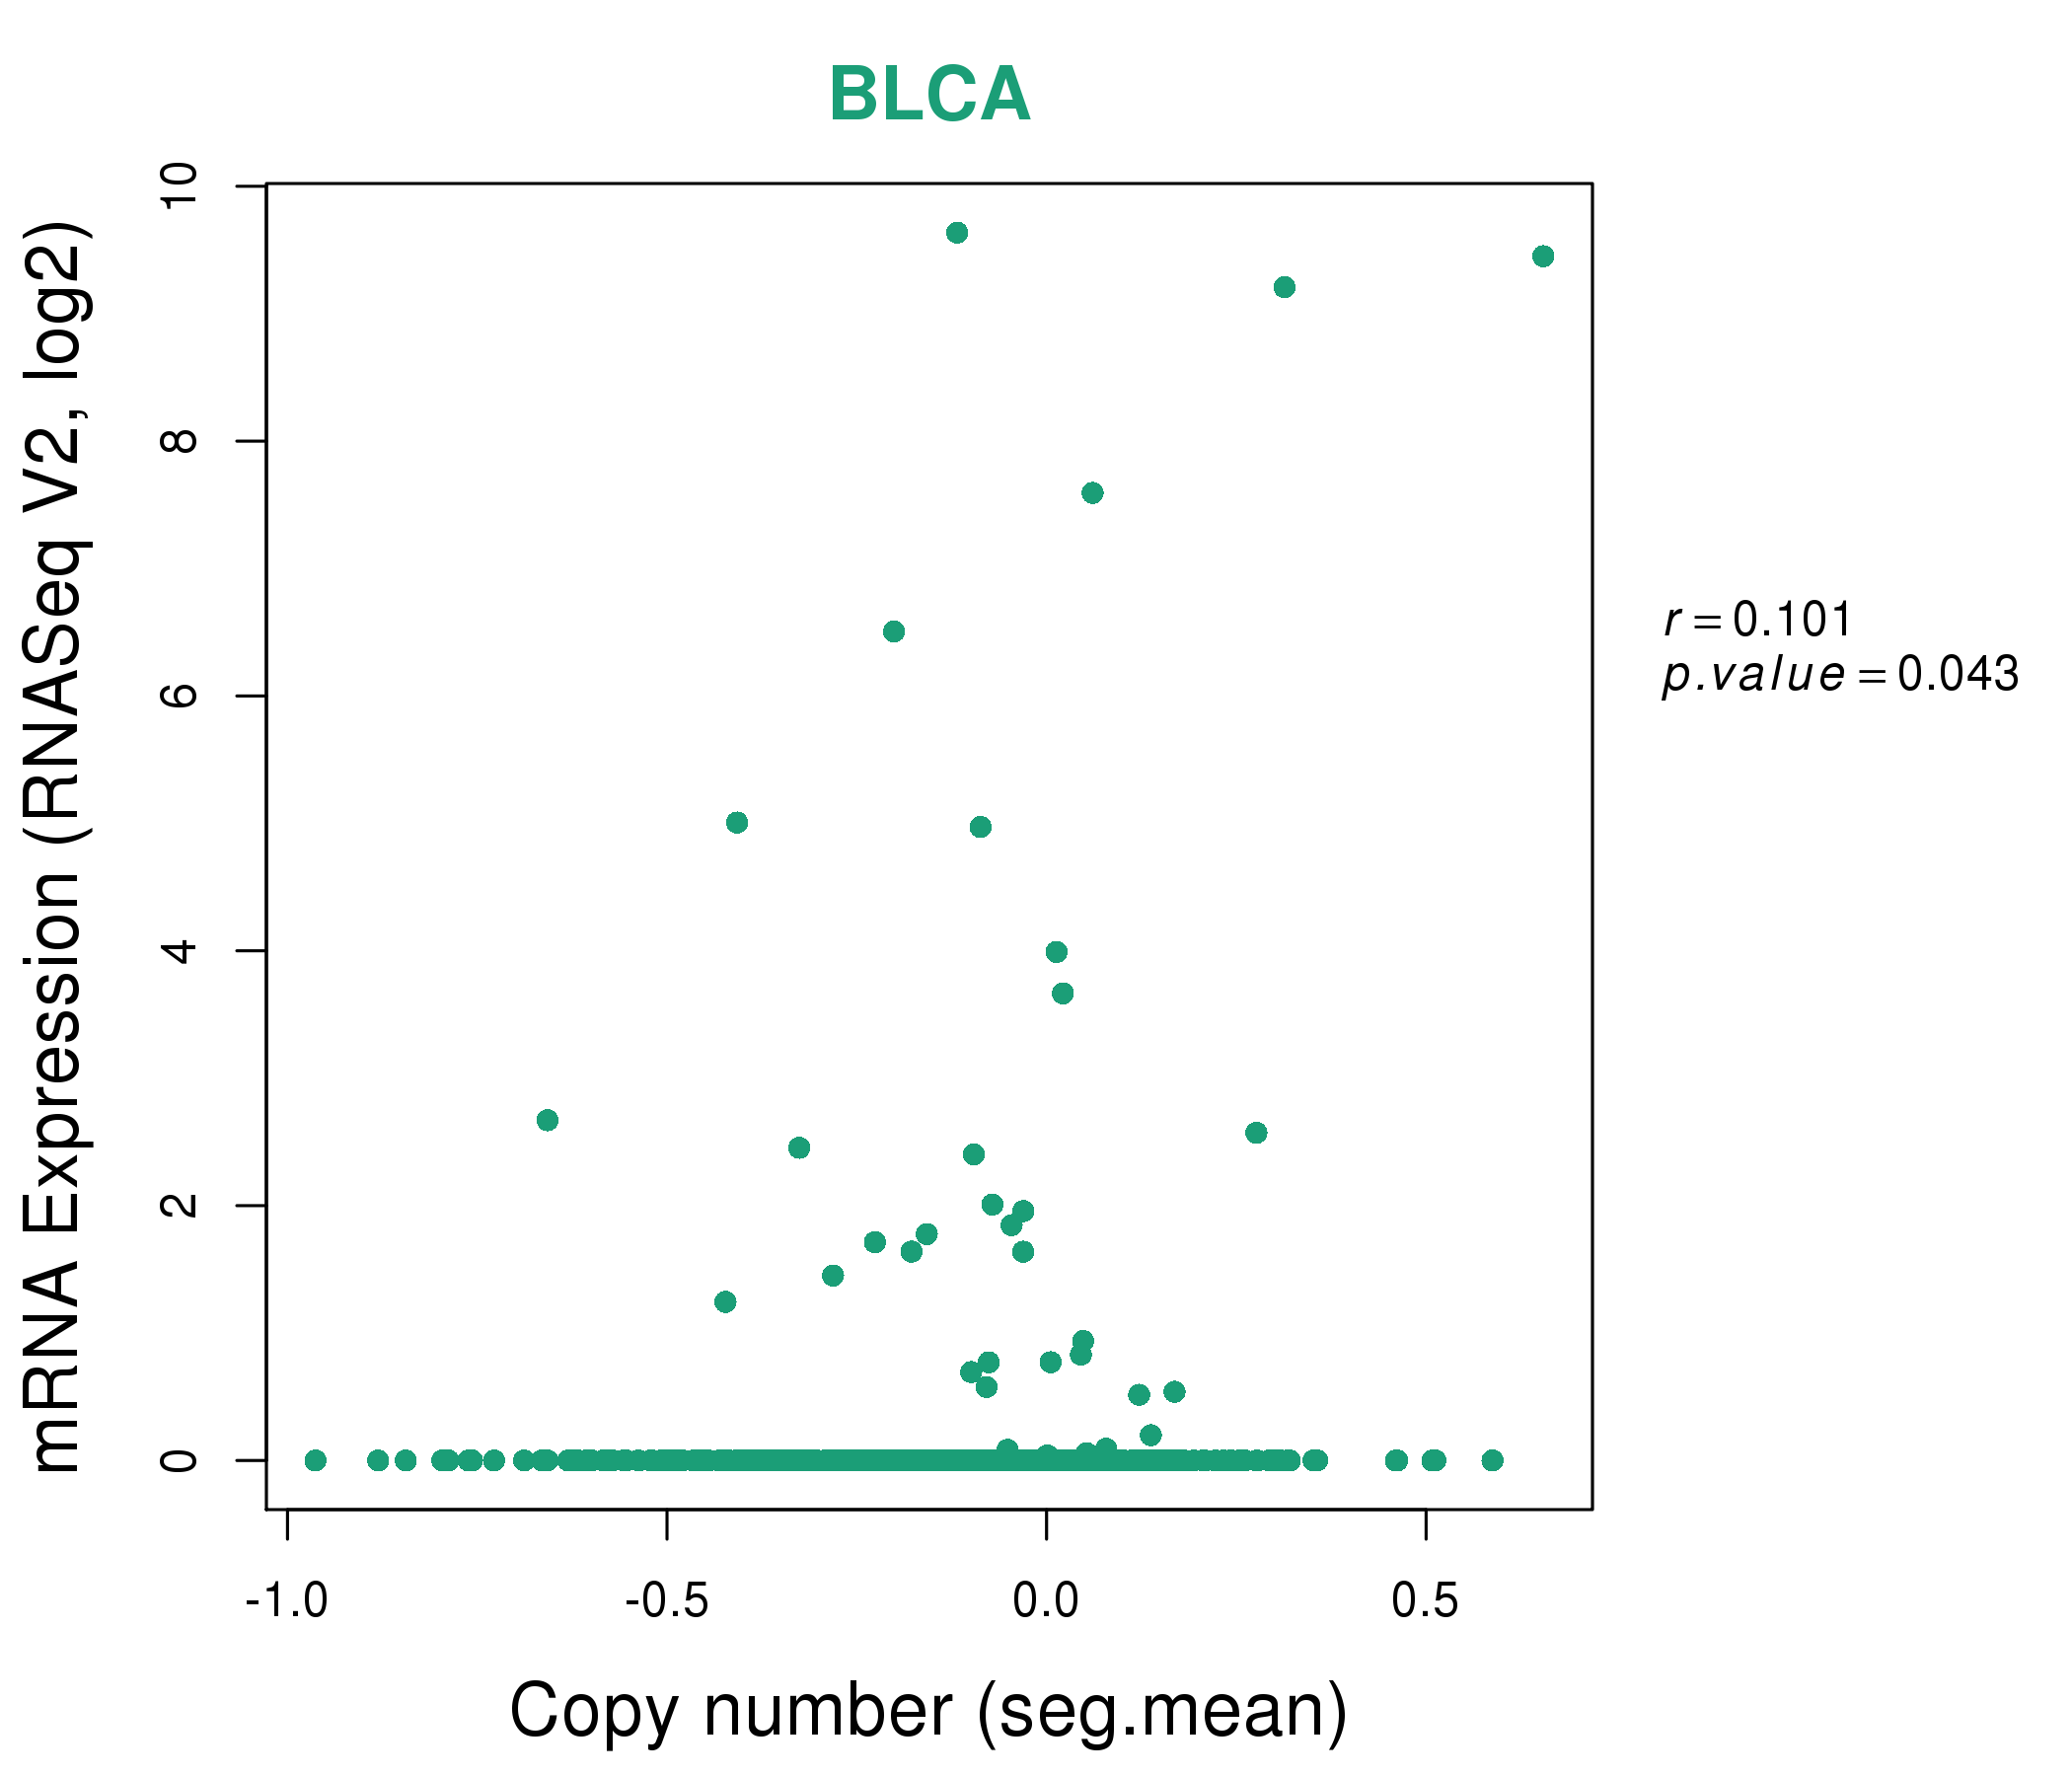
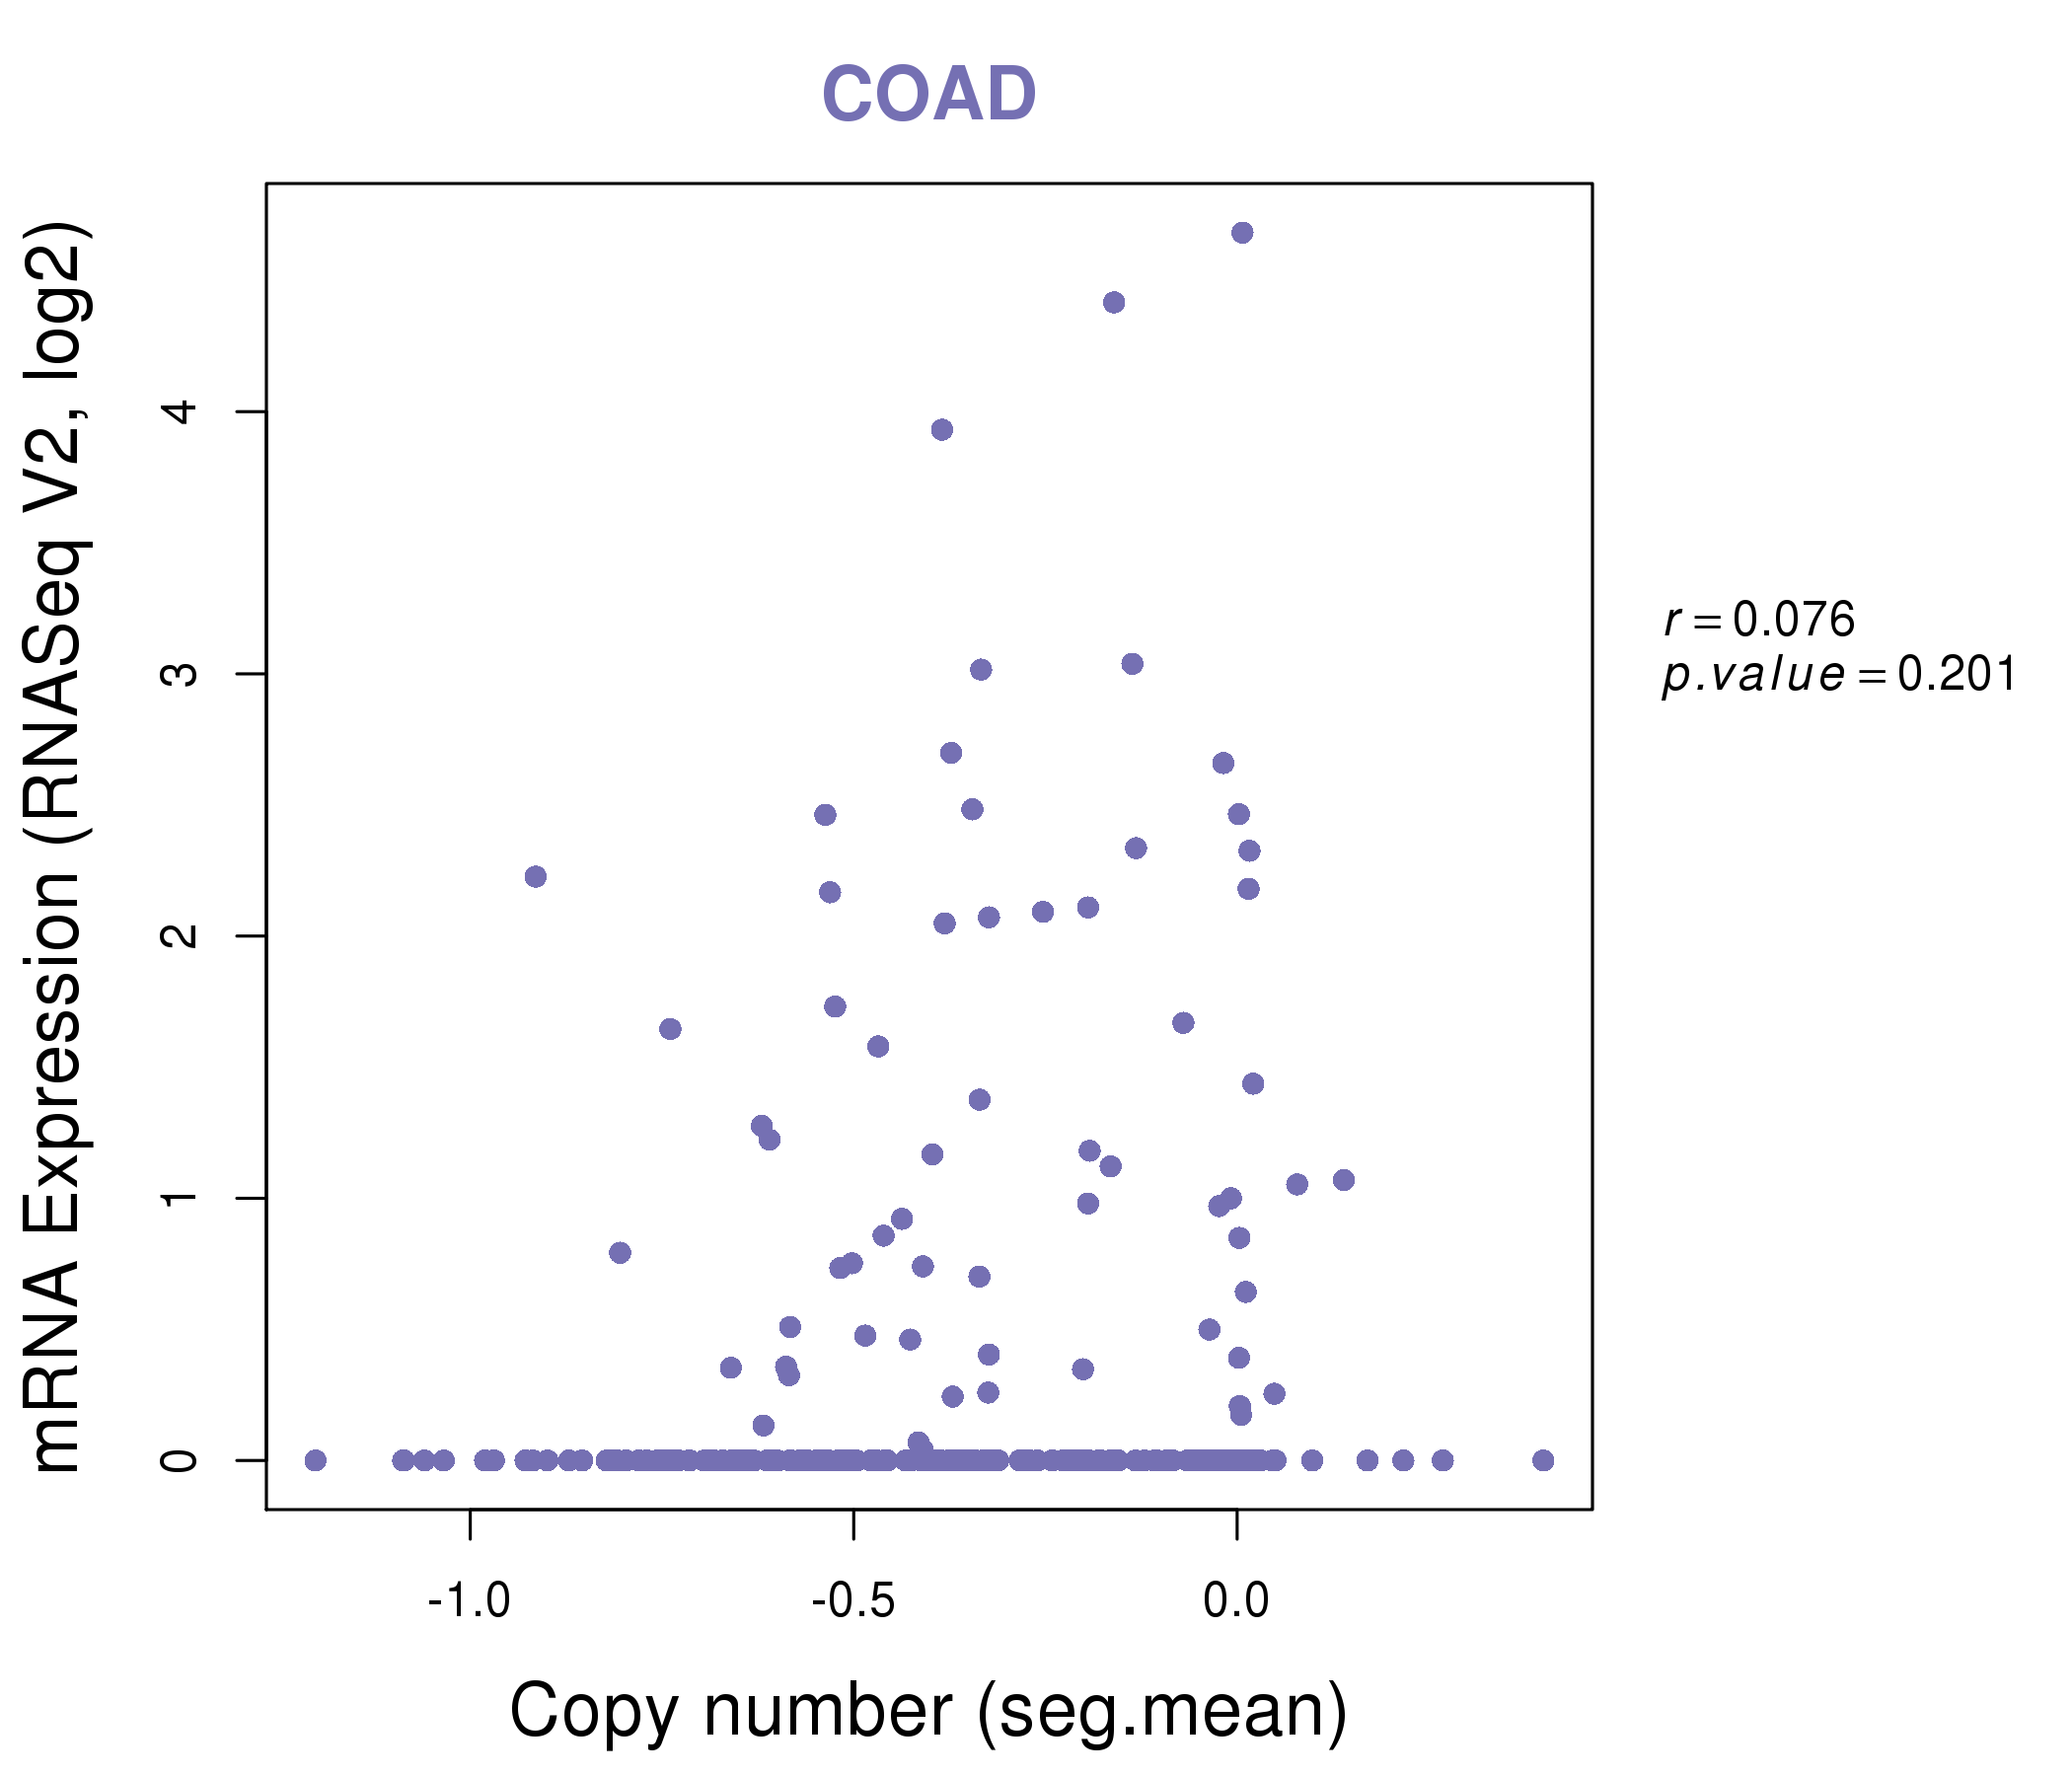
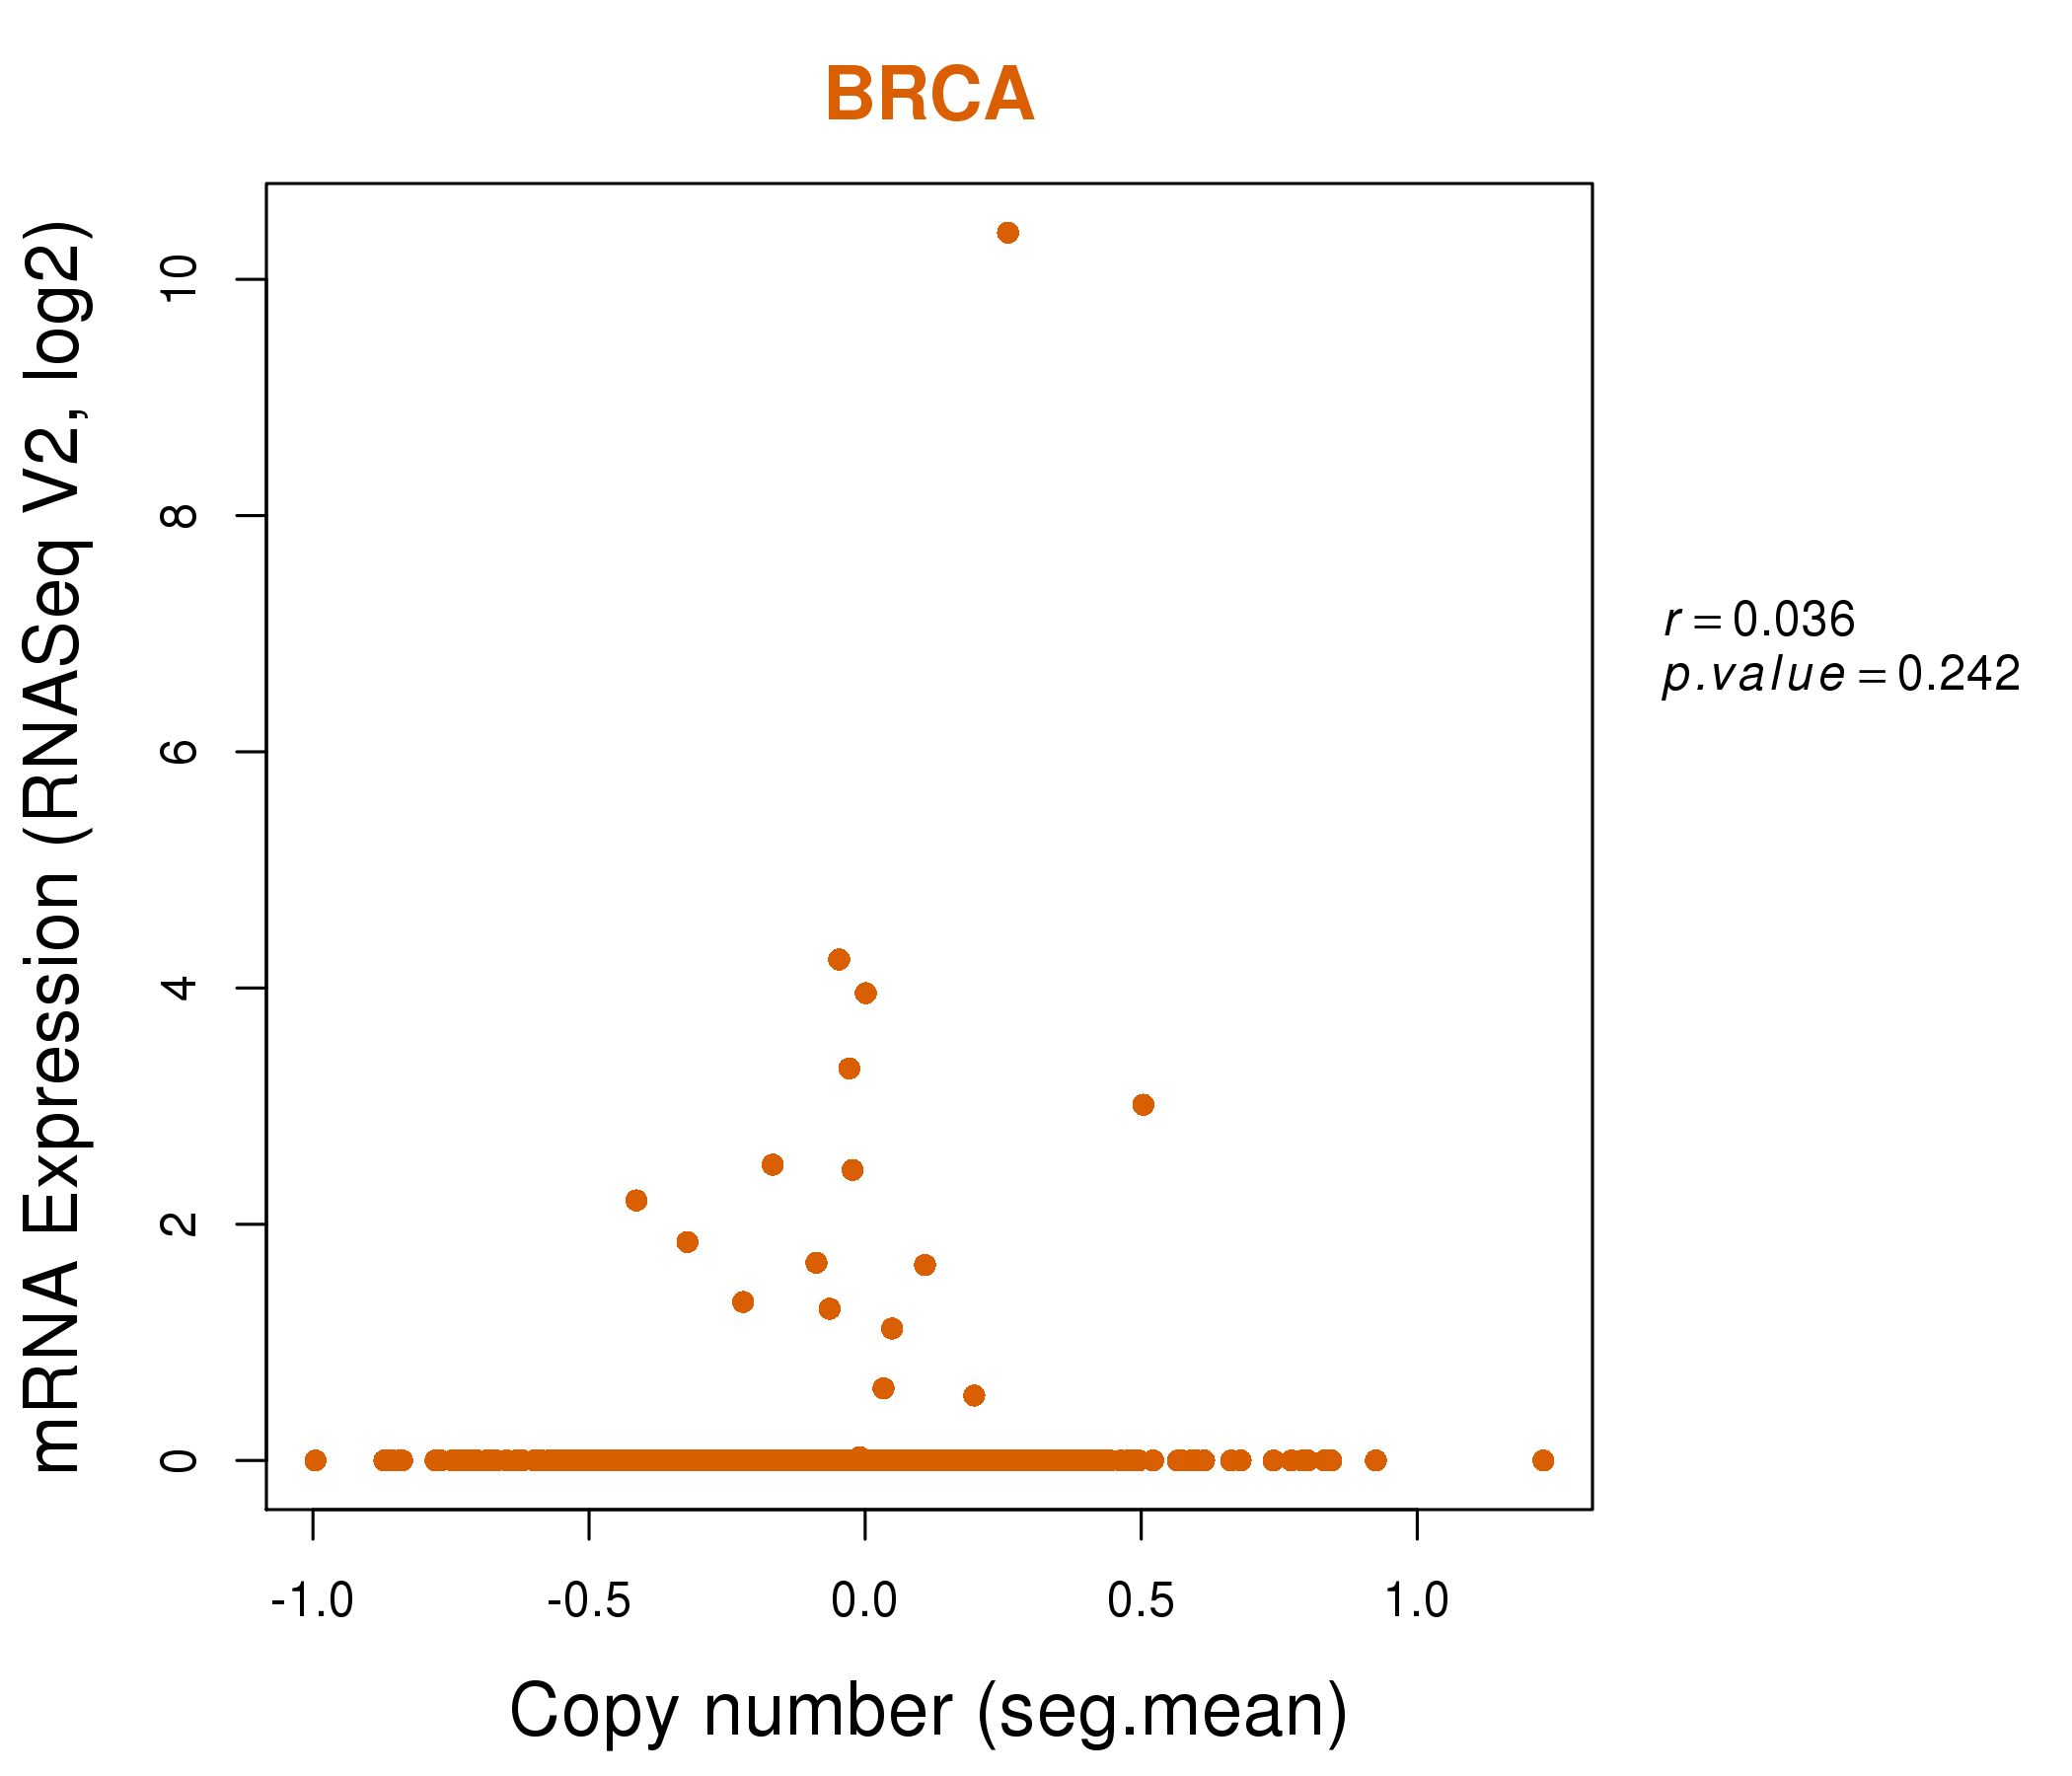
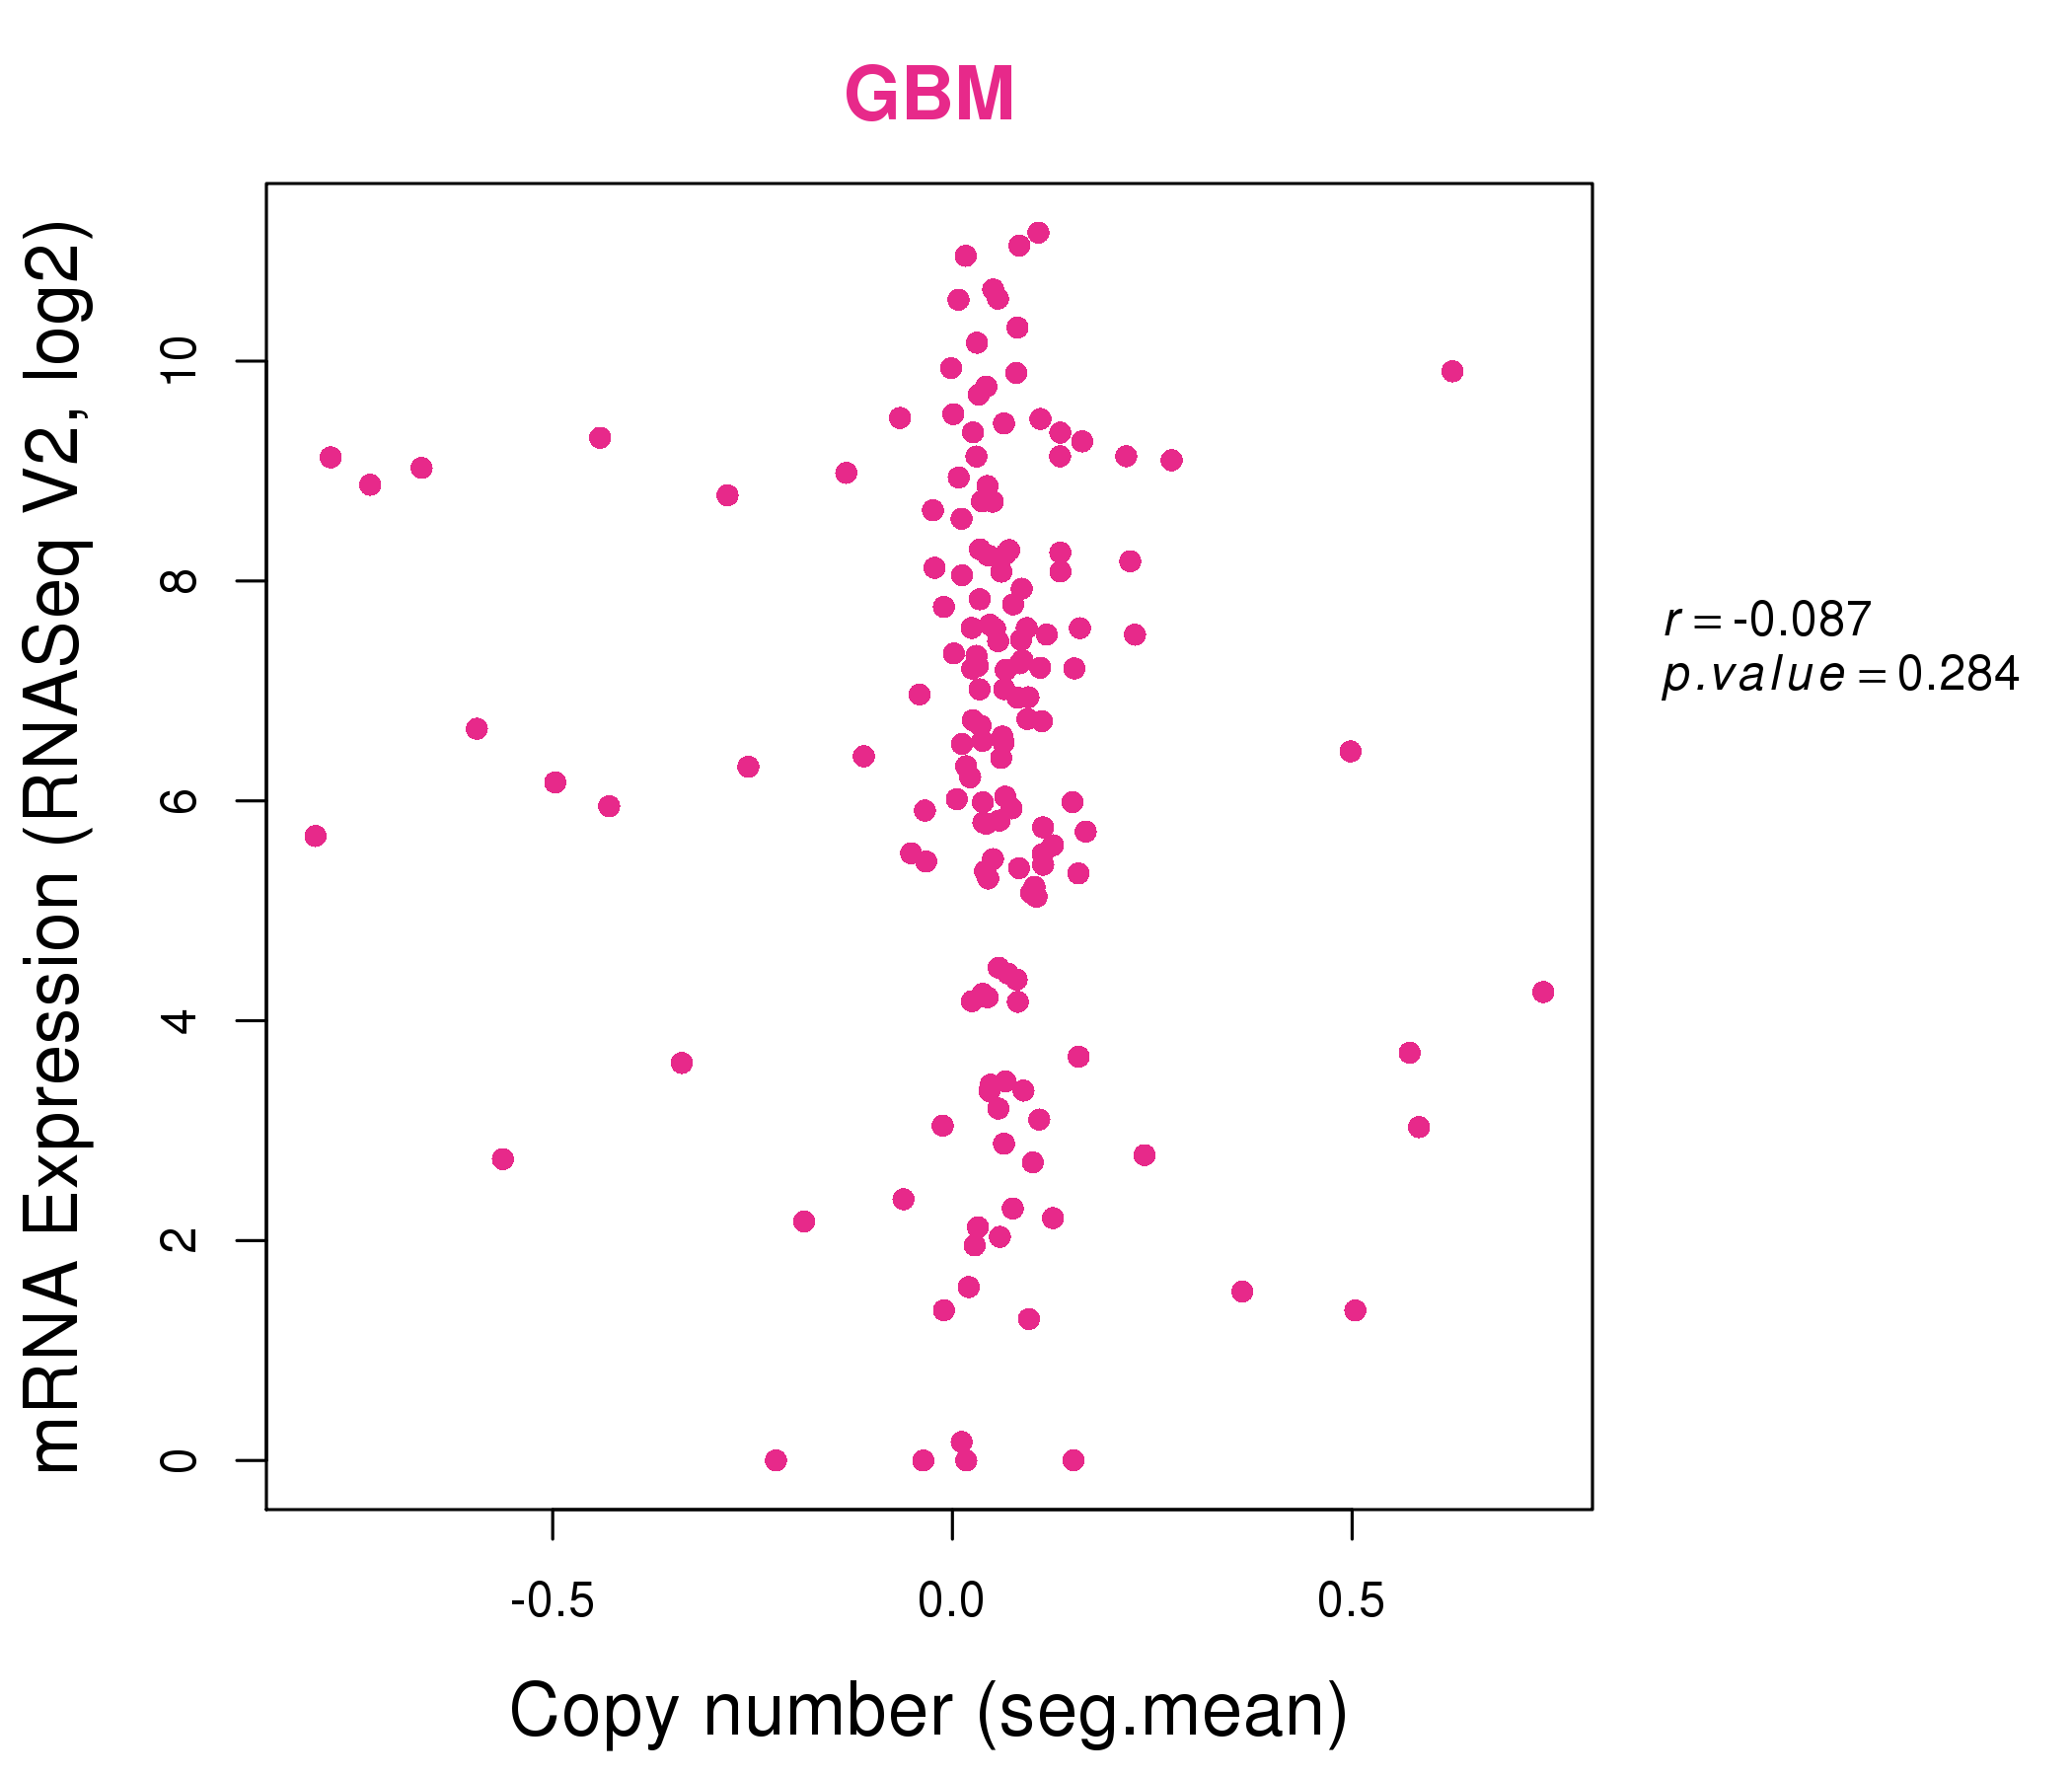
| * This plots show the correlation between CNV and gene expression. |
: Open all plots for all cancer types
 |
|
 |
|
| Top |
| Gene-Gene Network Information |
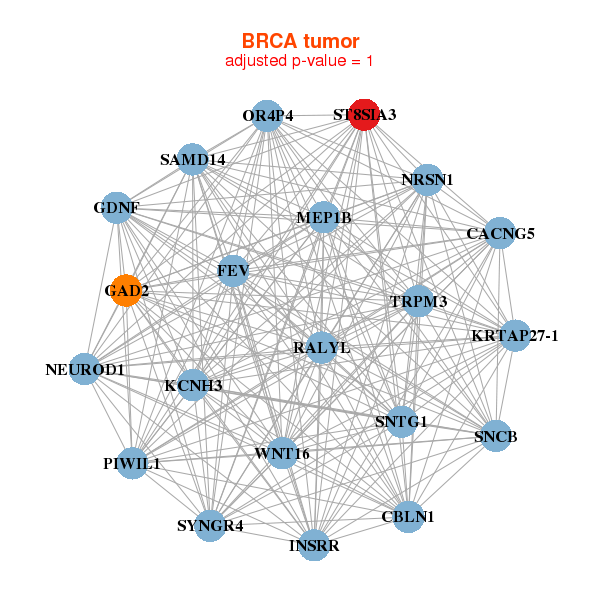
| * Co-Expression network figures were drawn using R package igraph. Only the top 20 genes with the highest correlations were shown. Red circle: input gene, orange circle: cell metabolism gene, sky circle: other gene |
: Open all plots for all cancer types
 |
|
| CACNG5,CBLN1,FEV,GAD2,GDNF,INSRR,KCNH3, KRTAP27-1,MEP1B,NEUROD1,NRSN1,OR4P4,PIWIL1,RALYL, SAMD14,SNCB,SNTG1,ST8SIA3,SYNGR4,TRPM3,WNT16 | ACSM2A,ACSM2B,AMN,APOC3,APOL4,TBATA,CHGA, CHGB,CPO,DBH,NDRG4,NTSR2,ORM1,ORM2, PDZD7,PHOX2B,SLC18A1,SNORA14A,ST8SIA3,TH,TTC36 |
 |
|
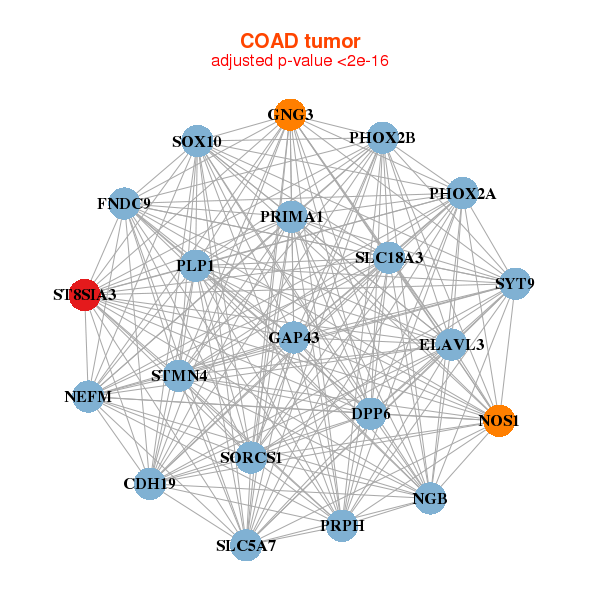
| FNDC9,CDH19,DPP6,ELAVL3,GAP43,GNG3,NEFM, NGB,NOS1,PHOX2A,PHOX2B,PLP1,PRIMA1,PRPH, SLC18A3,SLC5A7,SORCS1,SOX10,ST8SIA3,STMN4,SYT9 | ASTN1,ATCAY,ATP1A3,CELF4,CNTN2,CTNNA2,DNER, DPYSL5,INA,KIF1A,KIF5A,L1CAM,MYT1L,NEFL, NEFM,PHOX2B,RET,SLC7A14,ST8SIA3,SYT1,TMEM130 |


| * Co-Expression network figures were drawn using R package igraph. Only the top 20 genes with the highest correlations were shown. Red circle: input gene, orange circle: cell metabolism gene, sky circle: other gene |
: Open all plots for all cancer types
| Top |
: Open all interacting genes' information including KEGG pathway for all interacting genes from DAVID
| Top |
| Pharmacological Information for ST8SIA3 |
| There's no related Drug. |
| Top |
| Cross referenced IDs for ST8SIA3 |
| * We obtained these cross-references from Uniprot database. It covers 150 different DBs, 18 categories. http://www.uniprot.org/help/cross_references_section |
: Open all cross reference information
|
Copyright © 2016-Present - The Univsersity of Texas Health Science Center at Houston @ |