|
||||||||||||||||||||
| |
| Phenotypic Information (metabolism pathway, cancer, disease, phenome) |
| |
| |
| Gene-Gene Network Information: Co-Expression Network, Interacting Genes & KEGG |
| |
|


| Gene Summary for TXNDC12 |
| Basic gene info. | Gene symbol | TXNDC12 |
| Gene name | thioredoxin domain containing 12 (endoplasmic reticulum) | |
| Synonyms | AG1|AGR1|ERP16|ERP18|ERP19|PDIA16|TLP19|hAG-1|hTLP19 | |
| Cytomap | UCSC genome browser: 1p32.3 | |
| Genomic location | chr1 :52497768-52521843 | |
| Type of gene | protein-coding | |
| RefGenes | NM_015913.3, NR_046405.1,NR_046406.1, | |
| Ensembl id | ENSG00000117862 | |
| Description | ER protein 18ER protein 19anterior gradient homolog 1endoplasmic reticulum protein ERp19endoplasmic reticulum resident protein 18endoplasmic reticulum resident protein 19endoplasmic reticulum thioredoxin superfamily member, 18 kDaprotein disulfide | |
| Modification date | 20141207 | |
| dbXrefs | MIM : 609448 | |
| HGNC : HGNC | ||
| Ensembl : ENSG00000117862 | ||
| HPRD : 11633 | ||
| Vega : OTTHUMG00000008629 | ||
| Protein | UniProt: go to UniProt's Cross Reference DB Table | |
| Expression | CleanEX: HS_TXNDC12 | |
| BioGPS: 51060 | ||
| Gene Expression Atlas: ENSG00000117862 | ||
| The Human Protein Atlas: ENSG00000117862 | ||
| Pathway | NCI Pathway Interaction Database: TXNDC12 | |
| KEGG: TXNDC12 | ||
| REACTOME: TXNDC12 | ||
| ConsensusPathDB | ||
| Pathway Commons: TXNDC12 | ||
| Metabolism | MetaCyc: TXNDC12 | |
| HUMANCyc: TXNDC12 | ||
| Regulation | Ensembl's Regulation: ENSG00000117862 | |
| miRBase: chr1 :52,497,768-52,521,843 | ||
| TargetScan: NM_015913 | ||
| cisRED: ENSG00000117862 | ||
| Context | iHOP: TXNDC12 | |
| cancer metabolism search in PubMed: TXNDC12 | ||
| UCL Cancer Institute: TXNDC12 | ||
| Assigned class in ccmGDB | C | |
| Top |
| Phenotypic Information for TXNDC12(metabolism pathway, cancer, disease, phenome) |
| Cancer | CGAP: TXNDC12 |
| Familial Cancer Database: TXNDC12 | |
| * This gene is included in those cancer gene databases. |
|
|
|
|
|
| . | ||||||||||||||
Oncogene 1 | Significant driver gene in | |||||||||||||||||||
| cf) number; DB name 1 Oncogene; http://nar.oxfordjournals.org/content/35/suppl_1/D721.long, 2 Tumor Suppressor gene; https://bioinfo.uth.edu/TSGene/, 3 Cancer Gene Census; http://www.nature.com/nrc/journal/v4/n3/abs/nrc1299.html, 4 CancerGenes; http://nar.oxfordjournals.org/content/35/suppl_1/D721.long, 5 Network of Cancer Gene; http://ncg.kcl.ac.uk/index.php, 1Therapeutic Vulnerabilities in Cancer; http://cbio.mskcc.org/cancergenomics/statius/ |
| KEGG_GLUTATHIONE_METABOLISM | |
| Mutations for TXNDC12 |
| * Under tables are showing count per each tissue to give us broad intuition about tissue specific mutation patterns.You can go to the detailed page for each mutation database's web site. |
| There's no structural variation information in COSMIC data for this gene. |
| * From mRNA Sanger sequences, Chitars2.0 arranged chimeric transcripts. This table shows TXNDC12 related fusion information. |
| ID | Head Gene | Tail Gene | Accession | Gene_a | qStart_a | qEnd_a | Chromosome_a | tStart_a | tEnd_a | Gene_a | qStart_a | qEnd_a | Chromosome_a | tStart_a | tEnd_a |
| BC071762 | LOC100188947 | 1 | 1822 | 10 | 93170054 | 93256129 | TXNDC12 | 1823 | 2681 | 1 | 52485826 | 52486684 | |
| BF910530 | TXNDC12 | 192 | 214 | 1 | 52499965 | 52499989 | FAM107B | 205 | 387 | 10 | 14615836 | 14616182 | |
| Top |
| There's no copy number variation information in COSMIC data for this gene. |
| Top |
|
 |
| Top |
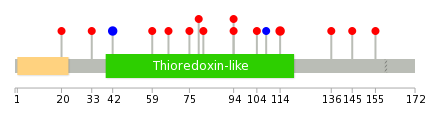
| Stat. for Non-Synonymous SNVs (# total SNVs=15) | (# total SNVs=3) |
 |  |
(# total SNVs=0) | (# total SNVs=0) |
| Top |
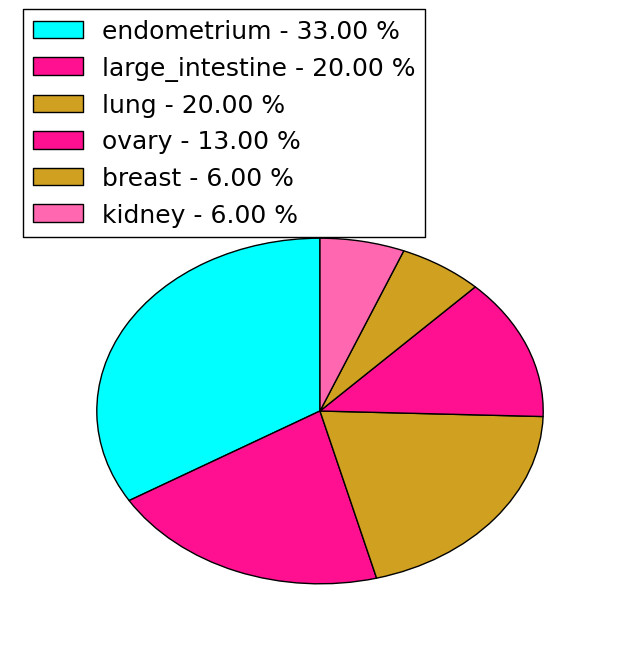
| * When you move the cursor on each content, you can see more deailed mutation information on the Tooltip. Those are primary_site,primary_histology,mutation(aa),pubmedID. |
| GRCh37 position | Mutation(aa) | Unique sampleID count |
| chr1:52486661-52486661 | p.Q155* | 2 |
| chr1:52490196-52490196 | p.R114Q | 2 |
| chr1:52507241-52507241 | p.T42T | 2 |
| chr1:52492952-52492952 | p.L94I | 2 |
| chr1:52492989-52492989 | p.E81D | 1 |
| chr1:52492991-52492991 | p.E81* | 1 |
| chr1:52492996-52492996 | p.S79F | 1 |
| chr1:52486660-52486660 | p.Q155L | 1 |
| chr1:52493007-52493007 | p.K75N | 1 |
| chr1:52494264-52494264 | p.C66Y | 1 |
| Top |
|
 |
| Point Mutation/ Tissue ID | 1 | 2 | 3 | 4 | 5 | 6 | 7 | 8 | 9 | 10 | 11 | 12 | 13 | 14 | 15 | 16 | 17 | 18 | 19 | 20 |
| # sample | 1 | 2 | 1 | 2 | 1 | 1 | 5 | |||||||||||||
| # mutation | 1 | 2 | 1 | 2 | 1 | 1 | 5 | |||||||||||||
| nonsynonymous SNV | 1 | 2 | 1 | 2 | 1 | 1 | 5 | |||||||||||||
| synonymous SNV |
| cf) Tissue ID; Tissue type (1; BLCA[Bladder Urothelial Carcinoma], 2; BRCA[Breast invasive carcinoma], 3; CESC[Cervical squamous cell carcinoma and endocervical adenocarcinoma], 4; COAD[Colon adenocarcinoma], 5; GBM[Glioblastoma multiforme], 6; Glioma Low Grade, 7; HNSC[Head and Neck squamous cell carcinoma], 8; KICH[Kidney Chromophobe], 9; KIRC[Kidney renal clear cell carcinoma], 10; KIRP[Kidney renal papillary cell carcinoma], 11; LAML[Acute Myeloid Leukemia], 12; LUAD[Lung adenocarcinoma], 13; LUSC[Lung squamous cell carcinoma], 14; OV[Ovarian serous cystadenocarcinoma ], 15; PAAD[Pancreatic adenocarcinoma], 16; PRAD[Prostate adenocarcinoma], 17; SKCM[Skin Cutaneous Melanoma], 18:STAD[Stomach adenocarcinoma], 19:THCA[Thyroid carcinoma], 20:UCEC[Uterine Corpus Endometrial Carcinoma]) |
| Top |
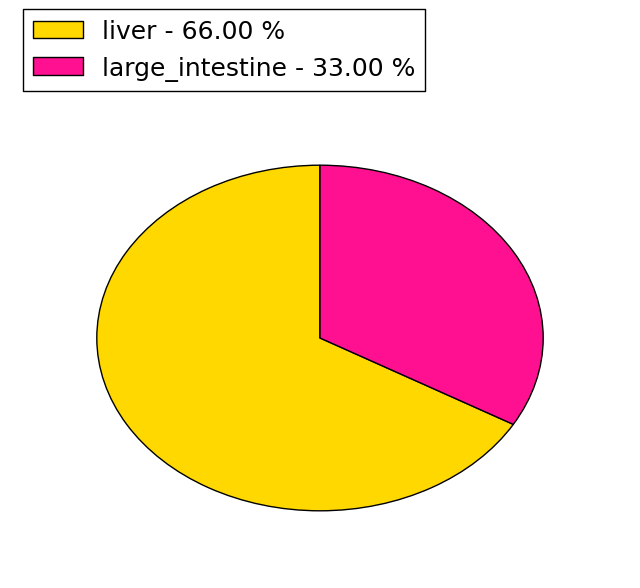
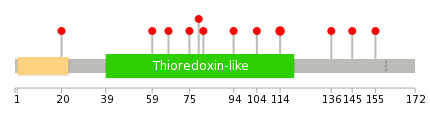
| * We represented just top 10 SNVs. When you move the cursor on each content, you can see more deailed mutation information on the Tooltip. Those are primary_site, primary_histology, mutation(aa), pubmedID. |
| Genomic Position | Mutation(aa) | Unique sampleID count |
| chr1:52490196 | p.R114Q | 2 |
| chr1:52493007 | p.V59L | 1 |
| chr1:52494264 | p.L20I | 1 |
| chr1:52494286 | p.Q155L | 1 |
| chr1:52486660 | p.E145K | 1 |
| chr1:52520711 | p.S136I | 1 |
| chr1:52489169 | p.D104Y | 1 |
| chr1:52489195 | p.L94I | 1 |
| chr1:52490227 | p.E81D | 1 |
| chr1:52492952 | p.S79F | 1 |
| * Copy number data were extracted from TCGA using R package TCGA-Assembler. The URLs of all public data files on TCGA DCC data server were gathered on Jan-05-2015. Function ProcessCNAData in TCGA-Assembler package was used to obtain gene-level copy number value which is calculated as the average copy number of the genomic region of a gene. |
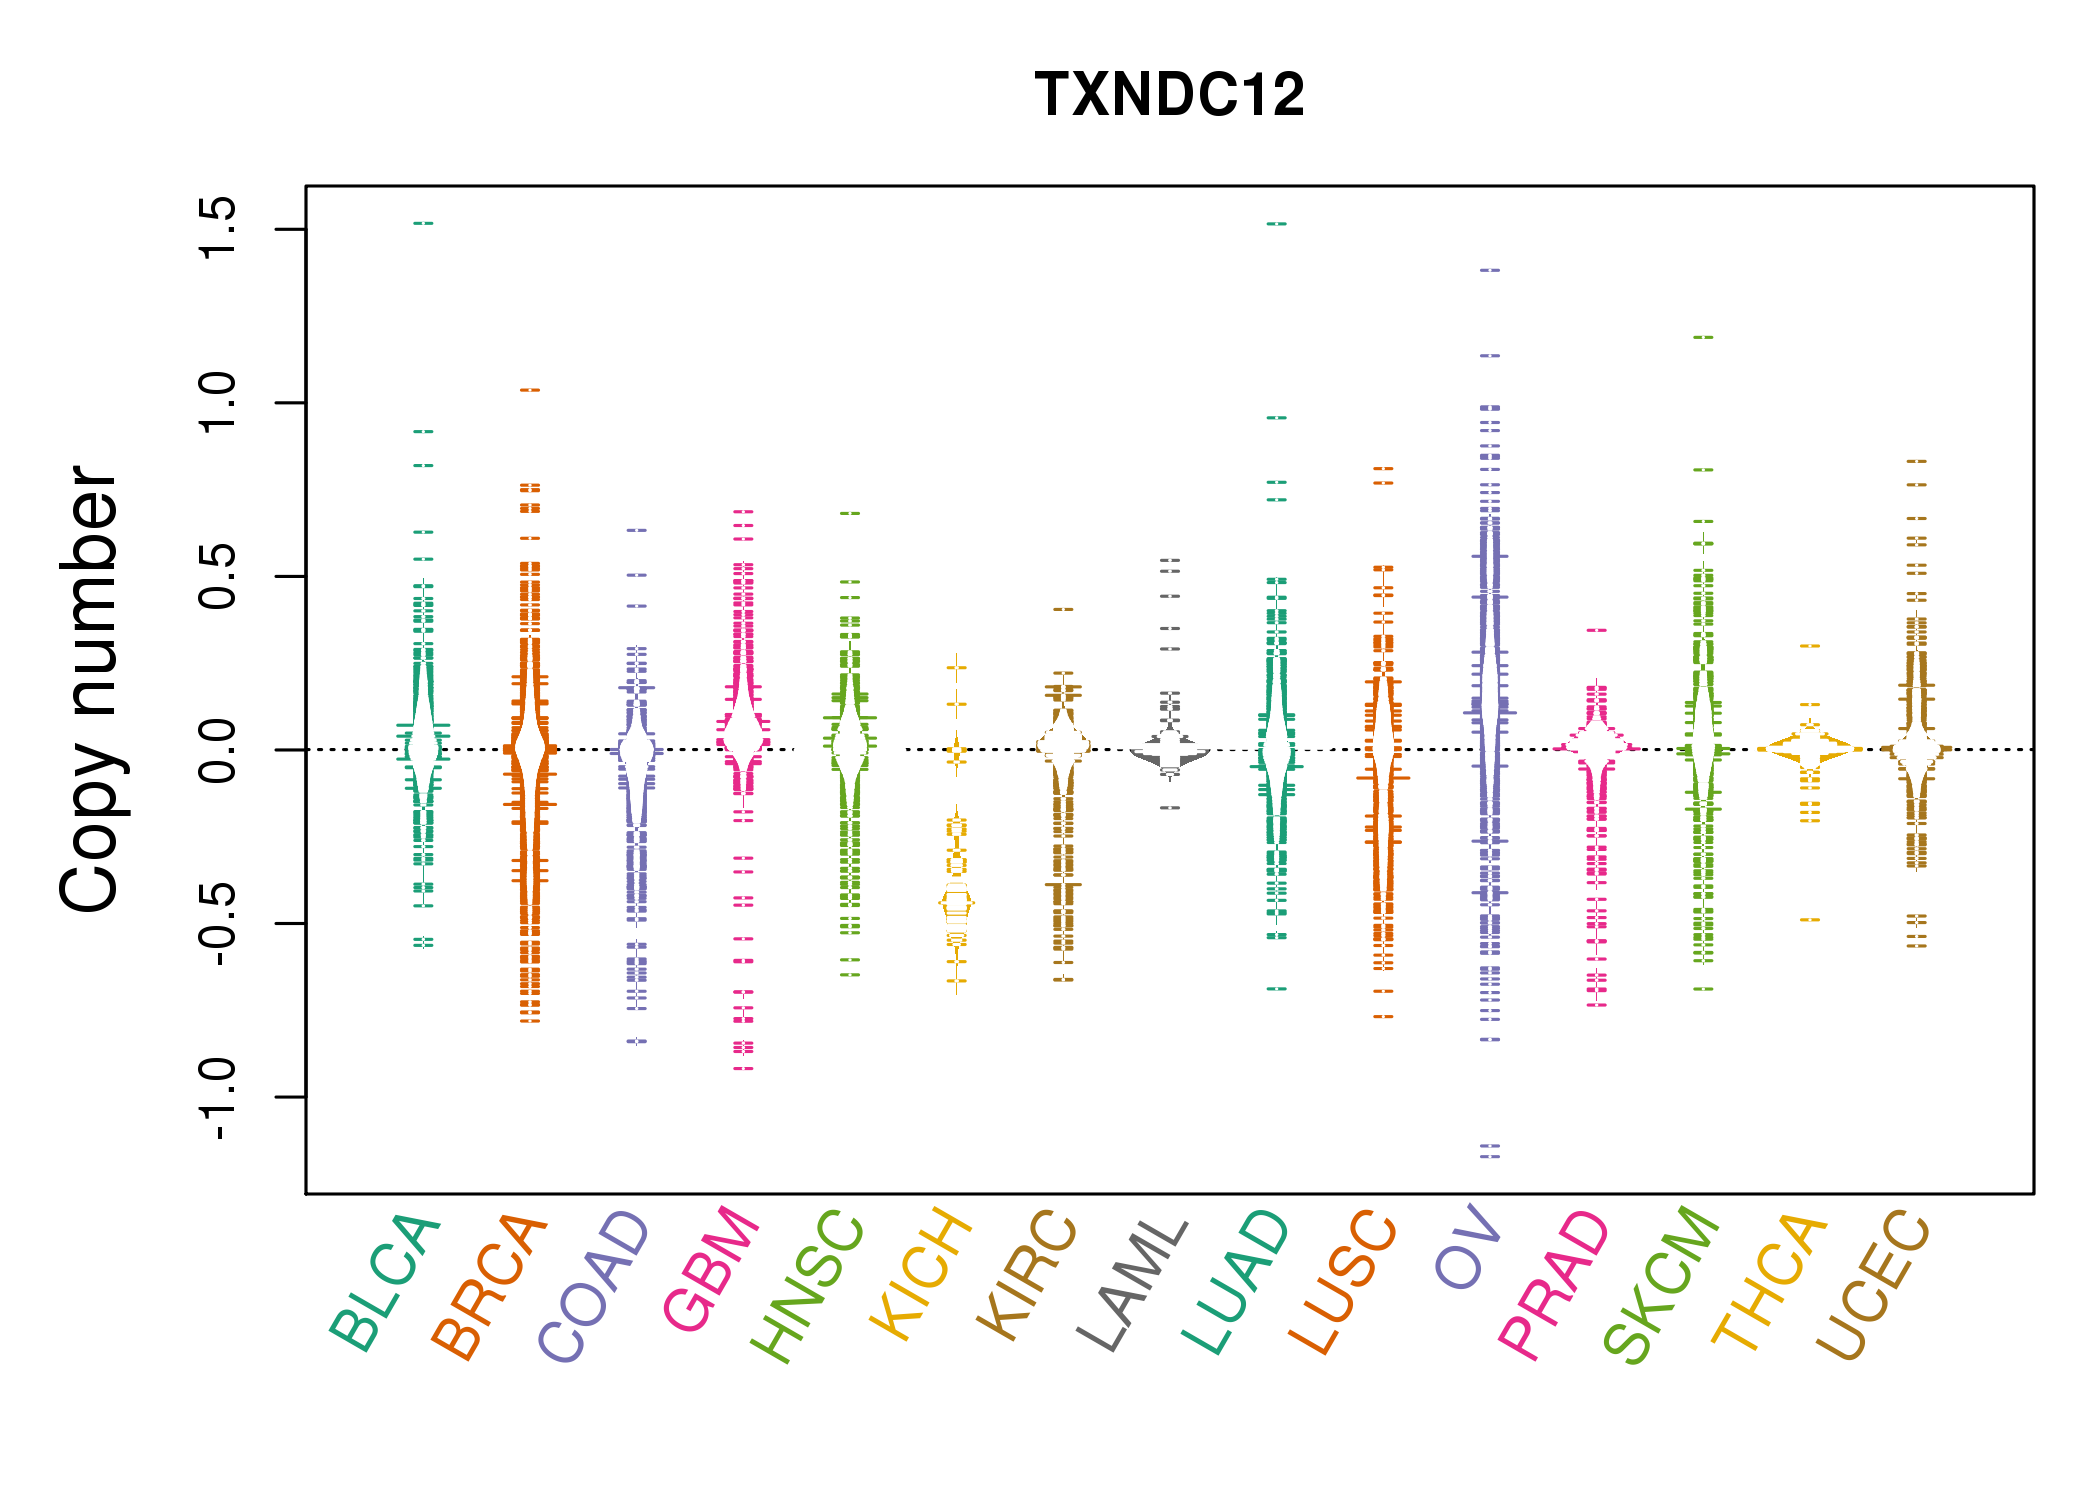 |
| cf) Tissue ID[Tissue type]: BLCA[Bladder Urothelial Carcinoma], BRCA[Breast invasive carcinoma], CESC[Cervical squamous cell carcinoma and endocervical adenocarcinoma], COAD[Colon adenocarcinoma], GBM[Glioblastoma multiforme], Glioma Low Grade, HNSC[Head and Neck squamous cell carcinoma], KICH[Kidney Chromophobe], KIRC[Kidney renal clear cell carcinoma], KIRP[Kidney renal papillary cell carcinoma], LAML[Acute Myeloid Leukemia], LUAD[Lung adenocarcinoma], LUSC[Lung squamous cell carcinoma], OV[Ovarian serous cystadenocarcinoma ], PAAD[Pancreatic adenocarcinoma], PRAD[Prostate adenocarcinoma], SKCM[Skin Cutaneous Melanoma], STAD[Stomach adenocarcinoma], THCA[Thyroid carcinoma], UCEC[Uterine Corpus Endometrial Carcinoma] |
| Top |
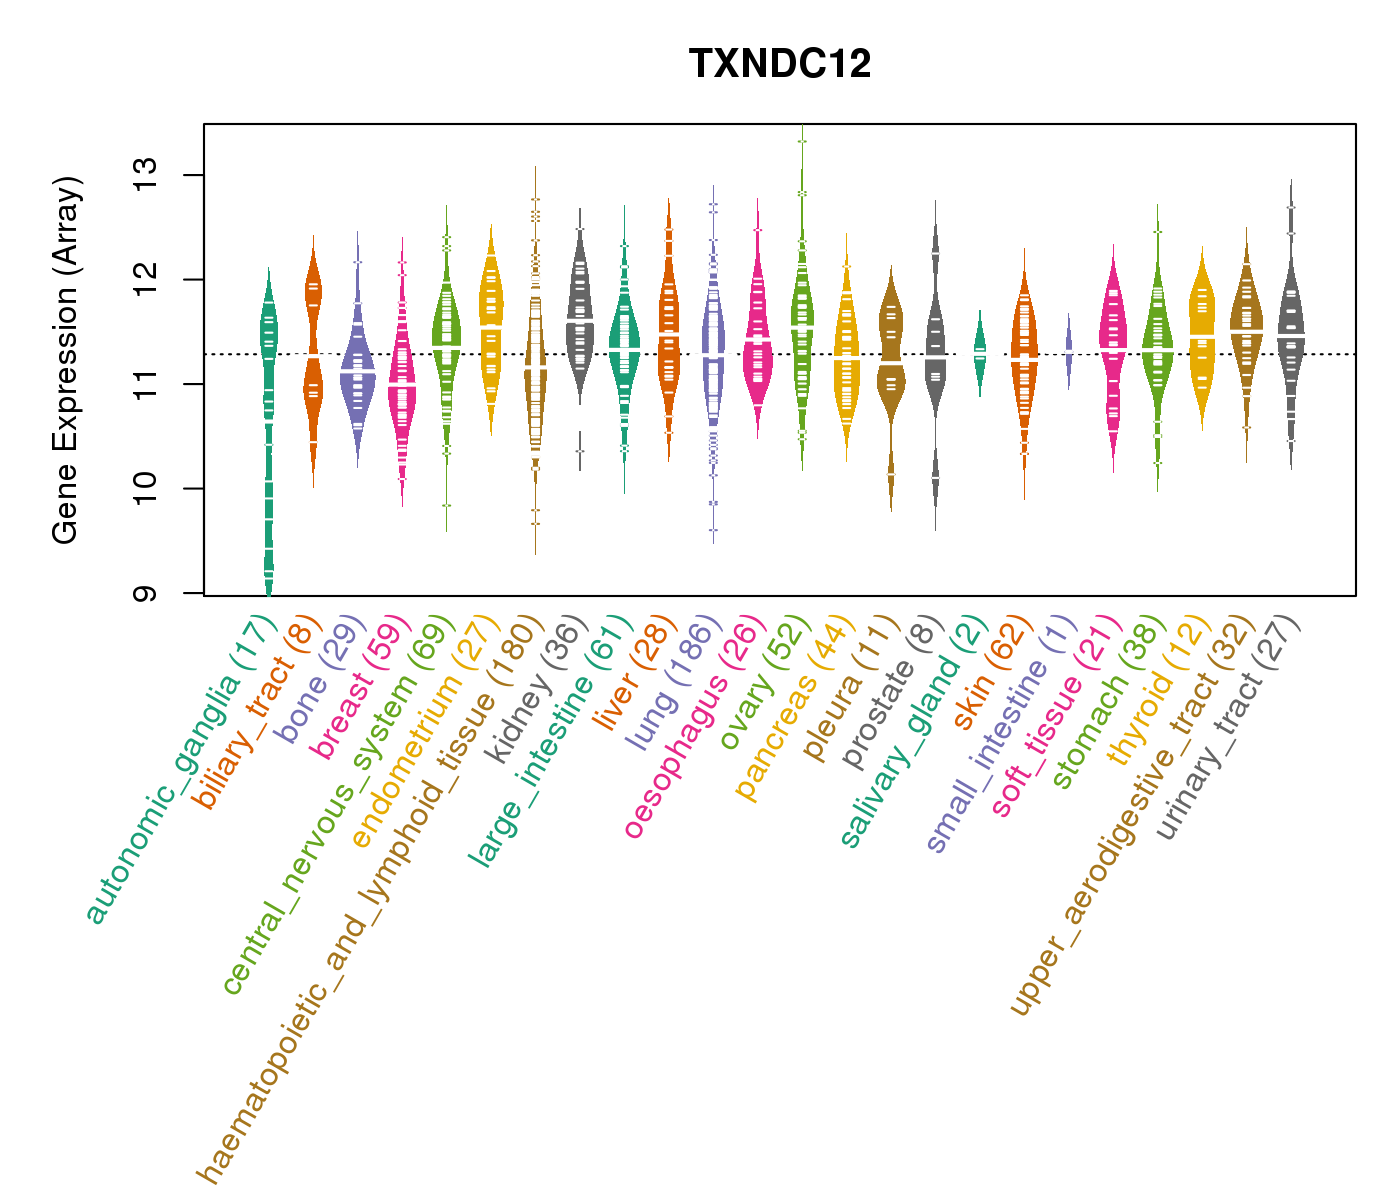
| Gene Expression for TXNDC12 |
| * CCLE gene expression data were extracted from CCLE_Expression_Entrez_2012-10-18.res: Gene-centric RMA-normalized mRNA expression data. |
 |
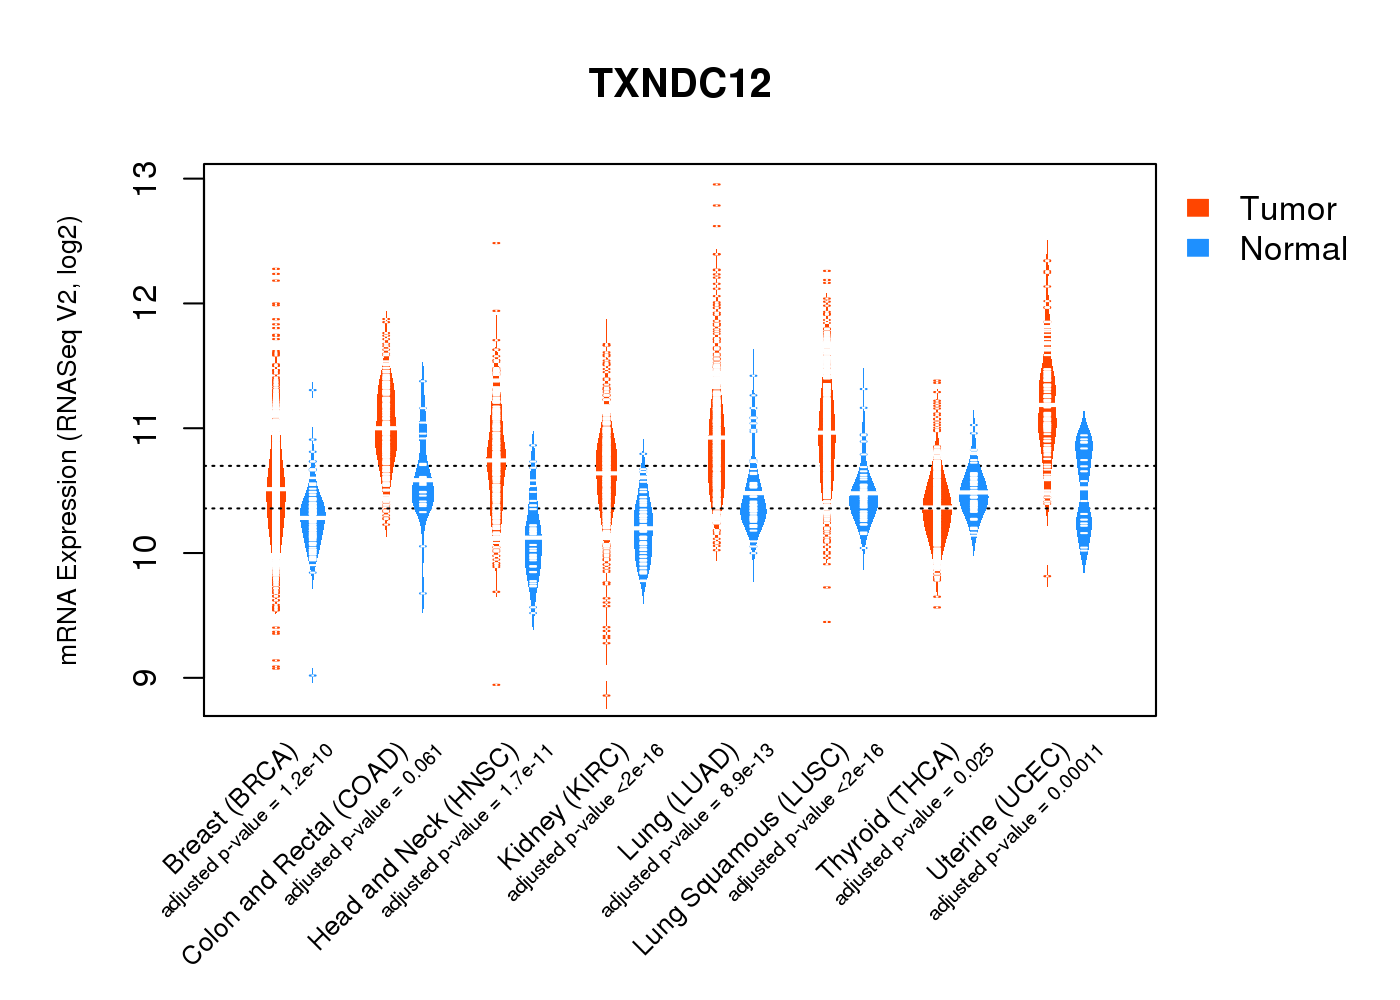
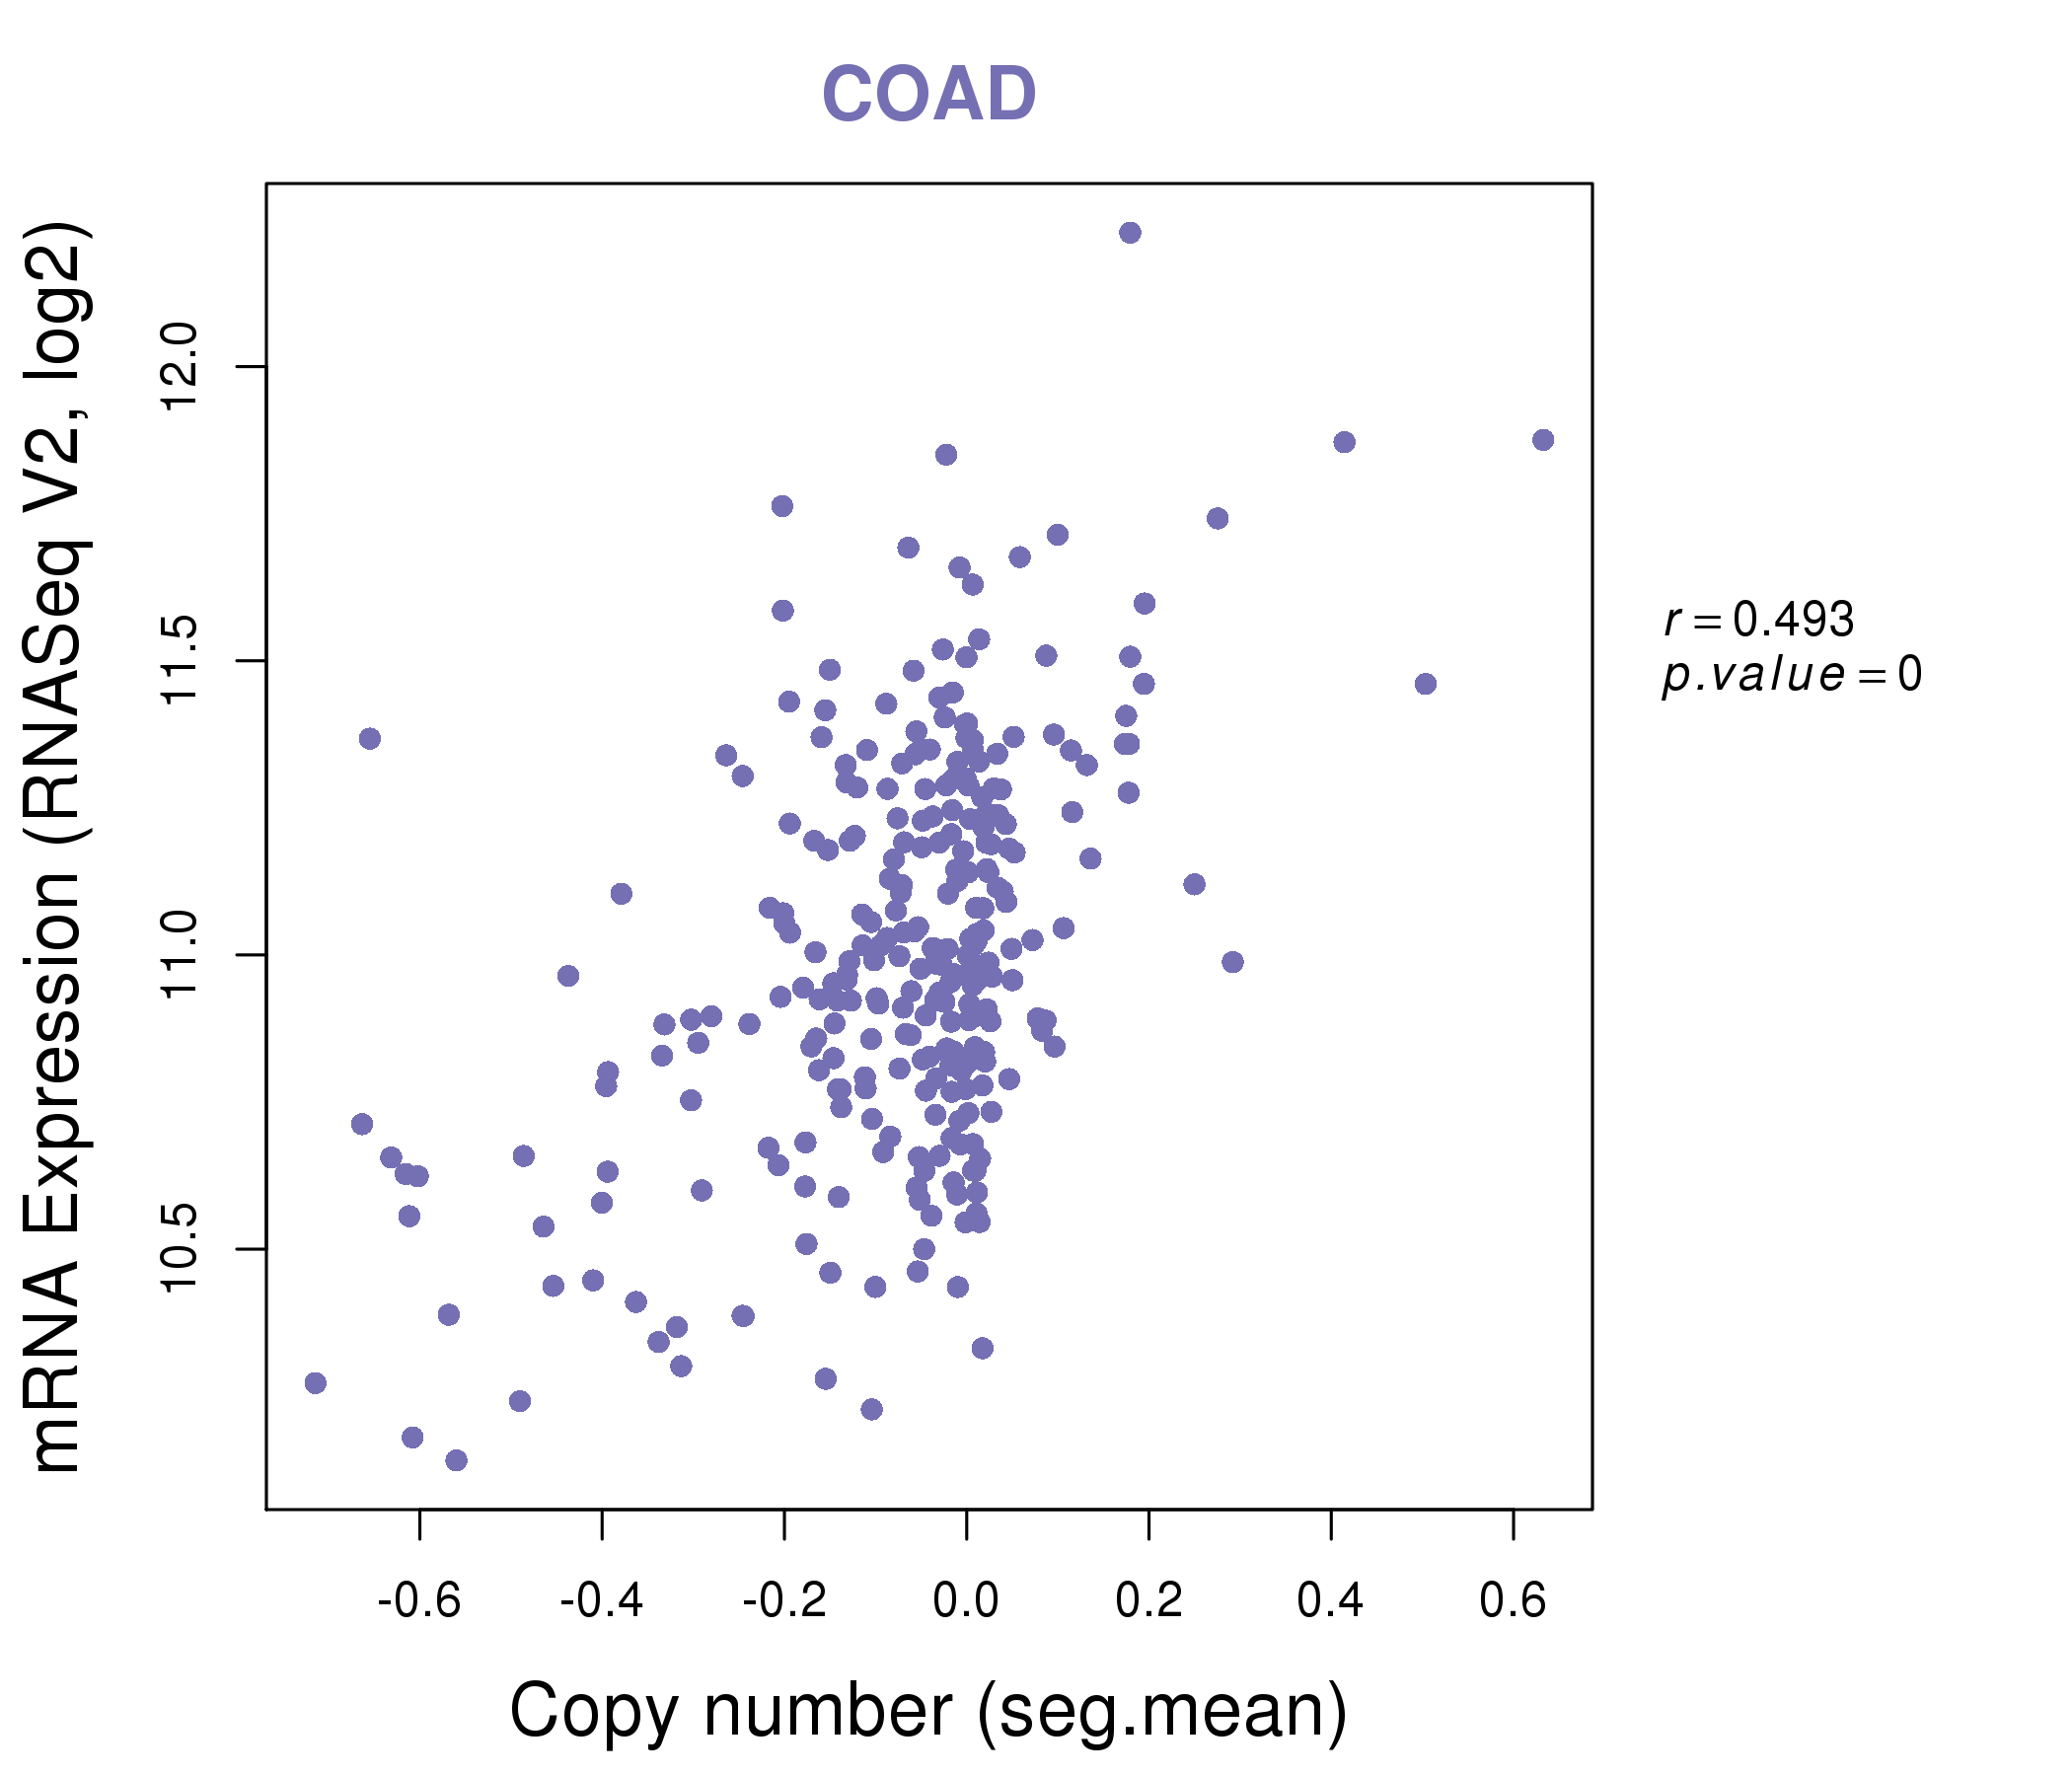
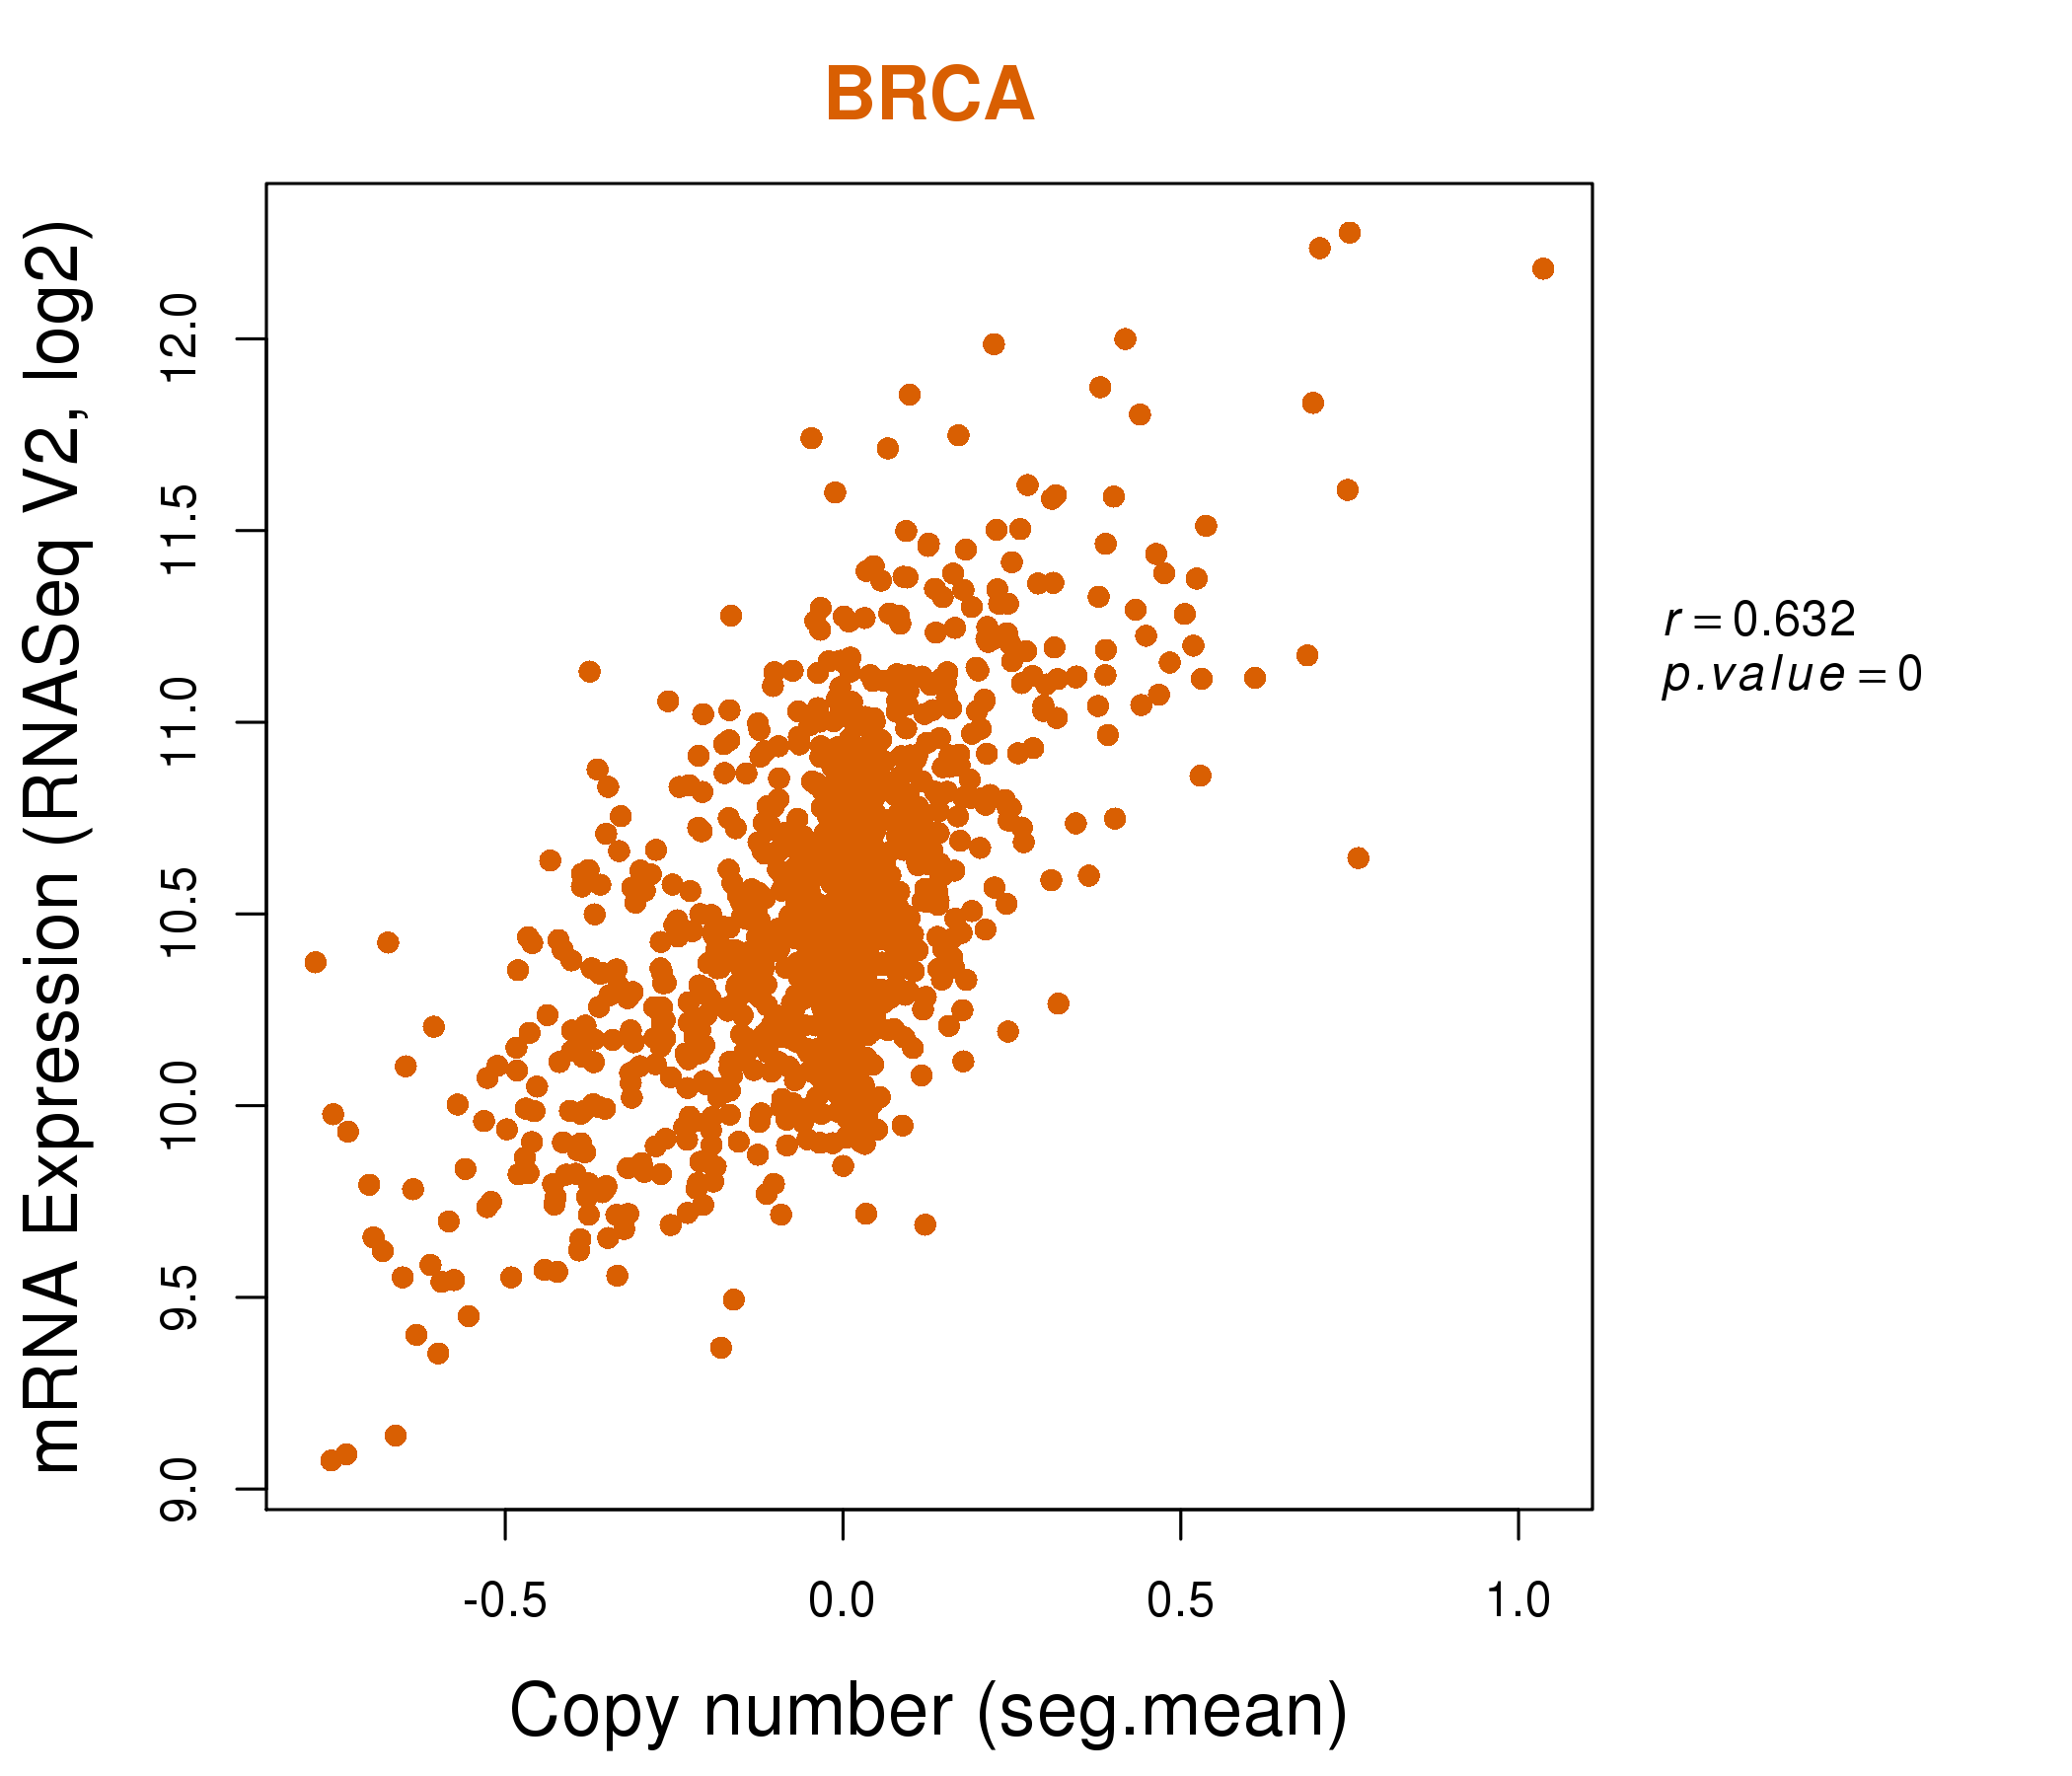
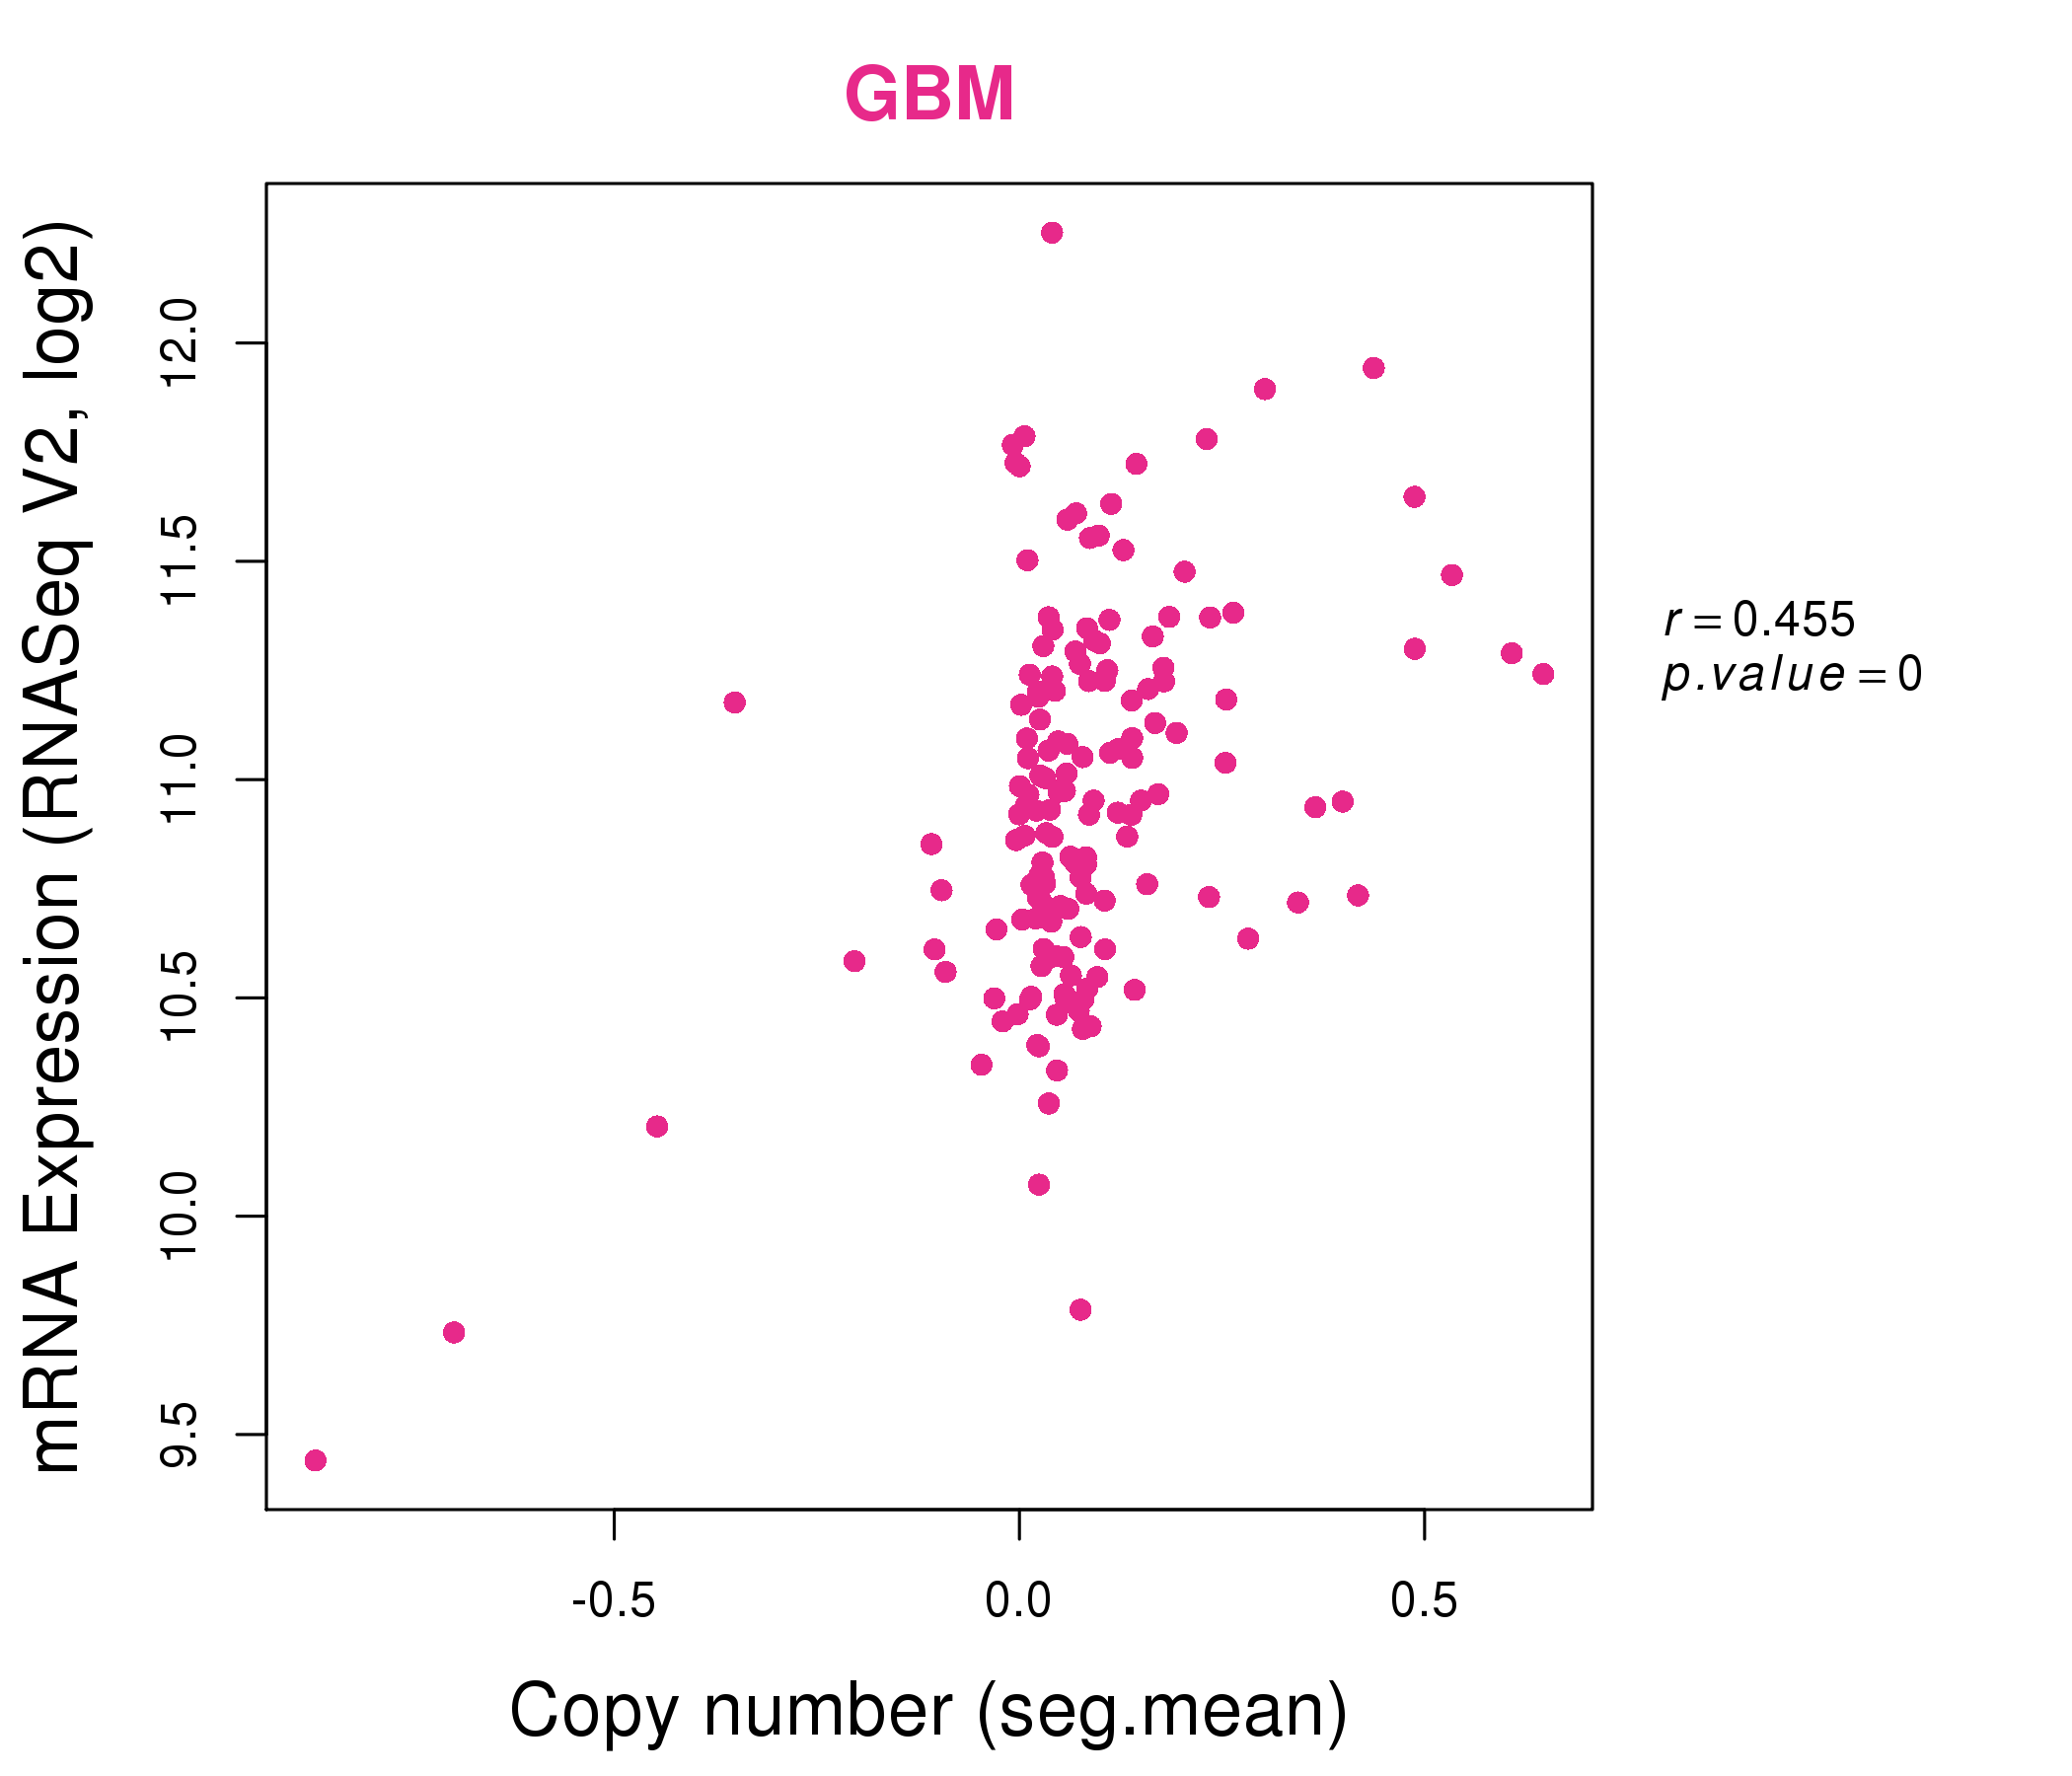
| * Normalized gene expression data of RNASeqV2 was extracted from TCGA using R package TCGA-Assembler. The URLs of all public data files on TCGA DCC data server were gathered at Jan-05-2015. Only eight cancer types have enough normal control samples for differential expression analysis. (t test, adjusted p<0.05 (using Benjamini-Hochberg FDR)) |
 |
| Top |
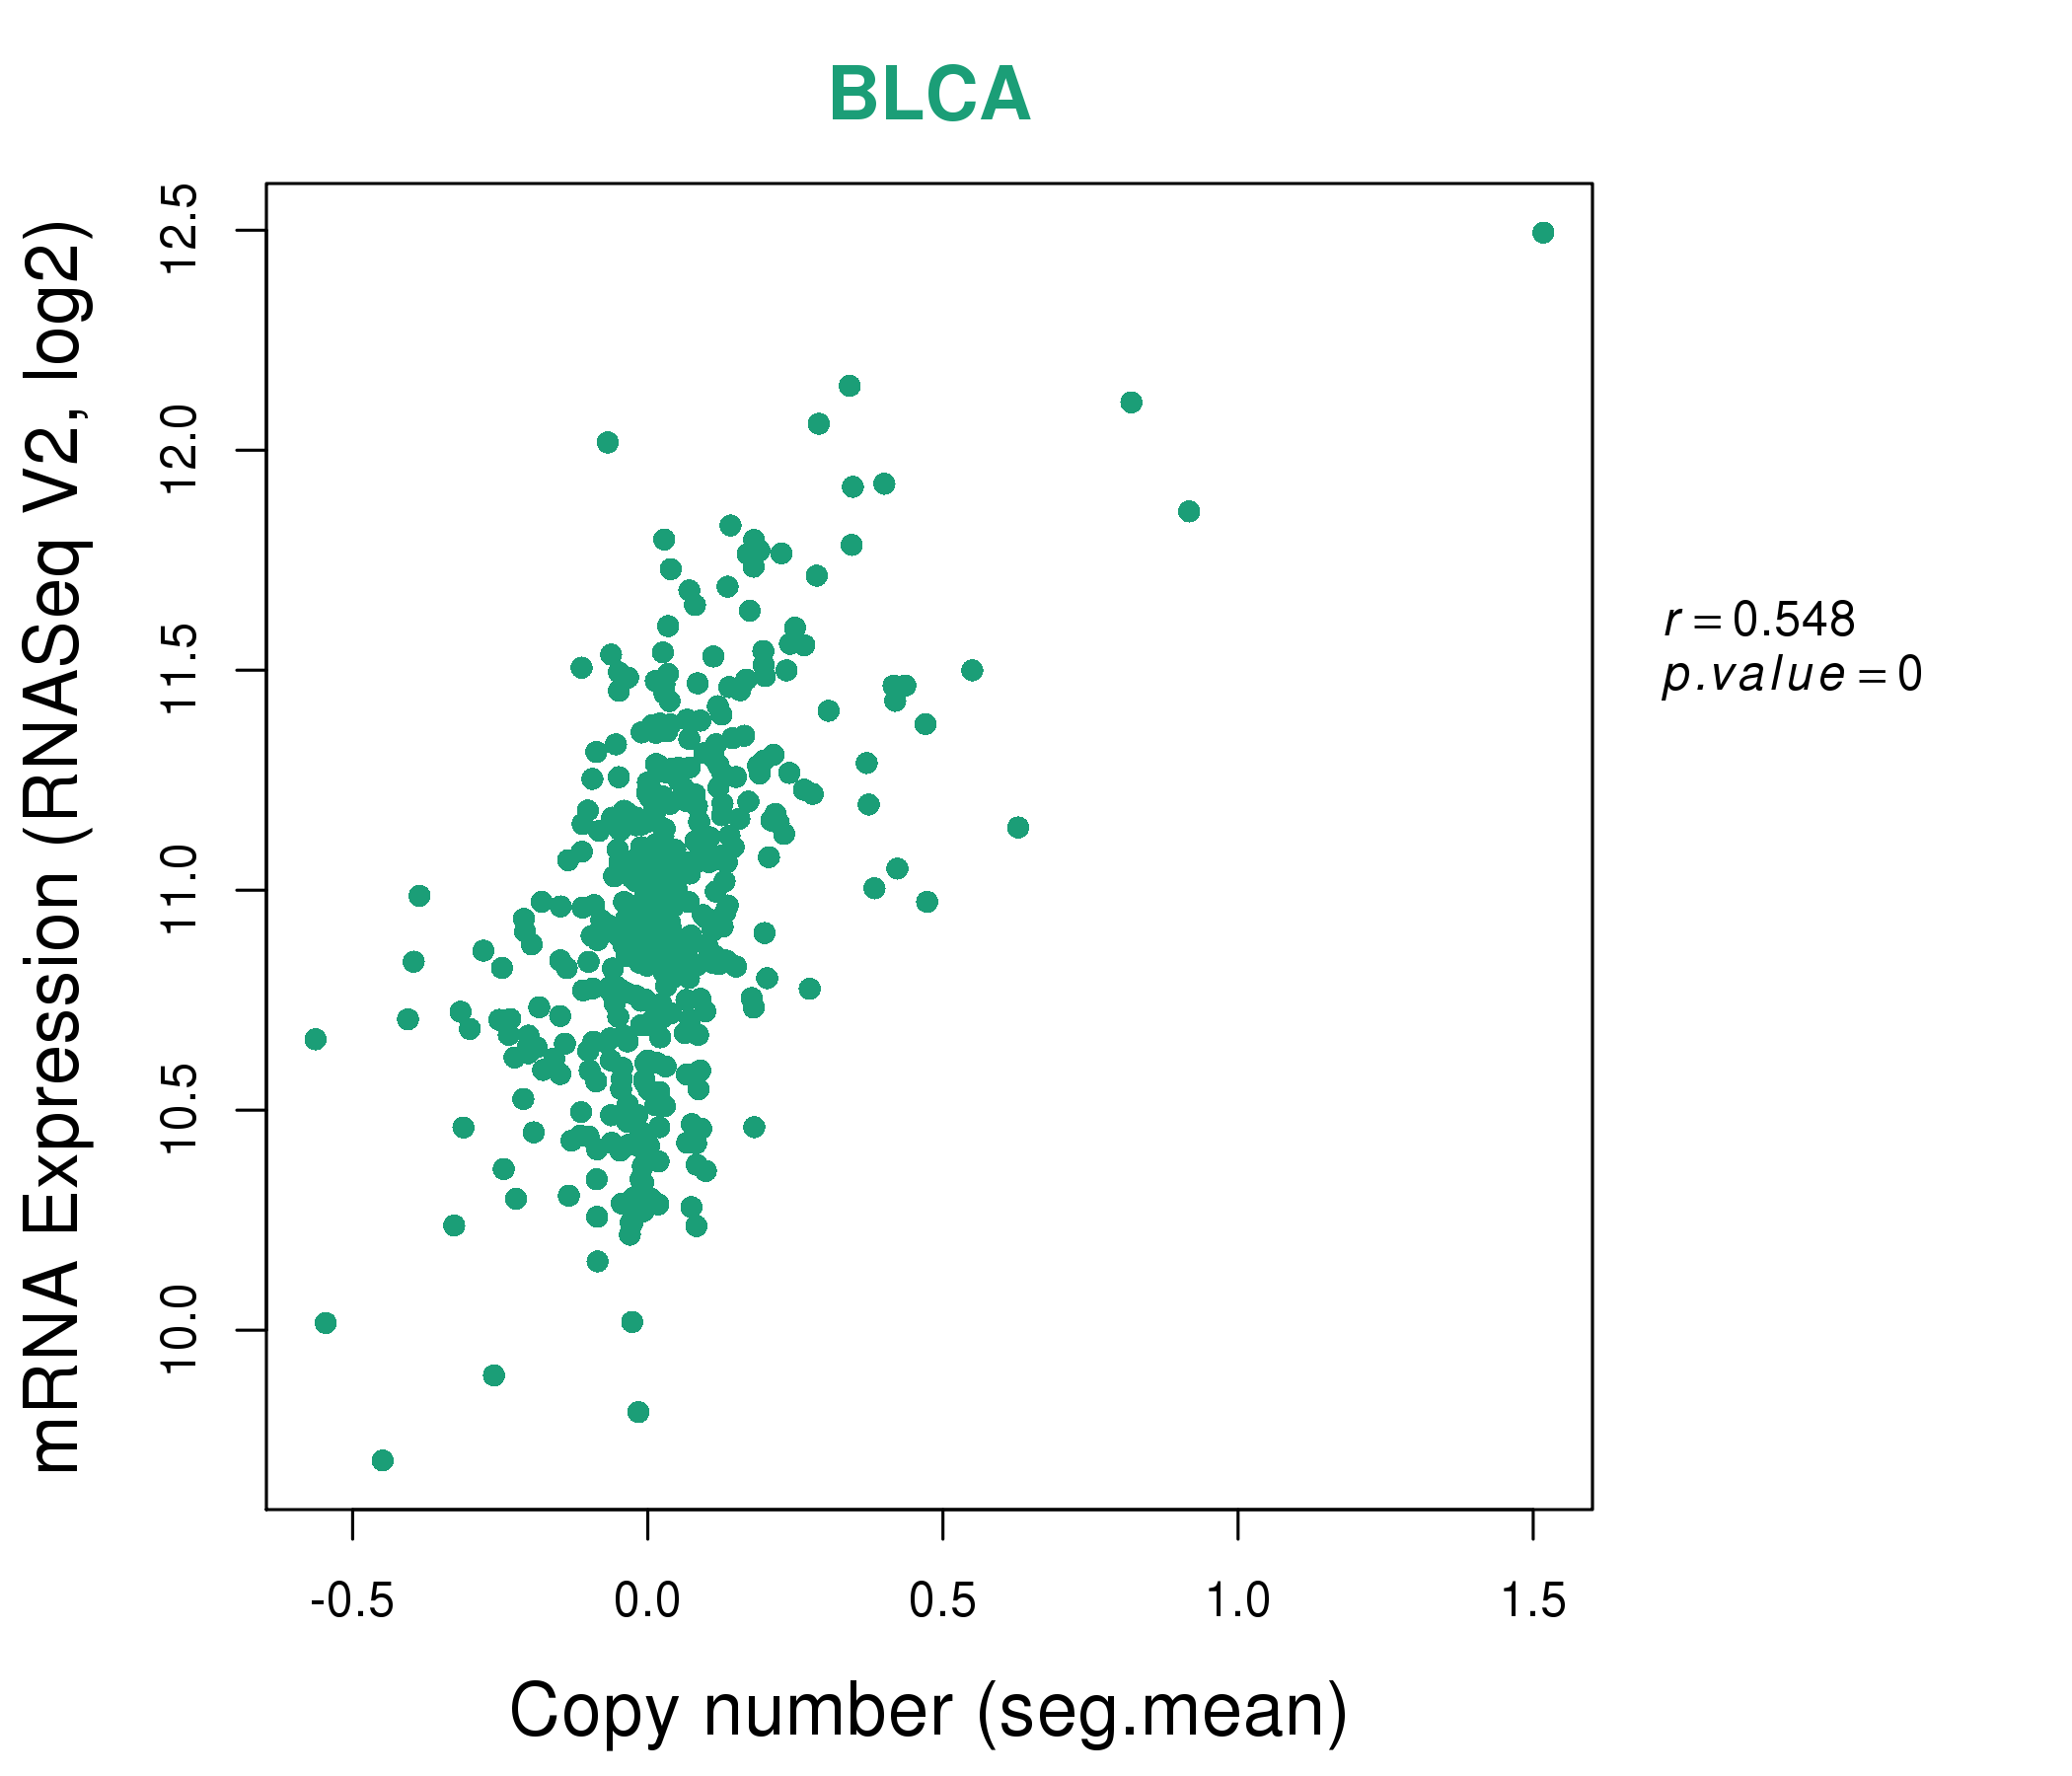
| * This plots show the correlation between CNV and gene expression. |
: Open all plots for all cancer types
 |
|
 |
|
| Top |
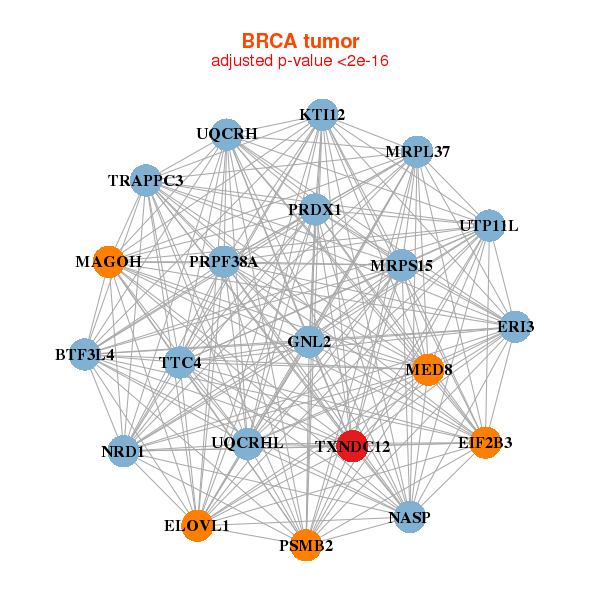
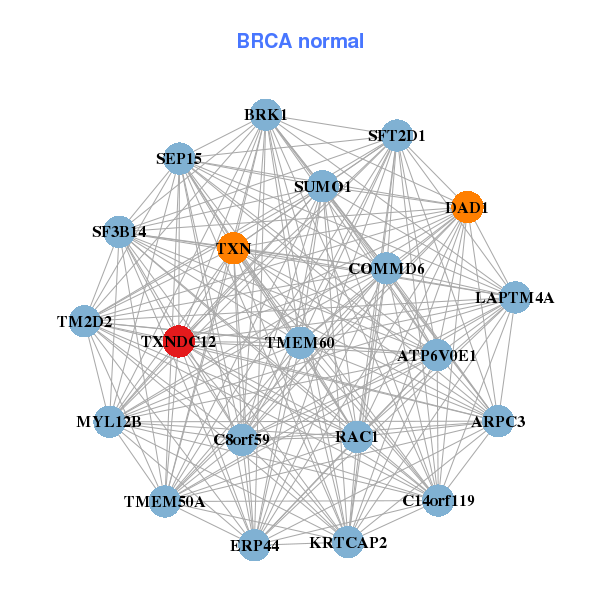
| Gene-Gene Network Information |
| * Co-Expression network figures were drawn using R package igraph. Only the top 20 genes with the highest correlations were shown. Red circle: input gene, orange circle: cell metabolism gene, sky circle: other gene |
: Open all plots for all cancer types
 |
| ||||
| BTF3L4,EIF2B3,ELOVL1,ERI3,GNL2,KTI12,MAGOH, MED8,MRPL37,MRPS15,NASP,NRD1,PRDX1,PRPF38A, PSMB2,TRAPPC3,TTC4,TXNDC12,UQCRH,UQCRHL,UTP11L | ARPC3,ATP6V0E1,C14orf119,BRK1,C8orf59,COMMD6,DAD1, ERP44,KRTCAP2,LAPTM4A,MYL12B,RAC1,SEP15,SF3B14, SFT2D1,SUMO1,TM2D2,TMEM50A,TMEM60,TXN,TXNDC12 | ||||
 |
| ||||
| BTF3L4,C1orf123,CCDC23,EIF2B3,EIF3I,ERI3,GNG5, LAMTOR5,ITGB3BP,MAGOH,MRPS15,MYCBP,PPCS,PPIH, PRDX1,PRPF38A,RPS8,TRAPPC3,TRIT1,TTC4,TXNDC12 | ACP1,FOPNL,C1orf131,COX16,DUSP11,EBAG9,FAM96A, GCA,JTB,MRPL48,NDUFB5,NXT2,PDCD2,POC1B, PPA2,RINT1,SVIP,TBPL1,TGDS,TXNDC12,ZNF468 |

| * Co-Expression network figures were drawn using R package igraph. Only the top 20 genes with the highest correlations were shown. Red circle: input gene, orange circle: cell metabolism gene, sky circle: other gene |
: Open all plots for all cancer types
| Top |
: Open all interacting genes' information including KEGG pathway for all interacting genes from DAVID
| Top |
| Pharmacological Information for TXNDC12 |
| DB Category | DB Name | DB's ID and Url link |
| * Gene Centered Interaction Network. |
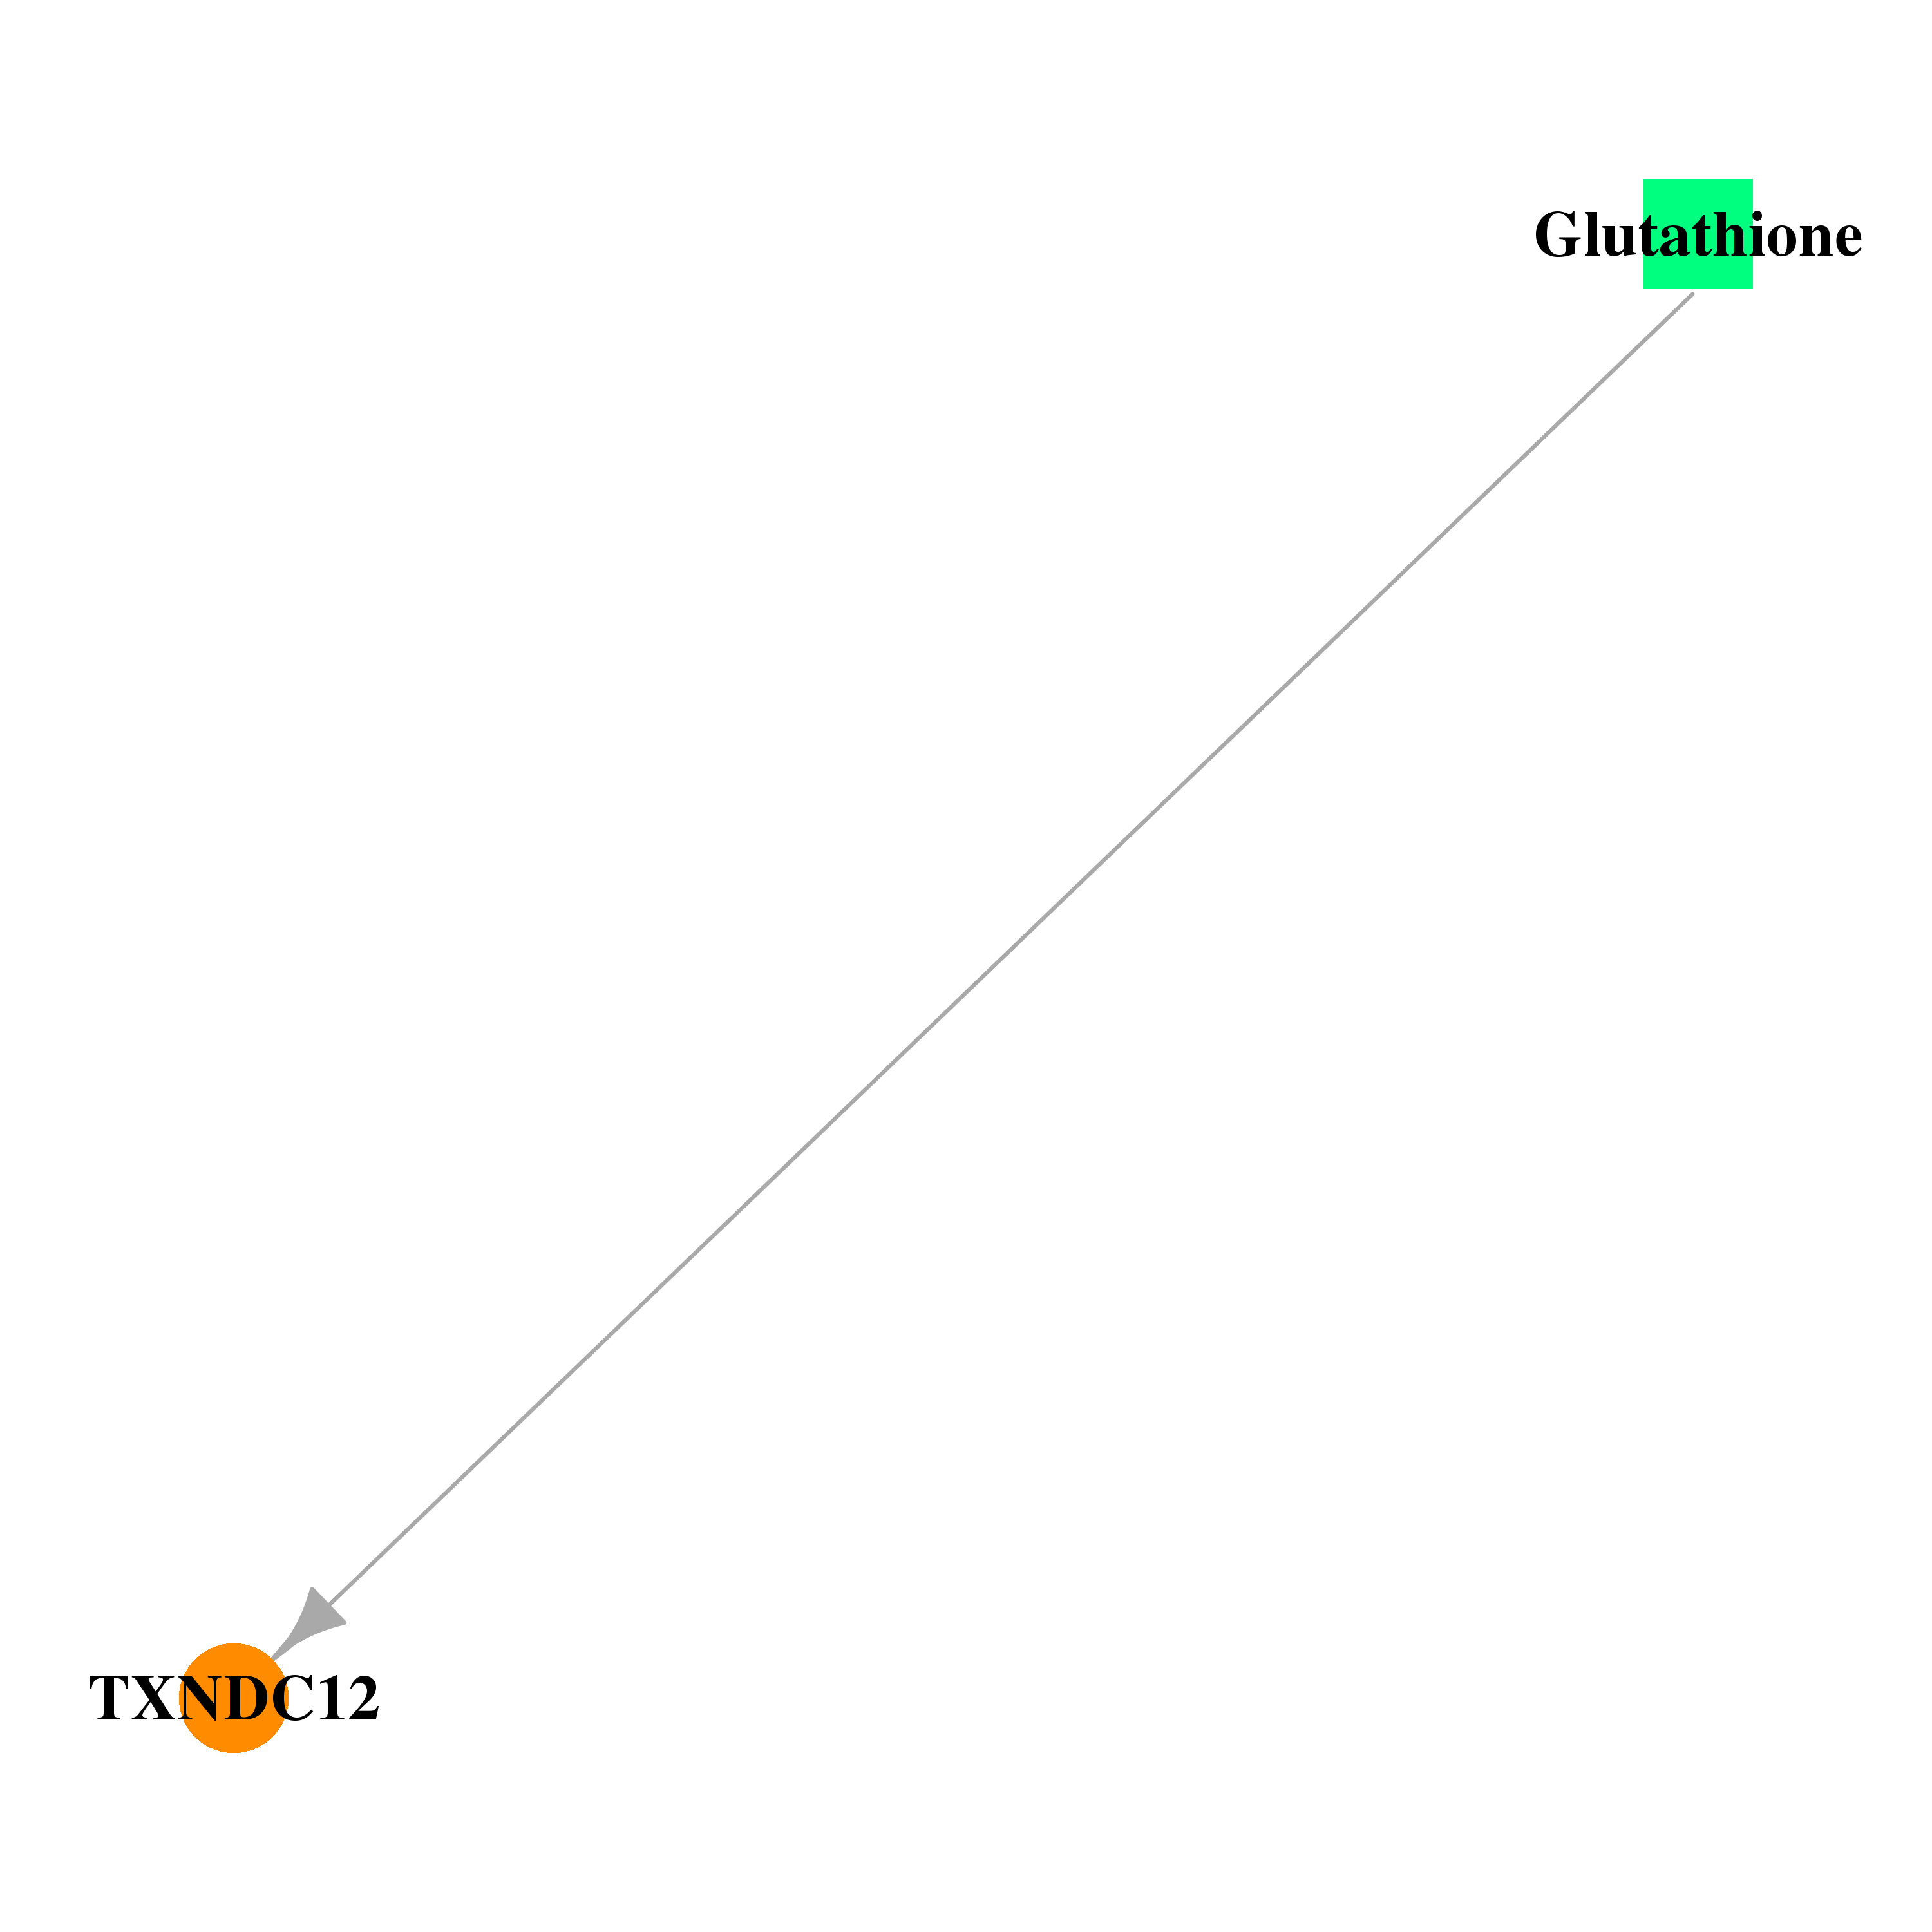 |
| * Drug Centered Interaction Network. |
| DrugBank ID | Target Name | Drug Groups | Generic Name | Drug Centered Network | Drug Structure |
| DB00143 | thioredoxin domain containing 12 (endoplasmic reticulum) | approved; nutraceutical | Glutathione |  |  |
| Top |
| Cross referenced IDs for TXNDC12 |
| * We obtained these cross-references from Uniprot database. It covers 150 different DBs, 18 categories. http://www.uniprot.org/help/cross_references_section |
: Open all cross reference information
|
Copyright © 2016-Present - The Univsersity of Texas Health Science Center at Houston @ |