|
||||||||||||||||||||||||||||||||||||||||||||||||||||||||||||||||||||||||||||||||||||||||||||||||||||||||||||||||||||||||||||||||||||||||||||||||||||||||||||||||||||||||||||||||||||||||||||||||||||||||||||||||||||||||||||||||||||||||||||||||||||||||||||||||||||||||||||||||||||||||||||||||||||||||||||||||||||||||||
| |
| Phenotypic Information (metabolism pathway, cancer, disease, phenome) |
| |
| |
| Gene-Gene Network Information: Co-Expression Network, Interacting Genes & KEGG |
| |
|


| Gene Summary for APIP |
| Basic gene info. | Gene symbol | APIP |
| Gene name | APAF1 interacting protein | |
| Synonyms | APIP2|CGI29|MMRP19|hAPIP | |
| Cytomap | UCSC genome browser: 11p13 | |
| Genomic location | chr11 :34903842-34937939 | |
| Type of gene | protein-coding | |
| RefGenes | NM_015957.3, | |
| Ensembl id | ENSG00000149089 | |
| Description | APAF1-interacting proteinMTRu-1-P dehydratasemethylthioribulose-1-phosphate dehydrataseprobable methylthioribulose-1-phosphate dehydratase | |
| Modification date | 20141207 | |
| dbXrefs | MIM : 612491 | |
| HGNC : HGNC | ||
| Ensembl : ENSG00000149089 | ||
| HPRD : 14725 | ||
| Vega : OTTHUMG00000166455 | ||
| Protein | UniProt: go to UniProt's Cross Reference DB Table | |
| Expression | CleanEX: HS_APIP | |
| BioGPS: 51074 | ||
| Gene Expression Atlas: ENSG00000149089 | ||
| The Human Protein Atlas: ENSG00000149089 | ||
| Pathway | NCI Pathway Interaction Database: APIP | |
| KEGG: APIP | ||
| REACTOME: APIP | ||
| ConsensusPathDB | ||
| Pathway Commons: APIP | ||
| Metabolism | MetaCyc: APIP | |
| HUMANCyc: APIP | ||
| Regulation | Ensembl's Regulation: ENSG00000149089 | |
| miRBase: chr11 :34,903,842-34,937,939 | ||
| TargetScan: NM_015957 | ||
| cisRED: ENSG00000149089 | ||
| Context | iHOP: APIP | |
| cancer metabolism search in PubMed: APIP | ||
| UCL Cancer Institute: APIP | ||
| Assigned class in ccmGDB | C | |
| Top |
| Phenotypic Information for APIP(metabolism pathway, cancer, disease, phenome) |
| Cancer | CGAP: APIP |
| Familial Cancer Database: APIP | |
| * This gene is included in those cancer gene databases. |
|
|
|
|
|
| . | ||||||||||||||||||||||||||||||||||||||||||||||||||||||||||||||||||||||||||||||||||||||||||||||||||||||||||||||||||||||||||||||||||||||||||||||||||||||||||||||||||||||||||||||||||||||||||||||||||||||||||||||||||||||||||||||||||||||||||||||||||||||||||||||||||||||||||||||||||||||||||||||||||||||||||||||||||||
Oncogene 1 | Significant driver gene in | |||||||||||||||||||||||||||||||||||||||||||||||||||||||||||||||||||||||||||||||||||||||||||||||||||||||||||||||||||||||||||||||||||||||||||||||||||||||||||||||||||||||||||||||||||||||||||||||||||||||||||||||||||||||||||||||||||||||||||||||||||||||||||||||||||||||||||||||||||||||||||||||||||||||||||||||||||||||||
| cf) number; DB name 1 Oncogene; http://nar.oxfordjournals.org/content/35/suppl_1/D721.long, 2 Tumor Suppressor gene; https://bioinfo.uth.edu/TSGene/, 3 Cancer Gene Census; http://www.nature.com/nrc/journal/v4/n3/abs/nrc1299.html, 4 CancerGenes; http://nar.oxfordjournals.org/content/35/suppl_1/D721.long, 5 Network of Cancer Gene; http://ncg.kcl.ac.uk/index.php, 1Therapeutic Vulnerabilities in Cancer; http://cbio.mskcc.org/cancergenomics/statius/ |
| KEGG_CYSTEINE_AND_METHIONINE_METABOLISM REACTOME_SULFUR_AMINO_ACID_METABOLISM REACTOME_METABOLISM_OF_AMINO_ACIDS_AND_DERIVATIVES REACTOME_METABOLISM_OF_POLYAMINES | |
| OMIM | |
| Orphanet | |
| Disease | KEGG Disease: APIP |
| MedGen: APIP (Human Medical Genetics with Condition) | |
| ClinVar: APIP | |
| Phenotype | MGI: APIP (International Mouse Phenotyping Consortium) |
| PhenomicDB: APIP | |
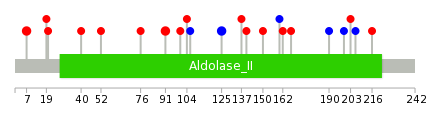
| Mutations for APIP |
| * Under tables are showing count per each tissue to give us broad intuition about tissue specific mutation patterns.You can go to the detailed page for each mutation database's web site. |
| - Statistics for Tissue and Mutation type | Top |
 |
| - For Inter-chromosomal Variations |
| There's no inter-chromosomal structural variation. |
| - For Intra-chromosomal Variations |
| * Intra-chromosomal variantions includes 'intrachromosomal amplicon to amplicon', 'intrachromosomal amplicon to non-amplified dna', 'intrachromosomal deletion', 'intrachromosomal fold-back inversion', 'intrachromosomal inversion', 'intrachromosomal tandem duplication', 'Intrachromosomal unknown type', 'intrachromosomal with inverted orientation', 'intrachromosomal with non-inverted orientation'. |
 |
| Sample | Symbol_a | Chr_a | Start_a | End_a | Symbol_b | Chr_b | Start_b | End_b |
| ovary | APIP | chr11 | 34906918 | 34906938 | chr11 | 34777584 | 34777604 | |
| ovary | APIP | chr11 | 34911151 | 34911171 | PDHX | chr11 | 34944010 | 34944030 |
| ovary | APIP | chr11 | 34915277 | 34915297 | PDHX | chr11 | 34944705 | 34944725 |
| cf) Tissue number; Tissue name (1;Breast, 2;Central_nervous_system, 3;Haematopoietic_and_lymphoid_tissue, 4;Large_intestine, 5;Liver, 6;Lung, 7;Ovary, 8;Pancreas, 9;Prostate, 10;Skin, 11;Soft_tissue, 12;Upper_aerodigestive_tract) |
| * From mRNA Sanger sequences, Chitars2.0 arranged chimeric transcripts. This table shows APIP related fusion information. |
| ID | Head Gene | Tail Gene | Accession | Gene_a | qStart_a | qEnd_a | Chromosome_a | tStart_a | tEnd_a | Gene_a | qStart_a | qEnd_a | Chromosome_a | tStart_a | tEnd_a |
| Top |
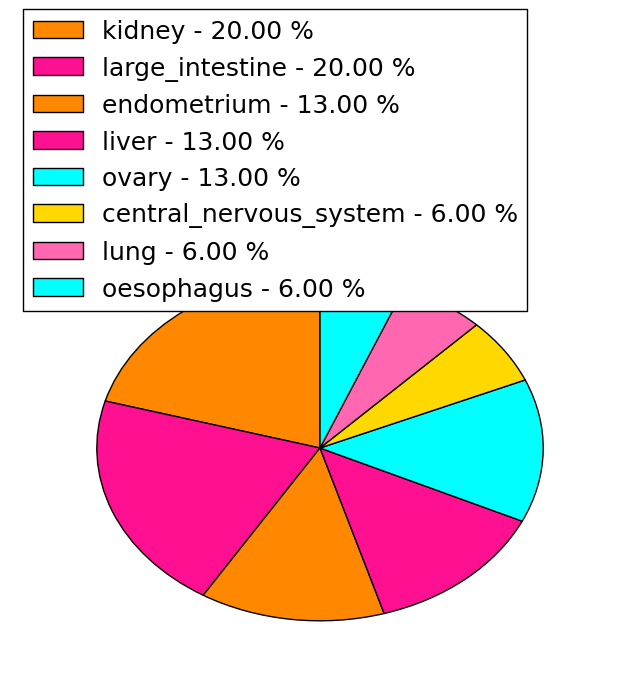
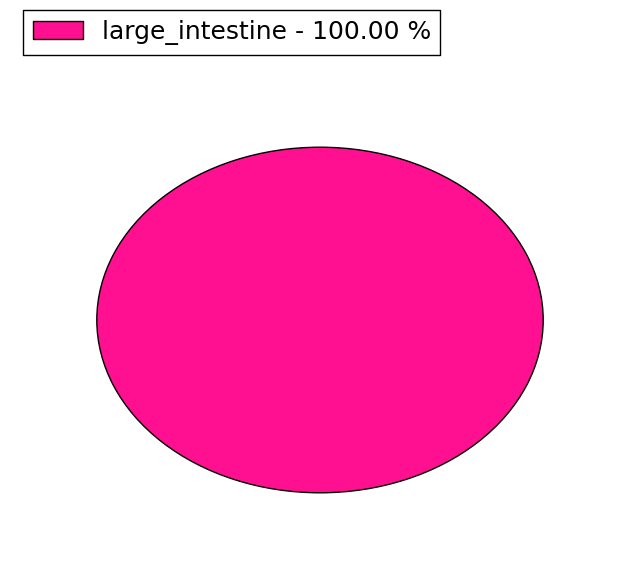
| Mutation type/ Tissue ID | brca | cns | cerv | endome | haematopo | kidn | Lintest | liver | lung | ns | ovary | pancre | prost | skin | stoma | thyro | urina | |||
| Total # sample | 1 | 1 | 2 | 1 | 3 | 1 | ||||||||||||||
| GAIN (# sample) | 1 | 1 | 1 | 3 | ||||||||||||||||
| LOSS (# sample) | 2 | 1 |
| cf) Tissue ID; Tissue type (1; Breast, 2; Central_nervous_system, 3; Cervix, 4; Endometrium, 5; Haematopoietic_and_lymphoid_tissue, 6; Kidney, 7; Large_intestine, 8; Liver, 9; Lung, 10; NS, 11; Ovary, 12; Pancreas, 13; Prostate, 14; Skin, 15; Stomach, 16; Thyroid, 17; Urinary_tract) |
| Top |
|
 |
| Top |
| Stat. for Non-Synonymous SNVs (# total SNVs=15) | (# total SNVs=5) |
 |  |
(# total SNVs=3) | (# total SNVs=0) |
 |
| Top |
| * When you move the cursor on each content, you can see more deailed mutation information on the Tooltip. Those are primary_site,primary_histology,mutation(aa),pubmedID. |
| GRCh37 position | Mutation(aa) | Unique sampleID count |
| chr11:34910341-34910341 | p.S95fs*8 | 3 |
| chr11:34910351-34910351 | p.K91N | 2 |
| chr11:34909926-34909926 | p.T125T | 2 |
| chr11:34937813-34937813 | p.R7W | 2 |
| chr11:34905028-34905028 | p.P162H | 1 |
| chr11:34905033-34905033 | p.V160V | 1 |
| chr11:34910397-34910397 | p.C76Y | 1 |
| chr11:34909852-34909852 | p.G150E | 1 |
| chr11:34916553-34916553 | p.? | 1 |
| chr11:34909860-34909860 | p.C147* | 1 |
| Top |
|
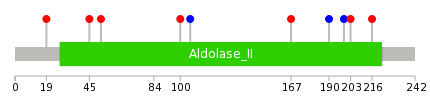 |
| Point Mutation/ Tissue ID | 1 | 2 | 3 | 4 | 5 | 6 | 7 | 8 | 9 | 10 | 11 | 12 | 13 | 14 | 15 | 16 | 17 | 18 | 19 | 20 |
| # sample | 3 | 1 | 2 | 2 | 2 | |||||||||||||||
| # mutation | 3 | 1 | 2 | 2 | 2 | |||||||||||||||
| nonsynonymous SNV | 1 | 1 | 1 | 2 | 2 | |||||||||||||||
| synonymous SNV | 2 | 1 |
| cf) Tissue ID; Tissue type (1; BLCA[Bladder Urothelial Carcinoma], 2; BRCA[Breast invasive carcinoma], 3; CESC[Cervical squamous cell carcinoma and endocervical adenocarcinoma], 4; COAD[Colon adenocarcinoma], 5; GBM[Glioblastoma multiforme], 6; Glioma Low Grade, 7; HNSC[Head and Neck squamous cell carcinoma], 8; KICH[Kidney Chromophobe], 9; KIRC[Kidney renal clear cell carcinoma], 10; KIRP[Kidney renal papillary cell carcinoma], 11; LAML[Acute Myeloid Leukemia], 12; LUAD[Lung adenocarcinoma], 13; LUSC[Lung squamous cell carcinoma], 14; OV[Ovarian serous cystadenocarcinoma ], 15; PAAD[Pancreatic adenocarcinoma], 16; PRAD[Prostate adenocarcinoma], 17; SKCM[Skin Cutaneous Melanoma], 18:STAD[Stomach adenocarcinoma], 19:THCA[Thyroid carcinoma], 20:UCEC[Uterine Corpus Endometrial Carcinoma]) |
| Top |
| * We represented just top 10 SNVs. When you move the cursor on each content, you can see more deailed mutation information on the Tooltip. Those are primary_site, primary_histology, mutation(aa), pubmedID. |
| Genomic Position | Mutation(aa) | Unique sampleID count |
| chr11:34910326 | p.H52Y | 1 |
| chr11:34916561 | p.G45E | 1 |
| chr11:34916581 | p.Q19H | 1 |
| chr11:34937775 | p.Y216C | 1 |
| chr11:34904346 | p.T203K | 1 |
| chr11:34904905 | p.V199V | 1 |
| chr11:34904916 | p.V190V | 1 |
| chr11:34904943 | p.T167A | 1 |
| chr11:34905014 | p.T106T | 1 |
| chr11:34910306 | p.L100I | 1 |
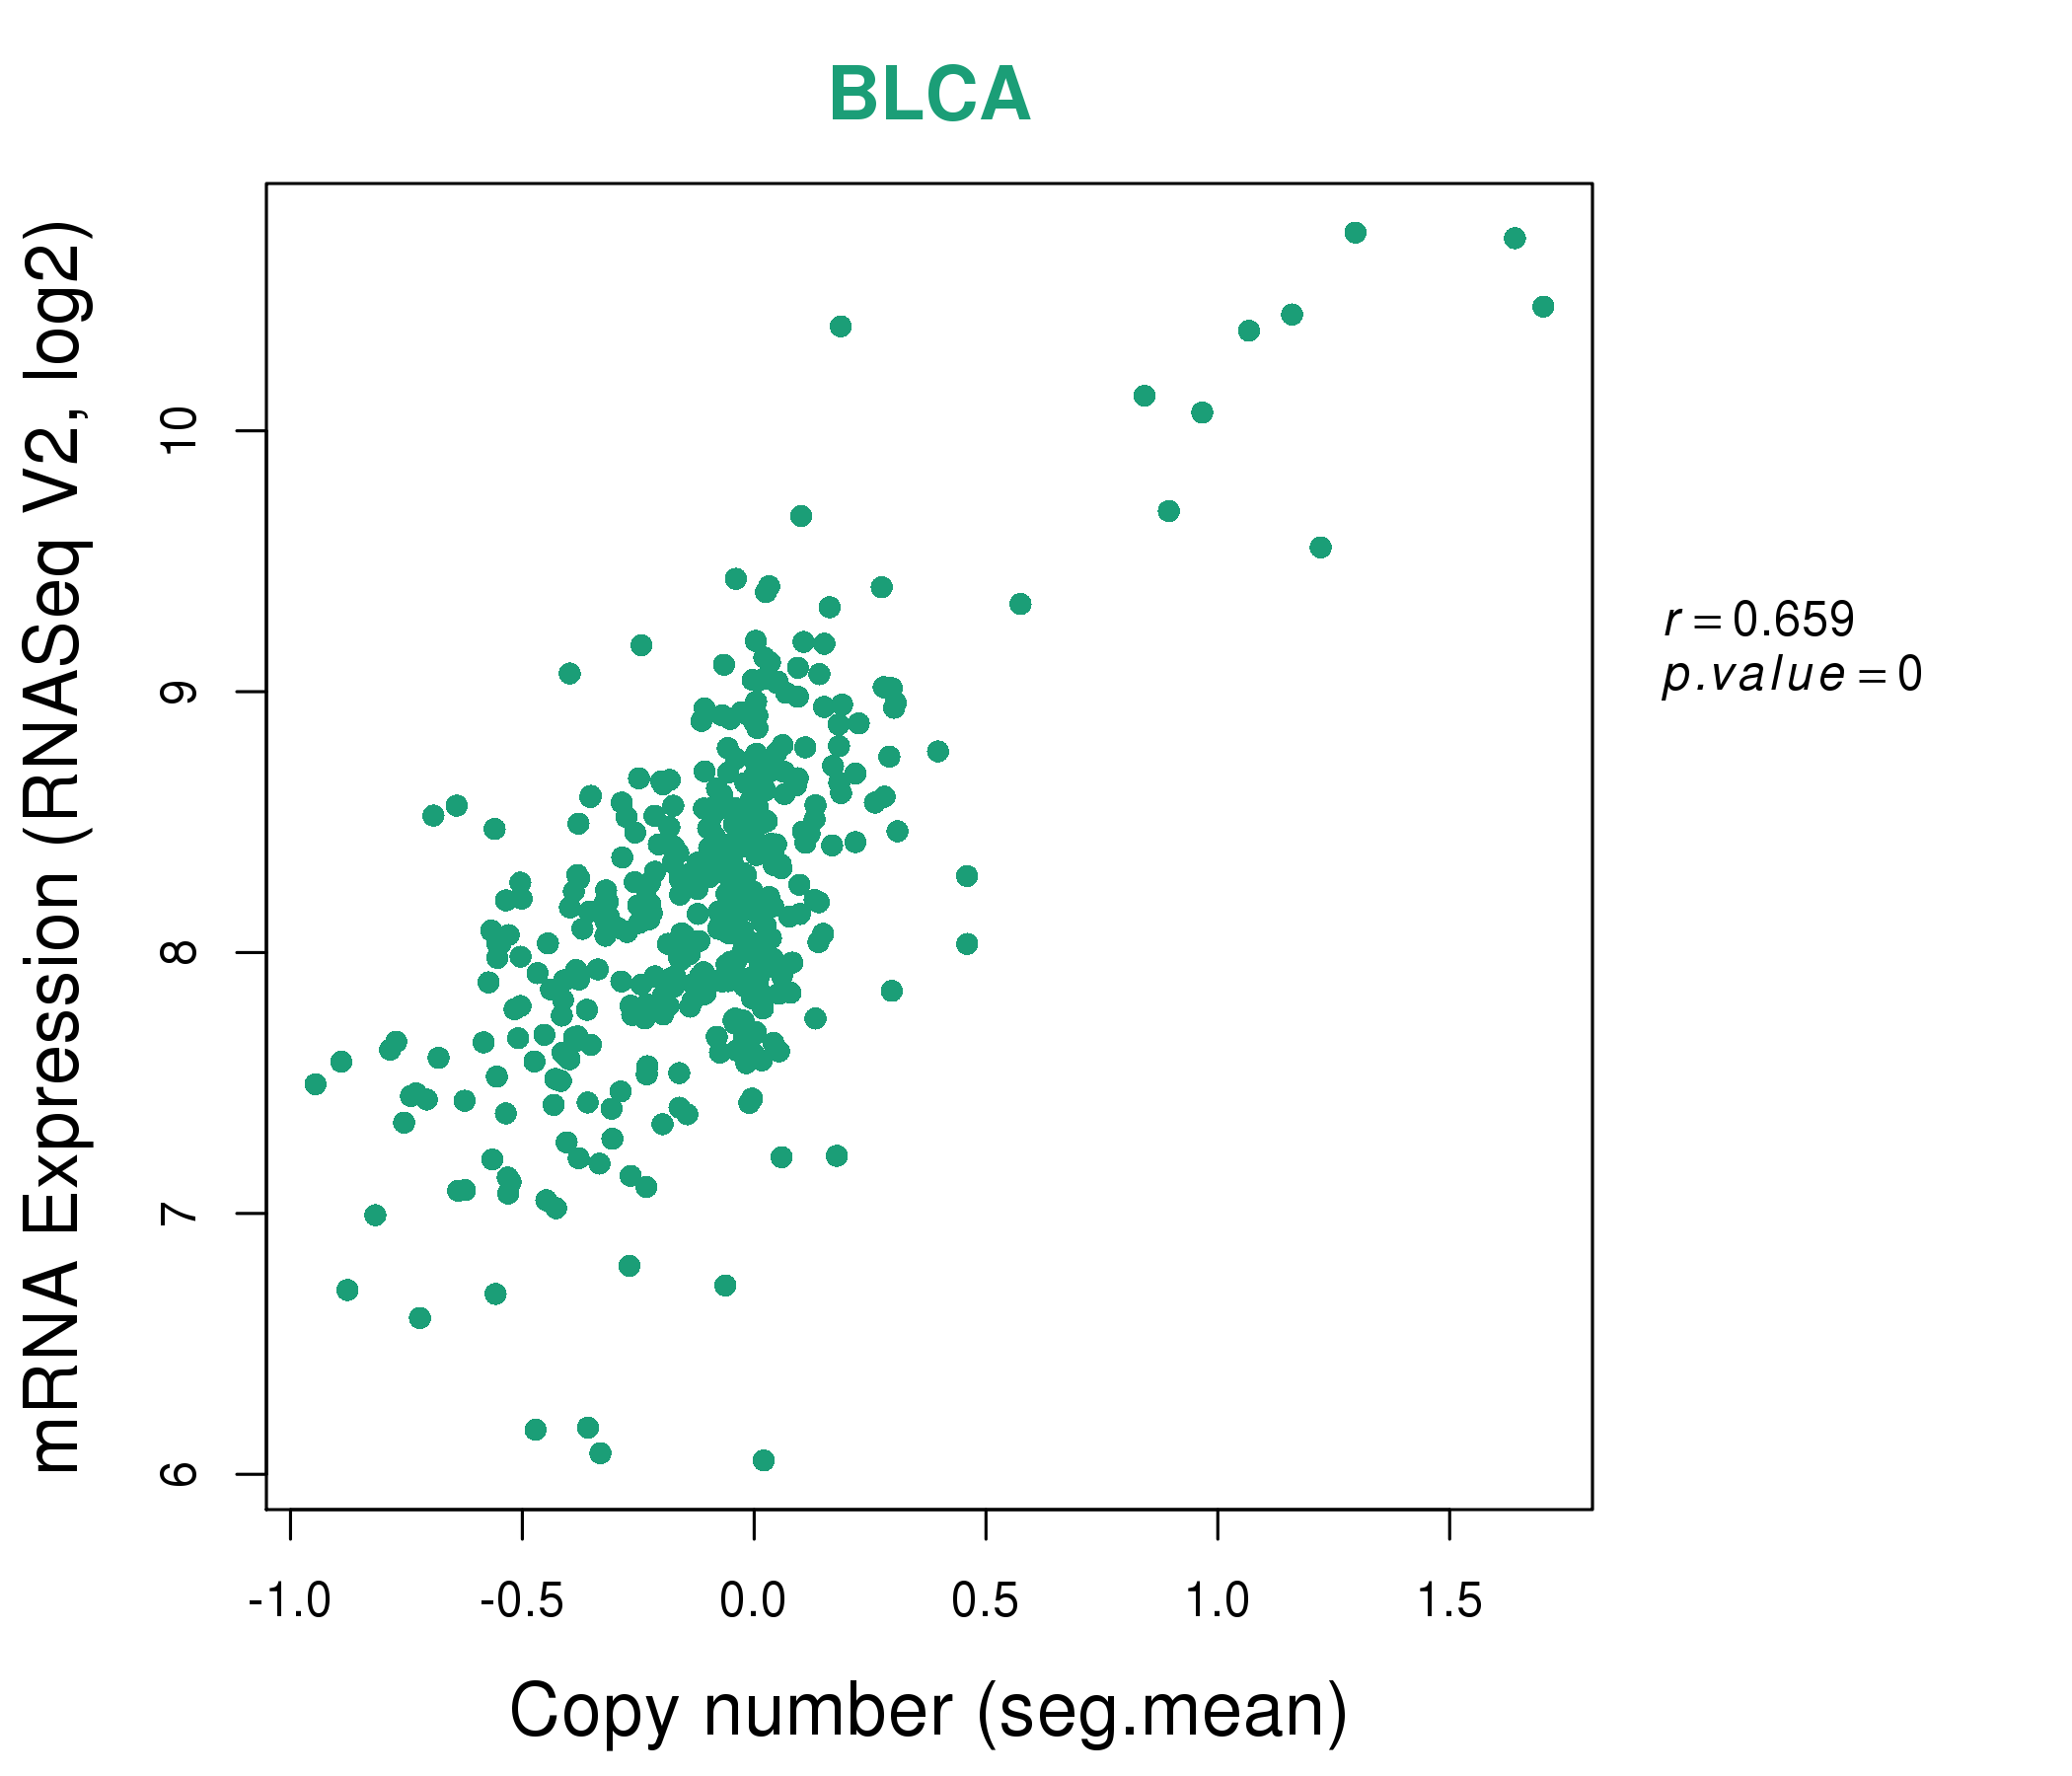
| * Copy number data were extracted from TCGA using R package TCGA-Assembler. The URLs of all public data files on TCGA DCC data server were gathered on Jan-05-2015. Function ProcessCNAData in TCGA-Assembler package was used to obtain gene-level copy number value which is calculated as the average copy number of the genomic region of a gene. |
 |
| cf) Tissue ID[Tissue type]: BLCA[Bladder Urothelial Carcinoma], BRCA[Breast invasive carcinoma], CESC[Cervical squamous cell carcinoma and endocervical adenocarcinoma], COAD[Colon adenocarcinoma], GBM[Glioblastoma multiforme], Glioma Low Grade, HNSC[Head and Neck squamous cell carcinoma], KICH[Kidney Chromophobe], KIRC[Kidney renal clear cell carcinoma], KIRP[Kidney renal papillary cell carcinoma], LAML[Acute Myeloid Leukemia], LUAD[Lung adenocarcinoma], LUSC[Lung squamous cell carcinoma], OV[Ovarian serous cystadenocarcinoma ], PAAD[Pancreatic adenocarcinoma], PRAD[Prostate adenocarcinoma], SKCM[Skin Cutaneous Melanoma], STAD[Stomach adenocarcinoma], THCA[Thyroid carcinoma], UCEC[Uterine Corpus Endometrial Carcinoma] |
| Top |
| Gene Expression for APIP |
| * CCLE gene expression data were extracted from CCLE_Expression_Entrez_2012-10-18.res: Gene-centric RMA-normalized mRNA expression data. |
 |
| * Normalized gene expression data of RNASeqV2 was extracted from TCGA using R package TCGA-Assembler. The URLs of all public data files on TCGA DCC data server were gathered at Jan-05-2015. Only eight cancer types have enough normal control samples for differential expression analysis. (t test, adjusted p<0.05 (using Benjamini-Hochberg FDR)) |
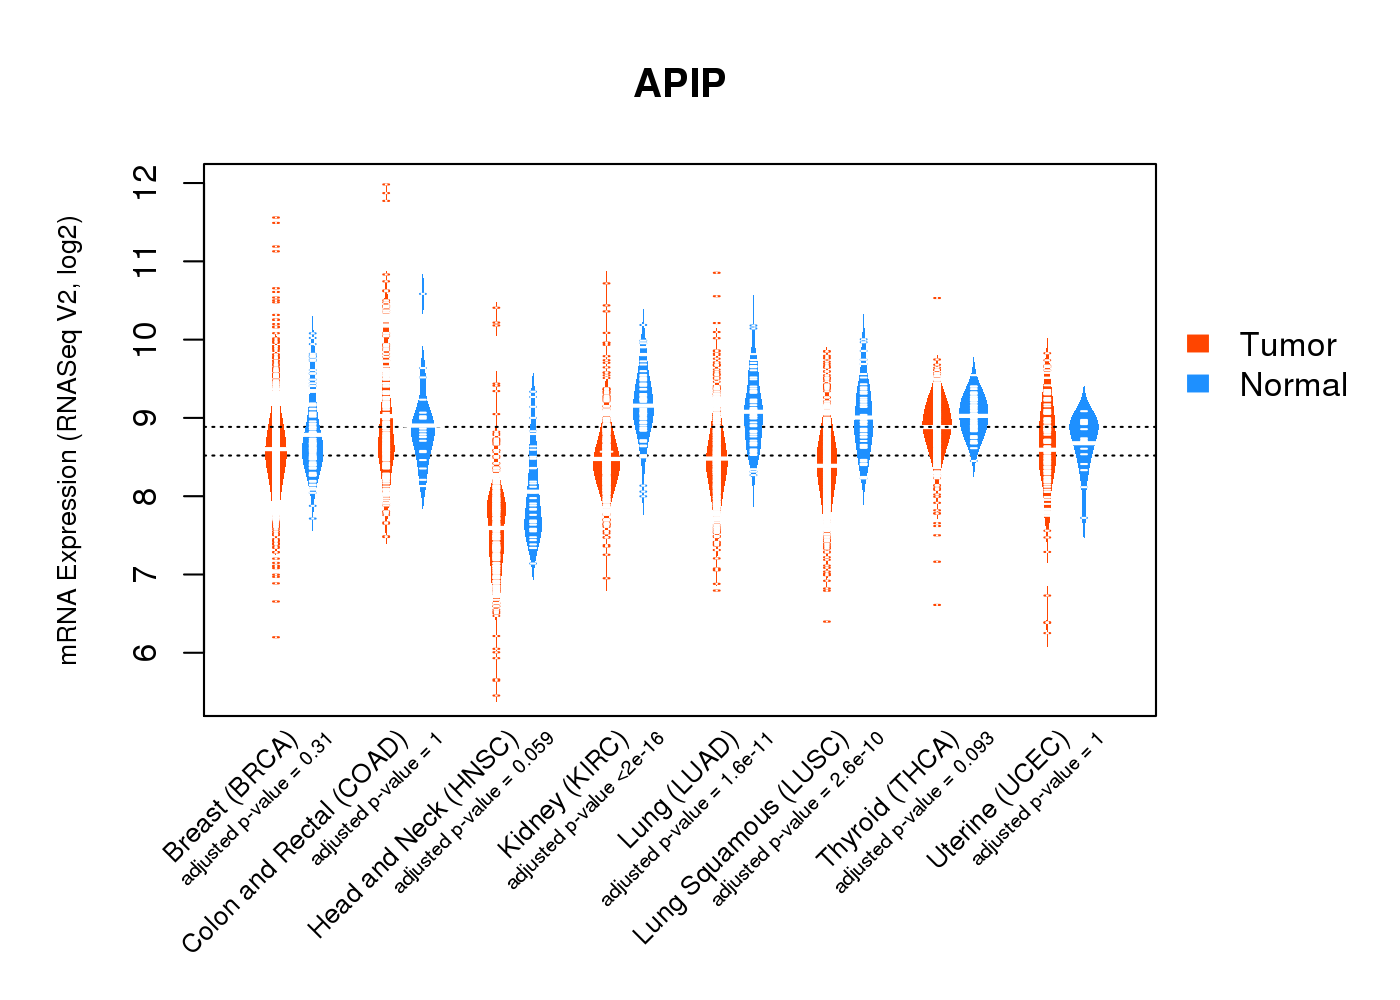 |
| Top |
| * This plots show the correlation between CNV and gene expression. |
: Open all plots for all cancer types
 |
|
 |
|


| Top |
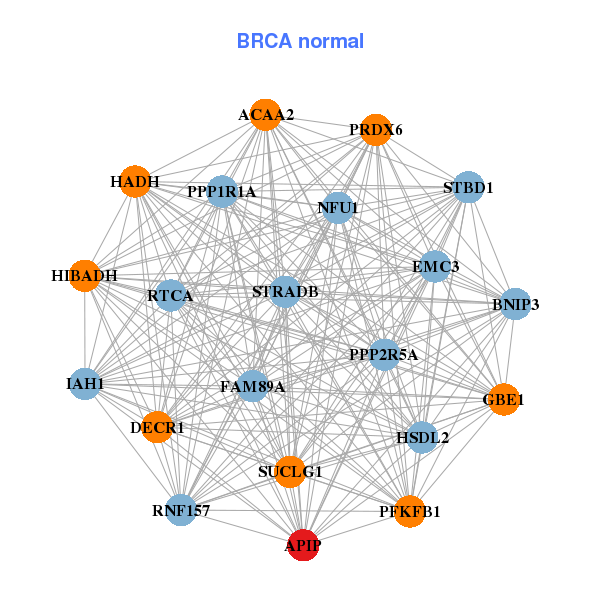
| Gene-Gene Network Information |
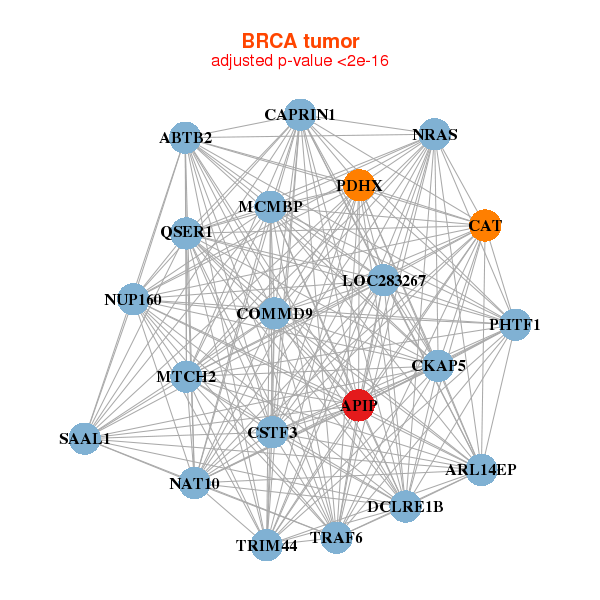
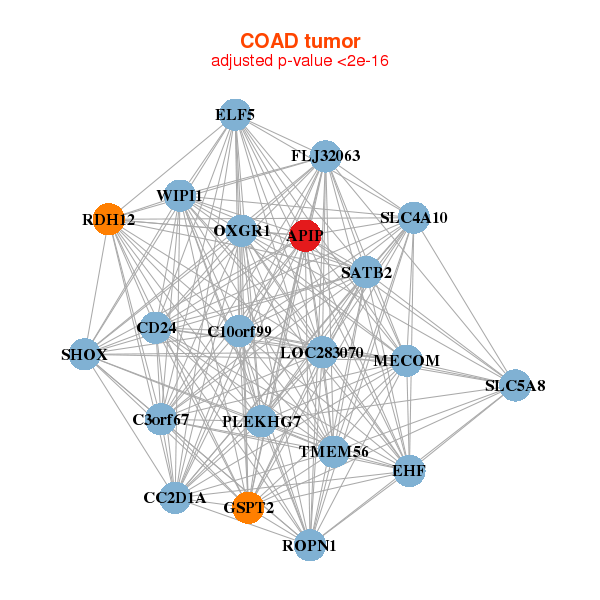
| * Co-Expression network figures were drawn using R package igraph. Only the top 20 genes with the highest correlations were shown. Red circle: input gene, orange circle: cell metabolism gene, sky circle: other gene |
: Open all plots for all cancer types
 |
|
| ABTB2,APIP,MCMBP,ARL14EP,CAPRIN1,CAT,CKAP5, COMMD9,CSTF3,DCLRE1B,LOC283267,MTCH2,NAT10,NRAS, NUP160,PDHX,PHTF1,QSER1,SAAL1,TRAF6,TRIM44 | ACAA2,APIP,BNIP3,DECR1,FAM89A,GBE1,HADH, HIBADH,HSDL2,IAH1,NFU1,PFKFB1,PPP1R1A,PPP2R5A, PRDX6,RNF157,RTCA,STBD1,STRADB,SUCLG1,EMC3 |
 |
|
| APIP,C10orf99,C3orf67,CC2D1A,CD24,EHF,ELF5, FLJ32063,GSPT2,LOC283070,MECOM,OXGR1,PLEKHG7,RDH12, ROPN1,SATB2,SHOX,SLC4A10,SLC5A8,TMEM56,WIPI1 | APIP,APOL4,C1GALT1C1,CCL2,DRAM1,FCGR1A,FCGR1B, GOLT1B,IDO1,IL12A,IL13RA2,IL22,LILRA5,LOC400759, MMP1,NMI,PMAIP1,PSMA3,PSMA4,SUCNR1,TNFSF13B |

| * Co-Expression network figures were drawn using R package igraph. Only the top 20 genes with the highest correlations were shown. Red circle: input gene, orange circle: cell metabolism gene, sky circle: other gene |
: Open all plots for all cancer types
| Top |
: Open all interacting genes' information including KEGG pathway for all interacting genes from DAVID
| Top |
| Pharmacological Information for APIP |
| There's no related Drug. |
| Top |
| Cross referenced IDs for APIP |
| * We obtained these cross-references from Uniprot database. It covers 150 different DBs, 18 categories. http://www.uniprot.org/help/cross_references_section |
: Open all cross reference information
|
Copyright © 2016-Present - The Univsersity of Texas Health Science Center at Houston @ |