|
||||||||||||||||||||||||||||||||||||||||||||||||||||||||||||||||||||||||||||||||||||||||||||||||||||||||||||||||||||||||||||||||||||||||||||||||||||||||||||||||||||||||||||||||||||||||||||||||||||||||||||||||||||||||||||||||||||||||||||||||||||||||||||||||||||||||||||||||||||||||||||||||||||||||||||||||||||||||||
| |
| Phenotypic Information (metabolism pathway, cancer, disease, phenome) |
| |
| |
| Gene-Gene Network Information: Co-Expression Network, Interacting Genes & KEGG |
| |
|


| Gene Summary for POLR1D |
| Basic gene info. | Gene symbol | POLR1D |
| Gene name | polymerase (RNA) I polypeptide D, 16kDa | |
| Synonyms | AC19|POLR1C|RPA16|RPA9|RPAC2|RPC16|RPO1-3|TCS2 | |
| Cytomap | UCSC genome browser: 13q12.2 | |
| Genomic location | chr13 :28194879-28241559 | |
| Type of gene | protein-coding | |
| RefGenes | NM_001206559.1, NM_015972.3,NM_152705.2, | |
| Ensembl id | ENSG00000186184 | |
| Description | DNA-directed RNA polymerase I subunit DDNA-directed RNA polymerases I and III subunit RPAC2RNA polymerases I and III subunit AC2 | |
| Modification date | 20141219 | |
| dbXrefs | MIM : 613715 | |
| HGNC : HGNC | ||
| Ensembl : ENSG00000186184 | ||
| HPRD : 14717 | ||
| HPRD : 17877 | ||
| Vega : OTTHUMG00000016635 | ||
| Protein | UniProt: Q9Y2S0 go to UniProt's Cross Reference DB Table | |
| Expression | CleanEX: HS_POLR1D | |
| BioGPS: 51082 | ||
| Gene Expression Atlas: ENSG00000186184 | ||
| The Human Protein Atlas: ENSG00000186184 | ||
| Pathway | NCI Pathway Interaction Database: POLR1D | |
| KEGG: POLR1D | ||
| REACTOME: POLR1D | ||
| ConsensusPathDB | ||
| Pathway Commons: POLR1D | ||
| Metabolism | MetaCyc: POLR1D | |
| HUMANCyc: POLR1D | ||
| Regulation | Ensembl's Regulation: ENSG00000186184 | |
| miRBase: chr13 :28,194,879-28,241,559 | ||
| TargetScan: NM_001206559 | ||
| cisRED: ENSG00000186184 | ||
| Context | iHOP: POLR1D | |
| cancer metabolism search in PubMed: POLR1D | ||
| UCL Cancer Institute: POLR1D | ||
| Assigned class in ccmGDB | B - This gene belongs to cancer gene. | |
| Top |
| Phenotypic Information for POLR1D(metabolism pathway, cancer, disease, phenome) |
| Cancer | CGAP: POLR1D |
| Familial Cancer Database: POLR1D | |
| * This gene is included in those cancer gene databases. |
|
|
|
|
|
| . | ||||||||||||||||||||||||||||||||||||||||||||||||||||||||||||||||||||||||||||||||||||||||||||||||||||||||||||||||||||||||||||||||||||||||||||||||||||||||||||||||||||||||||||||||||||||||||||||||||||||||||||||||||||||||||||||||||||||||||||||||||||||||||||||||||||||||||||||||||||||||||||||||||||||||||||||||||||
Oncogene 1 | Significant driver gene in | |||||||||||||||||||||||||||||||||||||||||||||||||||||||||||||||||||||||||||||||||||||||||||||||||||||||||||||||||||||||||||||||||||||||||||||||||||||||||||||||||||||||||||||||||||||||||||||||||||||||||||||||||||||||||||||||||||||||||||||||||||||||||||||||||||||||||||||||||||||||||||||||||||||||||||||||||||||||||
| cf) number; DB name 1 Oncogene; http://nar.oxfordjournals.org/content/35/suppl_1/D721.long, 2 Tumor Suppressor gene; https://bioinfo.uth.edu/TSGene/, 3 Cancer Gene Census; http://www.nature.com/nrc/journal/v4/n3/abs/nrc1299.html, 4 CancerGenes; http://nar.oxfordjournals.org/content/35/suppl_1/D721.long, 5 Network of Cancer Gene; http://ncg.kcl.ac.uk/index.php, 1Therapeutic Vulnerabilities in Cancer; http://cbio.mskcc.org/cancergenomics/statius/ |
| KEGG_PURINE_METABOLISM KEGG_PYRIMIDINE_METABOLISM | |
| OMIM | 613715; gene. 613717; phenotype. |
| Orphanet | 861; Treacher-Collins syndrome. |
| Disease | KEGG Disease: POLR1D |
| MedGen: POLR1D (Human Medical Genetics with Condition) | |
| ClinVar: POLR1D | |
| Phenotype | MGI: POLR1D (International Mouse Phenotyping Consortium) |
| PhenomicDB: POLR1D | |
| Mutations for POLR1D |
| * Under tables are showing count per each tissue to give us broad intuition about tissue specific mutation patterns.You can go to the detailed page for each mutation database's web site. |
| There's no structural variation information in COSMIC data for this gene. |
| * From mRNA Sanger sequences, Chitars2.0 arranged chimeric transcripts. This table shows POLR1D related fusion information. |
| ID | Head Gene | Tail Gene | Accession | Gene_a | qStart_a | qEnd_a | Chromosome_a | tStart_a | tEnd_a | Gene_a | qStart_a | qEnd_a | Chromosome_a | tStart_a | tEnd_a |
| BM544526 | POLR1D | 1 | 769 | 13 | 28240082 | 28240850 | CHORDC1 | 769 | 993 | 11 | 89944383 | 89947307 | |
| Top |
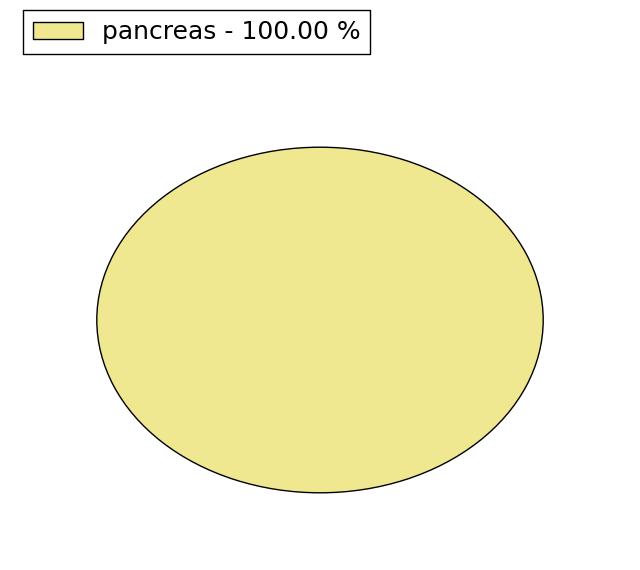
| Mutation type/ Tissue ID | brca | cns | cerv | endome | haematopo | kidn | Lintest | liver | lung | ns | ovary | pancre | prost | skin | stoma | thyro | urina | |||
| Total # sample | 1 | 2 | 1 | |||||||||||||||||
| GAIN (# sample) | 2 | 1 | ||||||||||||||||||
| LOSS (# sample) | 1 |
| cf) Tissue ID; Tissue type (1; Breast, 2; Central_nervous_system, 3; Cervix, 4; Endometrium, 5; Haematopoietic_and_lymphoid_tissue, 6; Kidney, 7; Large_intestine, 8; Liver, 9; Lung, 10; NS, 11; Ovary, 12; Pancreas, 13; Prostate, 14; Skin, 15; Stomach, 16; Thyroid, 17; Urinary_tract) |
| Top |
|
 |
| Top |
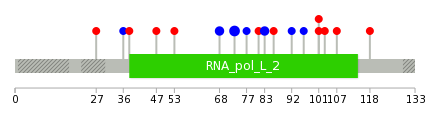
| Stat. for Non-Synonymous SNVs (# total SNVs=10) | (# total SNVs=6) |
 |  |
(# total SNVs=1) | (# total SNVs=0) |
 |
| Top |
| * When you move the cursor on each content, you can see more deailed mutation information on the Tooltip. Those are primary_site,primary_histology,mutation(aa),pubmedID. |
| GRCh37 position | Mutation(aa) | Unique sampleID count |
| chr13:28239940-28239940 | p.A73A | 4 |
| chr13:28239925-28239925 | p.G68G | 2 |
| chr13:28239970-28239970 | p.P83P | 2 |
| chr13:28239978-28239978 | p.H86L | 1 |
| chr13:28239833-28239833 | p.P38S | 1 |
| chr13:28239997-28239997 | p.K92K | 1 |
| chr13:28239857-28239857 | p.L47fs*1 | 1 |
| chr13:28240009-28240009 | p.R96R | 1 |
| chr13:28239860-28239860 | p.L47V | 1 |
| chr13:28240013-28240013 | p.R98* | 1 |
| Top |
|
 |
| Point Mutation/ Tissue ID | 1 | 2 | 3 | 4 | 5 | 6 | 7 | 8 | 9 | 10 | 11 | 12 | 13 | 14 | 15 | 16 | 17 | 18 | 19 | 20 |
| # sample | 3 | 3 | 6 | 2 | 1 | 2 | 5 | |||||||||||||
| # mutation | 3 | 3 | 7 | 2 | 1 | 2 | 5 | |||||||||||||
| nonsynonymous SNV | 2 | 3 | 7 | 2 | 1 | 1 | 3 | |||||||||||||
| synonymous SNV | 1 | 1 | 2 |
| cf) Tissue ID; Tissue type (1; BLCA[Bladder Urothelial Carcinoma], 2; BRCA[Breast invasive carcinoma], 3; CESC[Cervical squamous cell carcinoma and endocervical adenocarcinoma], 4; COAD[Colon adenocarcinoma], 5; GBM[Glioblastoma multiforme], 6; Glioma Low Grade, 7; HNSC[Head and Neck squamous cell carcinoma], 8; KICH[Kidney Chromophobe], 9; KIRC[Kidney renal clear cell carcinoma], 10; KIRP[Kidney renal papillary cell carcinoma], 11; LAML[Acute Myeloid Leukemia], 12; LUAD[Lung adenocarcinoma], 13; LUSC[Lung squamous cell carcinoma], 14; OV[Ovarian serous cystadenocarcinoma ], 15; PAAD[Pancreatic adenocarcinoma], 16; PRAD[Prostate adenocarcinoma], 17; SKCM[Skin Cutaneous Melanoma], 18:STAD[Stomach adenocarcinoma], 19:THCA[Thyroid carcinoma], 20:UCEC[Uterine Corpus Endometrial Carcinoma]) |
| Top |
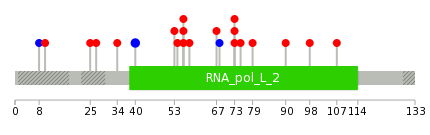
| * We represented just top 10 SNVs. When you move the cursor on each content, you can see more deailed mutation information on the Tooltip. Those are primary_site, primary_histology, mutation(aa), pubmedID. |
| Genomic Position | Mutation(aa) | Unique sampleID count |
| chr13:28239925 | p.R56P | 2 |
| chr13:28197152 | p.G40G,POLR1D | 2 |
| chr13:28197151 | p.S54F | 1 |
| chr13:28239962 | p.A73V,POLR1D | 1 |
| chr13:28239978 | p.R56C | 1 |
| chr13:28197186 | p.Y75C,POLR1D | 1 |
| chr13:28240009 | p.R79Q,POLR1D | 1 |
| chr13:28197203 | p.F67L | 1 |
| chr13:28240022 | p.R90L,POLR1D | 1 |
| chr13:28197278 | p.T73I | 1 |
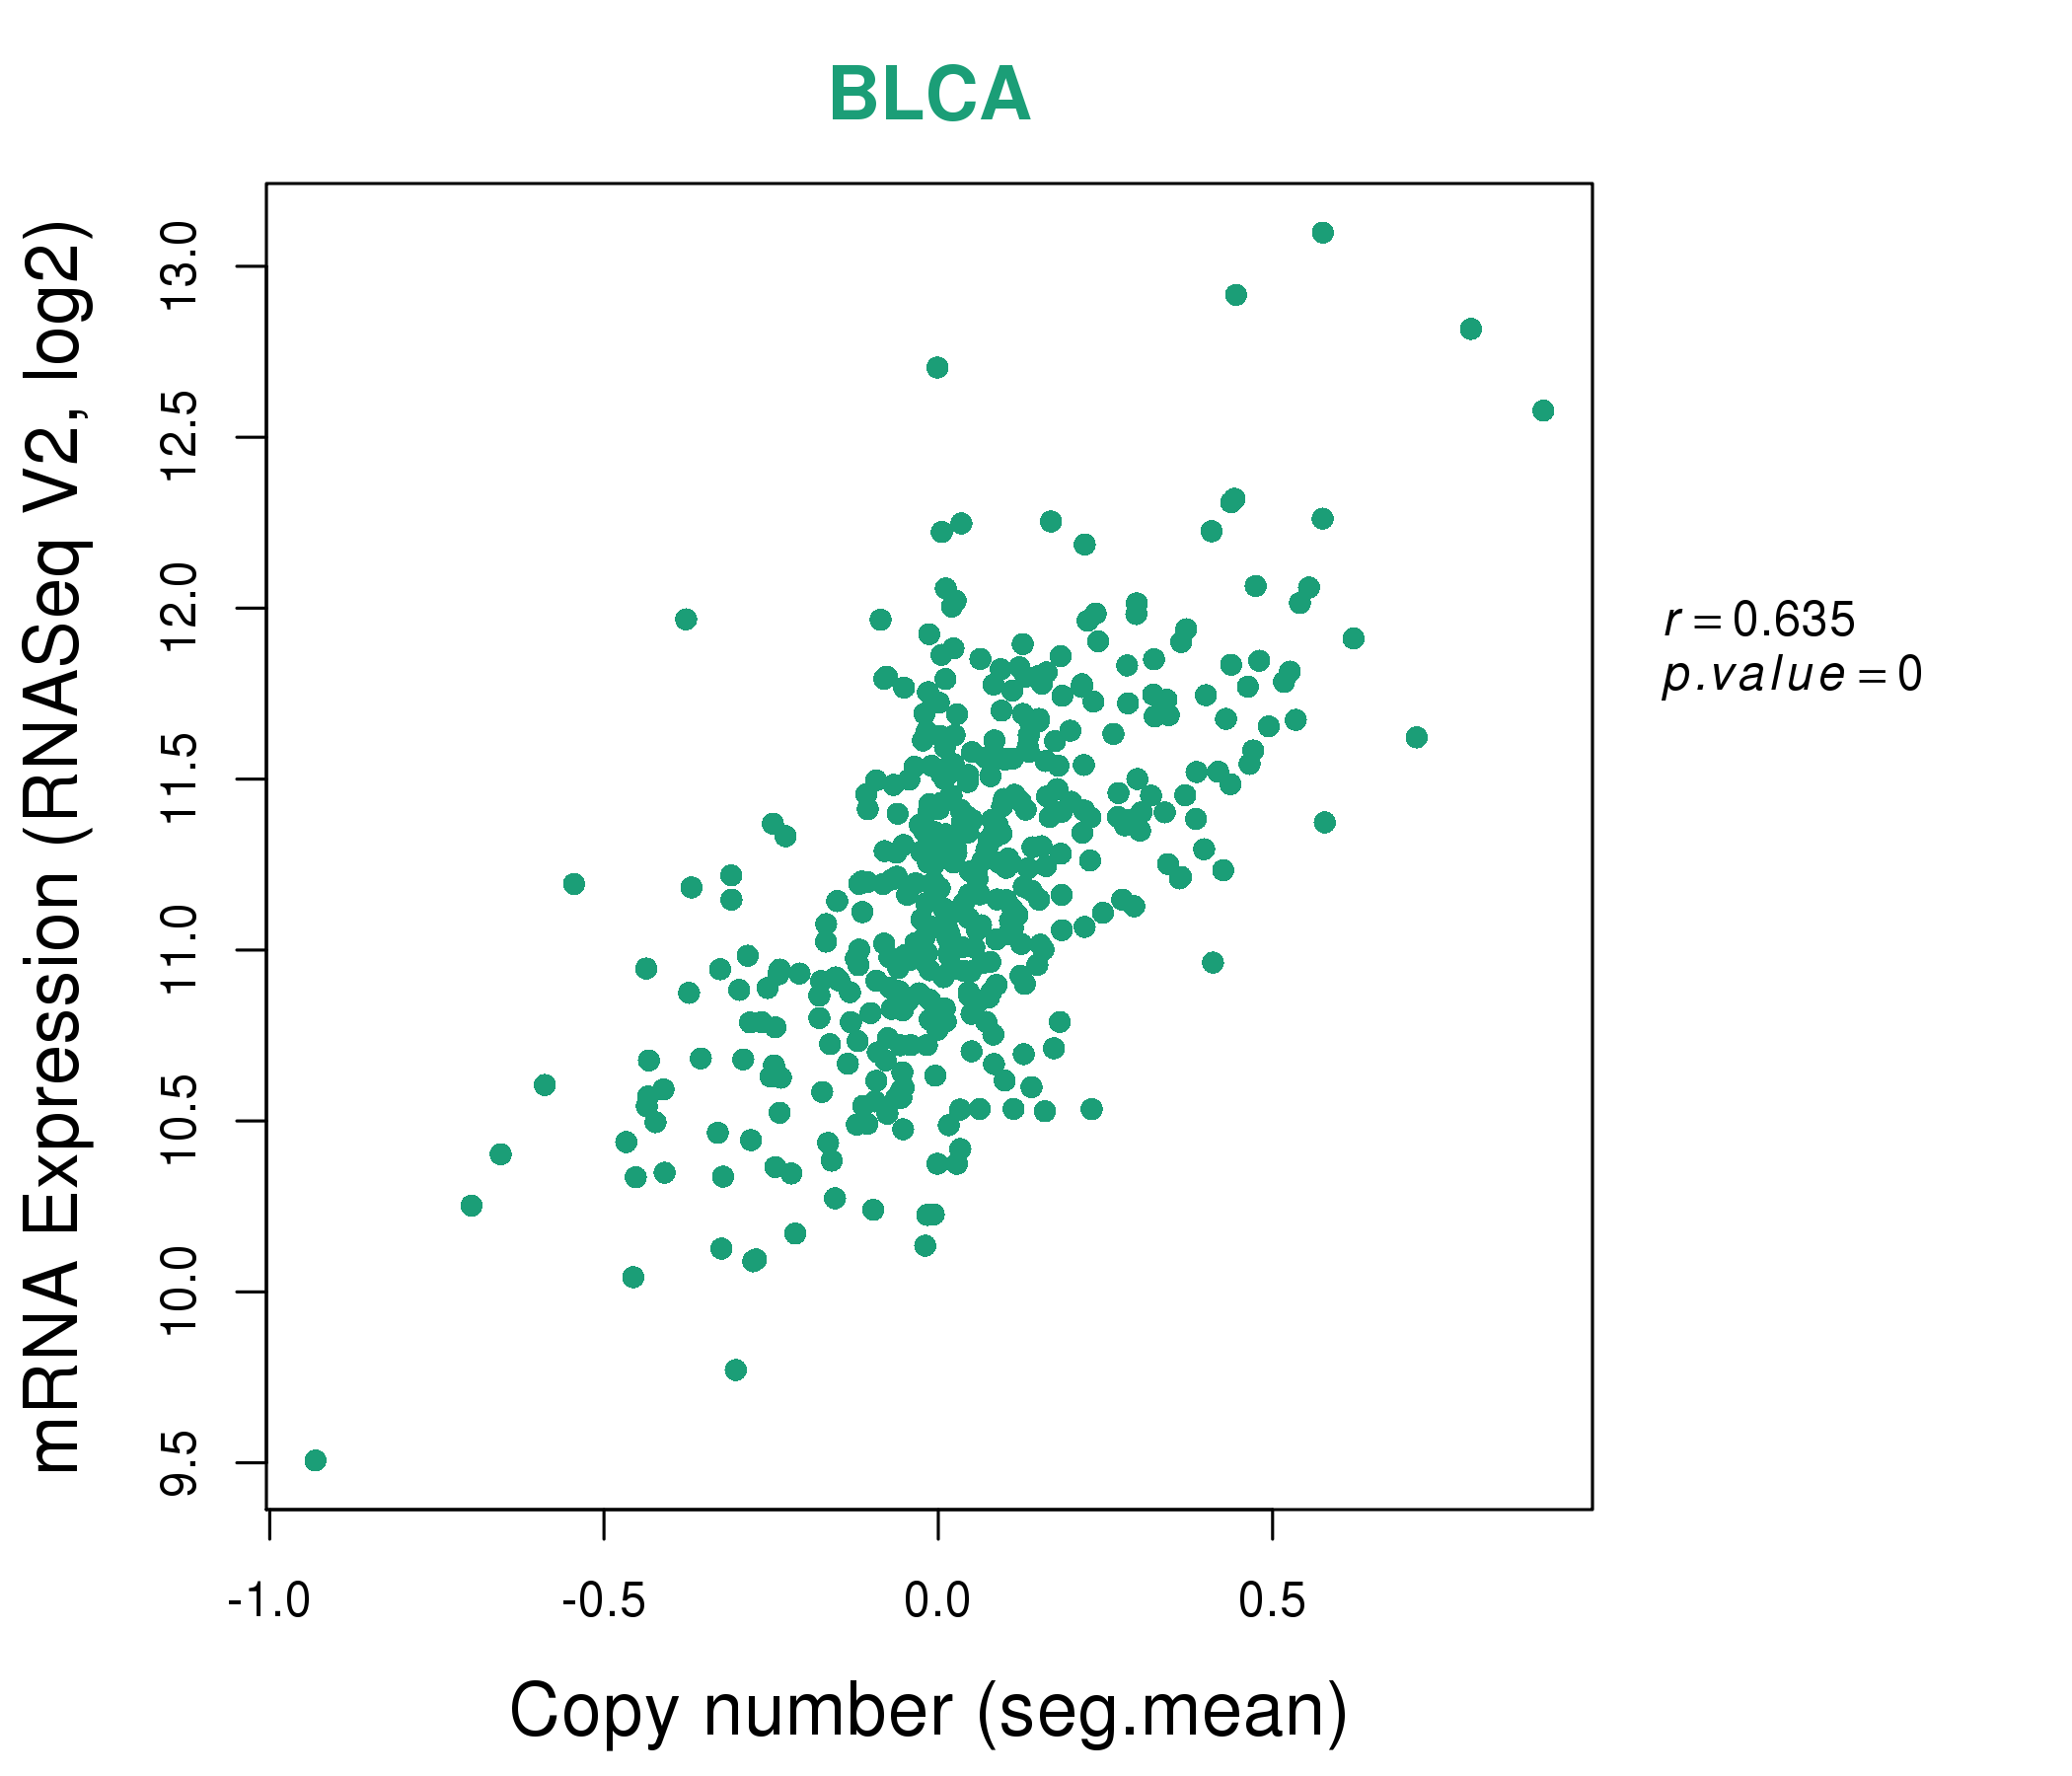
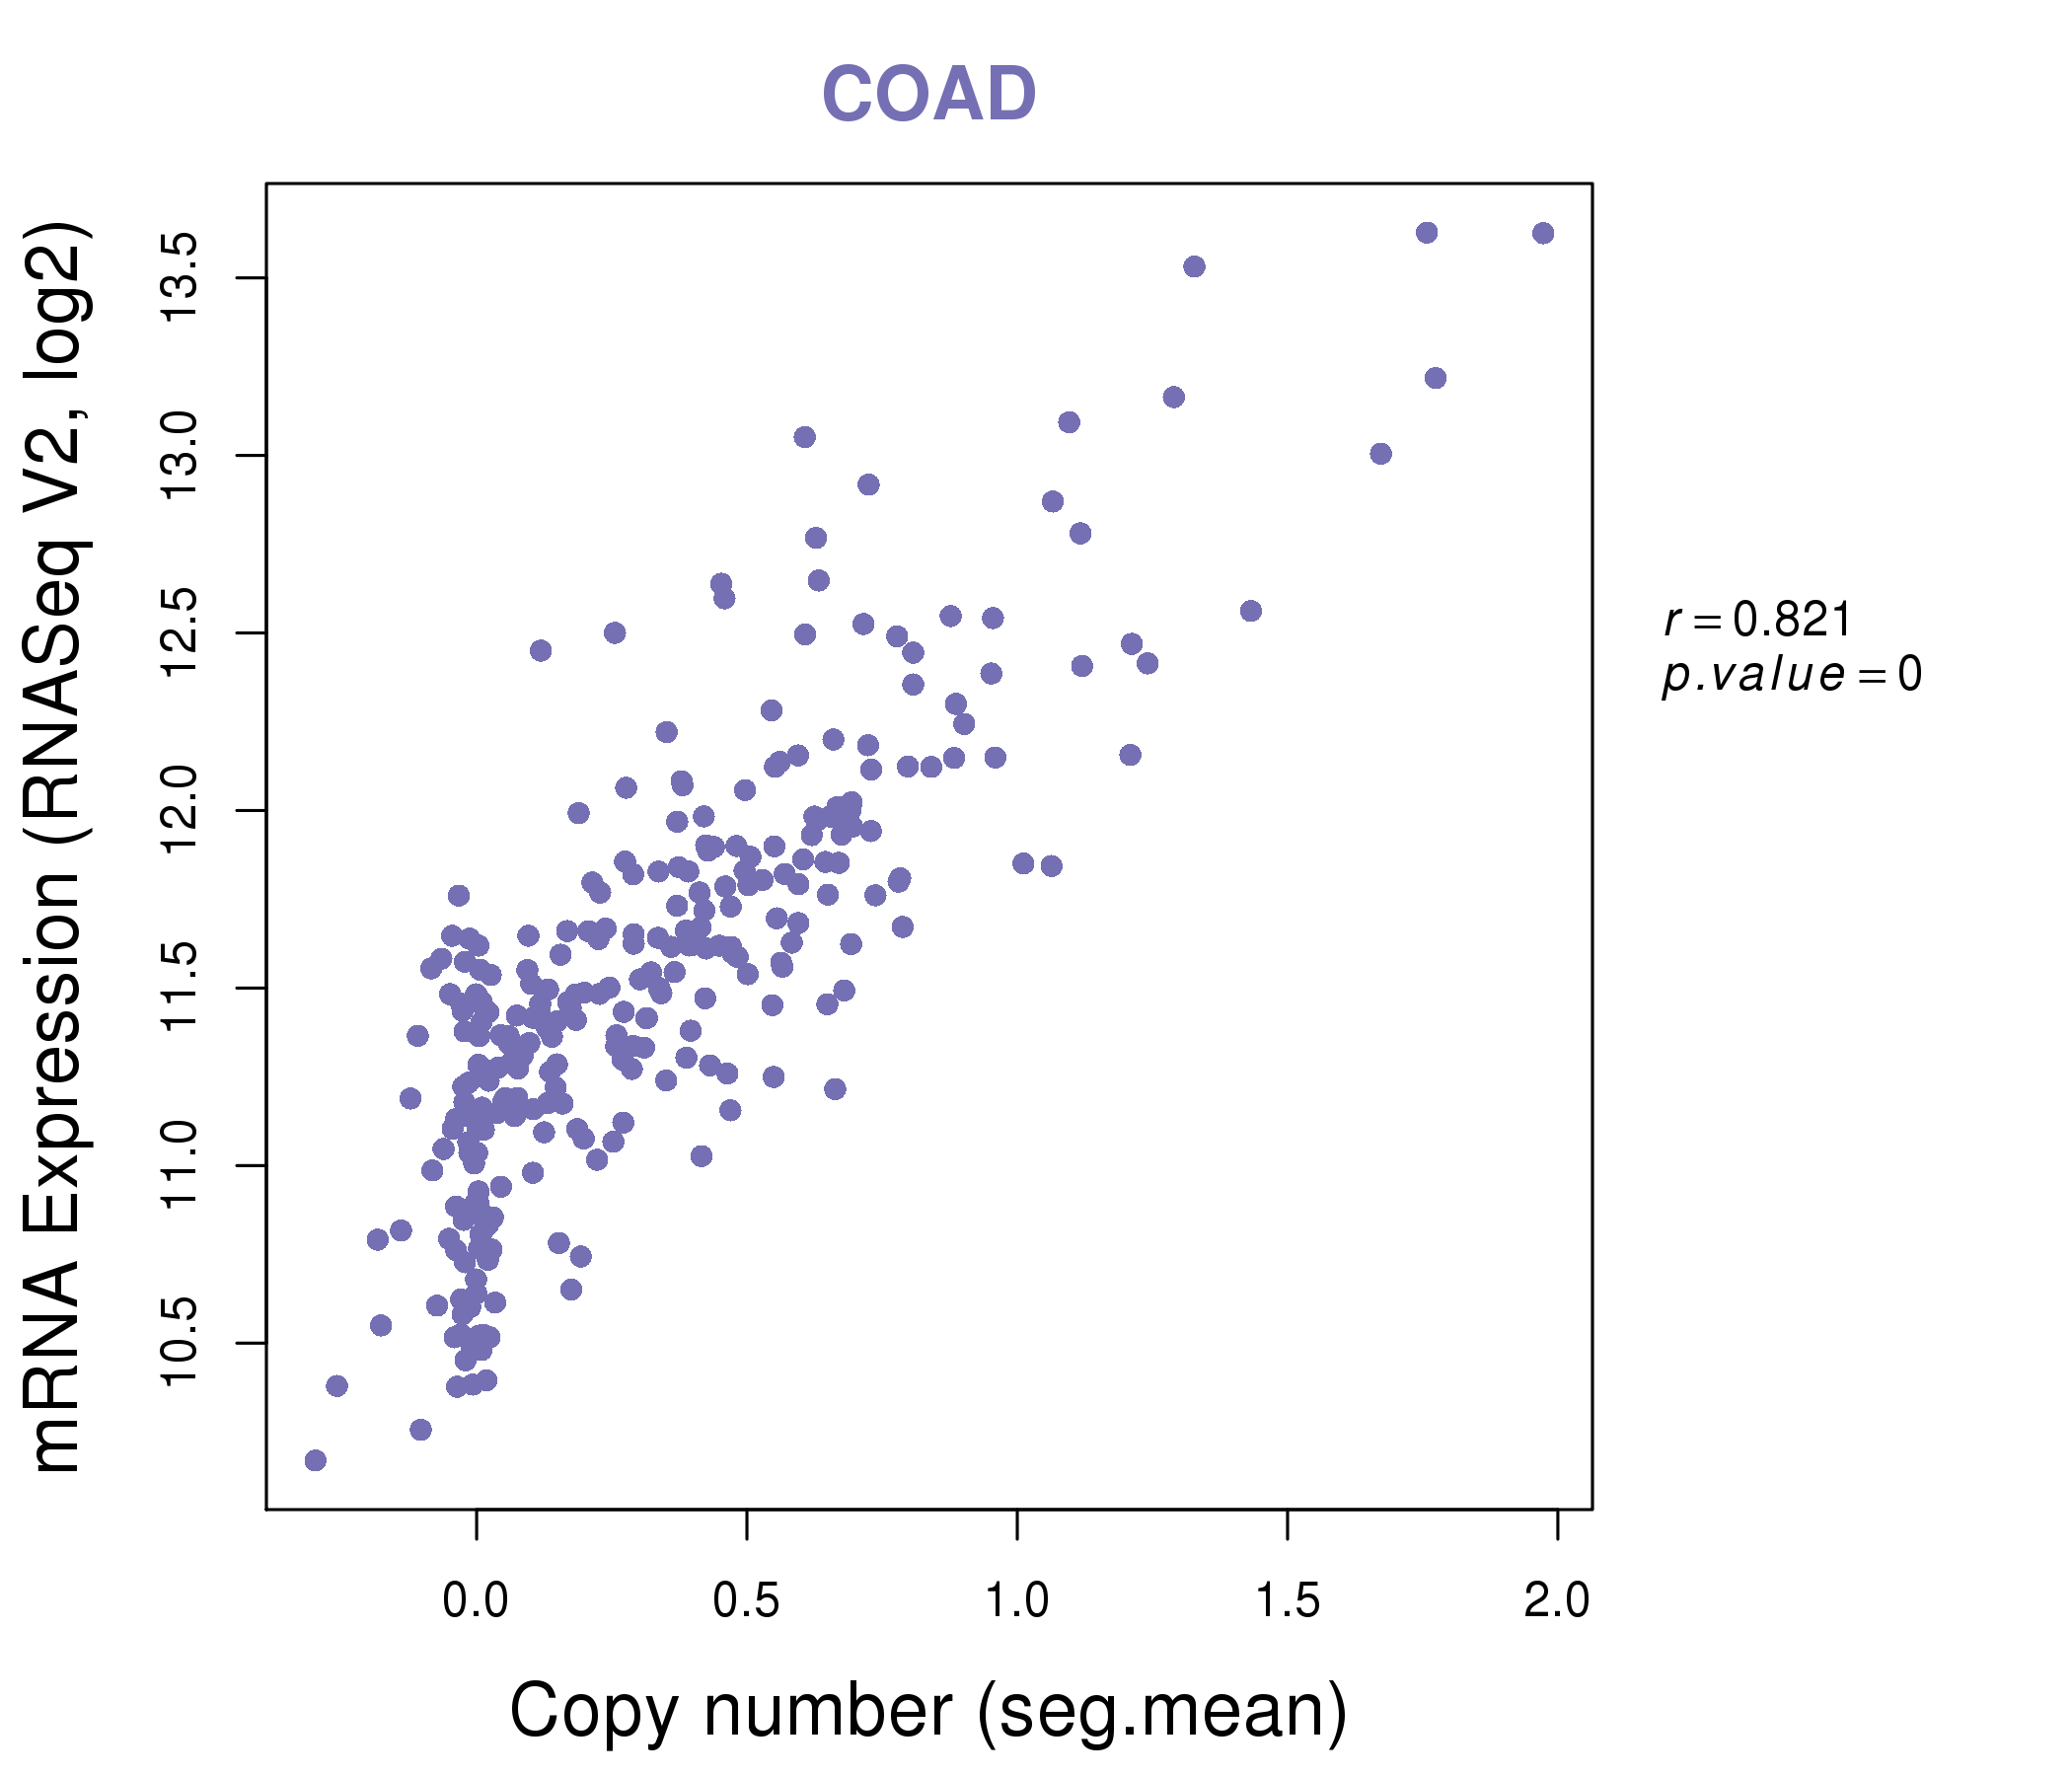
| * Copy number data were extracted from TCGA using R package TCGA-Assembler. The URLs of all public data files on TCGA DCC data server were gathered on Jan-05-2015. Function ProcessCNAData in TCGA-Assembler package was used to obtain gene-level copy number value which is calculated as the average copy number of the genomic region of a gene. |
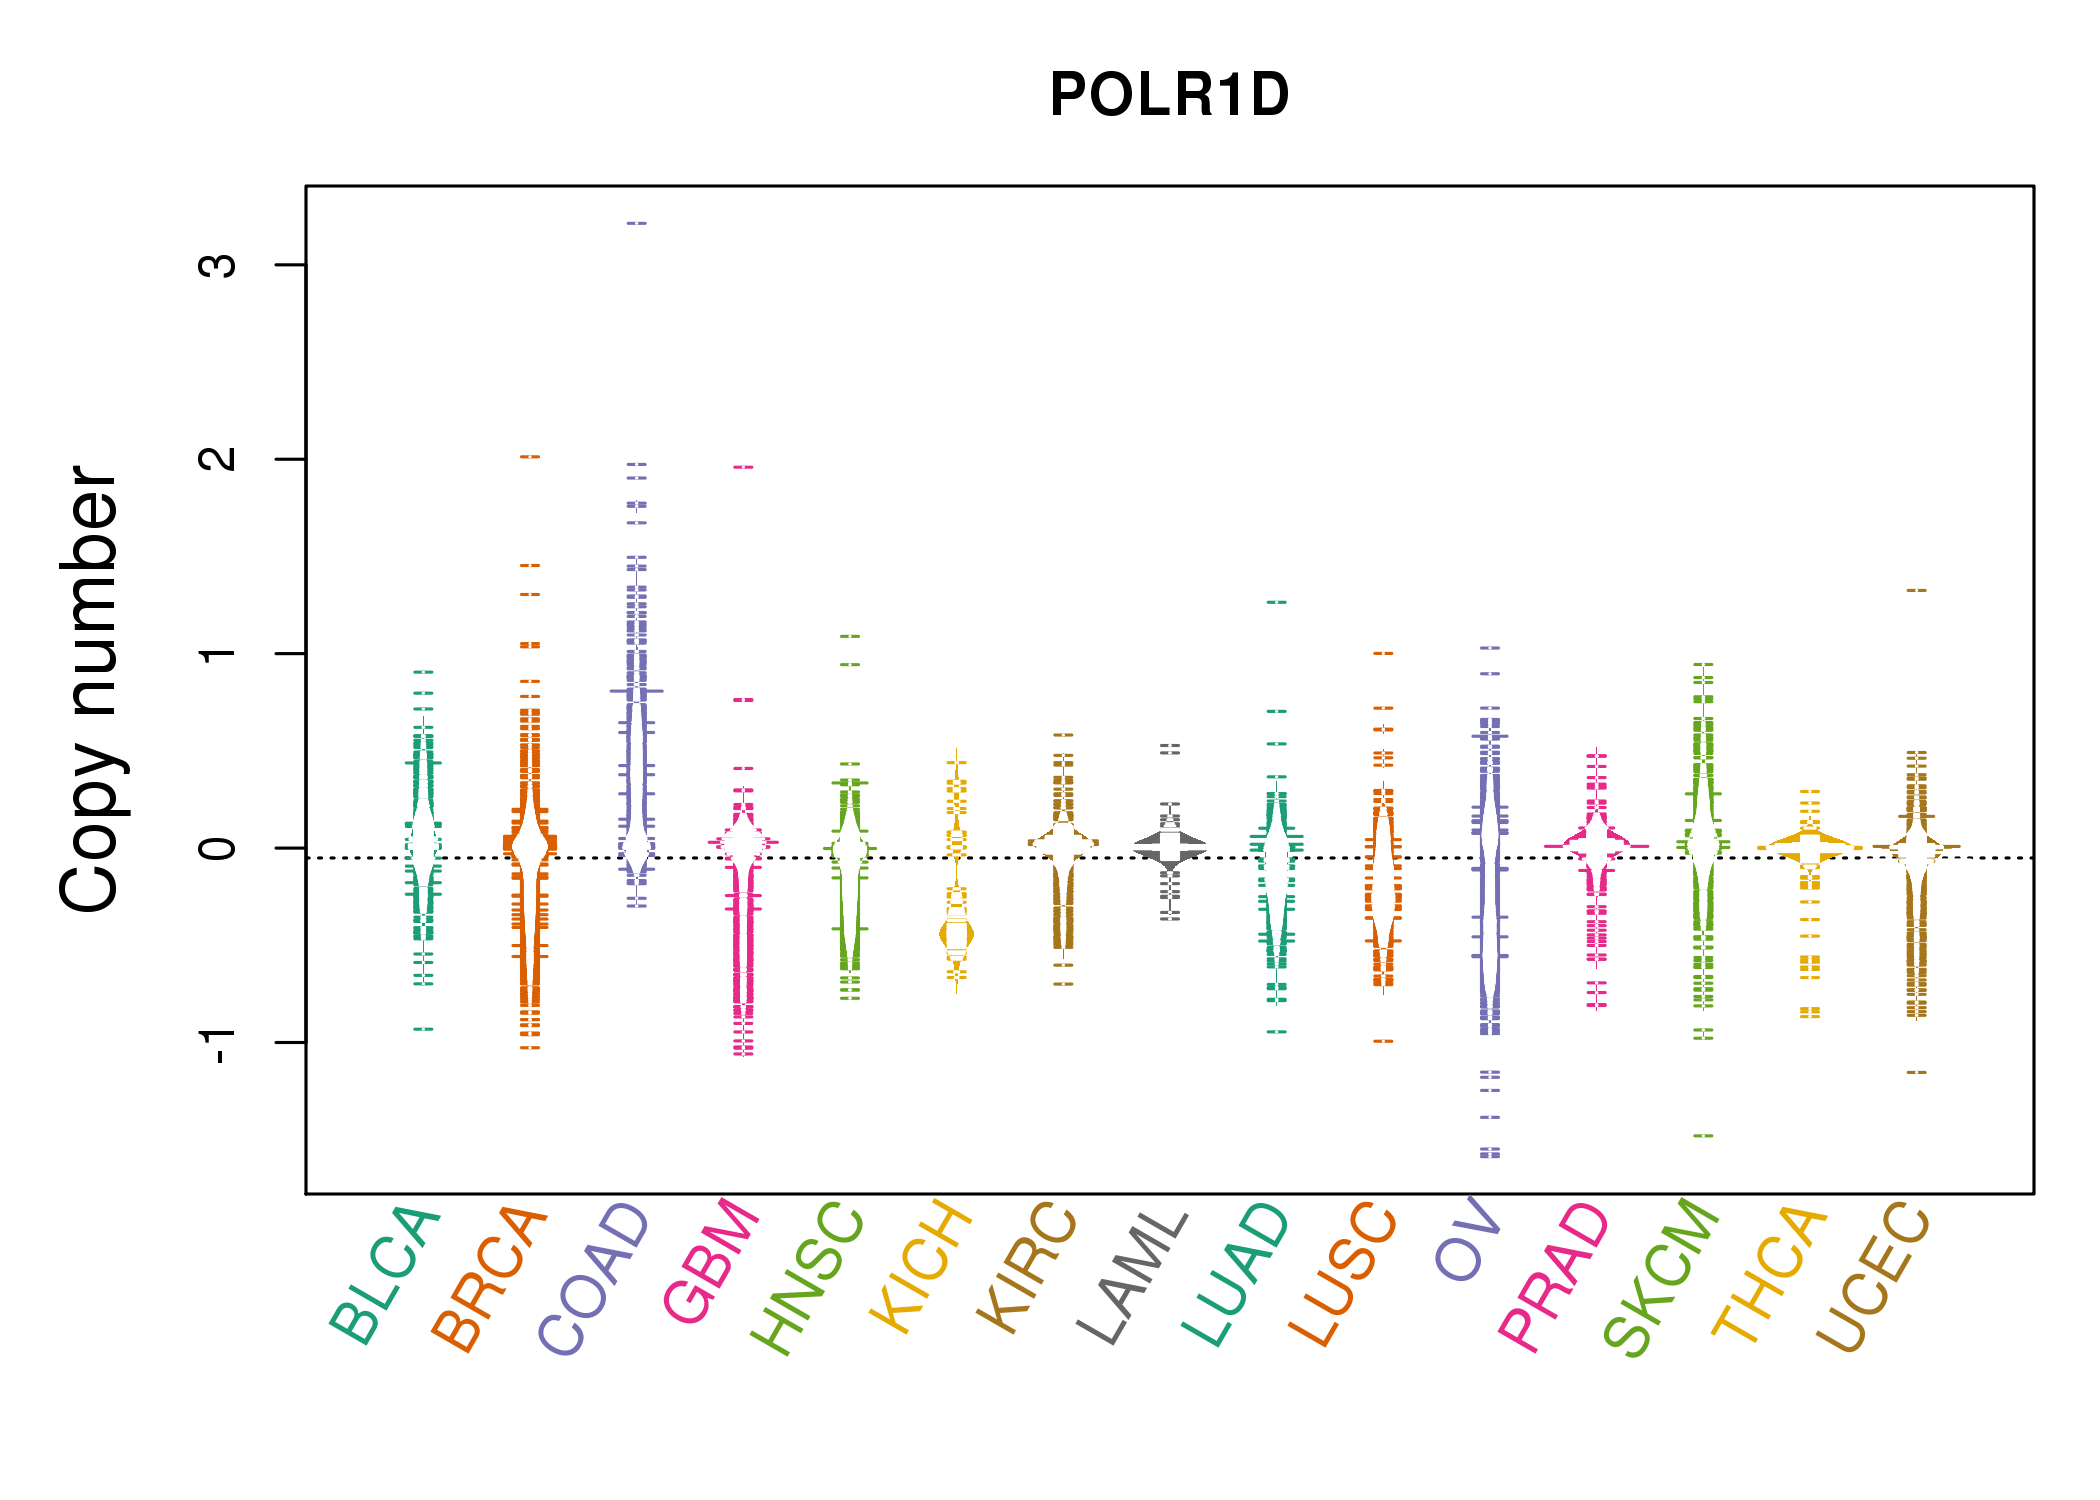 |
| cf) Tissue ID[Tissue type]: BLCA[Bladder Urothelial Carcinoma], BRCA[Breast invasive carcinoma], CESC[Cervical squamous cell carcinoma and endocervical adenocarcinoma], COAD[Colon adenocarcinoma], GBM[Glioblastoma multiforme], Glioma Low Grade, HNSC[Head and Neck squamous cell carcinoma], KICH[Kidney Chromophobe], KIRC[Kidney renal clear cell carcinoma], KIRP[Kidney renal papillary cell carcinoma], LAML[Acute Myeloid Leukemia], LUAD[Lung adenocarcinoma], LUSC[Lung squamous cell carcinoma], OV[Ovarian serous cystadenocarcinoma ], PAAD[Pancreatic adenocarcinoma], PRAD[Prostate adenocarcinoma], SKCM[Skin Cutaneous Melanoma], STAD[Stomach adenocarcinoma], THCA[Thyroid carcinoma], UCEC[Uterine Corpus Endometrial Carcinoma] |
| Top |
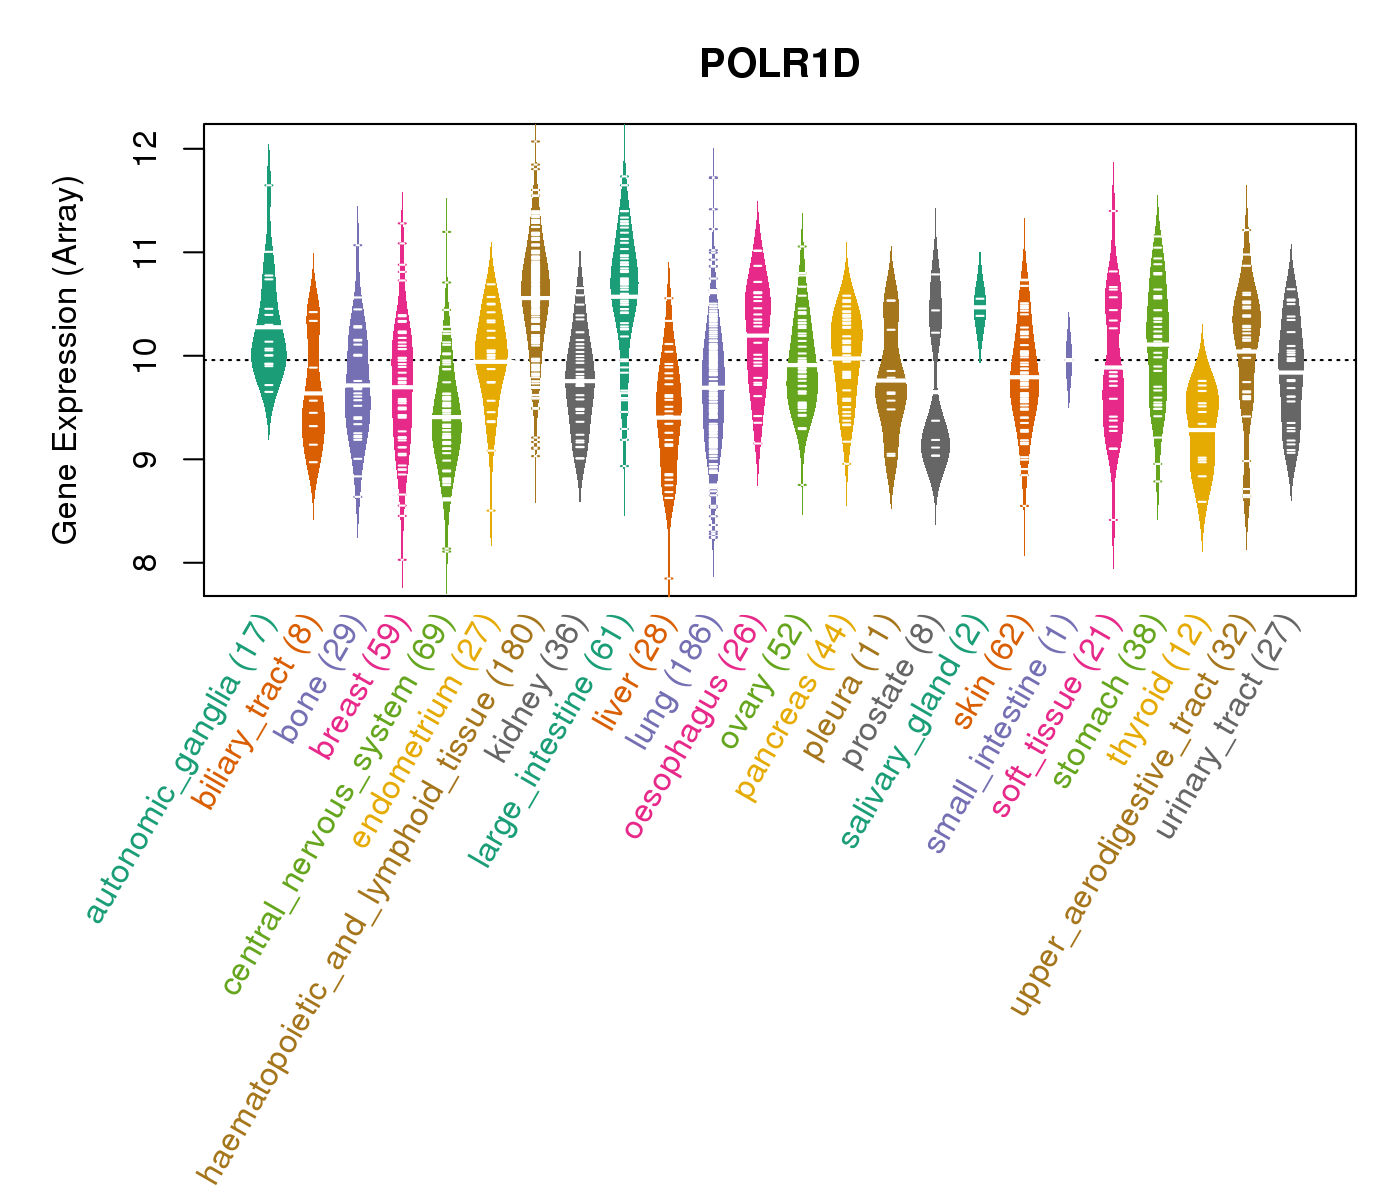
| Gene Expression for POLR1D |
| * CCLE gene expression data were extracted from CCLE_Expression_Entrez_2012-10-18.res: Gene-centric RMA-normalized mRNA expression data. |
 |
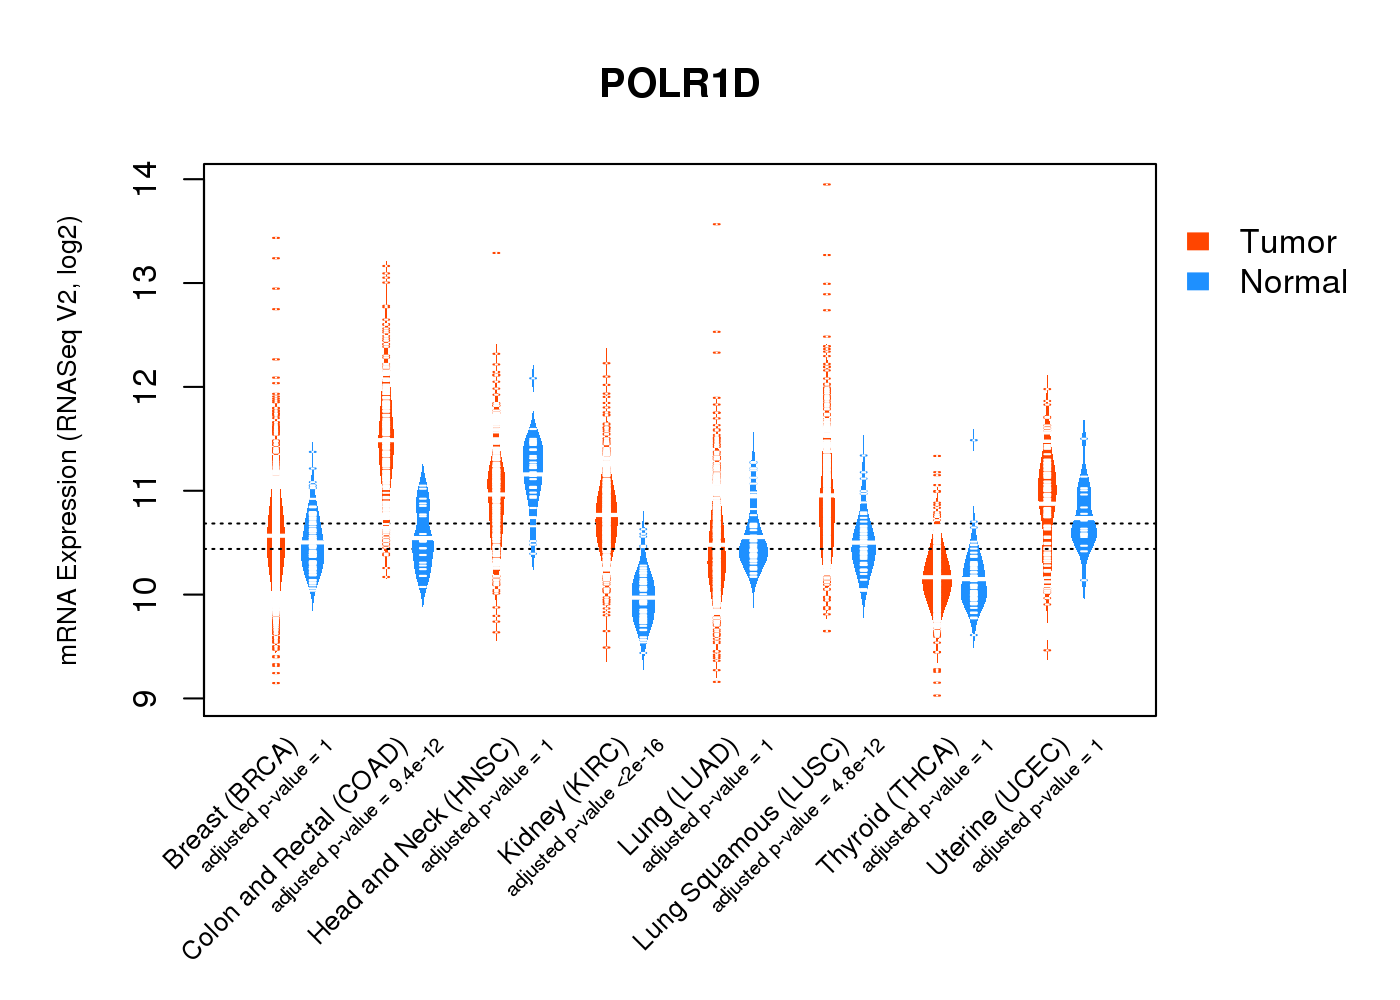
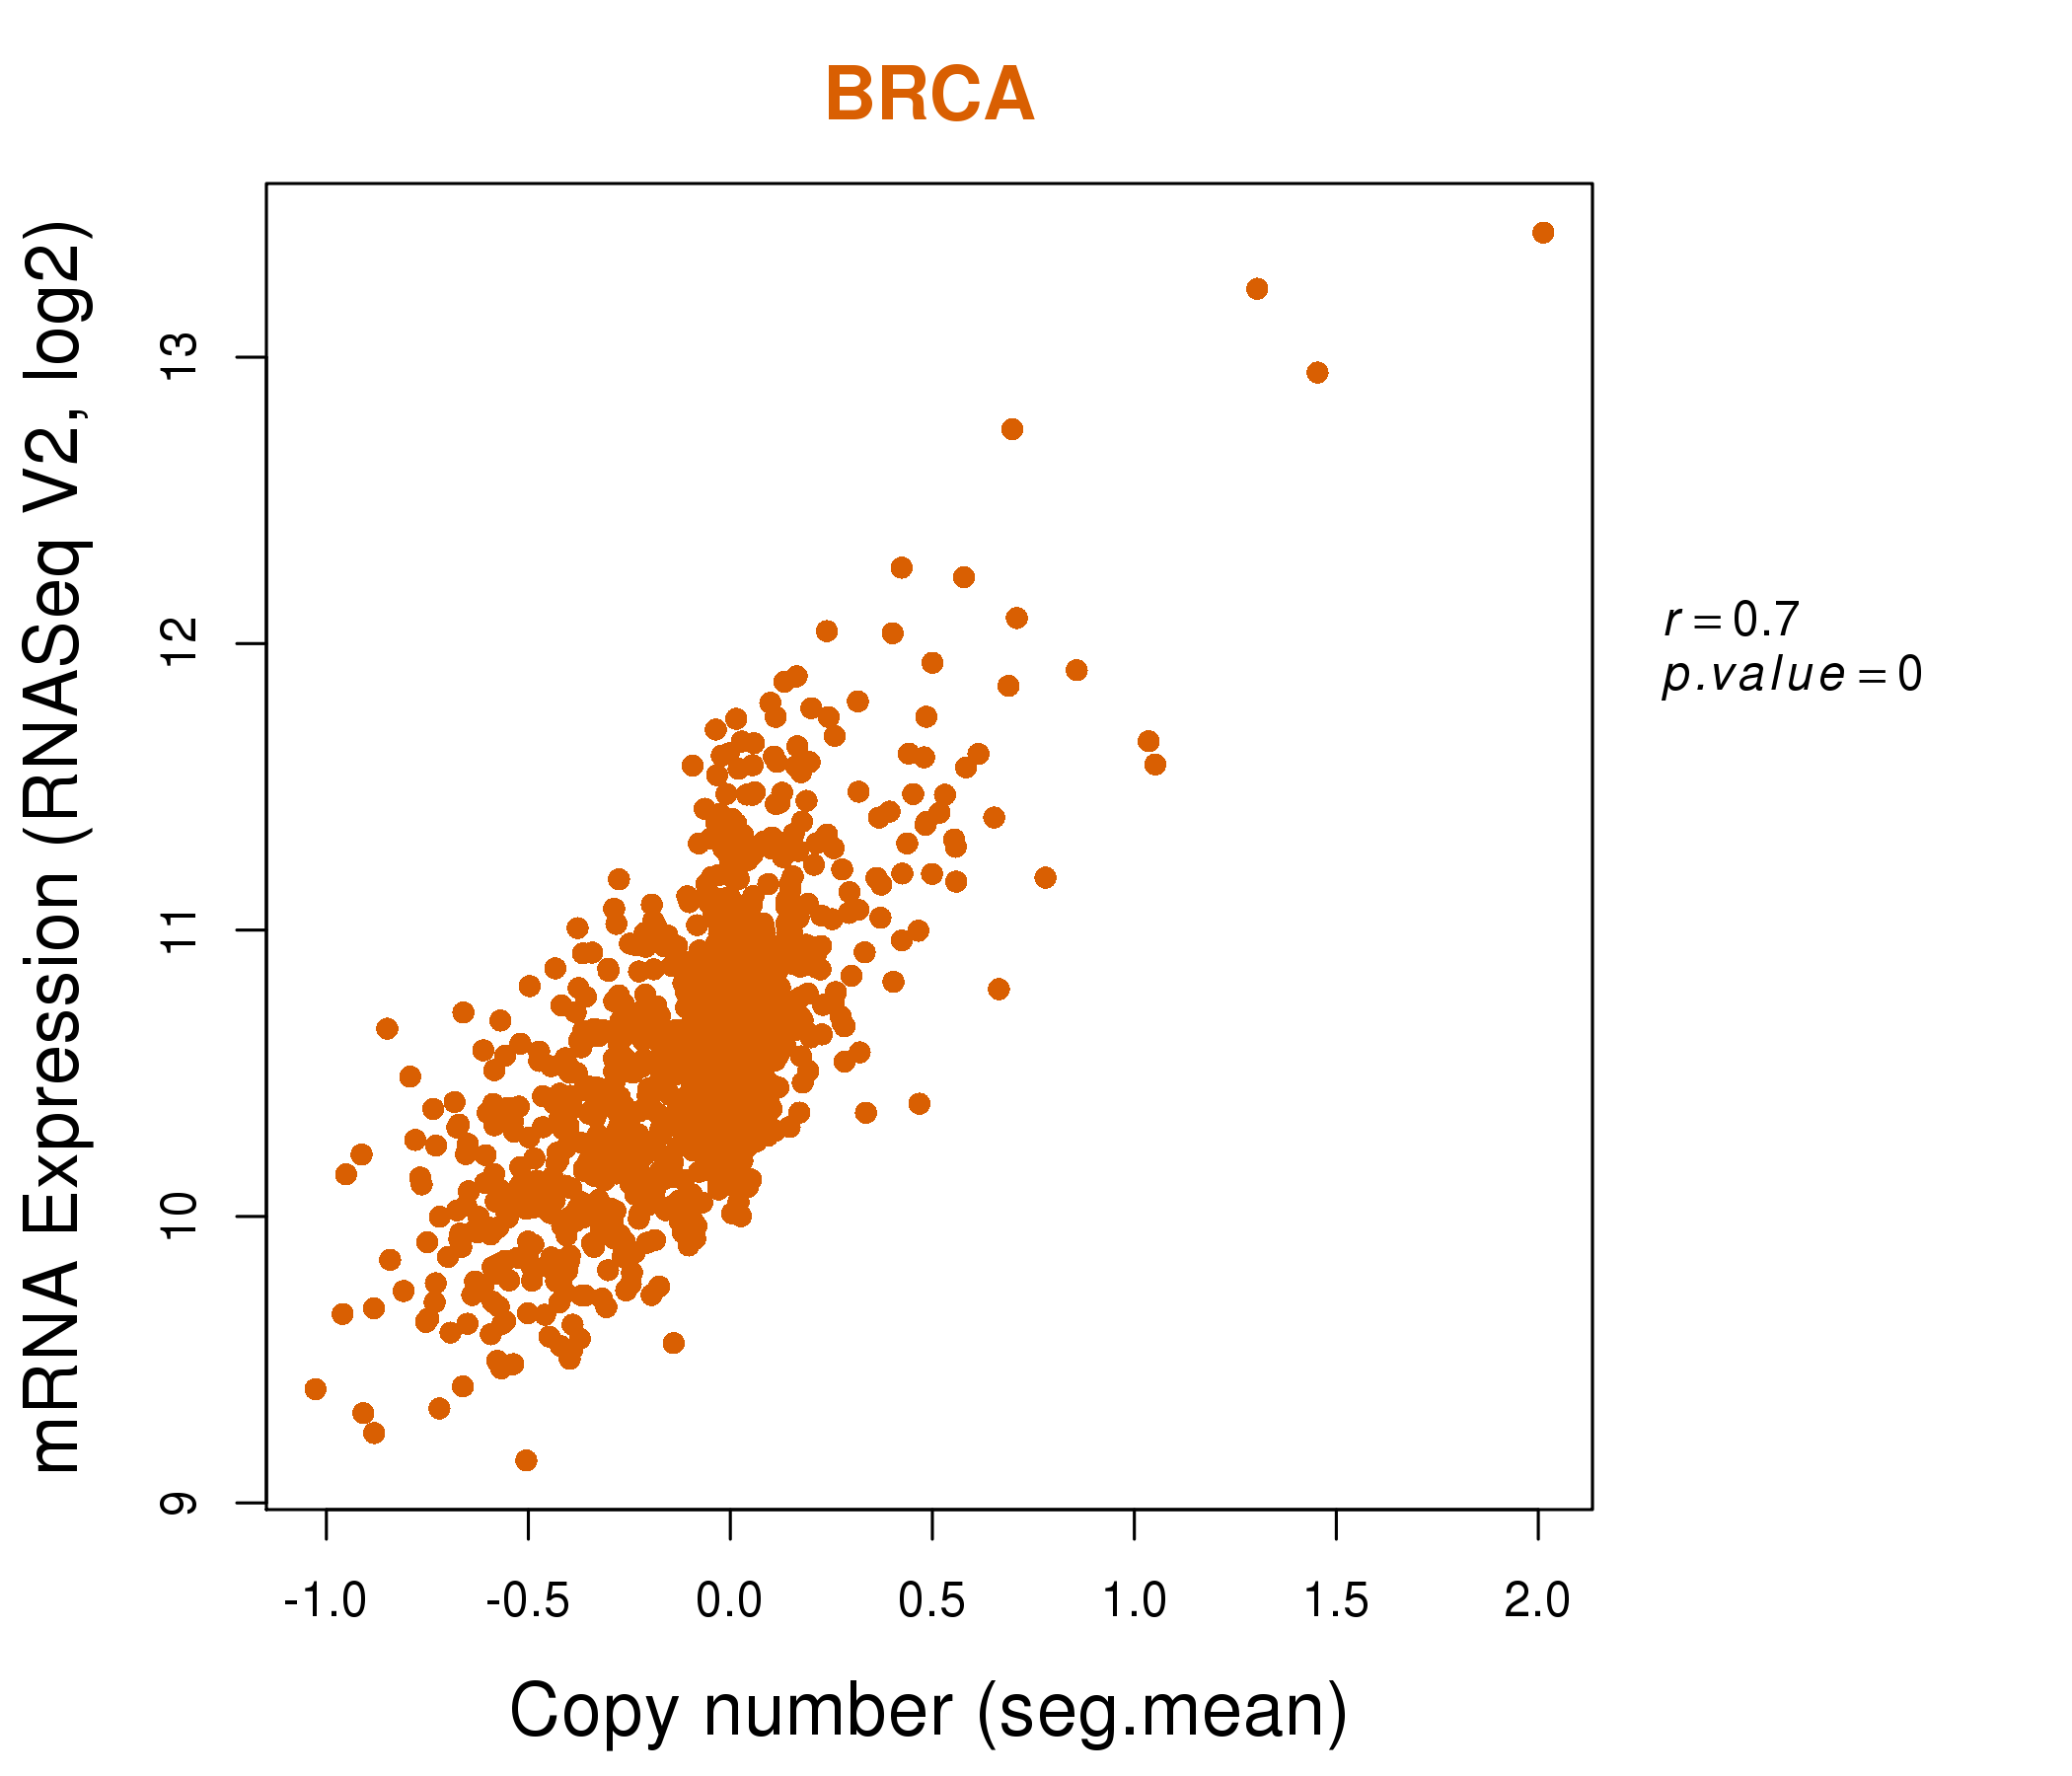
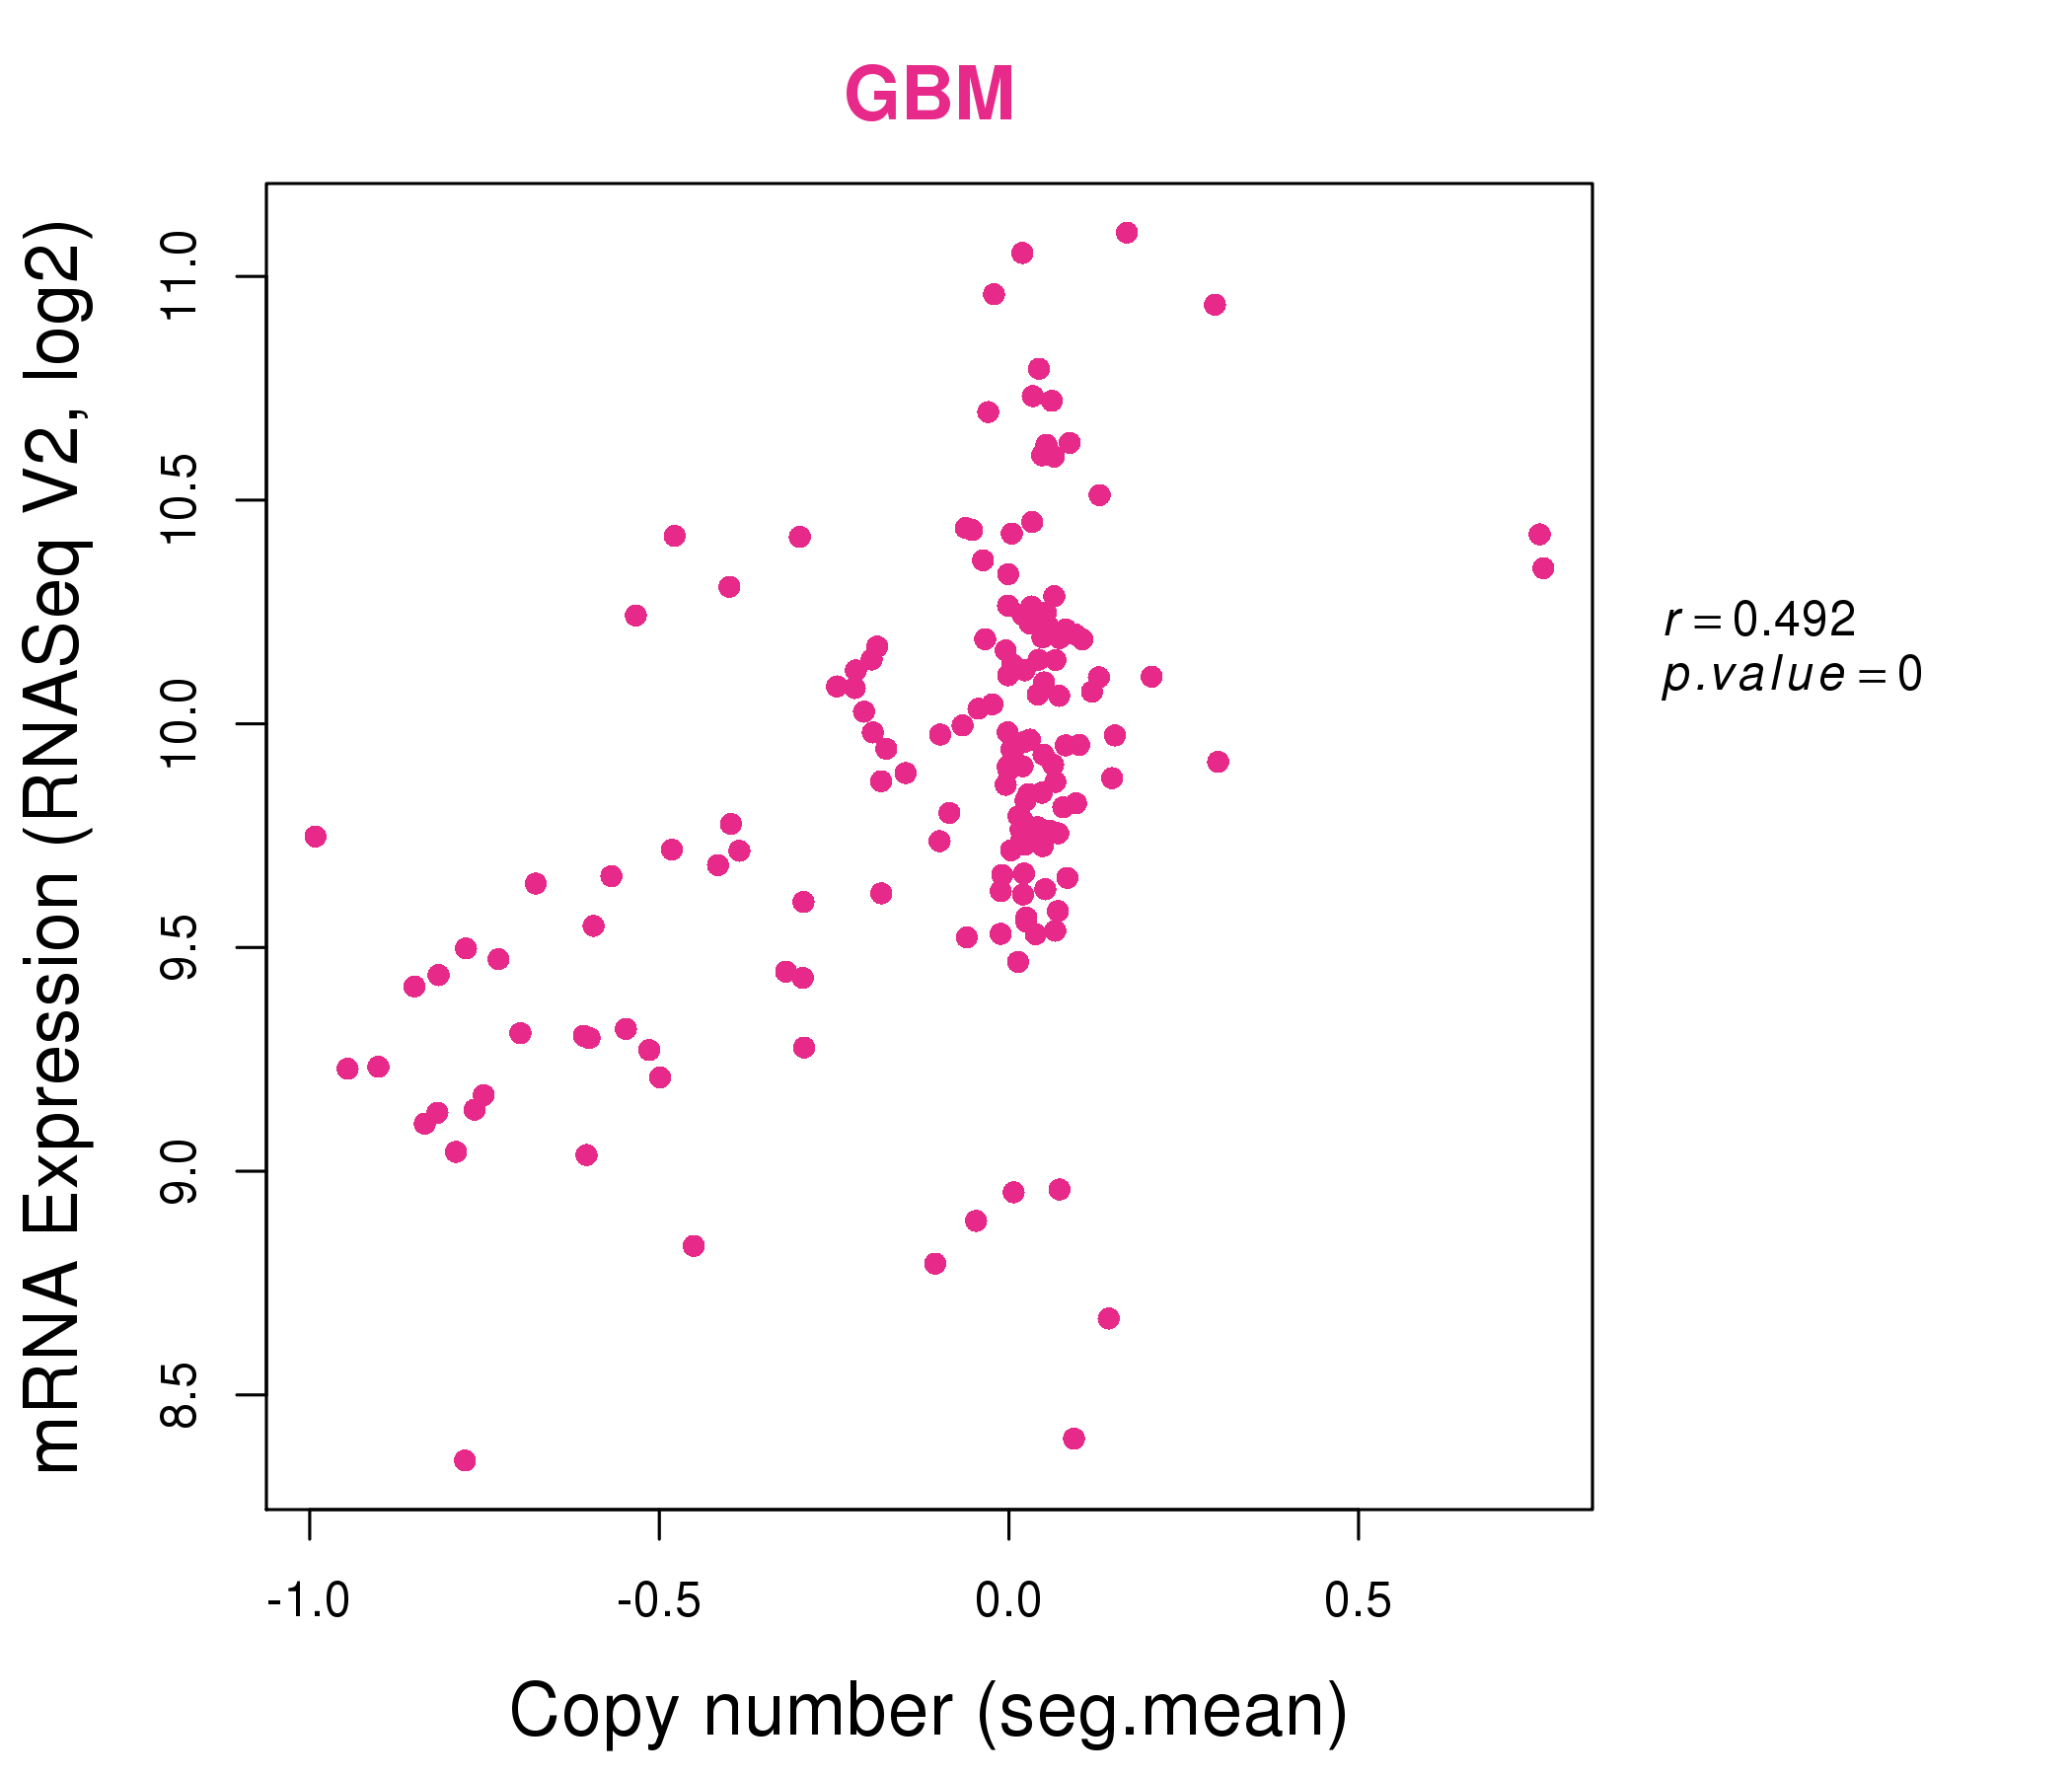
| * Normalized gene expression data of RNASeqV2 was extracted from TCGA using R package TCGA-Assembler. The URLs of all public data files on TCGA DCC data server were gathered at Jan-05-2015. Only eight cancer types have enough normal control samples for differential expression analysis. (t test, adjusted p<0.05 (using Benjamini-Hochberg FDR)) |
 |
| Top |
| * This plots show the correlation between CNV and gene expression. |
: Open all plots for all cancer types
 |
|
 |
|
| Top |
| Gene-Gene Network Information |
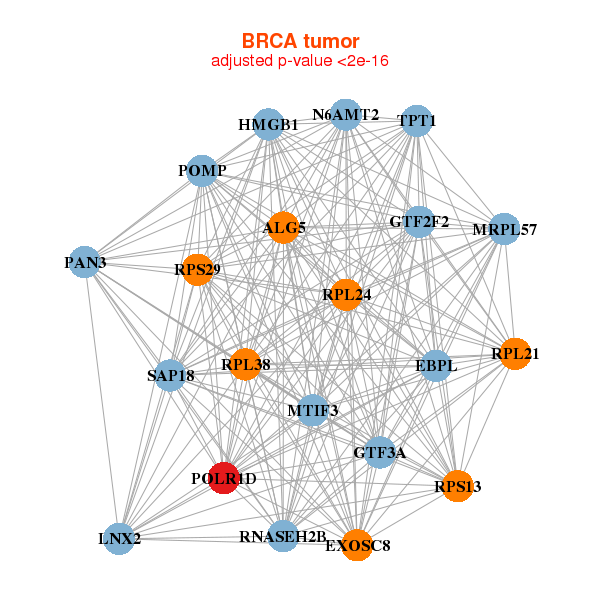
| * Co-Expression network figures were drawn using R package igraph. Only the top 20 genes with the highest correlations were shown. Red circle: input gene, orange circle: cell metabolism gene, sky circle: other gene |
: Open all plots for all cancer types
 |
|
| ALG5,EBPL,EXOSC8,GTF2F2,GTF3A,HMGB1,LNX2, MRPL57,MTIF3,N6AMT2,PAN3,POLR1D,POMP,RNASEH2B, RPL21,RPL24,RPL38,RPS13,RPS29,SAP18,TPT1 | C18orf21,EIF3H,EIF3M,HINT1,IGBP1,LINC00493,LRRC75A-AS1, PCBP2,POLR1D,RPL22,RPL30,RPL32,RPL35A,RPL38, RPL41,RPL6,RPS13,RPS15A,RPS23,RPS29,TIMM9 |
 |
|
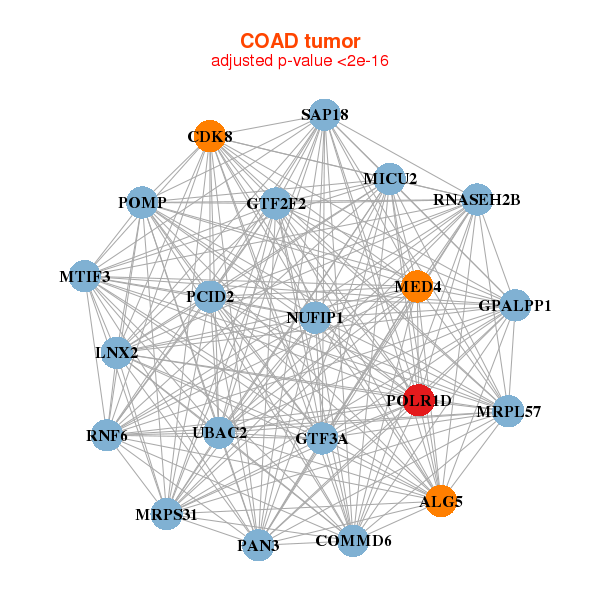
| ALG5,CDK8,COMMD6,MICU2,GTF2F2,GTF3A,GPALPP1, LNX2,MED4,MRPL57,MRPS31,MTIF3,NUFIP1,PAN3, PCID2,POLR1D,POMP,RNASEH2B,RNF6,SAP18,UBAC2 | BOLA1,C12orf10,APOPT1,DGCR6L,EEF1A1,ELP2,FAM175A, KBTBD3,KLHDC3,MRPL10,NACA,POLR1D,PPIE,R3HCC1, RBMX2,RPL15,THAP11,THYN1,VPS72,ZDHHC4,ZMAT5 |
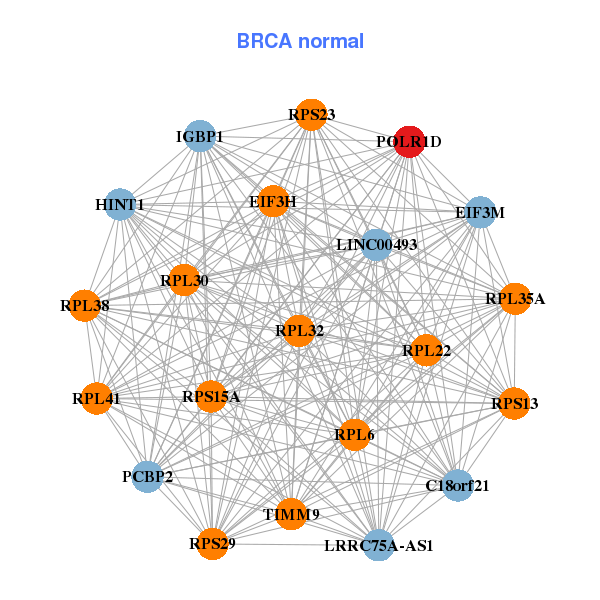
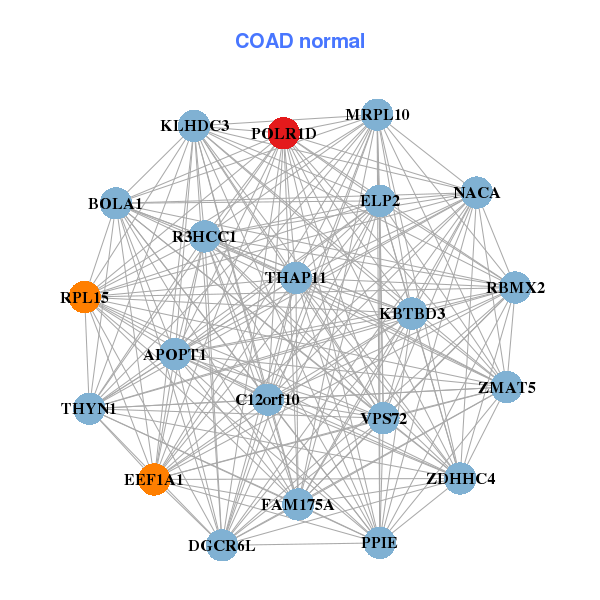
| * Co-Expression network figures were drawn using R package igraph. Only the top 20 genes with the highest correlations were shown. Red circle: input gene, orange circle: cell metabolism gene, sky circle: other gene |
: Open all plots for all cancer types
| Top |
: Open all interacting genes' information including KEGG pathway for all interacting genes from DAVID
| Top |
| Pharmacological Information for POLR1D |
| There's no related Drug. |
| Top |
| Cross referenced IDs for POLR1D |
| * We obtained these cross-references from Uniprot database. It covers 150 different DBs, 18 categories. http://www.uniprot.org/help/cross_references_section |
: Open all cross reference information
|
Copyright © 2016-Present - The Univsersity of Texas Health Science Center at Houston @ |