|
||||||||||||||||||||
| |
| Phenotypic Information (metabolism pathway, cancer, disease, phenome) |
| |
| |
| Gene-Gene Network Information: Co-Expression Network, Interacting Genes & KEGG |
| |
|


| Gene Summary for RPL26L1 |
| Top |
| Phenotypic Information for RPL26L1(metabolism pathway, cancer, disease, phenome) |
| Cancer | CGAP: RPL26L1 |
| Familial Cancer Database: RPL26L1 | |
| * This gene is included in those cancer gene databases. |
|
|
|
|
|
| . | ||||||||||||||
Oncogene 1 | Significant driver gene in | |||||||||||||||||||
| cf) number; DB name 1 Oncogene; http://nar.oxfordjournals.org/content/35/suppl_1/D721.long, 2 Tumor Suppressor gene; https://bioinfo.uth.edu/TSGene/, 3 Cancer Gene Census; http://www.nature.com/nrc/journal/v4/n3/abs/nrc1299.html, 4 CancerGenes; http://nar.oxfordjournals.org/content/35/suppl_1/D721.long, 5 Network of Cancer Gene; http://ncg.kcl.ac.uk/index.php, 1Therapeutic Vulnerabilities in Cancer; http://cbio.mskcc.org/cancergenomics/statius/ |
| REACTOME_METABOLISM_OF_PROTEINS REACTOME_METABOLISM_OF_MRNA REACTOME_METABOLISM_OF_RNA | |
| Mutations for RPL26L1 |
| * Under tables are showing count per each tissue to give us broad intuition about tissue specific mutation patterns.You can go to the detailed page for each mutation database's web site. |
| There's no structural variation information in COSMIC data for this gene. |
| * From mRNA Sanger sequences, Chitars2.0 arranged chimeric transcripts. This table shows RPL26L1 related fusion information. |
| ID | Head Gene | Tail Gene | Accession | Gene_a | qStart_a | qEnd_a | Chromosome_a | tStart_a | tEnd_a | Gene_a | qStart_a | qEnd_a | Chromosome_a | tStart_a | tEnd_a |
| Top |
| There's no copy number variation information in COSMIC data for this gene. |
| Top |
|
 |
| Top |
| Stat. for Non-Synonymous SNVs (# total SNVs=13) | (# total SNVs=1) |
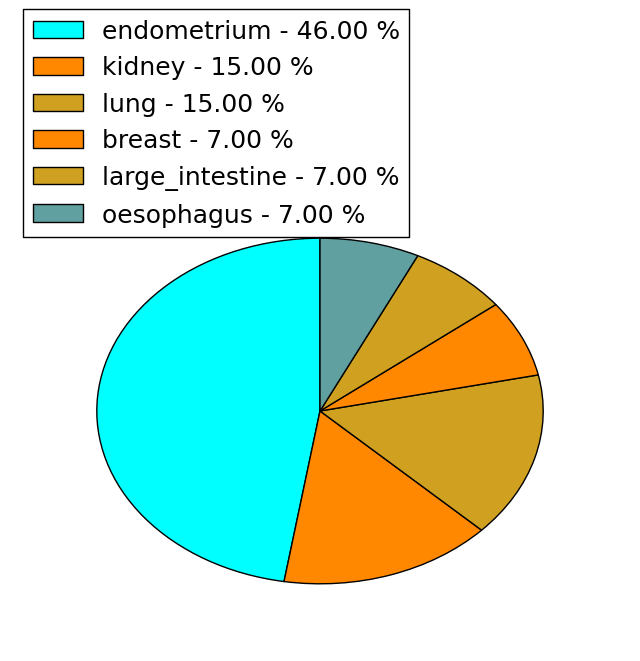 | 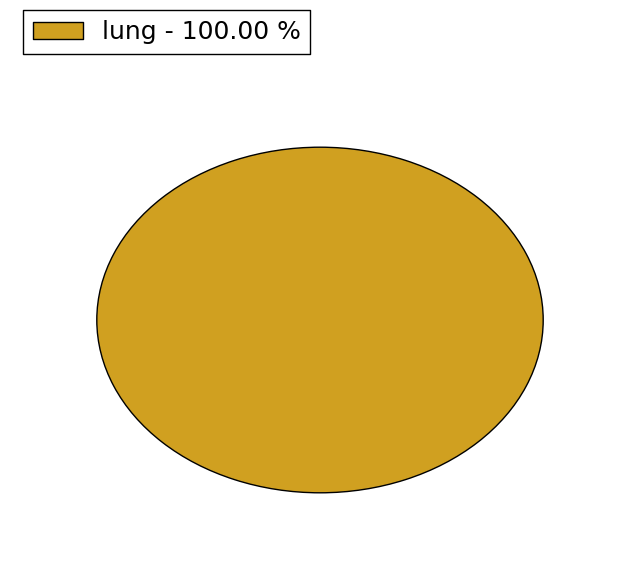 |
(# total SNVs=0) | (# total SNVs=0) |
| Top |
| * When you move the cursor on each content, you can see more deailed mutation information on the Tooltip. Those are primary_site,primary_histology,mutation(aa),pubmedID. |
| GRCh37 position | Mutation(aa) | Unique sampleID count |
| chr5:172396461-172396461 | p.L119I | 3 |
| chr5:172395553-172395553 | p.R87L | 2 |
| chr5:172386886-172386886 | p.N4D | 2 |
| chr5:172395521-172395521 | p.K76N | 2 |
| chr5:172386879-172386879 | p.M1I | 1 |
| chr5:172395579-172395579 | p.H96N | 1 |
| chr5:172386880-172386880 | p.K2Q | 1 |
| chr5:172396424-172396424 | p.I106I | 1 |
| chr5:172386933-172386933 | p.F19F | 1 |
| chr5:172396492-172396492 | p.G129A | 1 |
| Top |
|
 |
| Point Mutation/ Tissue ID | 1 | 2 | 3 | 4 | 5 | 6 | 7 | 8 | 9 | 10 | 11 | 12 | 13 | 14 | 15 | 16 | 17 | 18 | 19 | 20 |
| # sample | 3 | 1 | 1 | 1 | 2 | 3 | 4 | 5 | ||||||||||||
| # mutation | 3 | 1 | 1 | 1 | 2 | 3 | 4 | 4 | ||||||||||||
| nonsynonymous SNV | 1 | 1 | 1 | 1 | 1 | 2 | 4 | 4 | ||||||||||||
| synonymous SNV | 2 | 1 | 1 |
| cf) Tissue ID; Tissue type (1; BLCA[Bladder Urothelial Carcinoma], 2; BRCA[Breast invasive carcinoma], 3; CESC[Cervical squamous cell carcinoma and endocervical adenocarcinoma], 4; COAD[Colon adenocarcinoma], 5; GBM[Glioblastoma multiforme], 6; Glioma Low Grade, 7; HNSC[Head and Neck squamous cell carcinoma], 8; KICH[Kidney Chromophobe], 9; KIRC[Kidney renal clear cell carcinoma], 10; KIRP[Kidney renal papillary cell carcinoma], 11; LAML[Acute Myeloid Leukemia], 12; LUAD[Lung adenocarcinoma], 13; LUSC[Lung squamous cell carcinoma], 14; OV[Ovarian serous cystadenocarcinoma ], 15; PAAD[Pancreatic adenocarcinoma], 16; PRAD[Prostate adenocarcinoma], 17; SKCM[Skin Cutaneous Melanoma], 18:STAD[Stomach adenocarcinoma], 19:THCA[Thyroid carcinoma], 20:UCEC[Uterine Corpus Endometrial Carcinoma]) |
| Top |
| * We represented just top 10 SNVs. When you move the cursor on each content, you can see more deailed mutation information on the Tooltip. Those are primary_site, primary_histology, mutation(aa), pubmedID. |
| Genomic Position | Mutation(aa) | Unique sampleID count |
| chr5:172396461 | p.L119I | 3 |
| chr5:172395530 | p.E83K | 1 |
| chr5:172386879 | p.R87H | 1 |
| chr5:172395540 | p.I106I | 1 |
| chr5:172386880 | p.G129A | 1 |
| chr5:172395553 | p.E141K | 1 |
| chr5:172386933 | p.M1I | 1 |
| chr5:172396424 | p.E145K | 1 |
| chr5:172386963 | p.K2Q | 1 |
| chr5:172386967 | p.F19F | 1 |
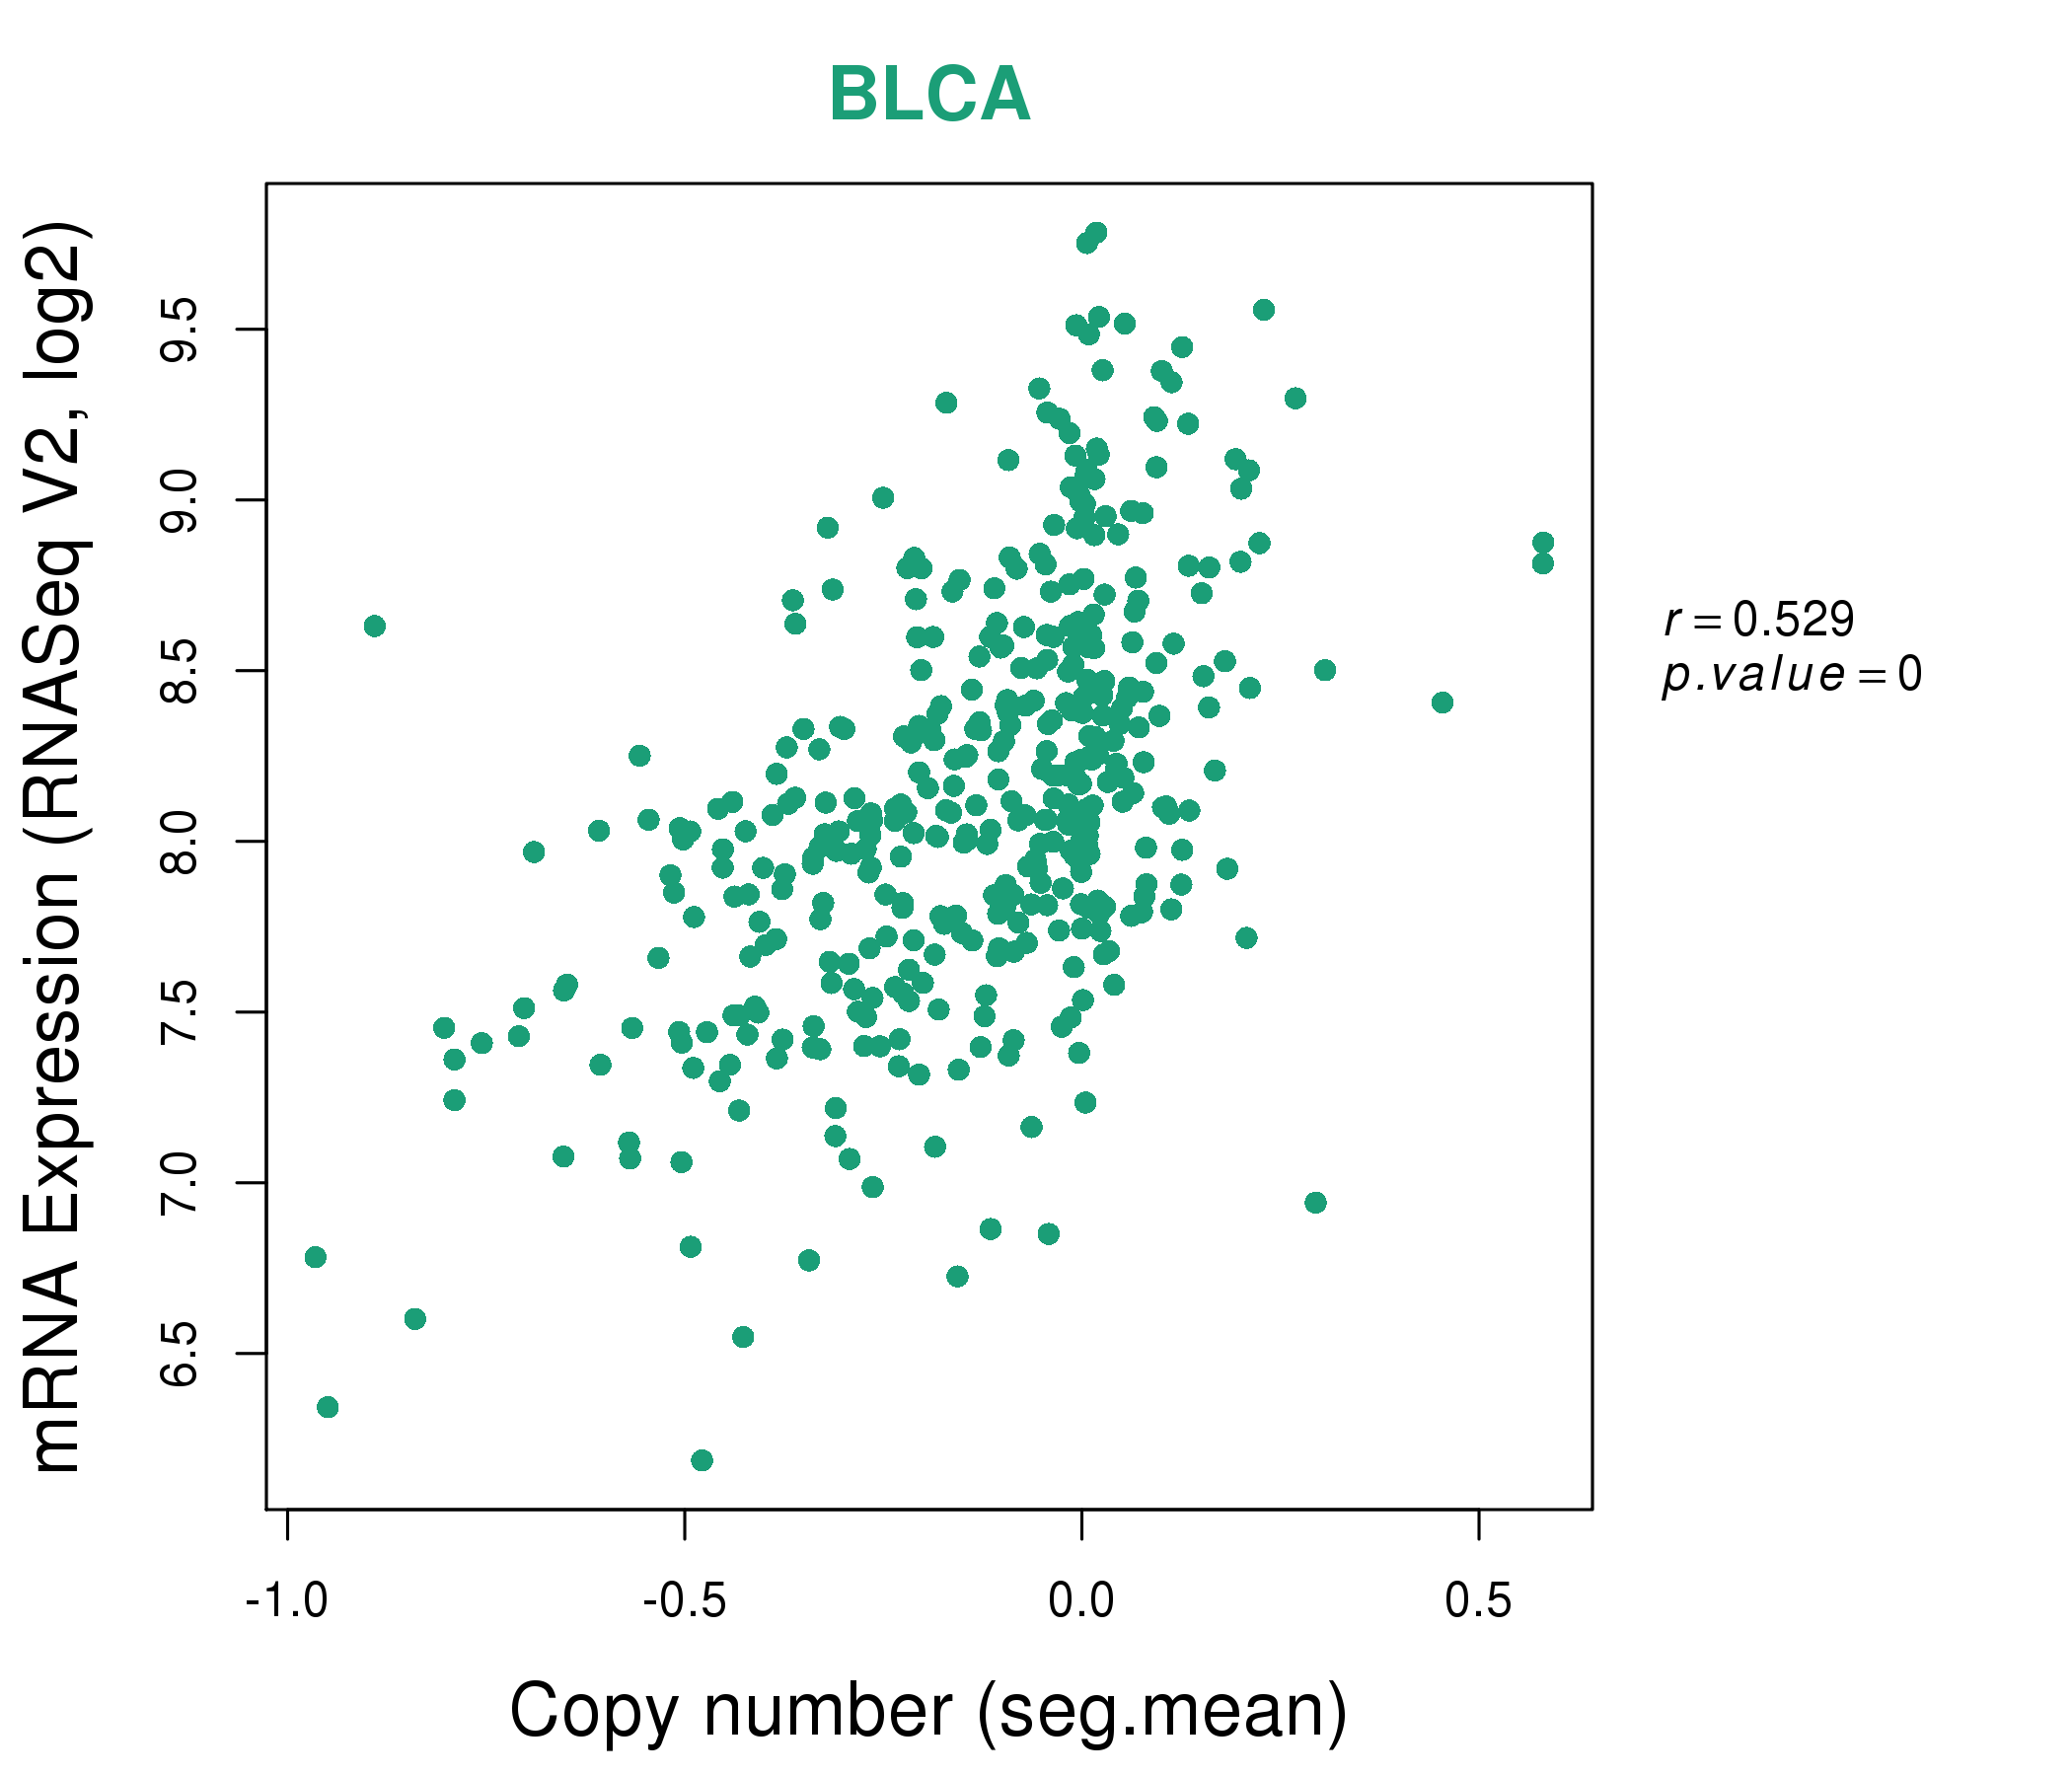
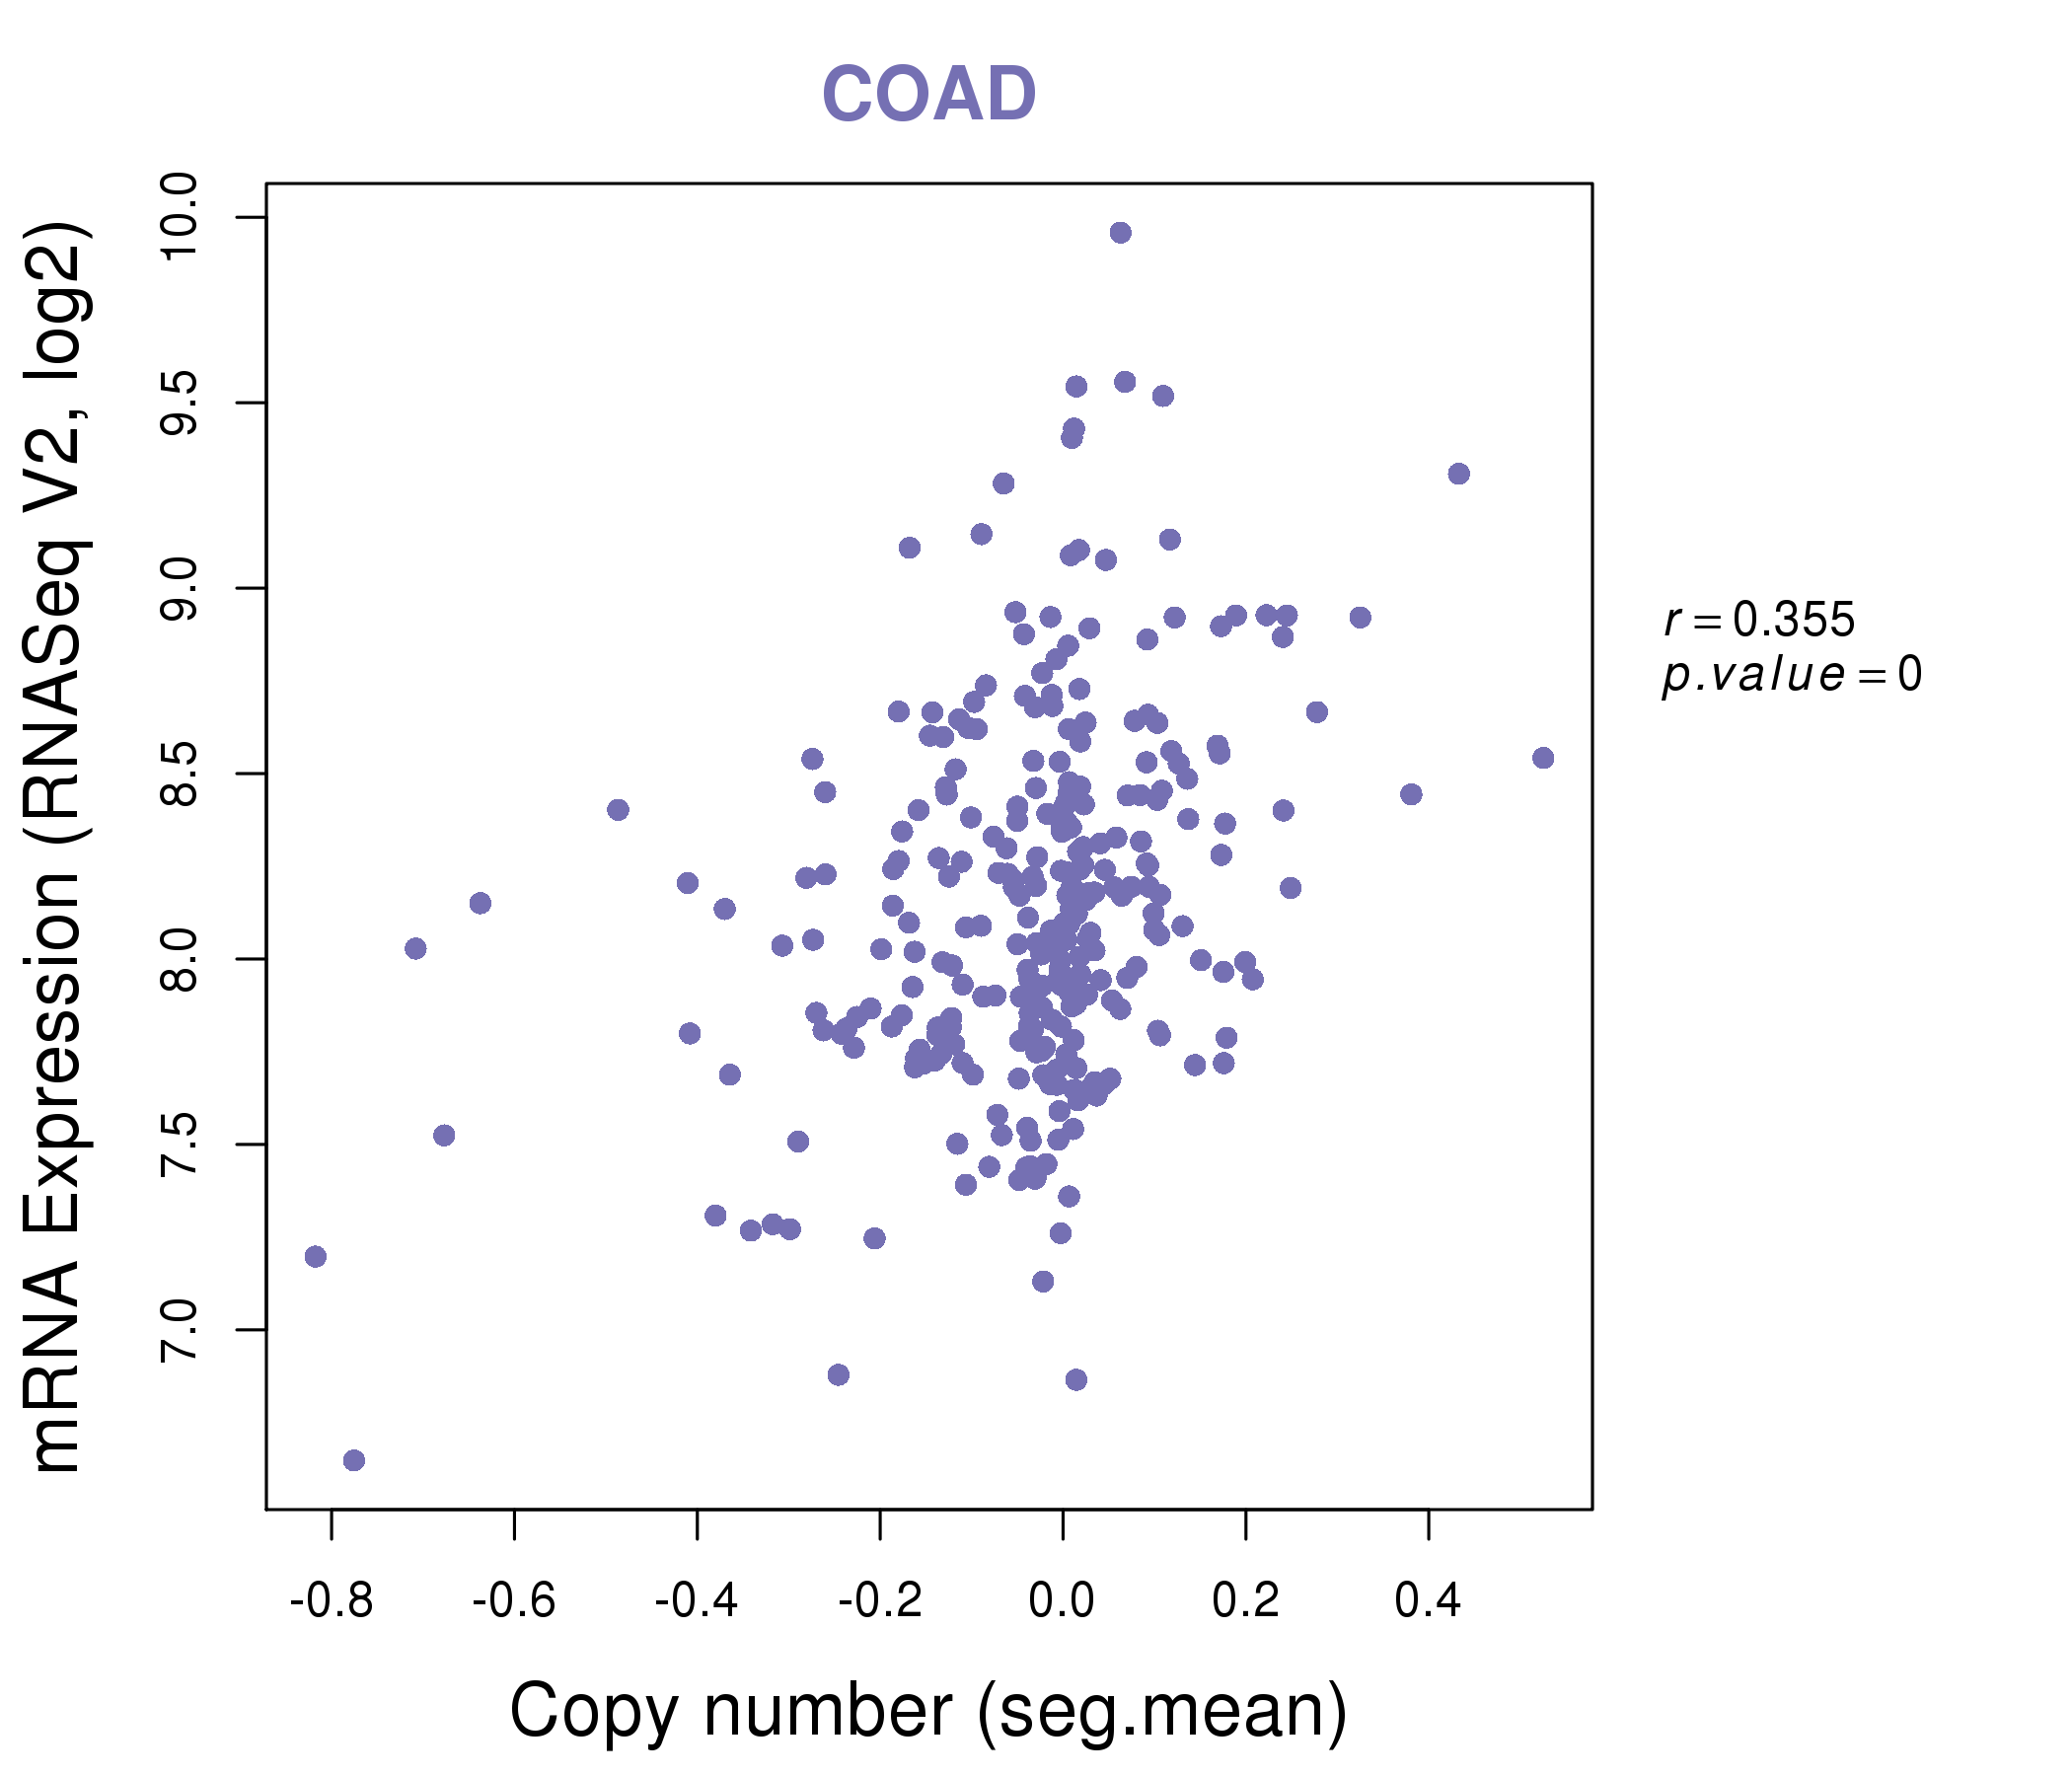
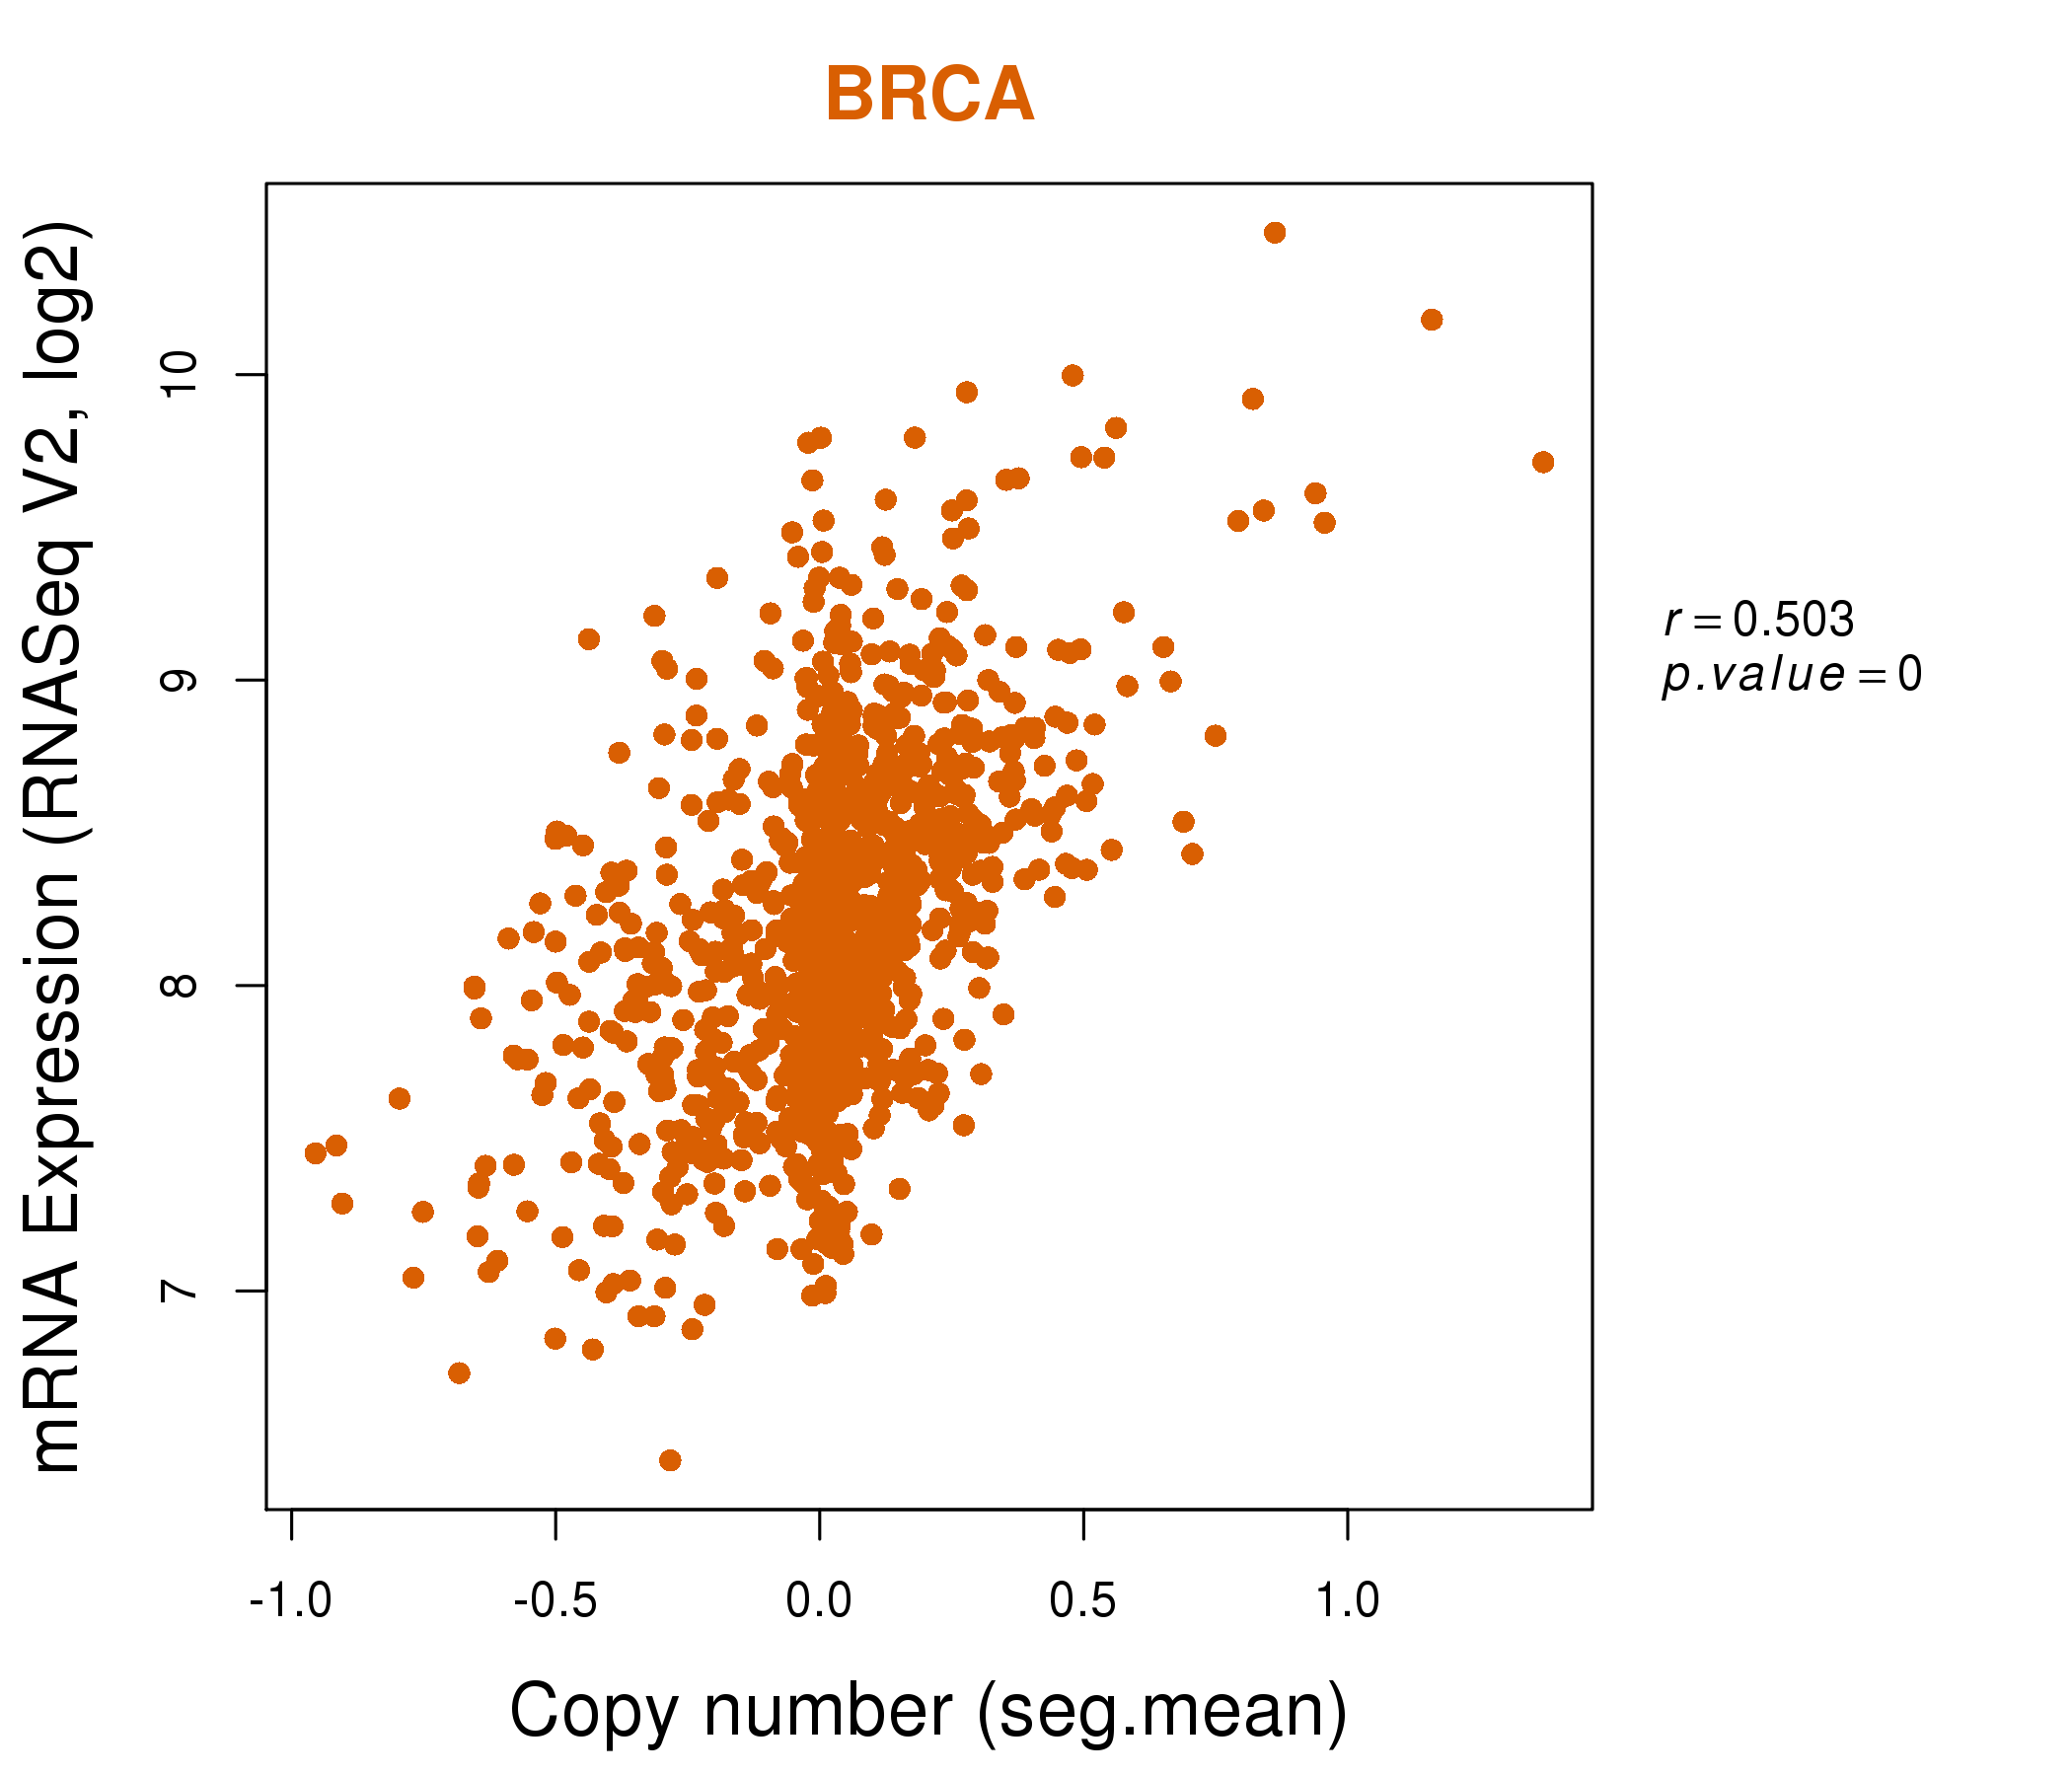
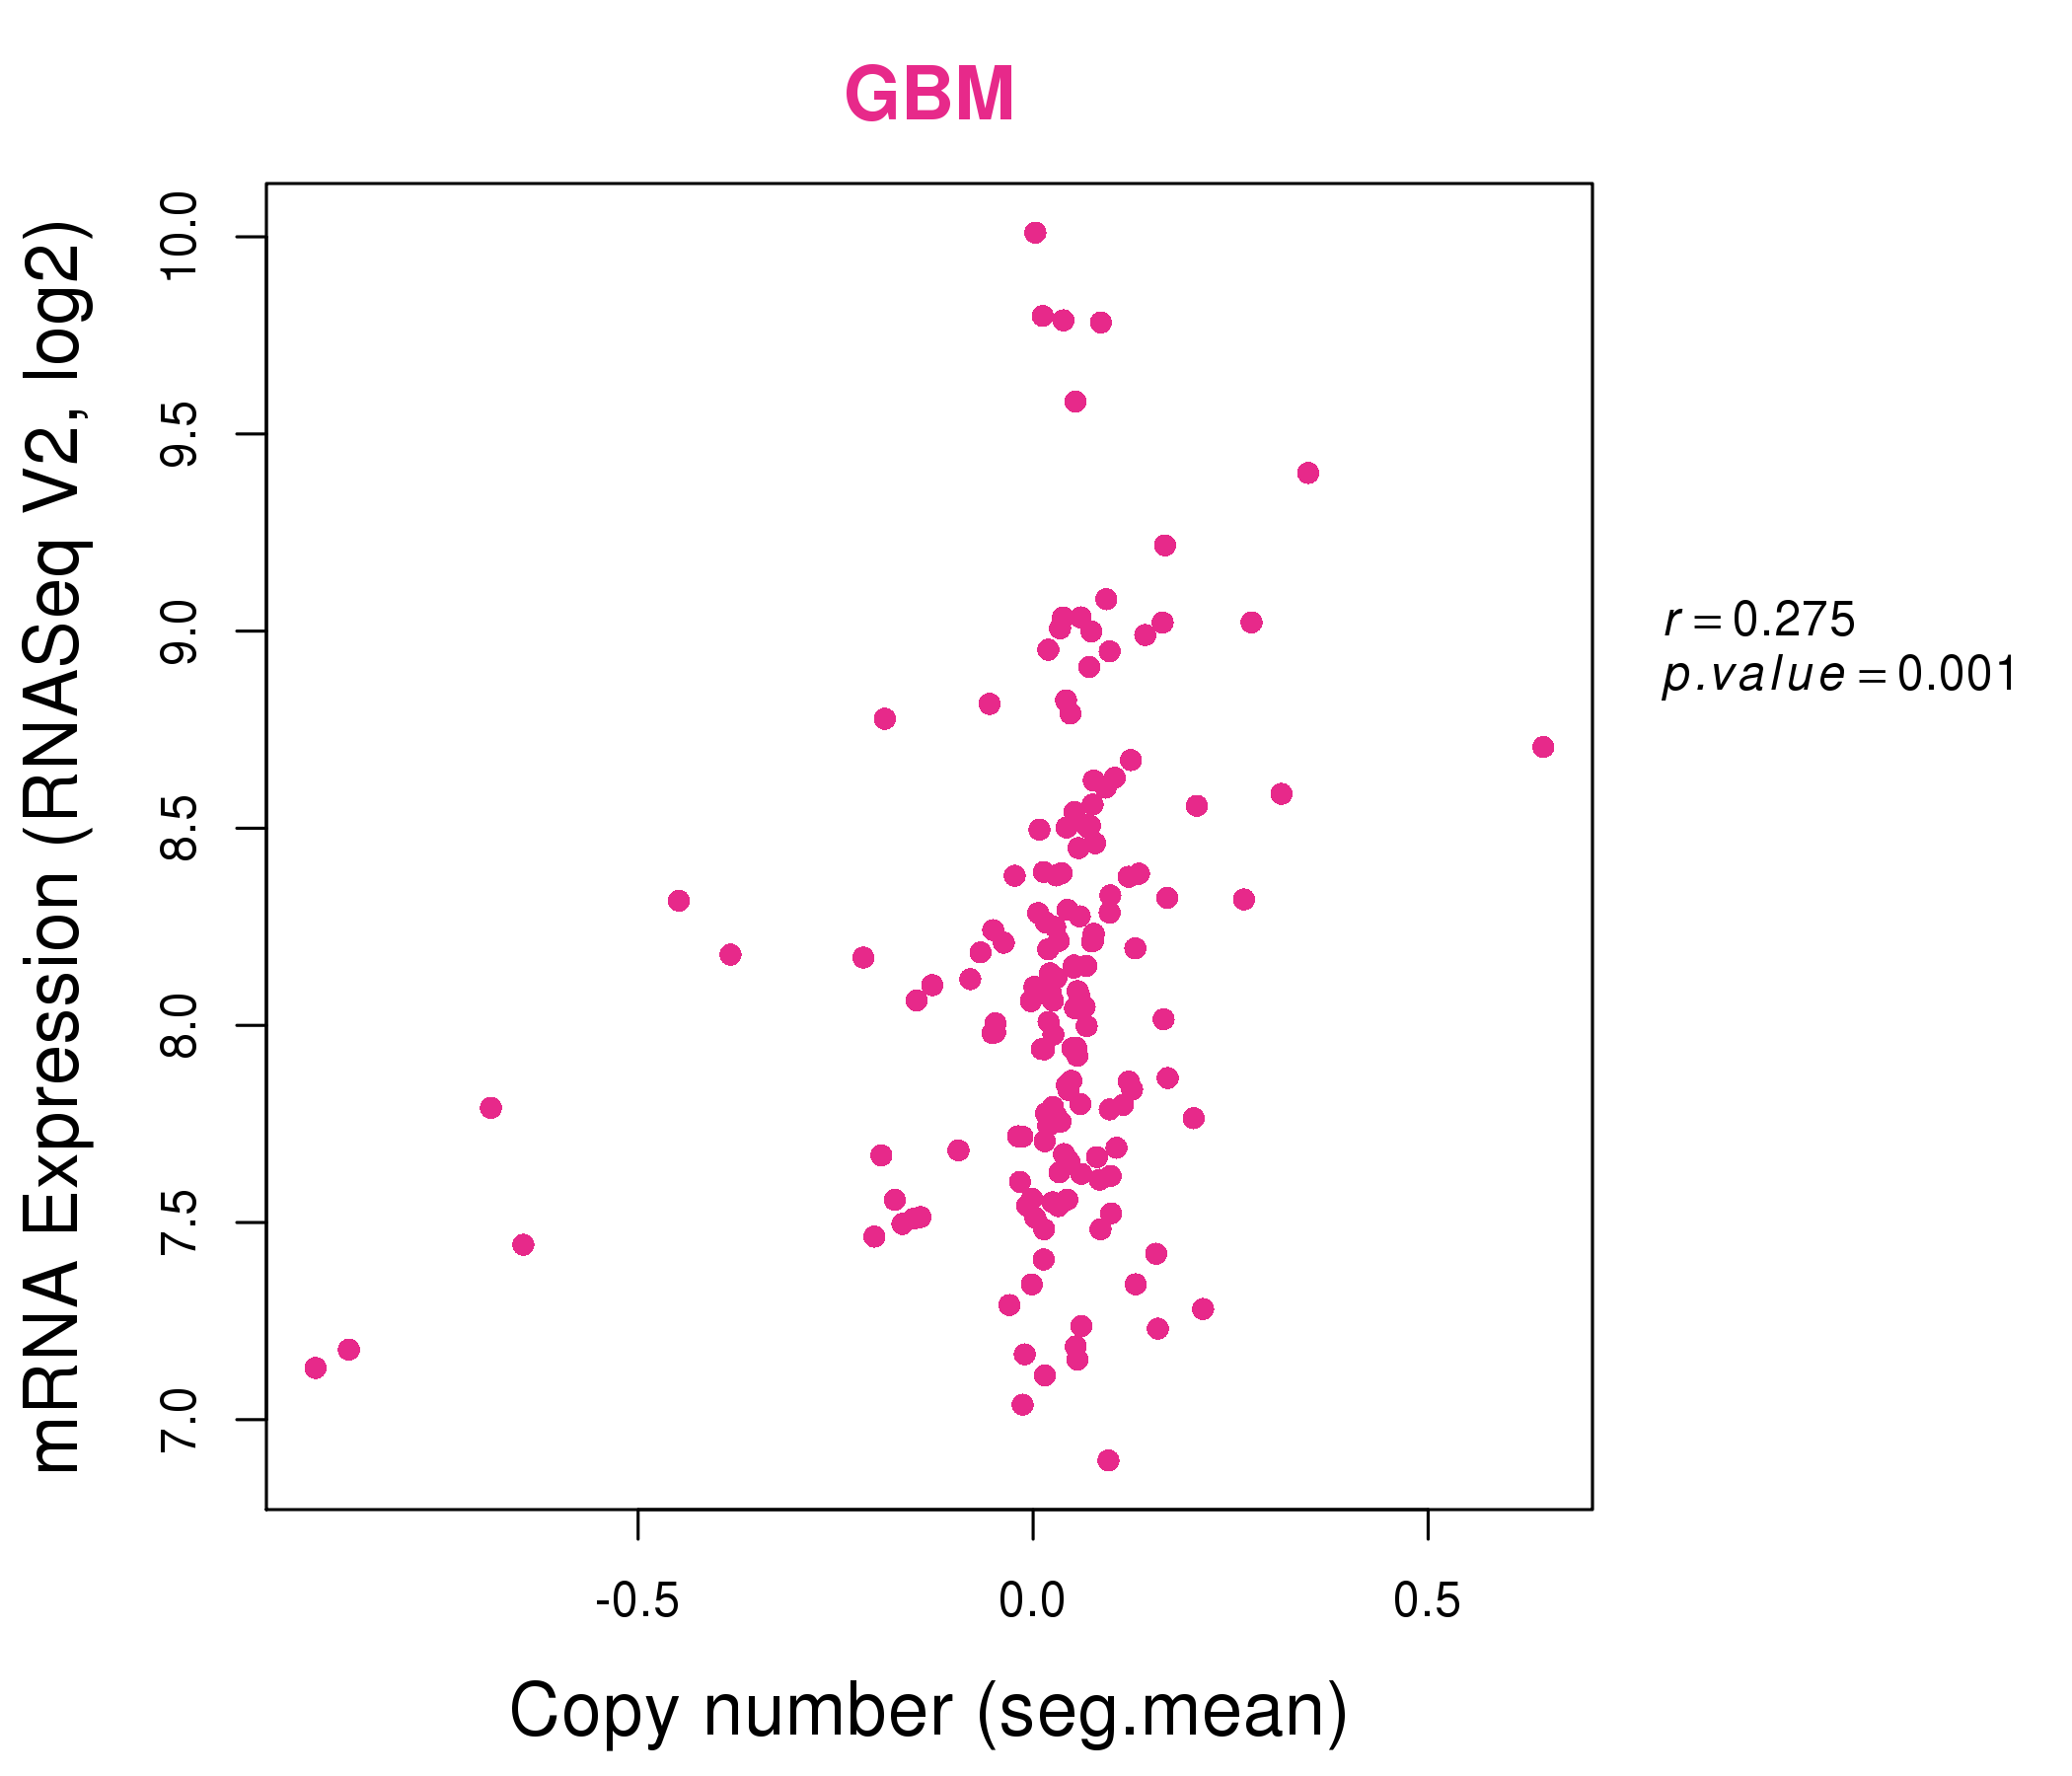
| * Copy number data were extracted from TCGA using R package TCGA-Assembler. The URLs of all public data files on TCGA DCC data server were gathered on Jan-05-2015. Function ProcessCNAData in TCGA-Assembler package was used to obtain gene-level copy number value which is calculated as the average copy number of the genomic region of a gene. |
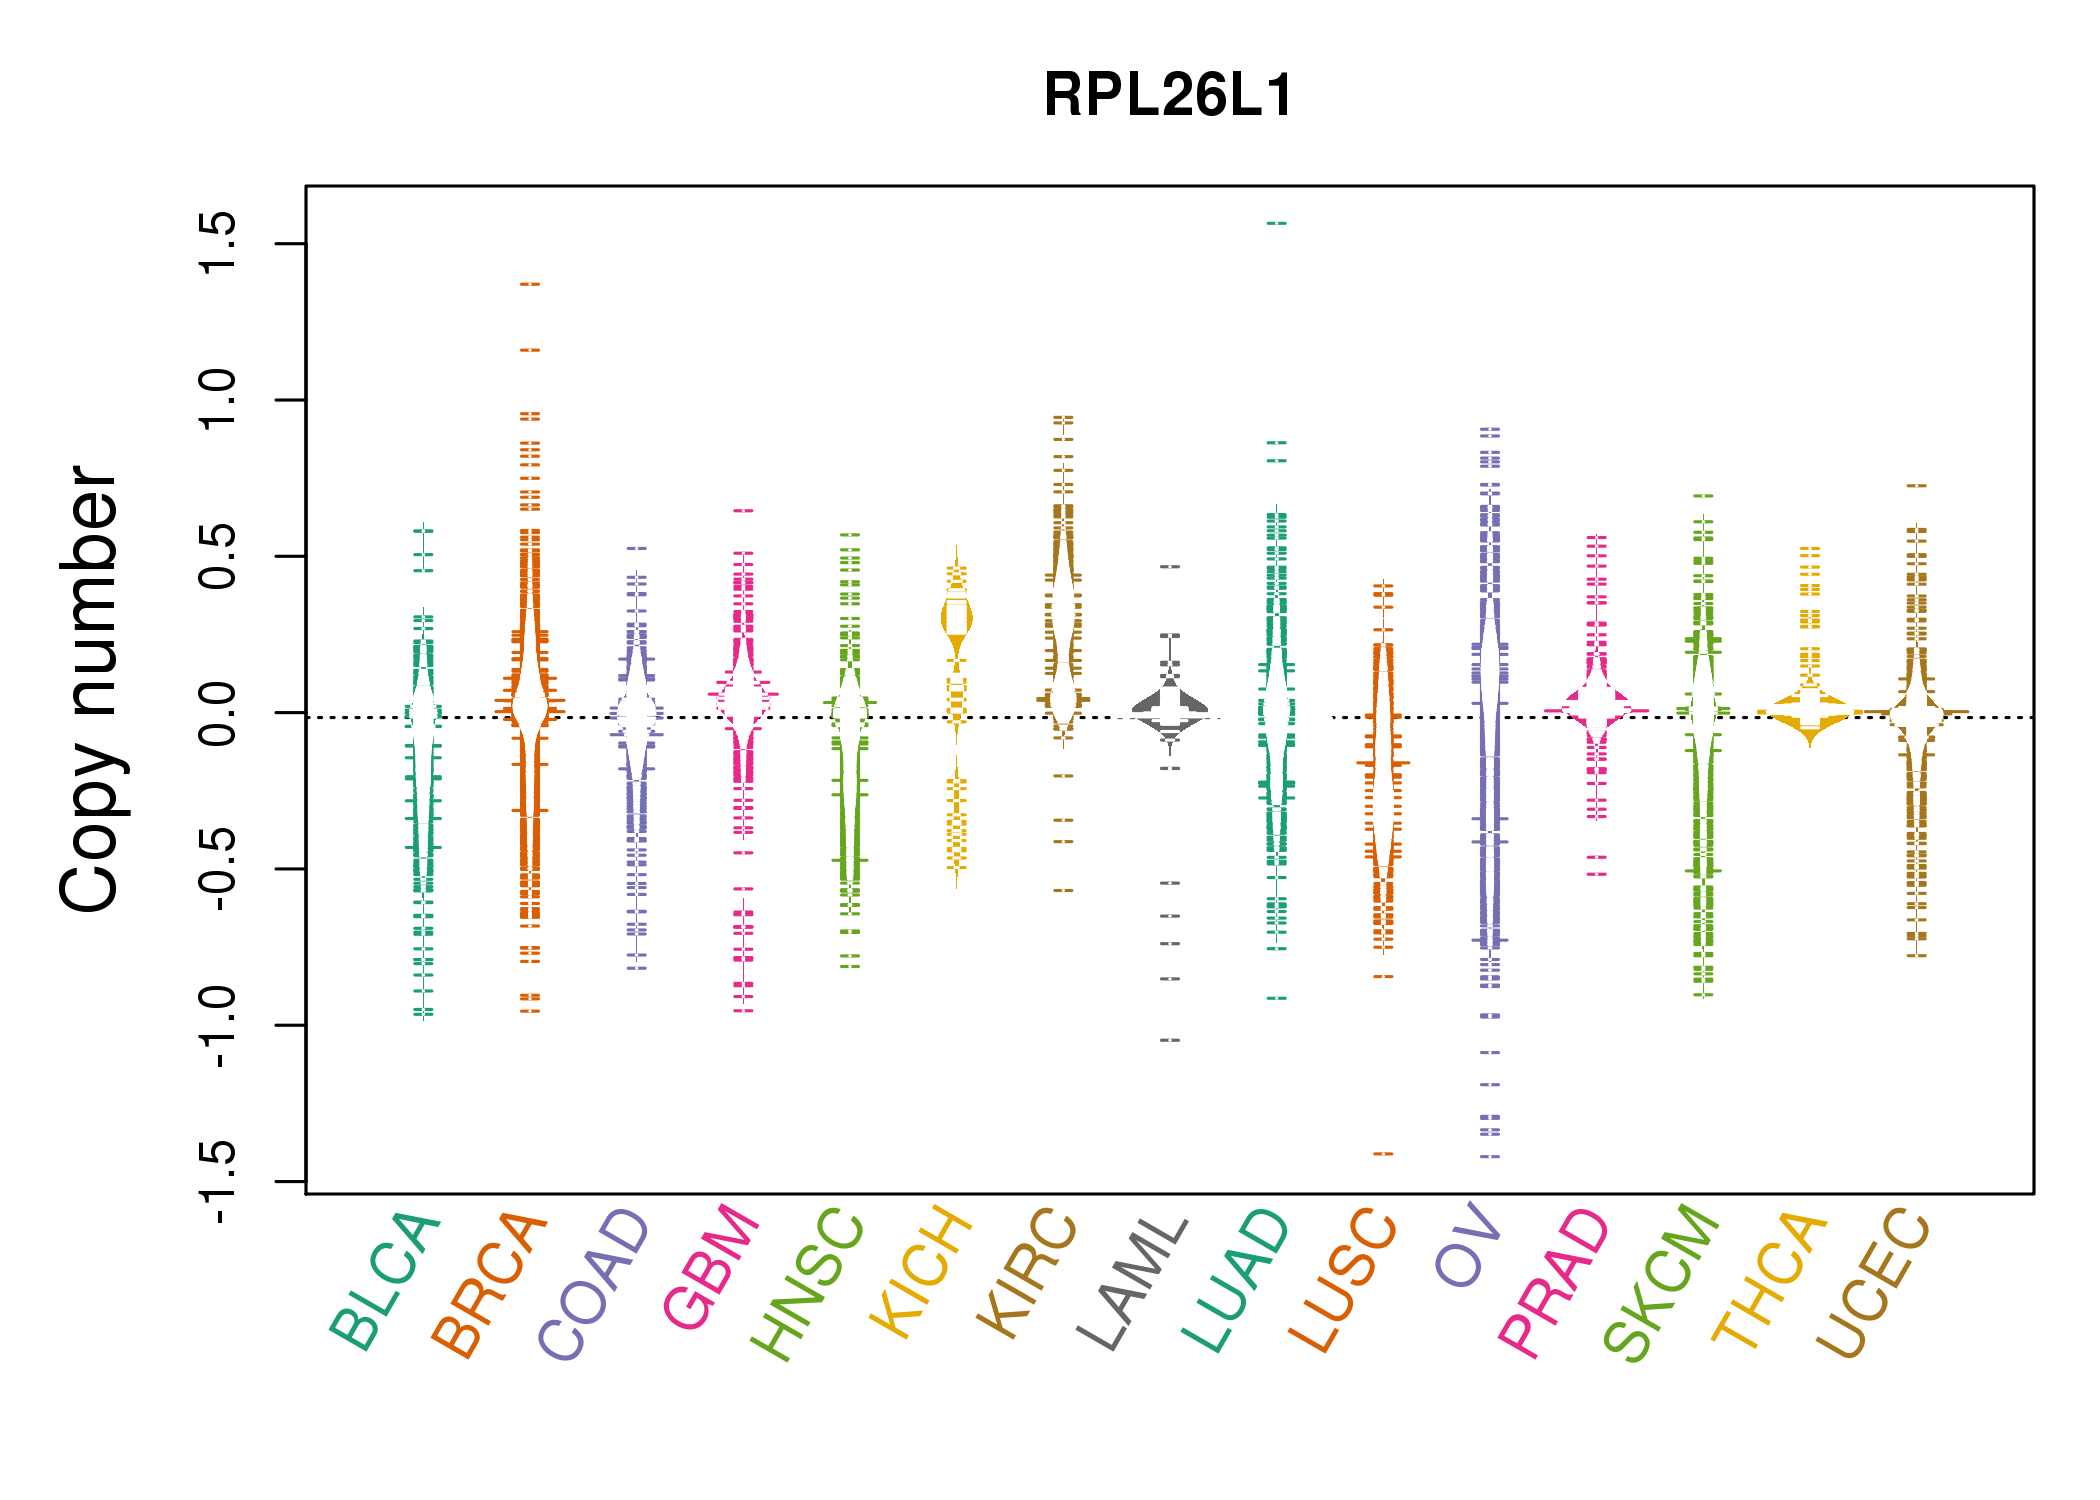 |
| cf) Tissue ID[Tissue type]: BLCA[Bladder Urothelial Carcinoma], BRCA[Breast invasive carcinoma], CESC[Cervical squamous cell carcinoma and endocervical adenocarcinoma], COAD[Colon adenocarcinoma], GBM[Glioblastoma multiforme], Glioma Low Grade, HNSC[Head and Neck squamous cell carcinoma], KICH[Kidney Chromophobe], KIRC[Kidney renal clear cell carcinoma], KIRP[Kidney renal papillary cell carcinoma], LAML[Acute Myeloid Leukemia], LUAD[Lung adenocarcinoma], LUSC[Lung squamous cell carcinoma], OV[Ovarian serous cystadenocarcinoma ], PAAD[Pancreatic adenocarcinoma], PRAD[Prostate adenocarcinoma], SKCM[Skin Cutaneous Melanoma], STAD[Stomach adenocarcinoma], THCA[Thyroid carcinoma], UCEC[Uterine Corpus Endometrial Carcinoma] |
| Top |
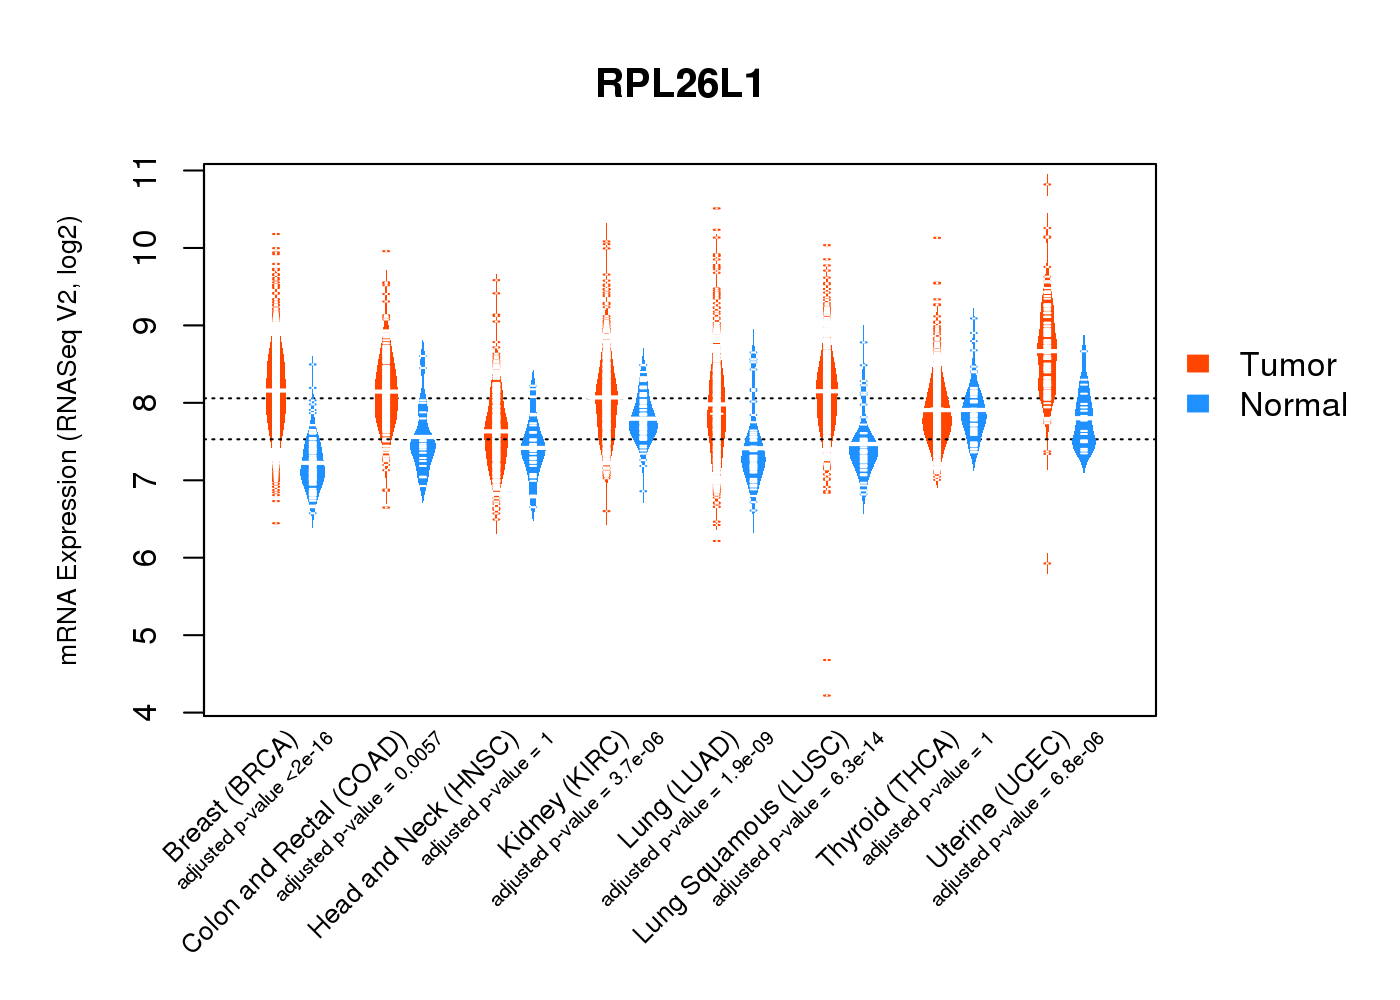
| Gene Expression for RPL26L1 |
| * CCLE gene expression data were extracted from CCLE_Expression_Entrez_2012-10-18.res: Gene-centric RMA-normalized mRNA expression data. |
 |
| * Normalized gene expression data of RNASeqV2 was extracted from TCGA using R package TCGA-Assembler. The URLs of all public data files on TCGA DCC data server were gathered at Jan-05-2015. Only eight cancer types have enough normal control samples for differential expression analysis. (t test, adjusted p<0.05 (using Benjamini-Hochberg FDR)) |
 |
| Top |
| * This plots show the correlation between CNV and gene expression. |
: Open all plots for all cancer types
 |
|
 |
|
| Top |
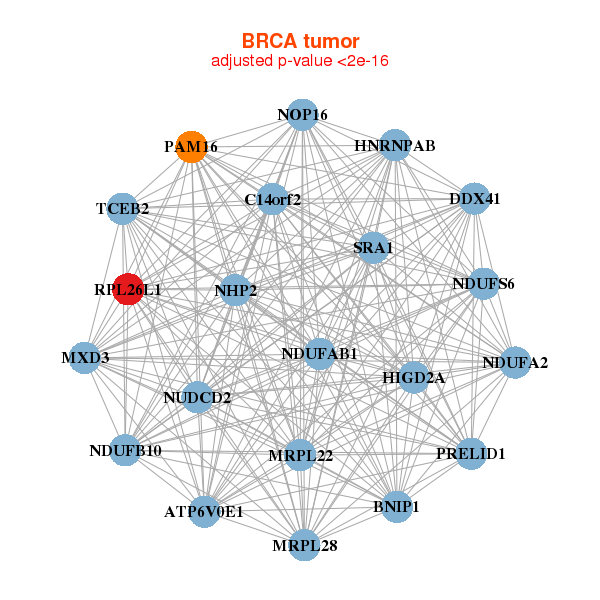
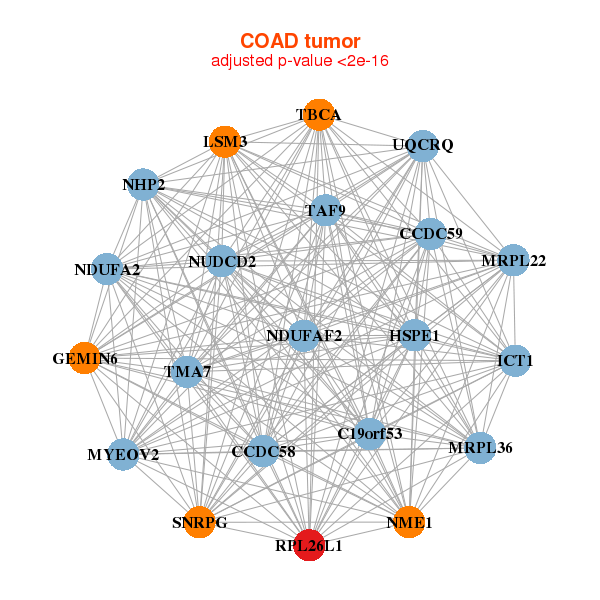
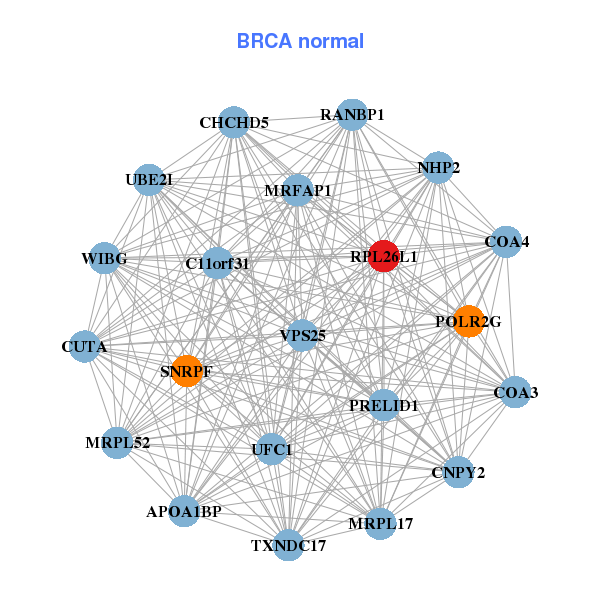
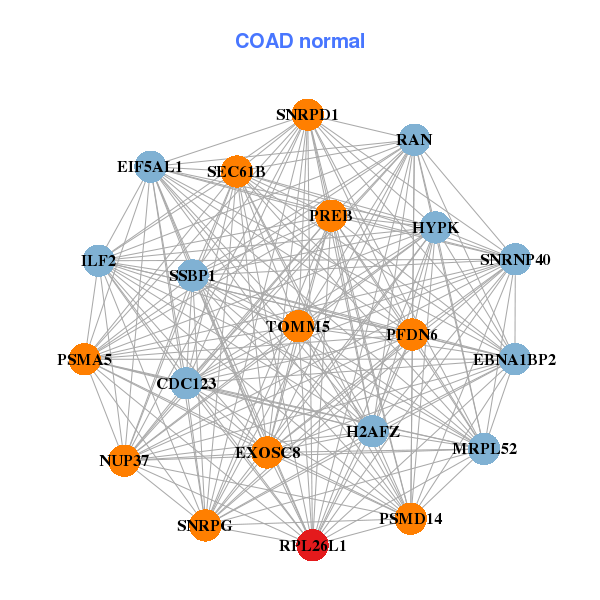
| Gene-Gene Network Information |
| * Co-Expression network figures were drawn using R package igraph. Only the top 20 genes with the highest correlations were shown. Red circle: input gene, orange circle: cell metabolism gene, sky circle: other gene |
: Open all plots for all cancer types
 |
| ||||
| ATP6V0E1,BNIP1,C14orf2,DDX41,HIGD2A,HNRNPAB,MRPL22, MRPL28,MXD3,NDUFA2,NDUFAB1,NDUFB10,NDUFS6,NHP2, NOP16,NUDCD2,PRELID1,RPL26L1,SRA1,TCEB2,PAM16 | APOA1BP,C11orf31,COA3,CHCHD5,COA4,CNPY2,CUTA, MRFAP1,MRPL17,MRPL52,NHP2,POLR2G,PRELID1,RANBP1, RPL26L1,SNRPF,TXNDC17,UBE2I,UFC1,VPS25,WIBG | ||||
 |
| ||||
| C19orf53,CCDC58,CCDC59,TMA7,GEMIN6,HSPE1,ICT1, LSM3,MRPL22,MRPL36,MYEOV2,NDUFA2,NDUFAF2,NHP2, NME1,NUDCD2,RPL26L1,SNRPG,TAF9,TBCA,UQCRQ | HYPK,CDC123,EBNA1BP2,EIF5AL1,EXOSC8,H2AFZ,ILF2, MRPL52,NUP37,PFDN6,PREB,PSMA5,PSMD14,RAN, RPL26L1,SEC61B,SNRNP40,SNRPD1,SNRPG,SSBP1,TOMM5 |
| * Co-Expression network figures were drawn using R package igraph. Only the top 20 genes with the highest correlations were shown. Red circle: input gene, orange circle: cell metabolism gene, sky circle: other gene |
: Open all plots for all cancer types
| Top |
: Open all interacting genes' information including KEGG pathway for all interacting genes from DAVID
| Top |
| Pharmacological Information for RPL26L1 |
| DB Category | DB Name | DB's ID and Url link |
| * Gene Centered Interaction Network. |
 |
| * Drug Centered Interaction Network. |
| DrugBank ID | Target Name | Drug Groups | Generic Name | Drug Centered Network | Drug Structure |
| DB02494 | ribosomal protein L26-like 1 | experimental | Alpha-Hydroxy-Beta-Phenyl-Propionic Acid | 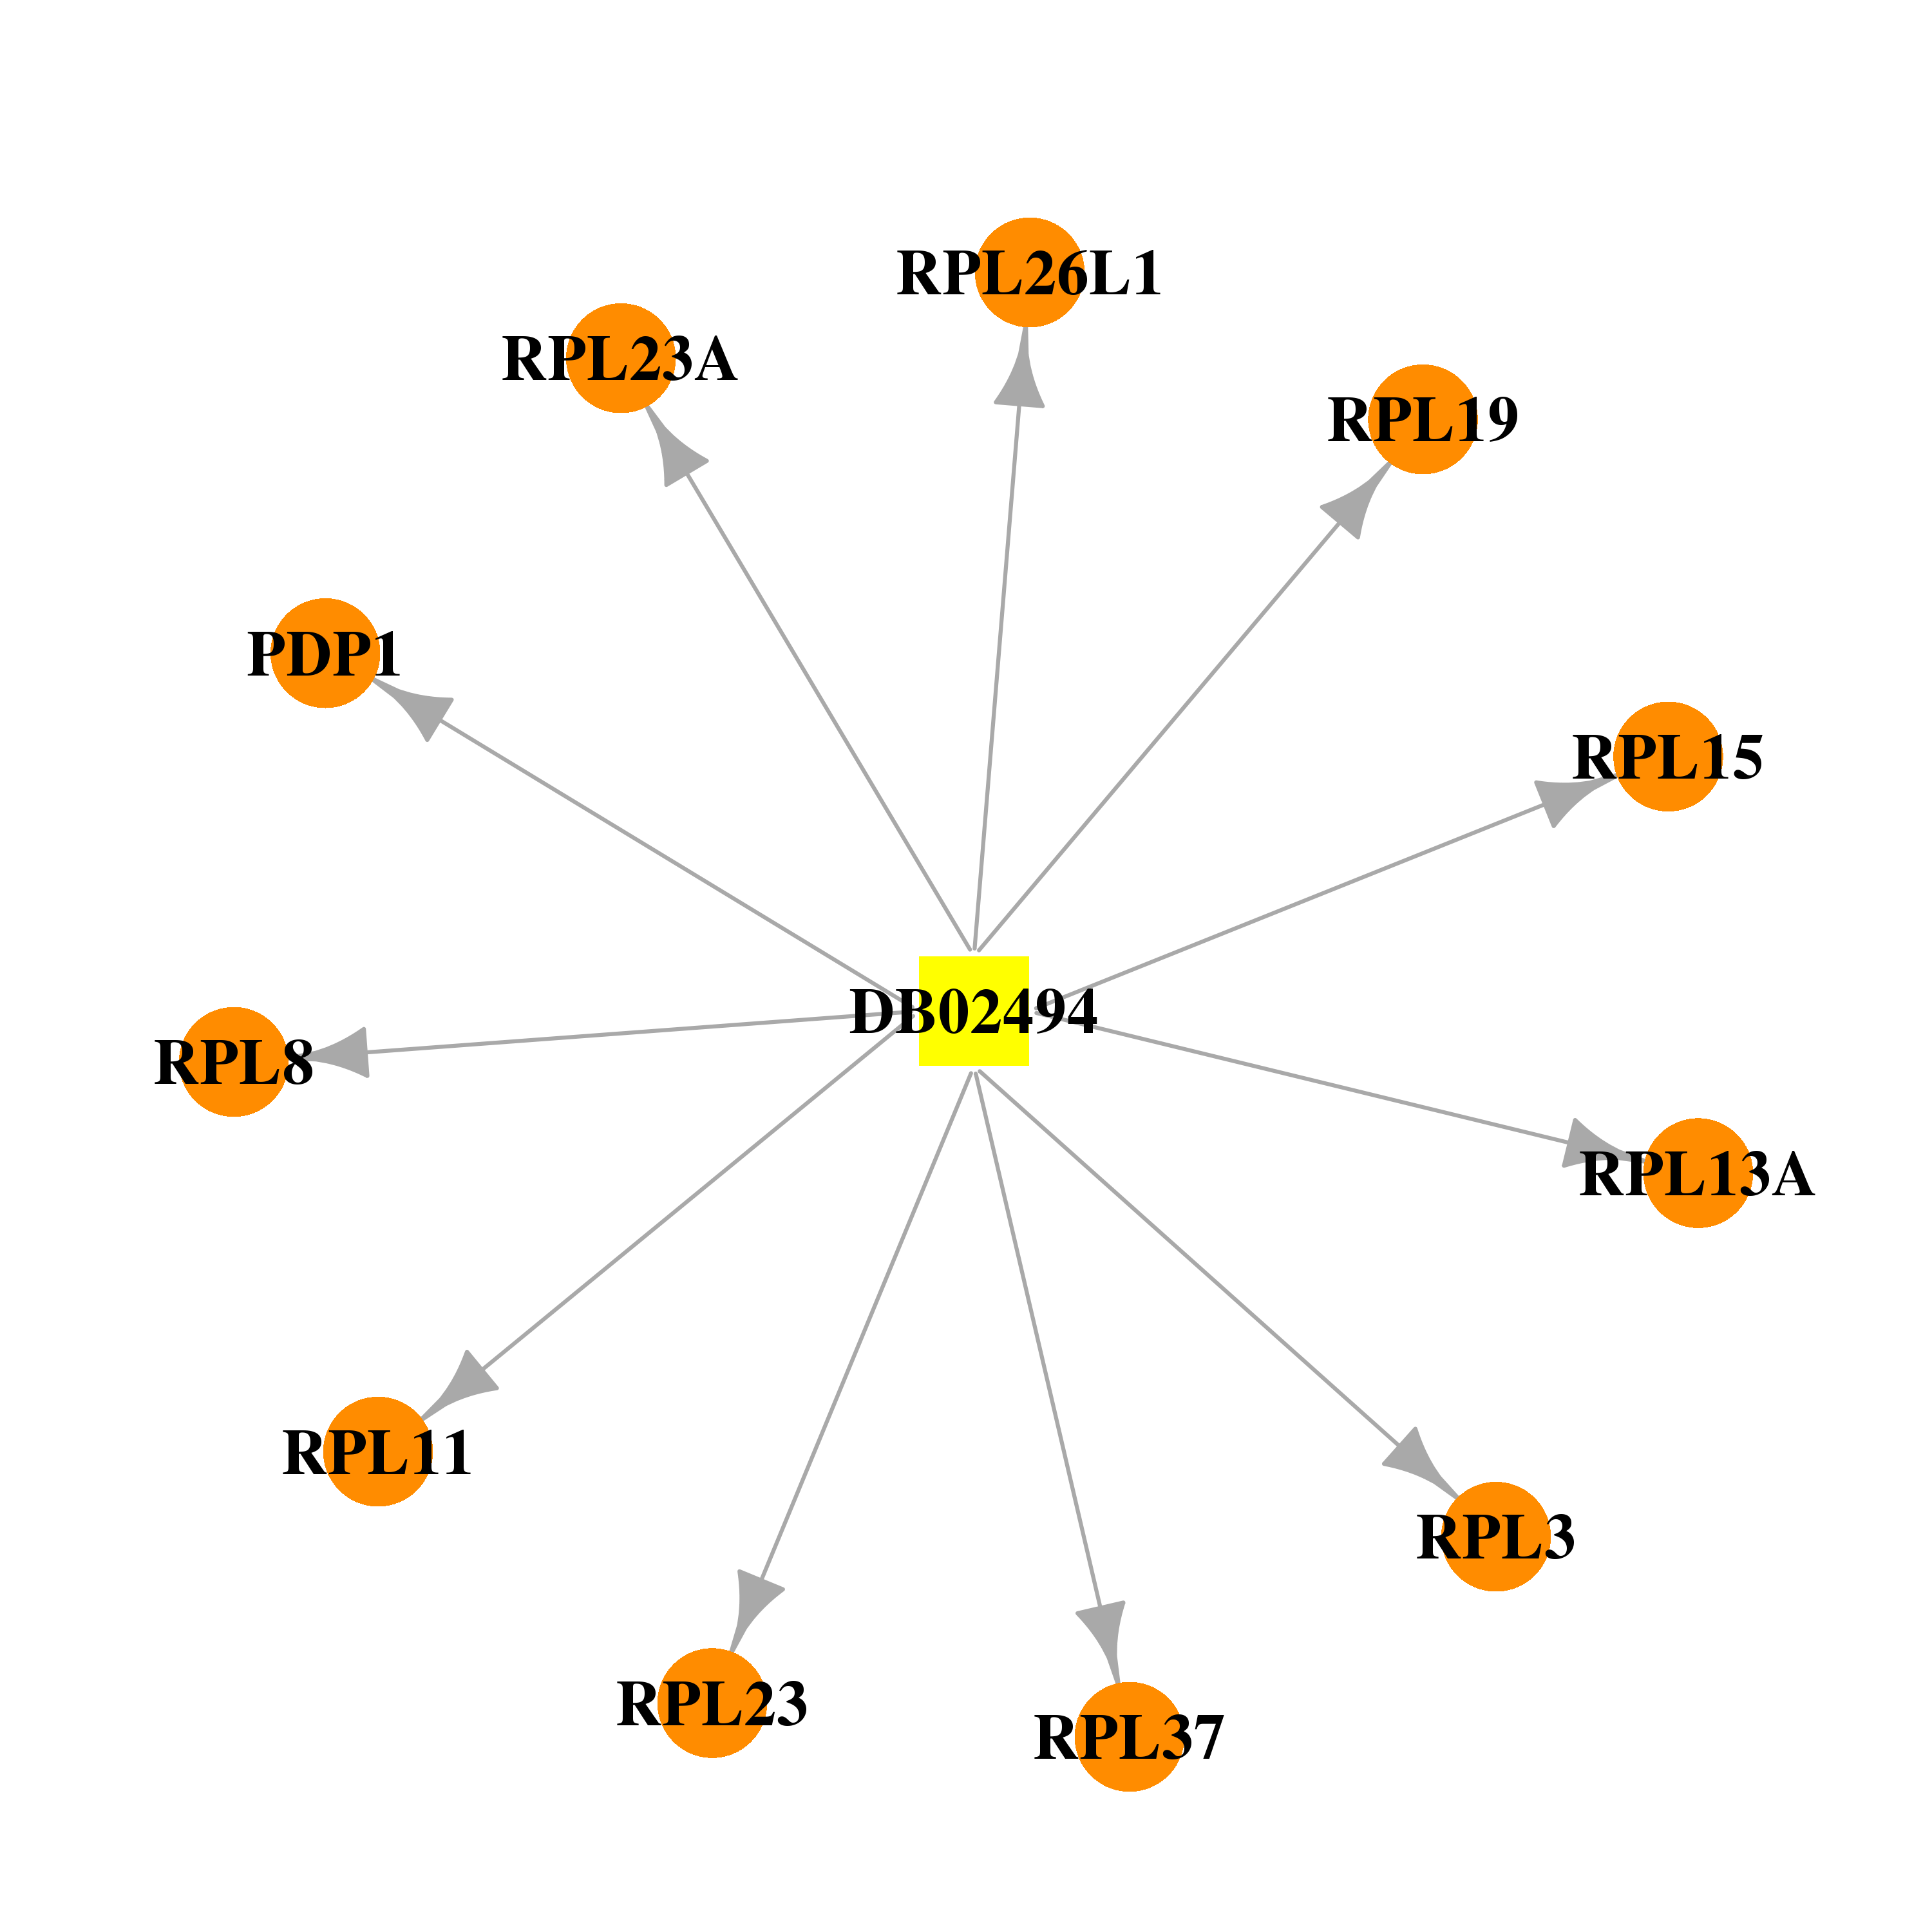 | 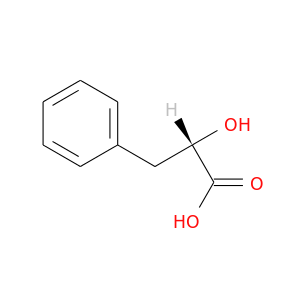 |
| DB07374 | ribosomal protein L26-like 1 | experimental | ANISOMYCIN |  |  |
| DB08437 | ribosomal protein L26-like 1 | experimental | PUROMYCIN |  |  |
| Top |
| Cross referenced IDs for RPL26L1 |
| * We obtained these cross-references from Uniprot database. It covers 150 different DBs, 18 categories. http://www.uniprot.org/help/cross_references_section |
: Open all cross reference information
|
Copyright © 2016-Present - The Univsersity of Texas Health Science Center at Houston @ |