|
||||||||||||||||||||
| |
| Phenotypic Information (metabolism pathway, cancer, disease, phenome) |
| |
| |
| Gene-Gene Network Information: Co-Expression Network, Interacting Genes & KEGG |
| |
|


| Gene Summary for SAR1B |
| Top |
| Phenotypic Information for SAR1B(metabolism pathway, cancer, disease, phenome) |
| Cancer | CGAP: SAR1B |
| Familial Cancer Database: SAR1B | |
| * This gene is included in those cancer gene databases. |
|
|
|
|
|
| . | ||||||||||||||
Oncogene 1 | Significant driver gene in | |||||||||||||||||||
| cf) number; DB name 1 Oncogene; http://nar.oxfordjournals.org/content/35/suppl_1/D721.long, 2 Tumor Suppressor gene; https://bioinfo.uth.edu/TSGene/, 3 Cancer Gene Census; http://www.nature.com/nrc/journal/v4/n3/abs/nrc1299.html, 4 CancerGenes; http://nar.oxfordjournals.org/content/35/suppl_1/D721.long, 5 Network of Cancer Gene; http://ncg.kcl.ac.uk/index.php, 1Therapeutic Vulnerabilities in Cancer; http://cbio.mskcc.org/cancergenomics/statius/ |
| REACTOME_METABOLISM_OF_PROTEINS REACTOME_METABOLISM_OF_LIPIDS_AND_LIPOPROTEINS REACTOME_LIPOPROTEIN_METABOLISM | |
| OMIM | |
| Orphanet | |
| Disease | KEGG Disease: SAR1B |
| MedGen: SAR1B (Human Medical Genetics with Condition) | |
| ClinVar: SAR1B | |
| Phenotype | MGI: SAR1B (International Mouse Phenotyping Consortium) |
| PhenomicDB: SAR1B | |
| Mutations for SAR1B |
| * Under tables are showing count per each tissue to give us broad intuition about tissue specific mutation patterns.You can go to the detailed page for each mutation database's web site. |
| There's no structural variation information in COSMIC data for this gene. |
| * From mRNA Sanger sequences, Chitars2.0 arranged chimeric transcripts. This table shows SAR1B related fusion information. |
| ID | Head Gene | Tail Gene | Accession | Gene_a | qStart_a | qEnd_a | Chromosome_a | tStart_a | tEnd_a | Gene_a | qStart_a | qEnd_a | Chromosome_a | tStart_a | tEnd_a |
| AA491604 | SAR1B | 1 | 70 | 5 | 133936852 | 133936921 | SAR1B | 66 | 333 | 5 | 133936917 | 133937184 | |
| CN421624 | SAR1B | 1 | 73 | 5 | 133938876 | 133938949 | KLF12 | 68 | 729 | 13 | 74263123 | 74263784 | |
| Top |
| There's no copy number variation information in COSMIC data for this gene. |
| Top |
|
 |
| Top |
| Stat. for Non-Synonymous SNVs (# total SNVs=14) | (# total SNVs=4) |
 |  |
(# total SNVs=0) | (# total SNVs=0) |
| Top |
| * When you move the cursor on each content, you can see more deailed mutation information on the Tooltip. Those are primary_site,primary_histology,mutation(aa),pubmedID. |
| GRCh37 position | Mutation(aa) | Unique sampleID count |
| chr5:133945277-133945277 | p.S111* | 2 |
| chr5:133942704-133942704 | p.C178F | 2 |
| chr5:133942733-133942733 | p.L168L | 1 |
| chr5:133948372-133948372 | p.? | 1 |
| chr5:133942748-133942748 | p.I163M | 1 |
| chr5:133948388-133948388 | p.H79H | 1 |
| chr5:133944073-133944073 | p.T157S | 1 |
| chr5:133948399-133948399 | p.L76M | 1 |
| chr5:133944079-133944079 | p.G155S | 1 |
| chr5:133948404-133948404 | p.F74C | 1 |
| Top |
|
 |
| Point Mutation/ Tissue ID | 1 | 2 | 3 | 4 | 5 | 6 | 7 | 8 | 9 | 10 | 11 | 12 | 13 | 14 | 15 | 16 | 17 | 18 | 19 | 20 |
| # sample | 1 | 1 | 2 | 2 | 1 | 3 | 5 | |||||||||||||
| # mutation | 1 | 1 | 2 | 2 | 1 | 3 | 6 | |||||||||||||
| nonsynonymous SNV | 2 | 1 | 1 | 2 | 5 | |||||||||||||||
| synonymous SNV | 1 | 1 | 1 | 1 | 1 |
| cf) Tissue ID; Tissue type (1; BLCA[Bladder Urothelial Carcinoma], 2; BRCA[Breast invasive carcinoma], 3; CESC[Cervical squamous cell carcinoma and endocervical adenocarcinoma], 4; COAD[Colon adenocarcinoma], 5; GBM[Glioblastoma multiforme], 6; Glioma Low Grade, 7; HNSC[Head and Neck squamous cell carcinoma], 8; KICH[Kidney Chromophobe], 9; KIRC[Kidney renal clear cell carcinoma], 10; KIRP[Kidney renal papillary cell carcinoma], 11; LAML[Acute Myeloid Leukemia], 12; LUAD[Lung adenocarcinoma], 13; LUSC[Lung squamous cell carcinoma], 14; OV[Ovarian serous cystadenocarcinoma ], 15; PAAD[Pancreatic adenocarcinoma], 16; PRAD[Prostate adenocarcinoma], 17; SKCM[Skin Cutaneous Melanoma], 18:STAD[Stomach adenocarcinoma], 19:THCA[Thyroid carcinoma], 20:UCEC[Uterine Corpus Endometrial Carcinoma]) |
| Top |
| * We represented just top 10 SNVs. When you move the cursor on each content, you can see more deailed mutation information on the Tooltip. Those are primary_site, primary_histology, mutation(aa), pubmedID. |
| Genomic Position | Mutation(aa) | Unique sampleID count |
| chr5:133942733 | p.I163M,SAR1B | 1 |
| chr5:133948427 | p.T157S,SAR1B | 1 |
| chr5:133942748 | p.E122K,SAR1B | 1 |
| chr5:133948437 | p.E114K,SAR1B | 1 |
| chr5:133944073 | p.E106K,SAR1B | 1 |
| chr5:133956708 | p.G95A,SAR1B | 1 |
| chr5:133944178 | p.H79H,SAR1B | 1 |
| chr5:133945269 | p.L76M,SAR1B | 1 |
| chr5:133945293 | p.F74C,SAR1B | 1 |
| chr5:133945325 | p.T70P,SAR1B | 1 |
| * Copy number data were extracted from TCGA using R package TCGA-Assembler. The URLs of all public data files on TCGA DCC data server were gathered on Jan-05-2015. Function ProcessCNAData in TCGA-Assembler package was used to obtain gene-level copy number value which is calculated as the average copy number of the genomic region of a gene. |
 |
| cf) Tissue ID[Tissue type]: BLCA[Bladder Urothelial Carcinoma], BRCA[Breast invasive carcinoma], CESC[Cervical squamous cell carcinoma and endocervical adenocarcinoma], COAD[Colon adenocarcinoma], GBM[Glioblastoma multiforme], Glioma Low Grade, HNSC[Head and Neck squamous cell carcinoma], KICH[Kidney Chromophobe], KIRC[Kidney renal clear cell carcinoma], KIRP[Kidney renal papillary cell carcinoma], LAML[Acute Myeloid Leukemia], LUAD[Lung adenocarcinoma], LUSC[Lung squamous cell carcinoma], OV[Ovarian serous cystadenocarcinoma ], PAAD[Pancreatic adenocarcinoma], PRAD[Prostate adenocarcinoma], SKCM[Skin Cutaneous Melanoma], STAD[Stomach adenocarcinoma], THCA[Thyroid carcinoma], UCEC[Uterine Corpus Endometrial Carcinoma] |
| Top |
| Gene Expression for SAR1B |
| * CCLE gene expression data were extracted from CCLE_Expression_Entrez_2012-10-18.res: Gene-centric RMA-normalized mRNA expression data. |
 |
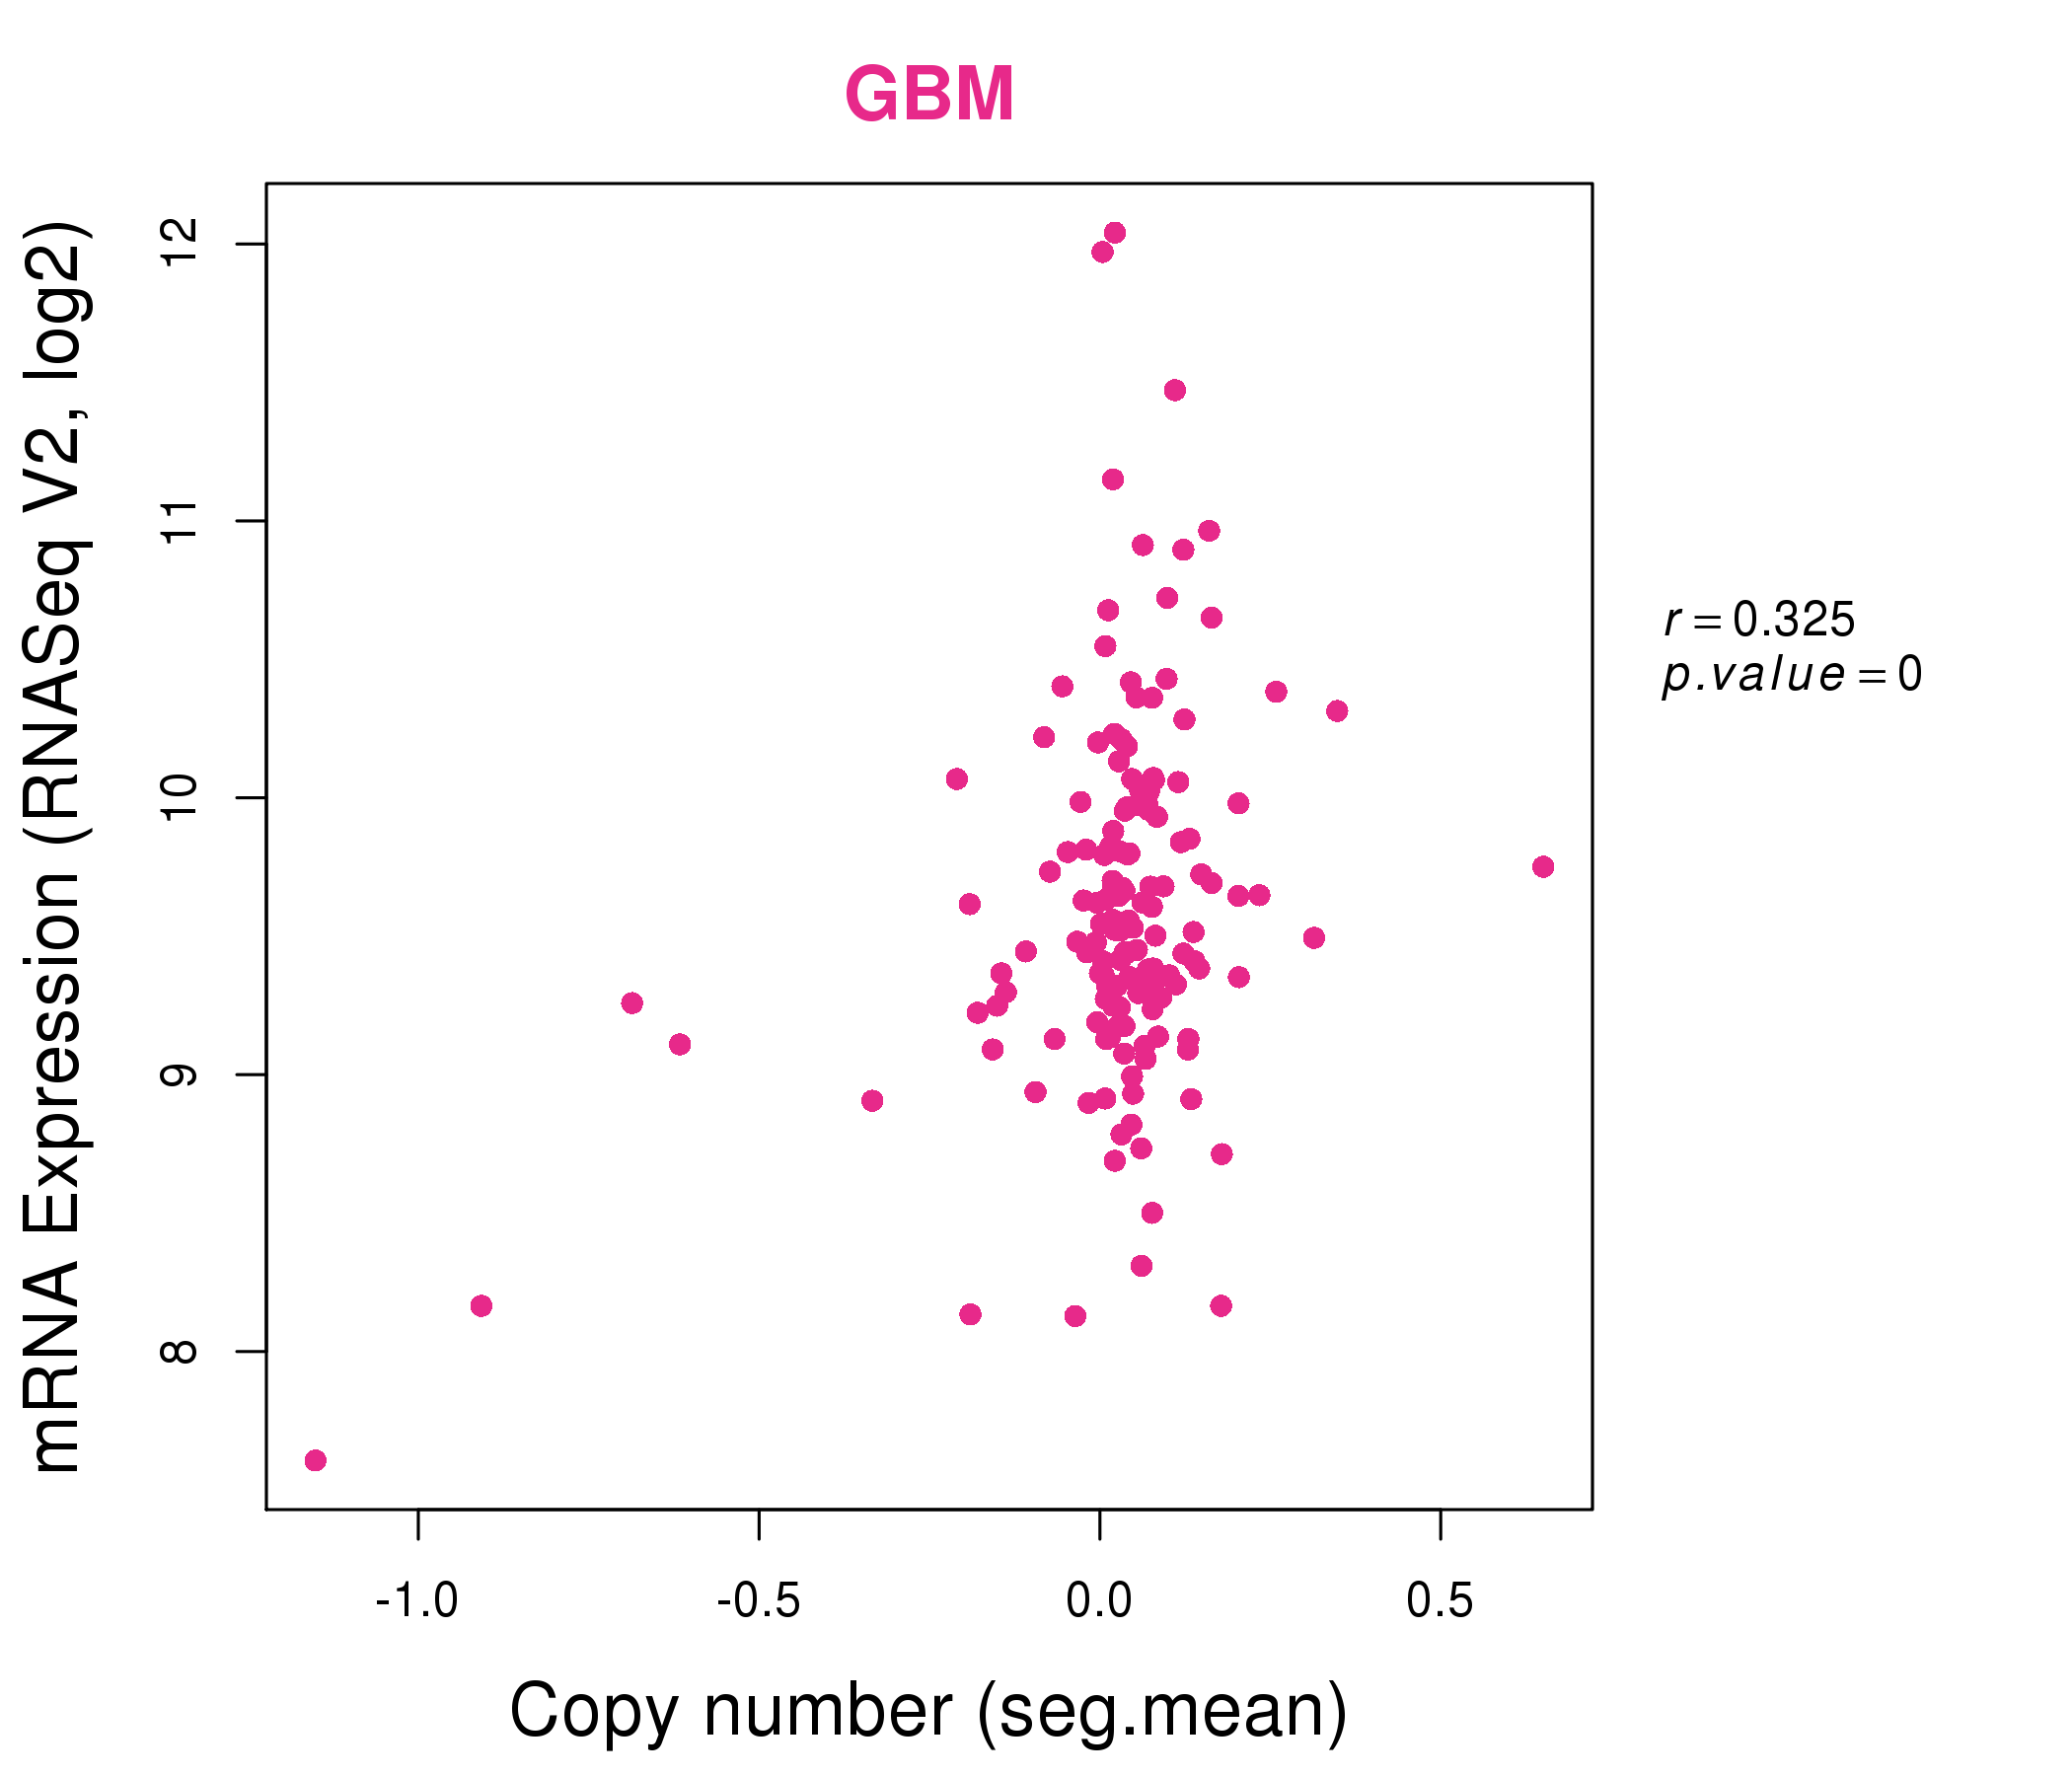
| * Normalized gene expression data of RNASeqV2 was extracted from TCGA using R package TCGA-Assembler. The URLs of all public data files on TCGA DCC data server were gathered at Jan-05-2015. Only eight cancer types have enough normal control samples for differential expression analysis. (t test, adjusted p<0.05 (using Benjamini-Hochberg FDR)) |
 |
| Top |
| * This plots show the correlation between CNV and gene expression. |
: Open all plots for all cancer types
 |
|
 |
|

| Top |
| Gene-Gene Network Information |
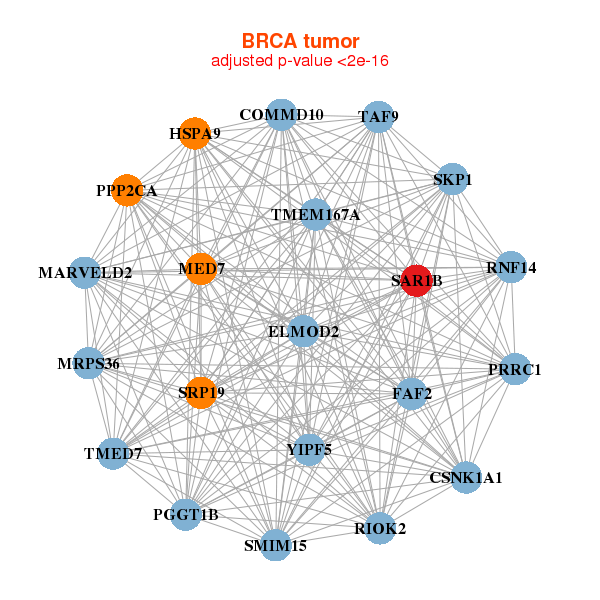
| * Co-Expression network figures were drawn using R package igraph. Only the top 20 genes with the highest correlations were shown. Red circle: input gene, orange circle: cell metabolism gene, sky circle: other gene |
: Open all plots for all cancer types
 |
|
| SMIM15,COMMD10,CSNK1A1,ELMOD2,FAF2,HSPA9,MARVELD2, MED7,MRPS36,PGGT1B,PPP2CA,PRRC1,RIOK2,RNF14, SAR1B,SKP1,SRP19,TAF9,TMED7,TMEM167A,YIPF5 | ACADM,IDI2-AS1,CCDC141,CECR2,CRAT,CUL4A,DCAF6, DNAJA4,KLHL31,KPNA1,MFN2,NDUFAF1,NDUFS1,SAR1B, SIX1,SLC38A4,TACC2,UBE2G1,UBR3,VDAC1,ZYG11B |
 |
|
| GSKIP,C14orf142,CALM2,CNIH1,COX7A2,FAM118B,HIGD1A, MRPL22,MRPS36,NDUFA2,NDUFB5,NDUFB6,PPP2CA,RAP1B, SAR1B,SDHD,SELT,TIMM8B,UQCRQ,VPS29,ZCCHC10 | AK2,ATP5J,COX14,CD58,CNIH1,COX7B,DPH3, ELMOD2,FAM32A,LACTB2,MRPS36,NDUFB6,SAR1B,SDHAF2, SF3B14,SLC25A16,SUCLG1,EMC3,TMEM62,ZBTB8OS,ZDHHC6 |


| * Co-Expression network figures were drawn using R package igraph. Only the top 20 genes with the highest correlations were shown. Red circle: input gene, orange circle: cell metabolism gene, sky circle: other gene |
: Open all plots for all cancer types
| Top |
: Open all interacting genes' information including KEGG pathway for all interacting genes from DAVID
| Top |
| Pharmacological Information for SAR1B |
| There's no related Drug. |
| Top |
| Cross referenced IDs for SAR1B |
| * We obtained these cross-references from Uniprot database. It covers 150 different DBs, 18 categories. http://www.uniprot.org/help/cross_references_section |
: Open all cross reference information
|
Copyright © 2016-Present - The Univsersity of Texas Health Science Center at Houston @ |