|
|||||||||||||||||||||||||||||||||||||||||||||||||||||||||||||||||||||||||||||||||||||||||||||||||||||||||||||||||||||||||||||||||||||||||||||||||||||||||||||||||||||||||||||||||||||||||||||||||||||||||||||||||||||||||||||||||||||||||||||||||||||||||||||||||||||||||||||||||||||||||||||||||||||||||||||||||||||||||||||||||||||||||||||||||||||||||||||||||||||
| |
| Phenotypic Information (metabolism pathway, cancer, disease, phenome) |
| |
| |
| Gene-Gene Network Information: Co-Expression Network, Interacting Genes & KEGG |
| |
|


| Gene Summary for PLCE1 |
| Basic gene info. | Gene symbol | PLCE1 |
| Gene name | phospholipase C, epsilon 1 | |
| Synonyms | NPHS3|PLCE|PPLC | |
| Cytomap | UCSC genome browser: 10q23 | |
| Genomic location | chr10 :95753745-96088148 | |
| Type of gene | protein-coding | |
| RefGenes | NM_001165979.2, NM_001288989.1,NM_016341.3, | |
| Ensembl id | ENSG00000138193 | |
| Description | 1-phosphatidylinositol 4,5-bisphosphate phosphodiesterase epsilon-1PLC-epsilon-1pancreas-enriched phospholipase Cphosphoinositide phospholipase C-epsilon-1phosphoinositide-specific phospholipase C epsilon-1 | |
| Modification date | 20141207 | |
| dbXrefs | MIM : 608414 | |
| HGNC : HGNC | ||
| Ensembl : ENSG00000138193 | ||
| HPRD : 07087 | ||
| Vega : OTTHUMG00000018789 | ||
| Protein | UniProt: Q9P212 go to UniProt's Cross Reference DB Table | |
| Expression | CleanEX: HS_PLCE1 | |
| BioGPS: 51196 | ||
| Gene Expression Atlas: ENSG00000138193 | ||
| The Human Protein Atlas: ENSG00000138193 | ||
| Pathway | NCI Pathway Interaction Database: PLCE1 | |
| KEGG: PLCE1 | ||
| REACTOME: PLCE1 | ||
| ConsensusPathDB | ||
| Pathway Commons: PLCE1 | ||
| Metabolism | MetaCyc: PLCE1 | |
| HUMANCyc: PLCE1 | ||
| Regulation | Ensembl's Regulation: ENSG00000138193 | |
| miRBase: chr10 :95,753,745-96,088,148 | ||
| TargetScan: NM_001165979 | ||
| cisRED: ENSG00000138193 | ||
| Context | iHOP: PLCE1 | |
| cancer metabolism search in PubMed: PLCE1 | ||
| UCL Cancer Institute: PLCE1 | ||
| Assigned class in ccmGDB | B - This gene belongs to cancer gene. | |
| Top |
| Phenotypic Information for PLCE1(metabolism pathway, cancer, disease, phenome) |
| Cancer | CGAP: PLCE1 |
| Familial Cancer Database: PLCE1 | |
| * This gene is included in those cancer gene databases. |
|
|
|
|
|
| . | |||||||||||||||||||||||||||||||||||||||||||||||||||||||||||||||||||||||||||||||||||||||||||||||||||||||||||||||||||||||||||||||||||||||||||||||||||||||||||||||||||||||||||||||||||||||||||||||||||||||||||||||||||||||||||||||||||||||||||||||||||||||||||||||||||||||||||||||||||||||||||||||||||||||||||||||||||||||||||||||||||||||||||||||||||||||||||||||
Oncogene 1 | Significant driver gene in | ||||||||||||||||||||||||||||||||||||||||||||||||||||||||||||||||||||||||||||||||||||||||||||||||||||||||||||||||||||||||||||||||||||||||||||||||||||||||||||||||||||||||||||||||||||||||||||||||||||||||||||||||||||||||||||||||||||||||||||||||||||||||||||||||||||||||||||||||||||||||||||||||||||||||||||||||||||||||||||||||||||||||||||||||||||||||||||||||||||
| cf) number; DB name 1 Oncogene; http://nar.oxfordjournals.org/content/35/suppl_1/D721.long, 2 Tumor Suppressor gene; https://bioinfo.uth.edu/TSGene/, 3 Cancer Gene Census; http://www.nature.com/nrc/journal/v4/n3/abs/nrc1299.html, 4 CancerGenes; http://nar.oxfordjournals.org/content/35/suppl_1/D721.long, 5 Network of Cancer Gene; http://ncg.kcl.ac.uk/index.php, 1Therapeutic Vulnerabilities in Cancer; http://cbio.mskcc.org/cancergenomics/statius/ |
| KEGG_INOSITOL_PHOSPHATE_METABOLISM | |
| OMIM | 608414; gene. 608414; gene. 610725; phenotype. 610725; phenotype. |
| Orphanet | 93213; Familial idiopathic steroid-resistant nephrotic syndrome with focal segmental hyalinosis. 93213; Familial idiopathic steroid-resistant nephrotic syndrome with focal segmental hyalinosis. 93217; Familial idiopathic steroid-resistant nephrotic syndrome with diffuse mesangial sclerosis. 93217; Familial idiopathic steroid-resistant nephrotic syndrome with diffuse mesangial sclerosis. |
| Disease | KEGG Disease: PLCE1 |
| MedGen: PLCE1 (Human Medical Genetics with Condition) | |
| ClinVar: PLCE1 | |
| Phenotype | MGI: PLCE1 (International Mouse Phenotyping Consortium) |
| PhenomicDB: PLCE1 | |
| Mutations for PLCE1 |
| * Under tables are showing count per each tissue to give us broad intuition about tissue specific mutation patterns.You can go to the detailed page for each mutation database's web site. |
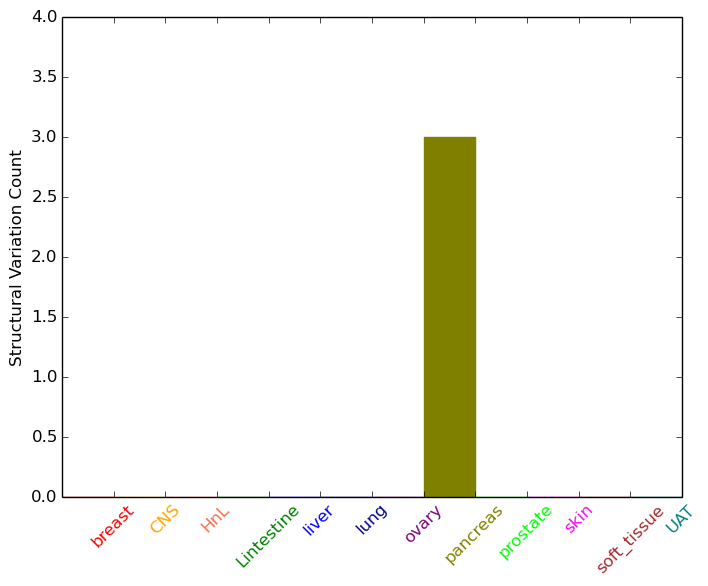
| - Statistics for Tissue and Mutation type | Top |
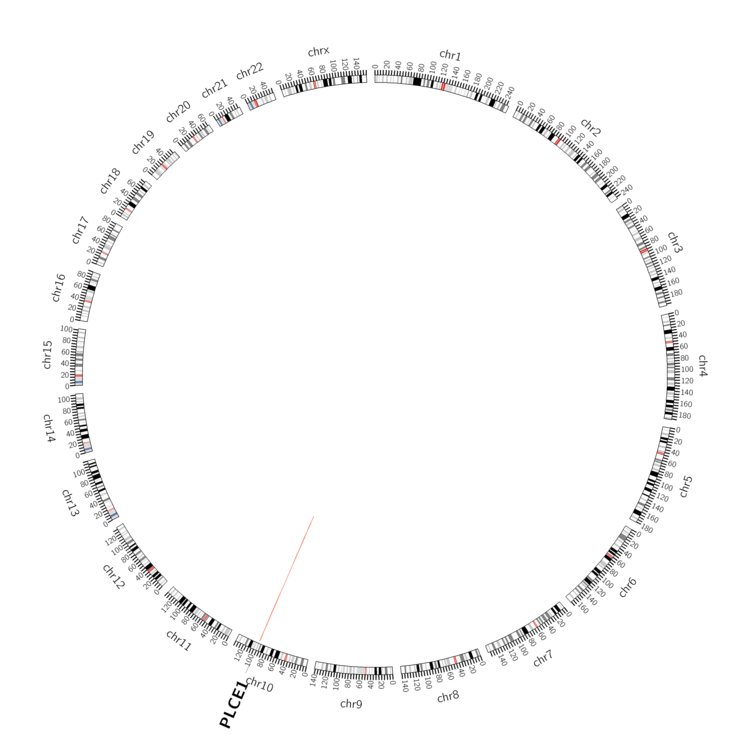 |
| - For Inter-chromosomal Variations |
| There's no inter-chromosomal structural variation. |
| - For Intra-chromosomal Variations |
| * Intra-chromosomal variantions includes 'intrachromosomal amplicon to amplicon', 'intrachromosomal amplicon to non-amplified dna', 'intrachromosomal deletion', 'intrachromosomal fold-back inversion', 'intrachromosomal inversion', 'intrachromosomal tandem duplication', 'Intrachromosomal unknown type', 'intrachromosomal with inverted orientation', 'intrachromosomal with non-inverted orientation'. |
 |
| Sample | Symbol_a | Chr_a | Start_a | End_a | Symbol_b | Chr_b | Start_b | End_b |
| pancreas | PLCE1 | chr10 | 95837172 | 95837192 | chr10 | 95686504 | 95686524 | |
| pancreas | PLCE1 | chr10 | 96042277 | 96042297 | PLCE1 | chr10 | 96043292 | 96043312 |
| pancreas | PLCE1 | chr10 | 96056637 | 96056657 | PLCE1 | chr10 | 96061171 | 96061191 |
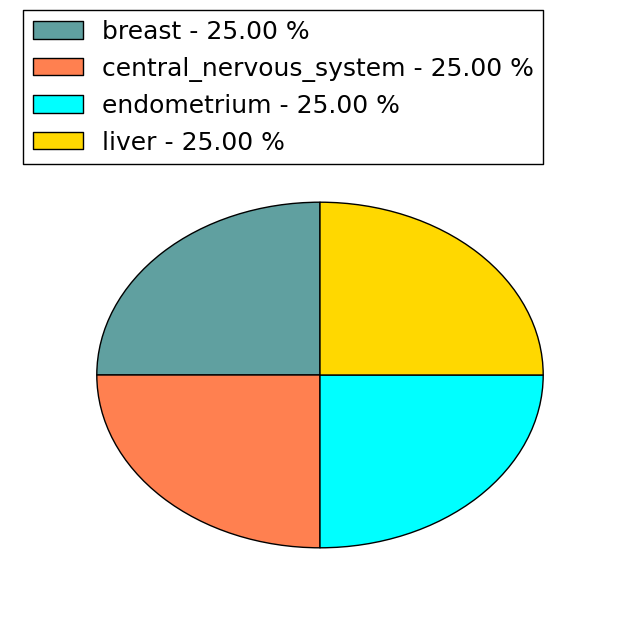
| cf) Tissue number; Tissue name (1;Breast, 2;Central_nervous_system, 3;Haematopoietic_and_lymphoid_tissue, 4;Large_intestine, 5;Liver, 6;Lung, 7;Ovary, 8;Pancreas, 9;Prostate, 10;Skin, 11;Soft_tissue, 12;Upper_aerodigestive_tract) |
| * From mRNA Sanger sequences, Chitars2.0 arranged chimeric transcripts. This table shows PLCE1 related fusion information. |
| ID | Head Gene | Tail Gene | Accession | Gene_a | qStart_a | qEnd_a | Chromosome_a | tStart_a | tEnd_a | Gene_a | qStart_a | qEnd_a | Chromosome_a | tStart_a | tEnd_a |
| DA374251 | PLCE1 | 1 | 137 | 10 | 95791432 | 95791568 | NEBL | 138 | 543 | 10 | 21071612 | 21072017 | |
| AK025366 | PLCE1 | 1 | 1724 | 10 | 96011362 | 96013085 | PLCE1 | 1718 | 2011 | 10 | 96008147 | 96008440 | |
| Top |
| Mutation type/ Tissue ID | brca | cns | cerv | endome | haematopo | kidn | Lintest | liver | lung | ns | ovary | pancre | prost | skin | stoma | thyro | urina | |||
| Total # sample | 1 | 2 | 3 | 1 | 1 | |||||||||||||||
| GAIN (# sample) | 2 | 1 | ||||||||||||||||||
| LOSS (# sample) | 1 | 2 | 1 | 1 |
| cf) Tissue ID; Tissue type (1; Breast, 2; Central_nervous_system, 3; Cervix, 4; Endometrium, 5; Haematopoietic_and_lymphoid_tissue, 6; Kidney, 7; Large_intestine, 8; Liver, 9; Lung, 10; NS, 11; Ovary, 12; Pancreas, 13; Prostate, 14; Skin, 15; Stomach, 16; Thyroid, 17; Urinary_tract) |
| Top |
|
 |
| Top |
| Stat. for Non-Synonymous SNVs (# total SNVs=153) | (# total SNVs=37) |
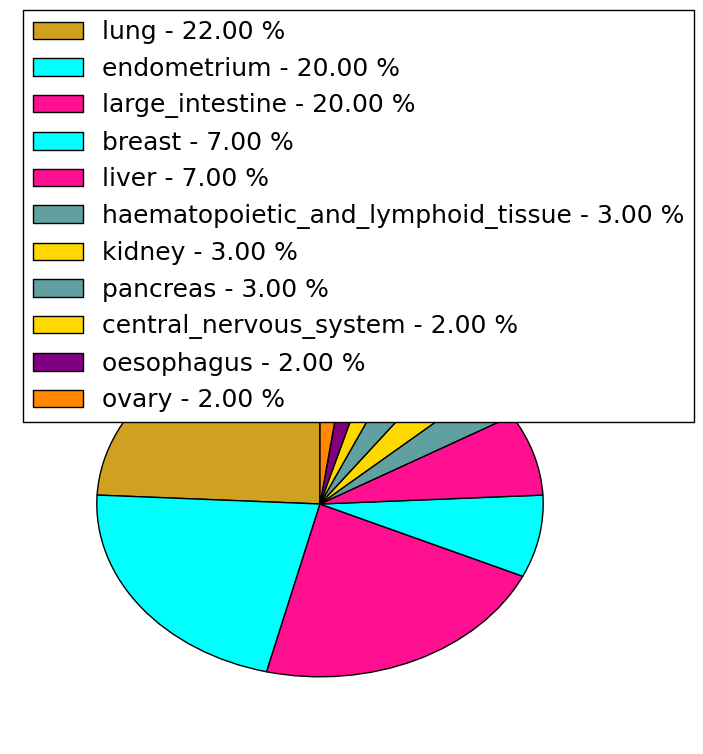 | 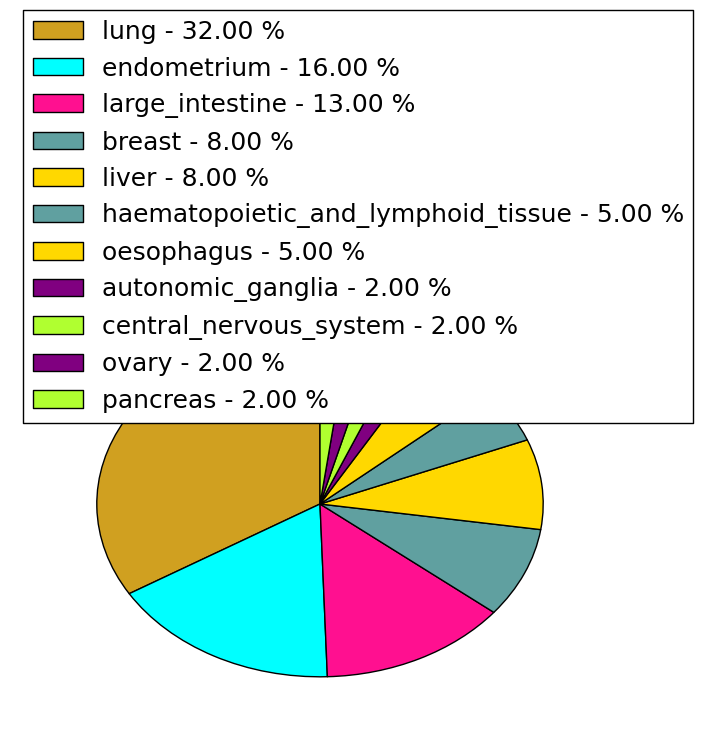 |
(# total SNVs=4) | (# total SNVs=0) |
 |
| Top |
| * When you move the cursor on each content, you can see more deailed mutation information on the Tooltip. Those are primary_site,primary_histology,mutation(aa),pubmedID. |
| GRCh37 position | Mutation(aa) | Unique sampleID count |
| chr10:96030337-96030337 | p.R1495Q | 6 |
| chr10:96066363-96066363 | p.V1934V | 3 |
| chr10:96084175-96084175 | p.E2191K | 3 |
| chr10:95791355-95791355 | p.R184R | 3 |
| chr10:95790940-95790940 | p.R46Q | 3 |
| chr10:95993854-95993854 | p.D667H | 2 |
| chr10:96058429-96058429 | p.? | 2 |
| chr10:95791831-95791831 | p.G343E | 2 |
| chr10:96044713-96044713 | p.K1676Q | 2 |
| chr10:95791983-95791983 | p.R394C | 2 |
| Top |
|
 |
| Point Mutation/ Tissue ID | 1 | 2 | 3 | 4 | 5 | 6 | 7 | 8 | 9 | 10 | 11 | 12 | 13 | 14 | 15 | 16 | 17 | 18 | 19 | 20 |
| # sample | 5 | 12 | 4 | 28 | 1 | 13 | 4 | 4 | 22 | 13 | 3 | 1 | 45 | 18 | 1 | 23 | ||||
| # mutation | 5 | 12 | 4 | 33 | 1 | 16 | 4 | 4 | 23 | 14 | 3 | 1 | 59 | 23 | 1 | 42 | ||||
| nonsynonymous SNV | 3 | 10 | 2 | 28 | 1 | 9 | 3 | 4 | 16 | 11 | 1 | 1 | 43 | 11 | 33 | |||||
| synonymous SNV | 2 | 2 | 2 | 5 | 7 | 1 | 7 | 3 | 2 | 16 | 12 | 1 | 10 |
| cf) Tissue ID; Tissue type (1; BLCA[Bladder Urothelial Carcinoma], 2; BRCA[Breast invasive carcinoma], 3; CESC[Cervical squamous cell carcinoma and endocervical adenocarcinoma], 4; COAD[Colon adenocarcinoma], 5; GBM[Glioblastoma multiforme], 6; Glioma Low Grade, 7; HNSC[Head and Neck squamous cell carcinoma], 8; KICH[Kidney Chromophobe], 9; KIRC[Kidney renal clear cell carcinoma], 10; KIRP[Kidney renal papillary cell carcinoma], 11; LAML[Acute Myeloid Leukemia], 12; LUAD[Lung adenocarcinoma], 13; LUSC[Lung squamous cell carcinoma], 14; OV[Ovarian serous cystadenocarcinoma ], 15; PAAD[Pancreatic adenocarcinoma], 16; PRAD[Prostate adenocarcinoma], 17; SKCM[Skin Cutaneous Melanoma], 18:STAD[Stomach adenocarcinoma], 19:THCA[Thyroid carcinoma], 20:UCEC[Uterine Corpus Endometrial Carcinoma]) |
| Top |
| * We represented just top 10 SNVs. When you move the cursor on each content, you can see more deailed mutation information on the Tooltip. Those are primary_site, primary_histology, mutation(aa), pubmedID. |
| Genomic Position | Mutation(aa) | Unique sampleID count |
| chr10:95791437 | p.D212Y,PLCE1 | 3 |
| chr10:95790940 | p.E1883K,PLCE1 | 3 |
| chr10:96084175 | p.R46Q,PLCE1 | 3 |
| chr10:96084290 | p.R1126Q,PLCE1 | 2 |
| chr10:96006017 | p.S903S,PLCE1 | 2 |
| chr10:96018889 | p.D216N,PLCE1 | 2 |
| chr10:95791100 | p.S1176L,PLCE1 | 2 |
| chr10:96044656 | p.E1349K,PLCE1 | 2 |
| chr10:96022410 | p.R1187Q,PLCE1 | 2 |
| chr10:96028705 | p.N604S,PLCE1 | 2 |
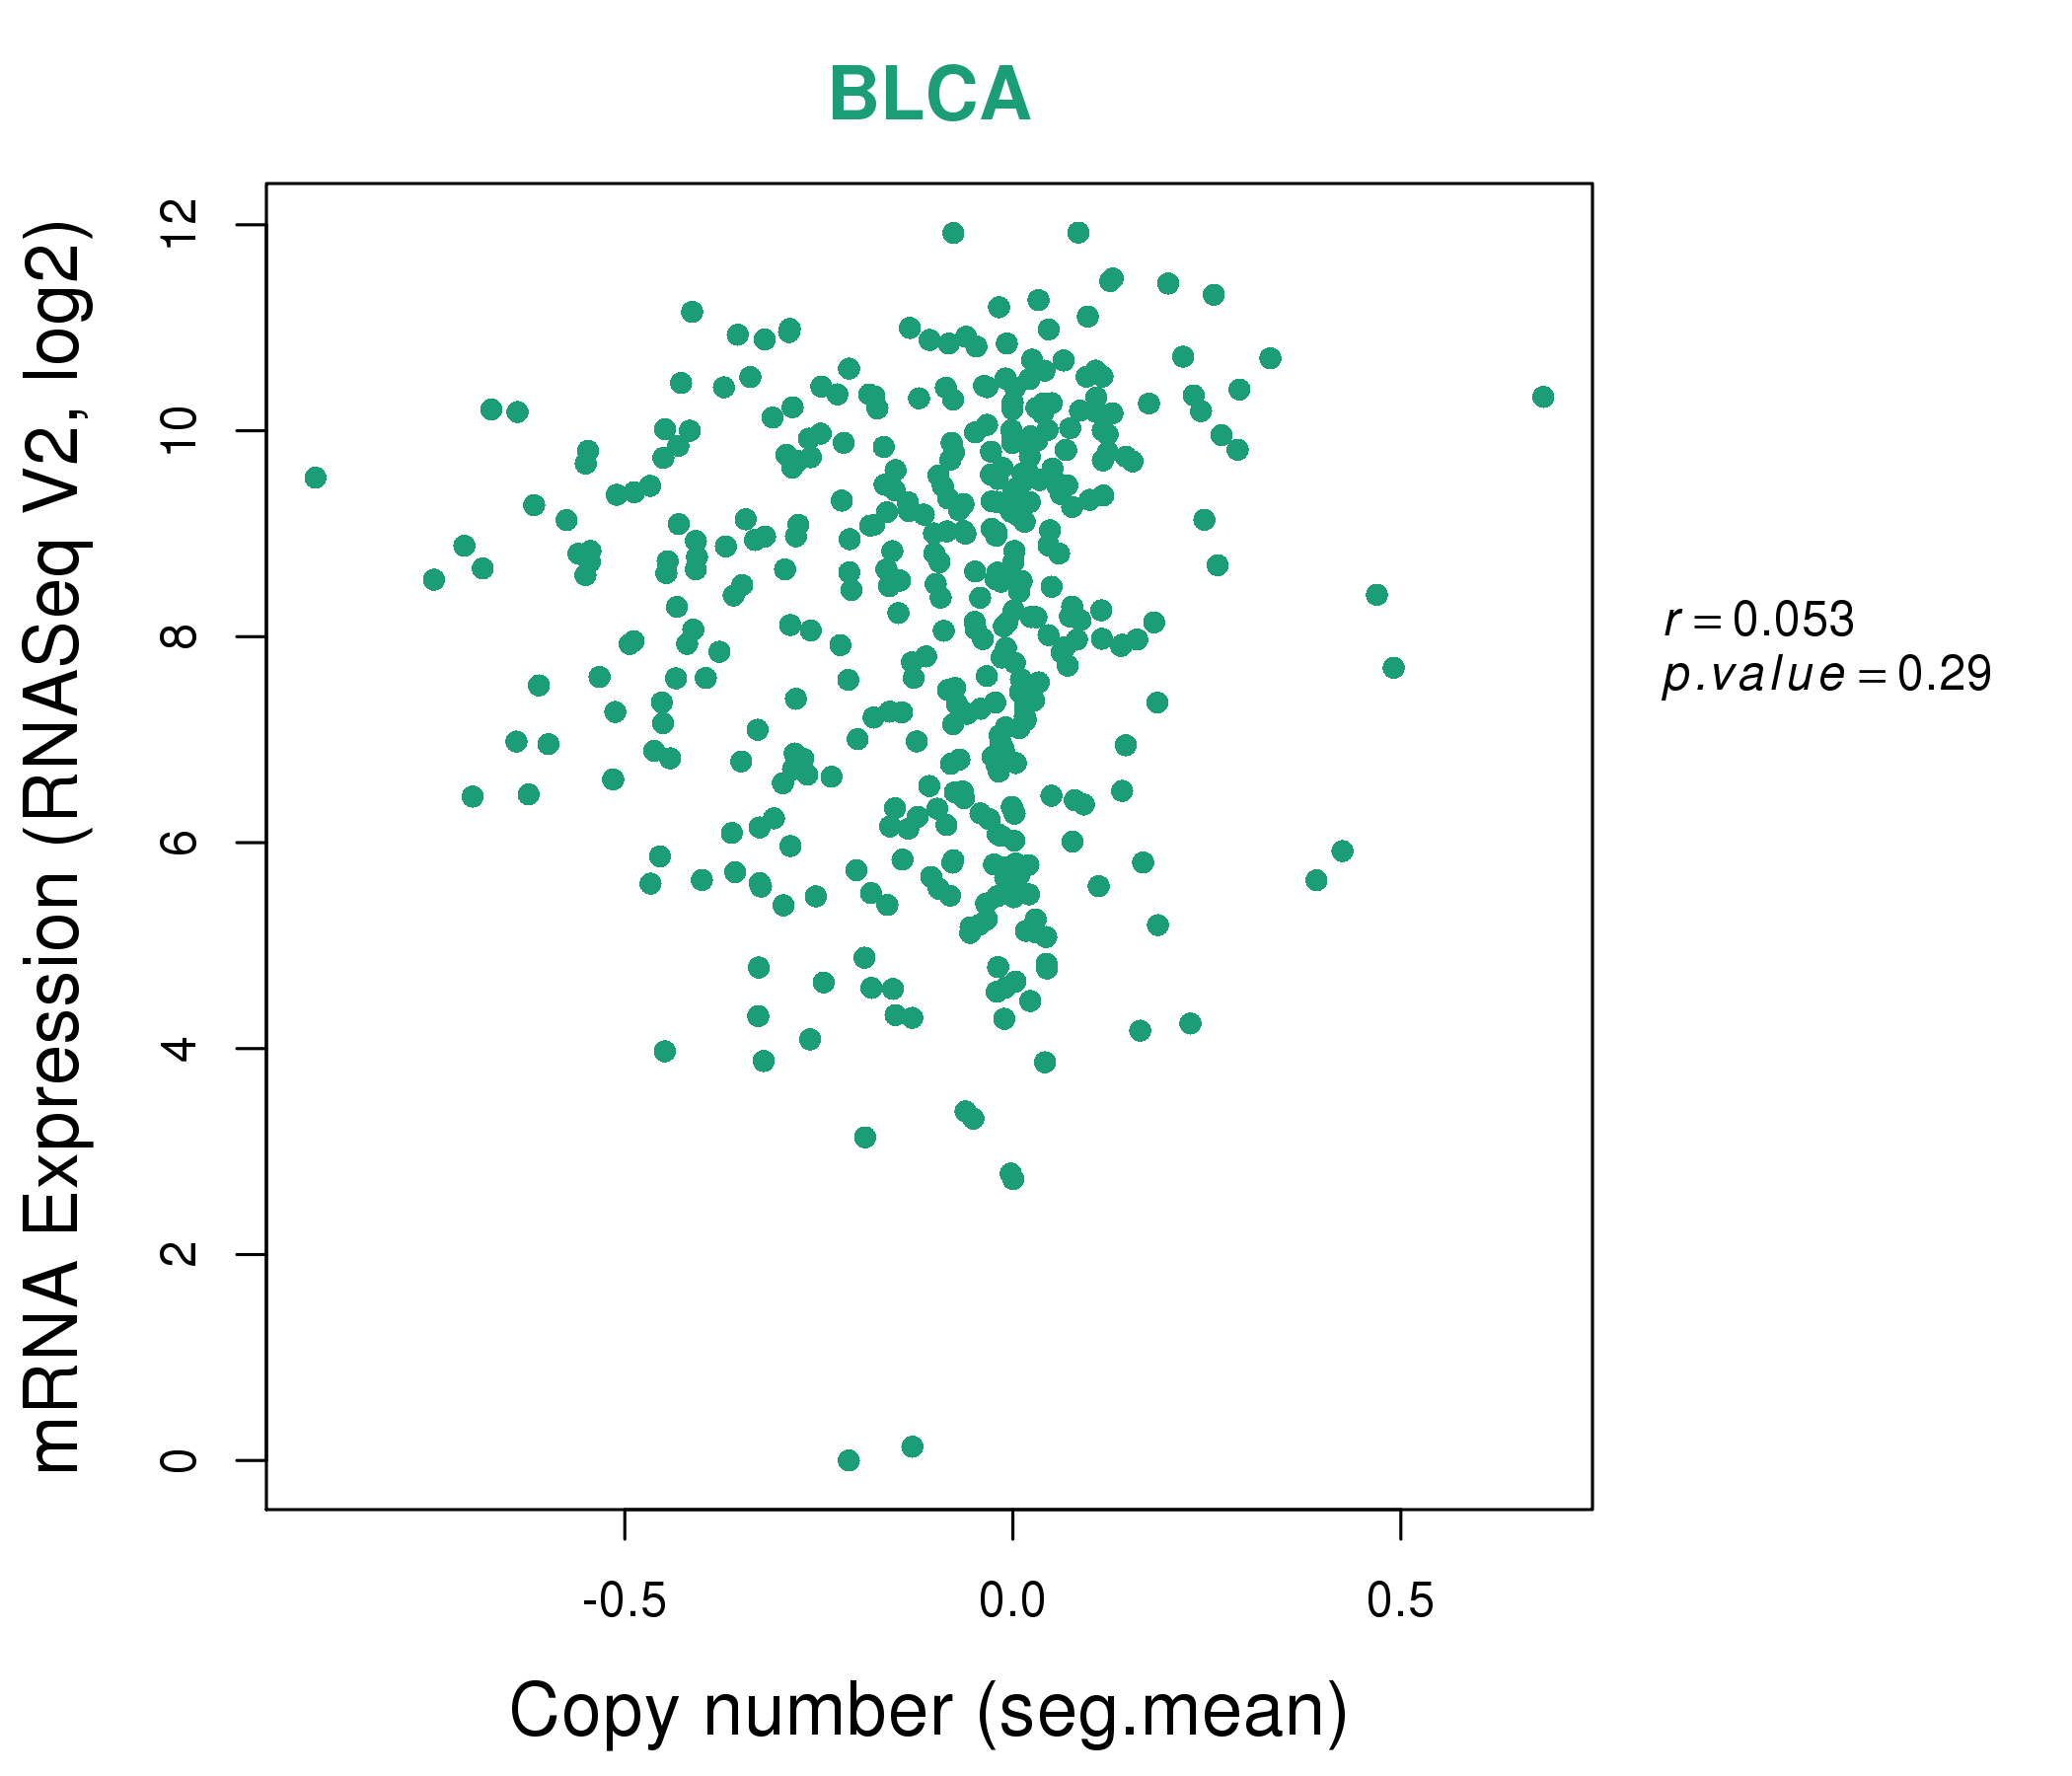
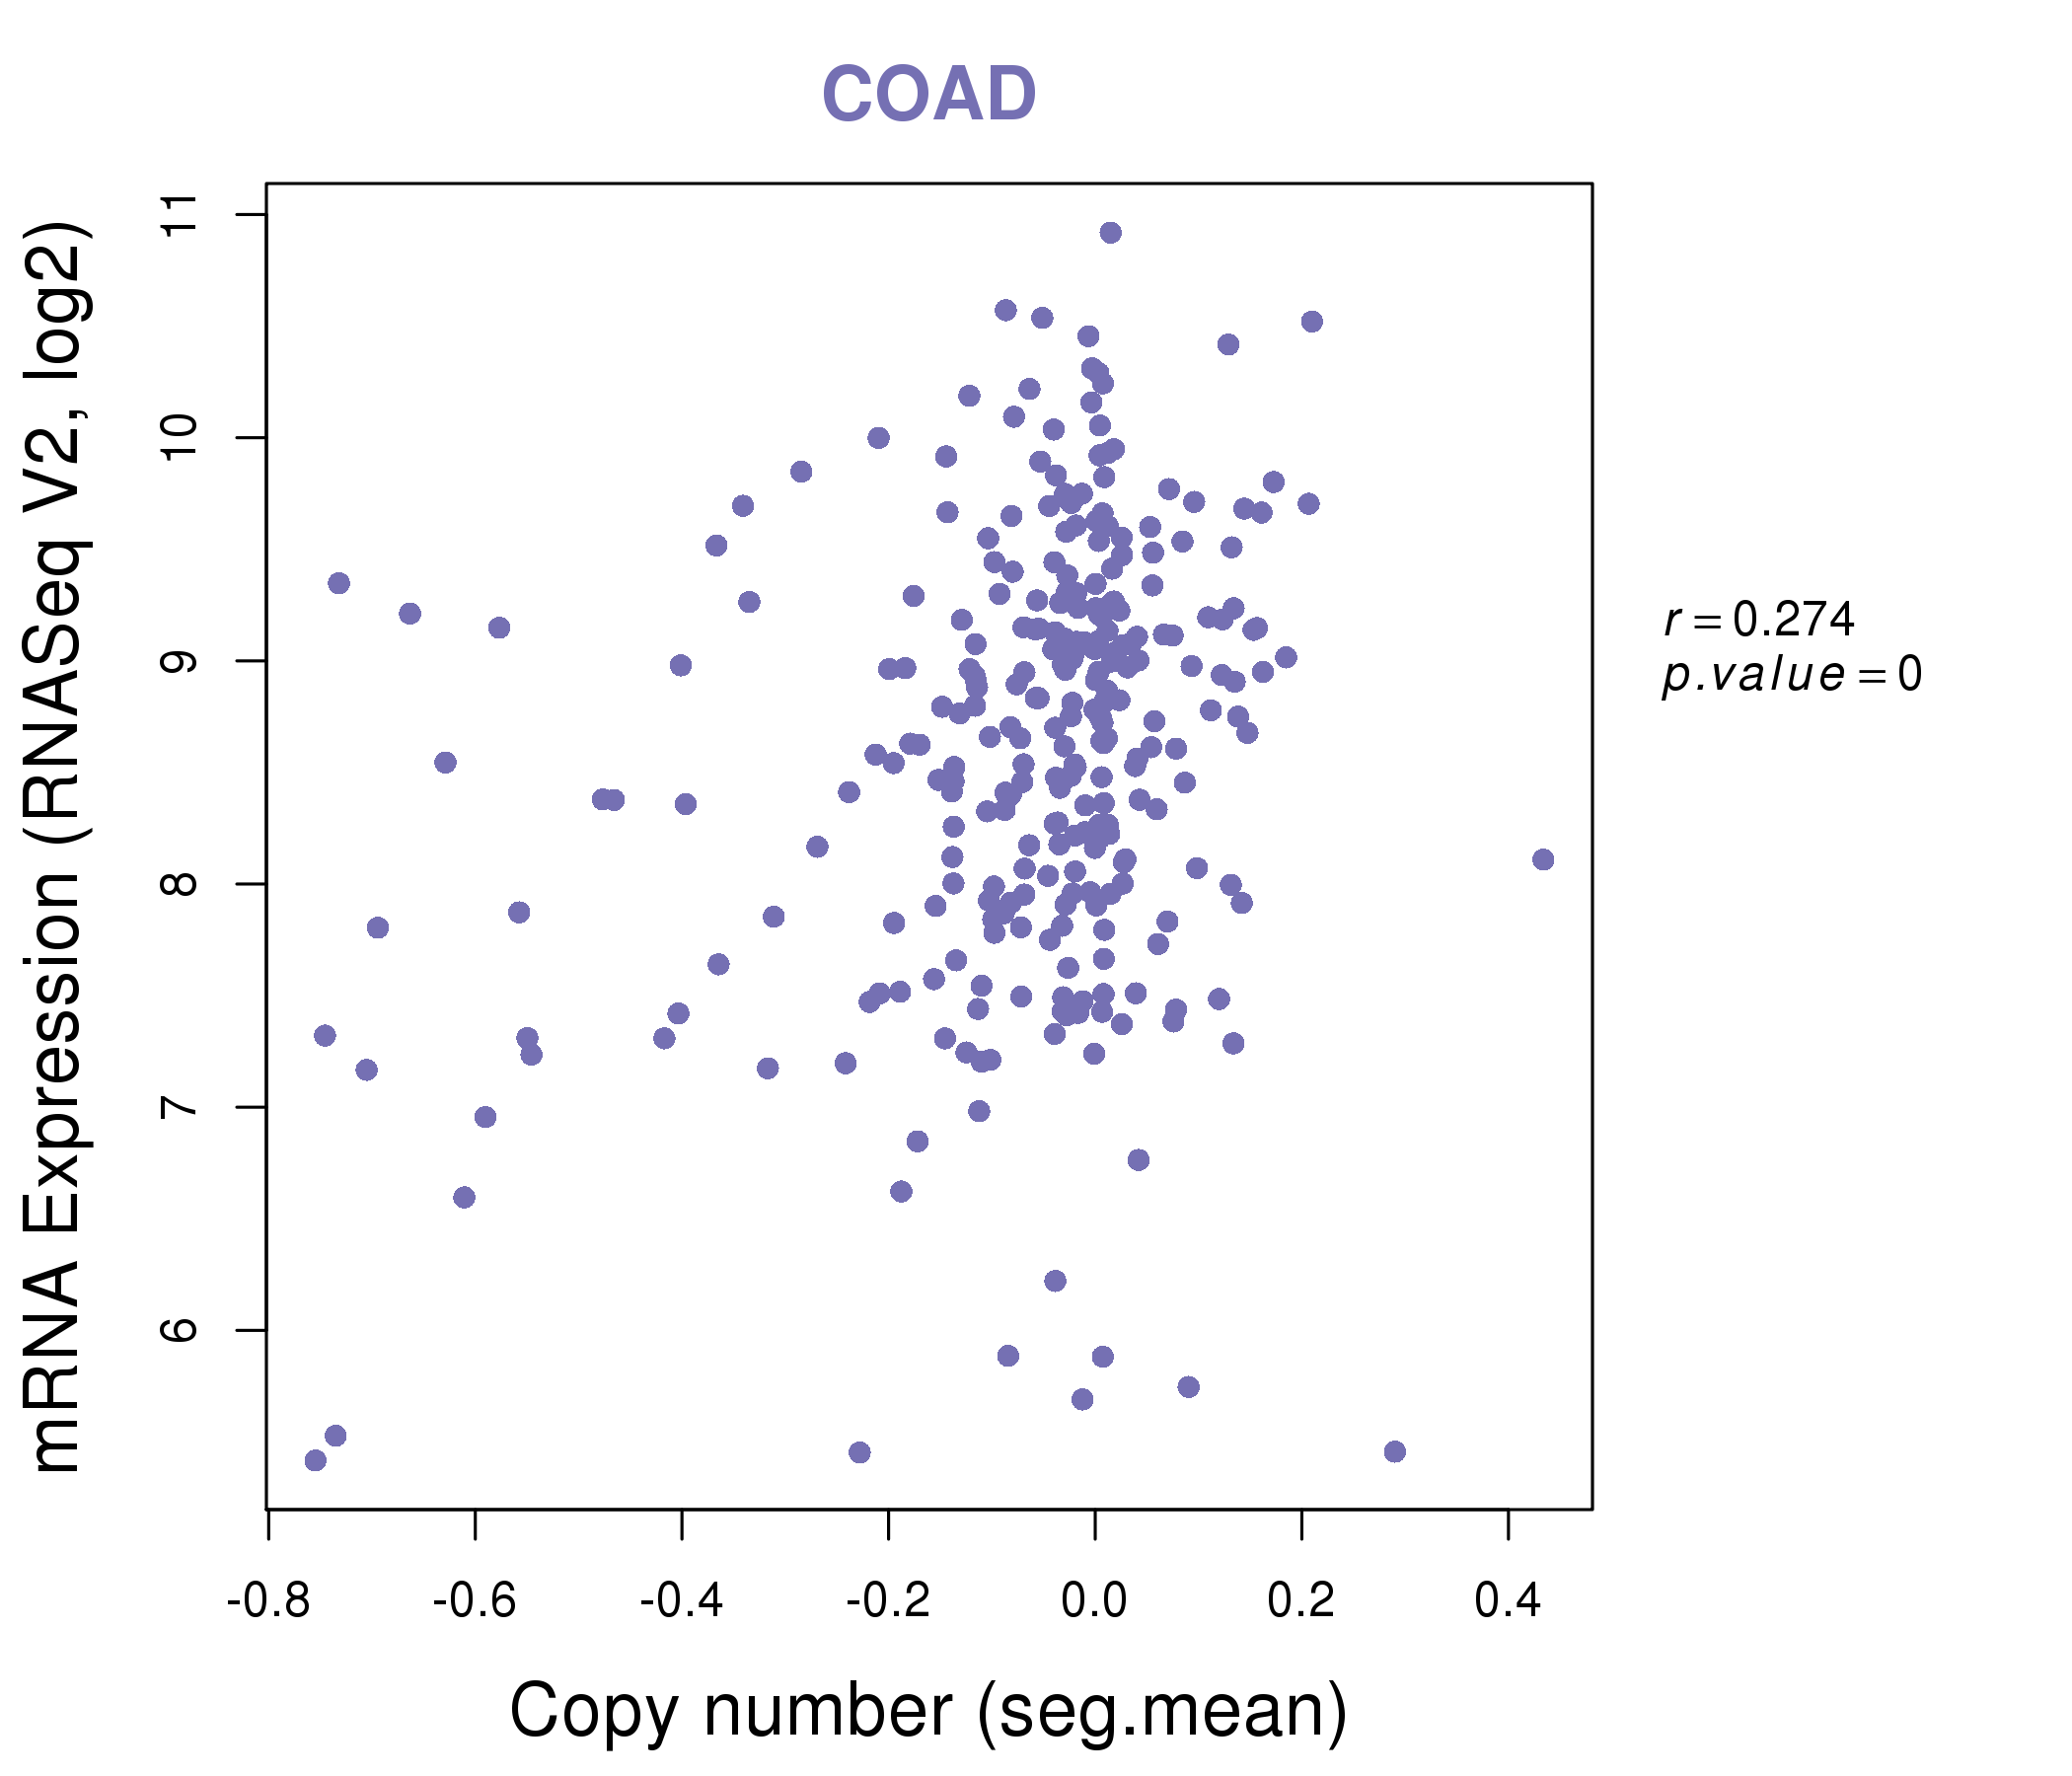
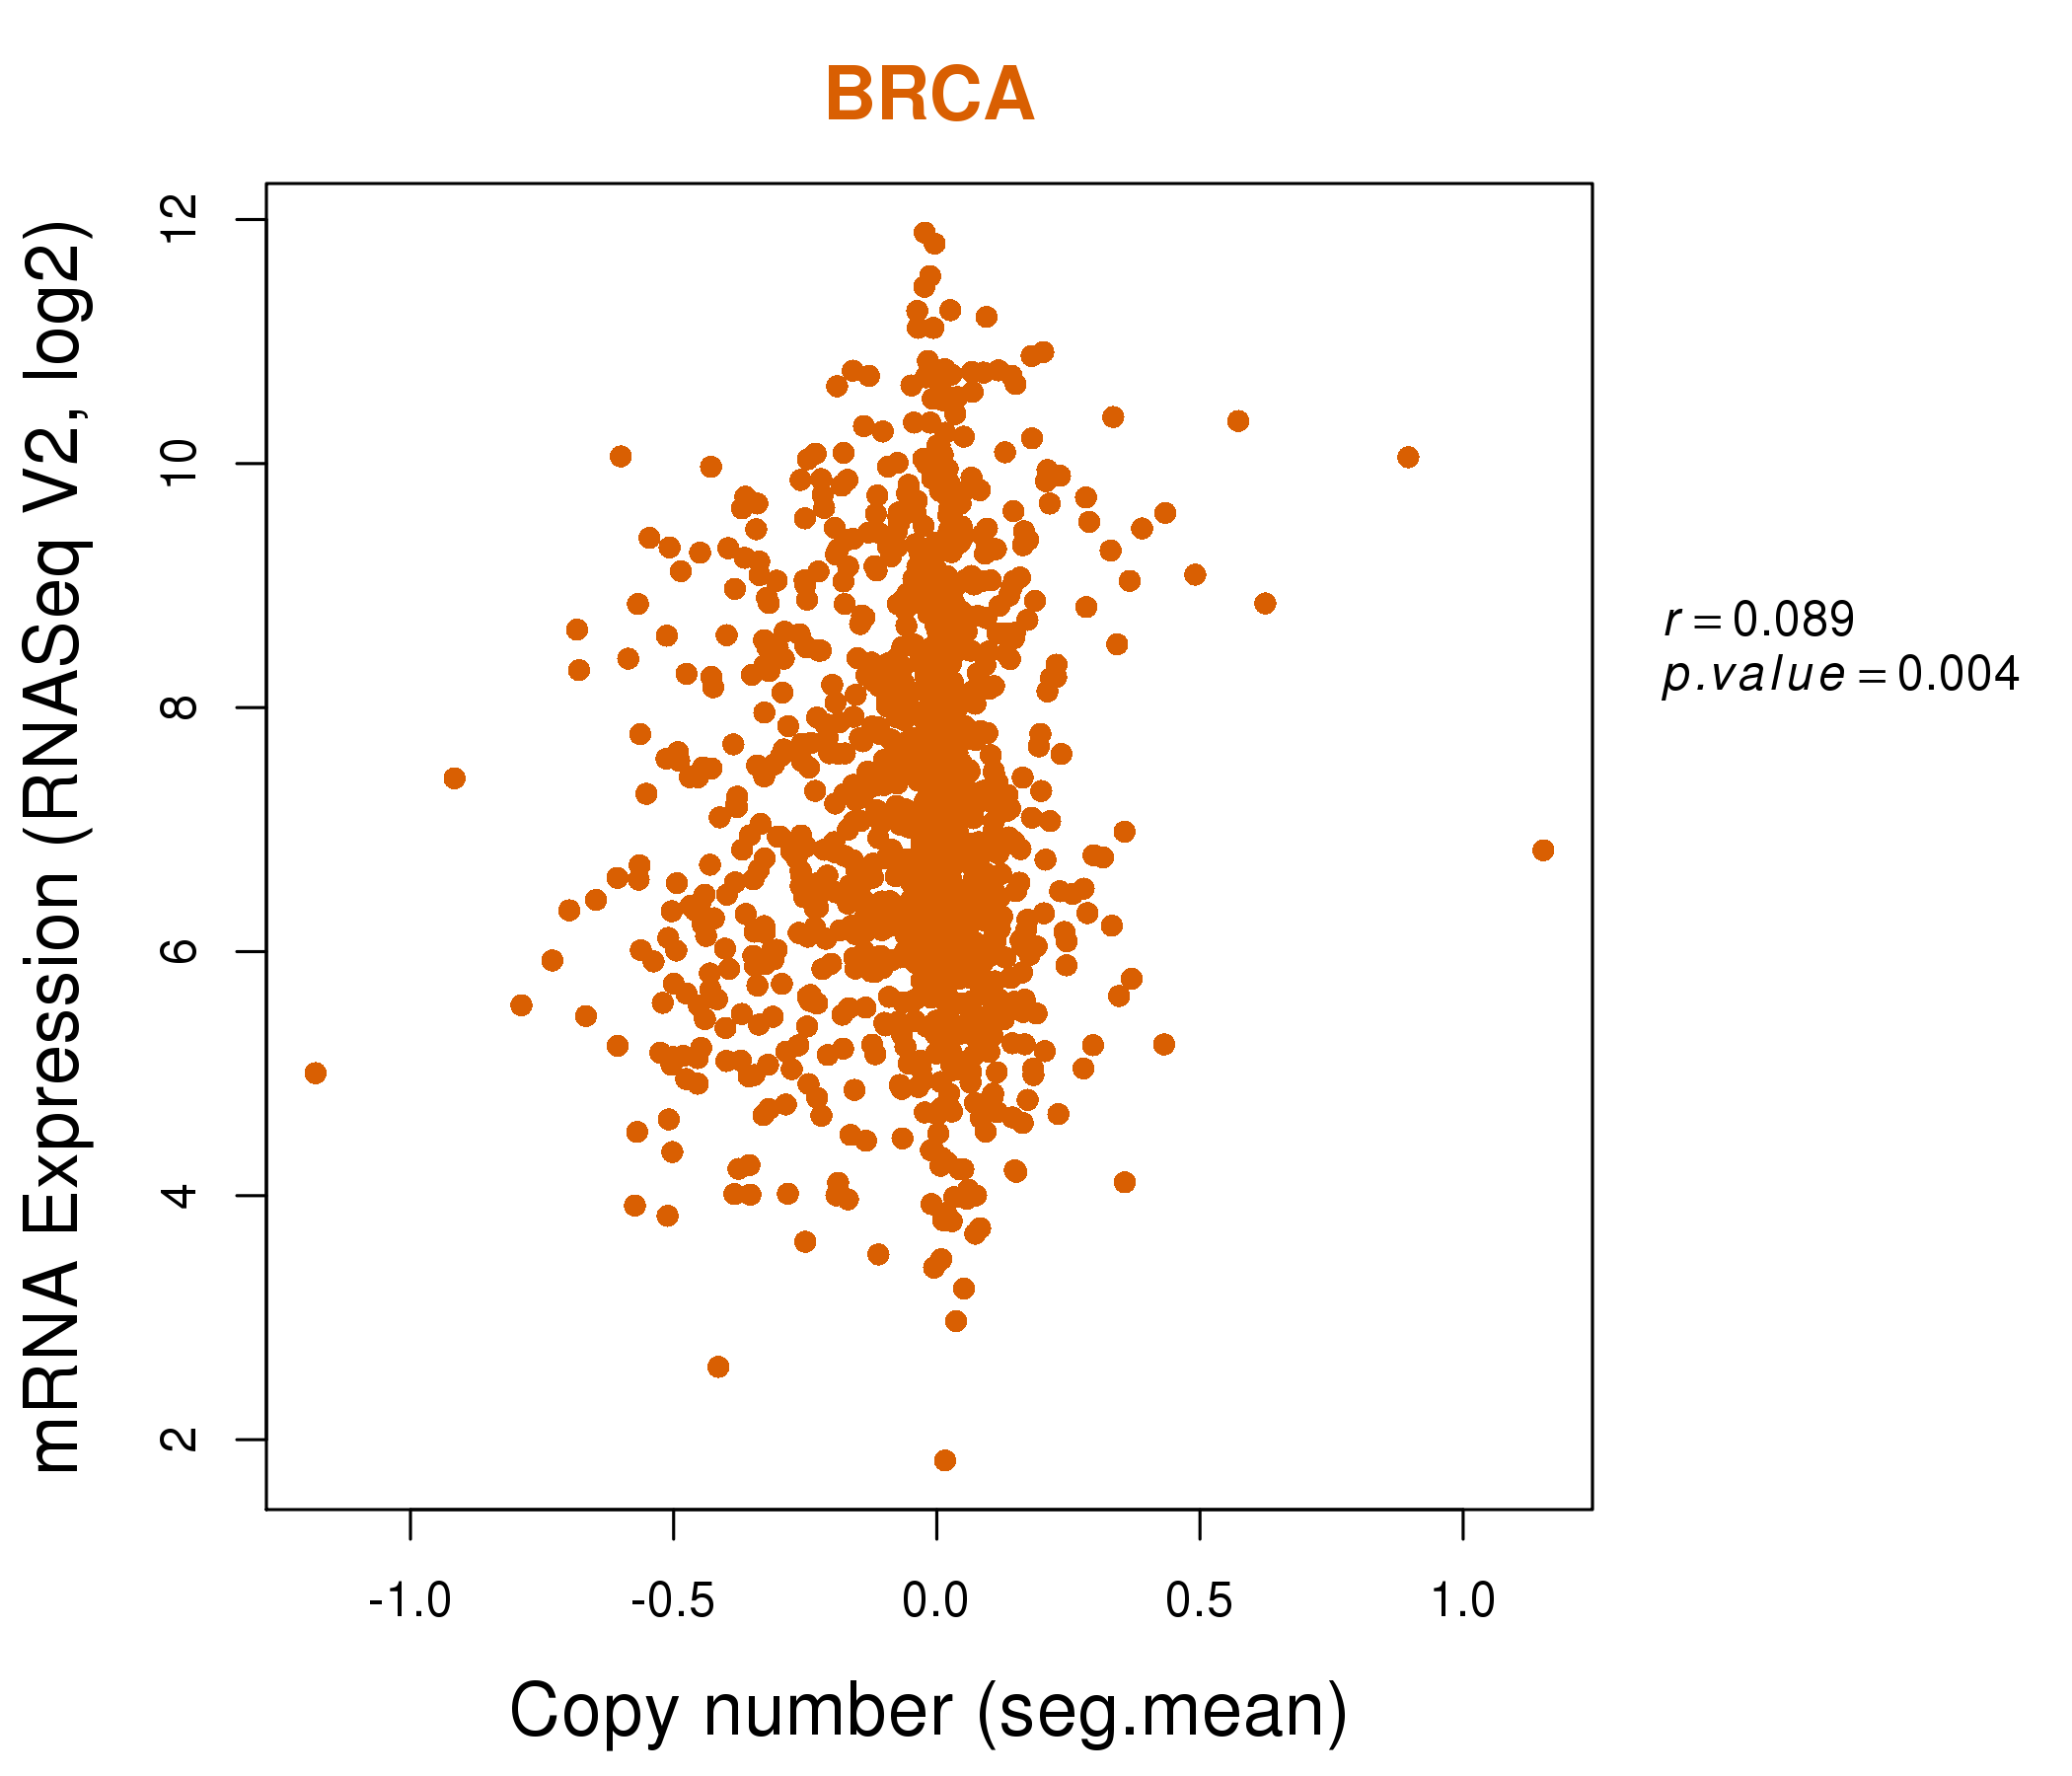
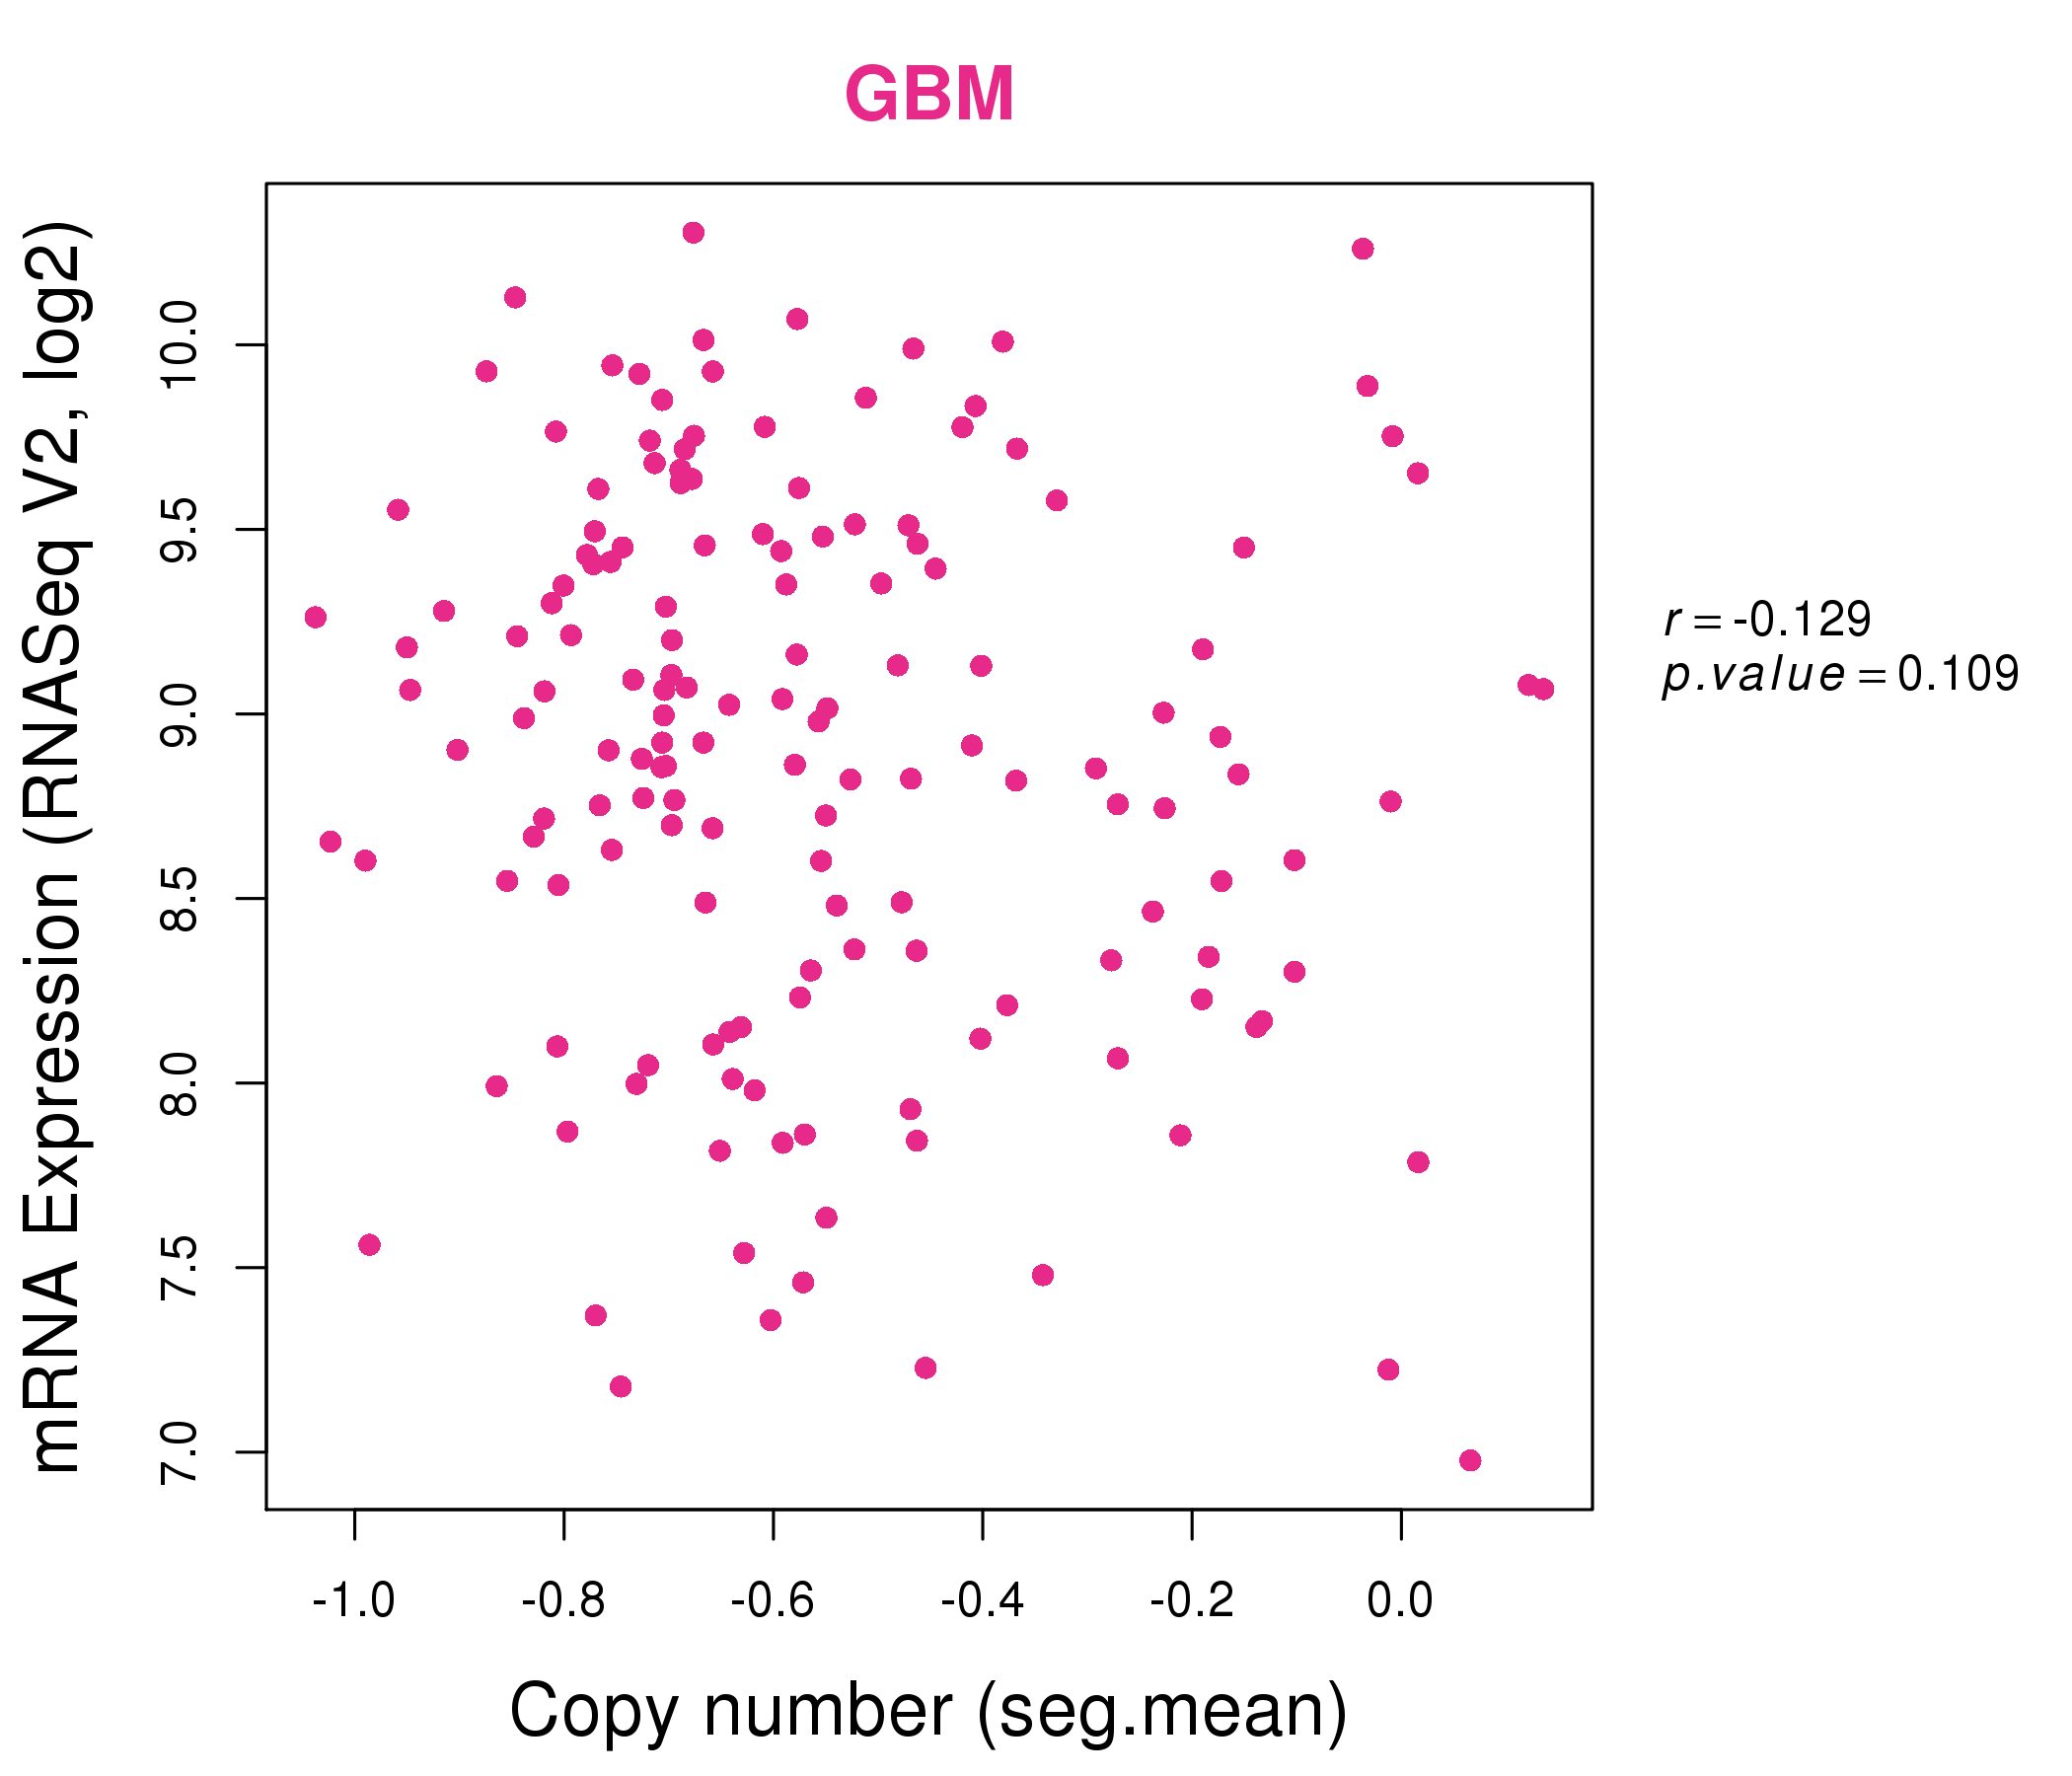
| * Copy number data were extracted from TCGA using R package TCGA-Assembler. The URLs of all public data files on TCGA DCC data server were gathered on Jan-05-2015. Function ProcessCNAData in TCGA-Assembler package was used to obtain gene-level copy number value which is calculated as the average copy number of the genomic region of a gene. |
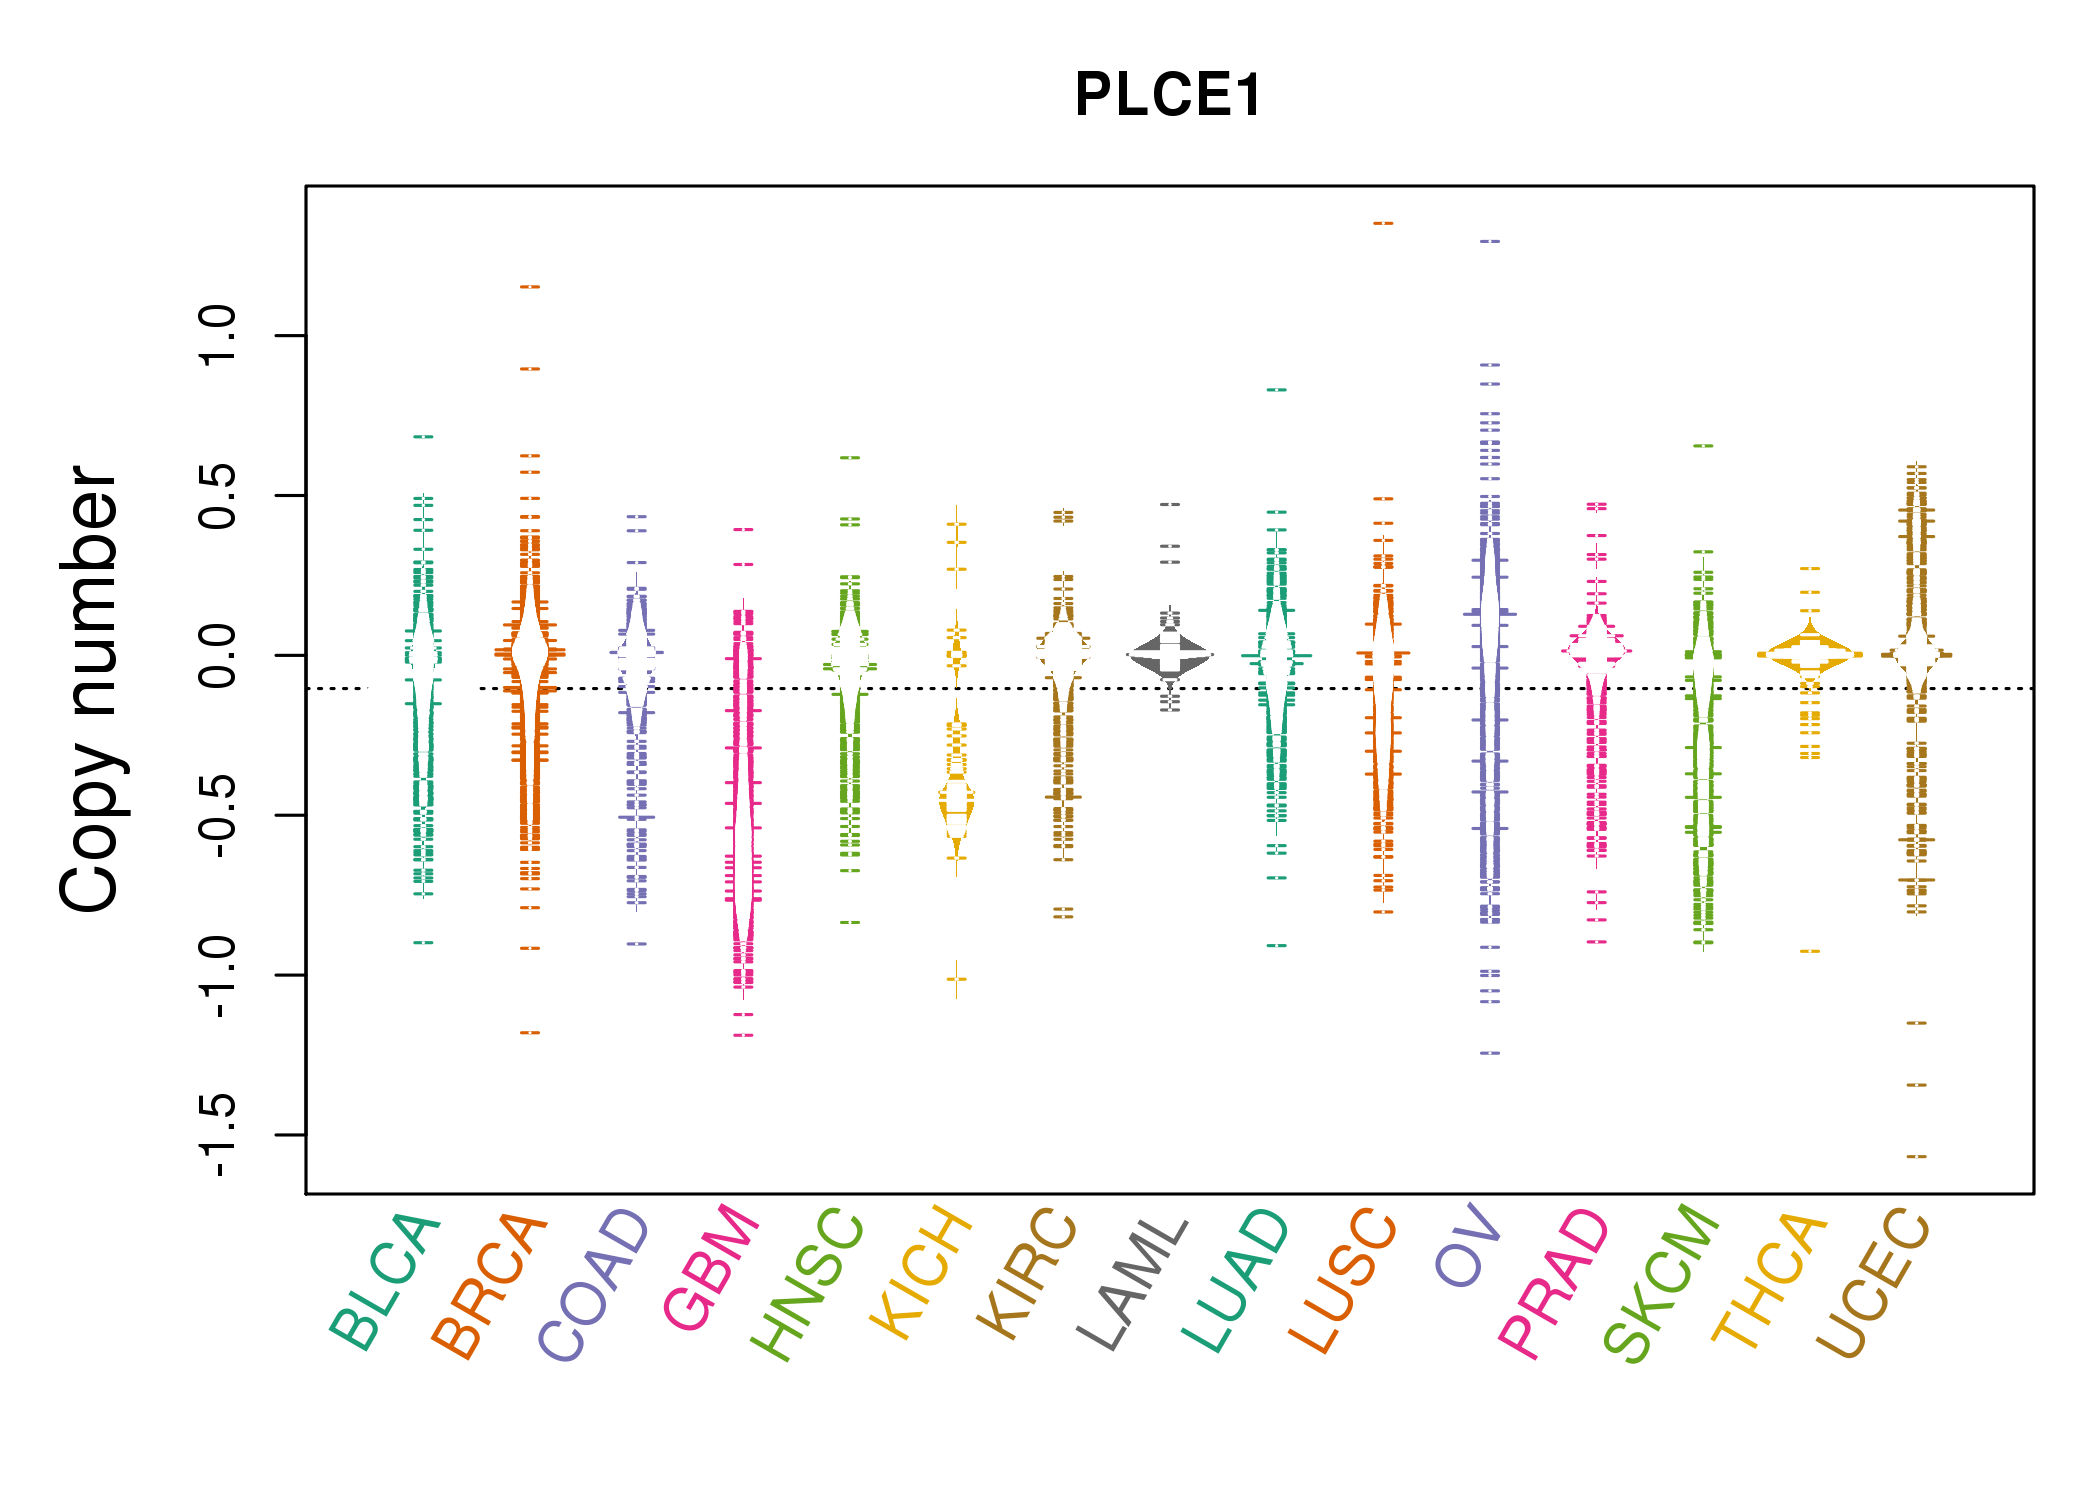 |
| cf) Tissue ID[Tissue type]: BLCA[Bladder Urothelial Carcinoma], BRCA[Breast invasive carcinoma], CESC[Cervical squamous cell carcinoma and endocervical adenocarcinoma], COAD[Colon adenocarcinoma], GBM[Glioblastoma multiforme], Glioma Low Grade, HNSC[Head and Neck squamous cell carcinoma], KICH[Kidney Chromophobe], KIRC[Kidney renal clear cell carcinoma], KIRP[Kidney renal papillary cell carcinoma], LAML[Acute Myeloid Leukemia], LUAD[Lung adenocarcinoma], LUSC[Lung squamous cell carcinoma], OV[Ovarian serous cystadenocarcinoma ], PAAD[Pancreatic adenocarcinoma], PRAD[Prostate adenocarcinoma], SKCM[Skin Cutaneous Melanoma], STAD[Stomach adenocarcinoma], THCA[Thyroid carcinoma], UCEC[Uterine Corpus Endometrial Carcinoma] |
| Top |
| Gene Expression for PLCE1 |
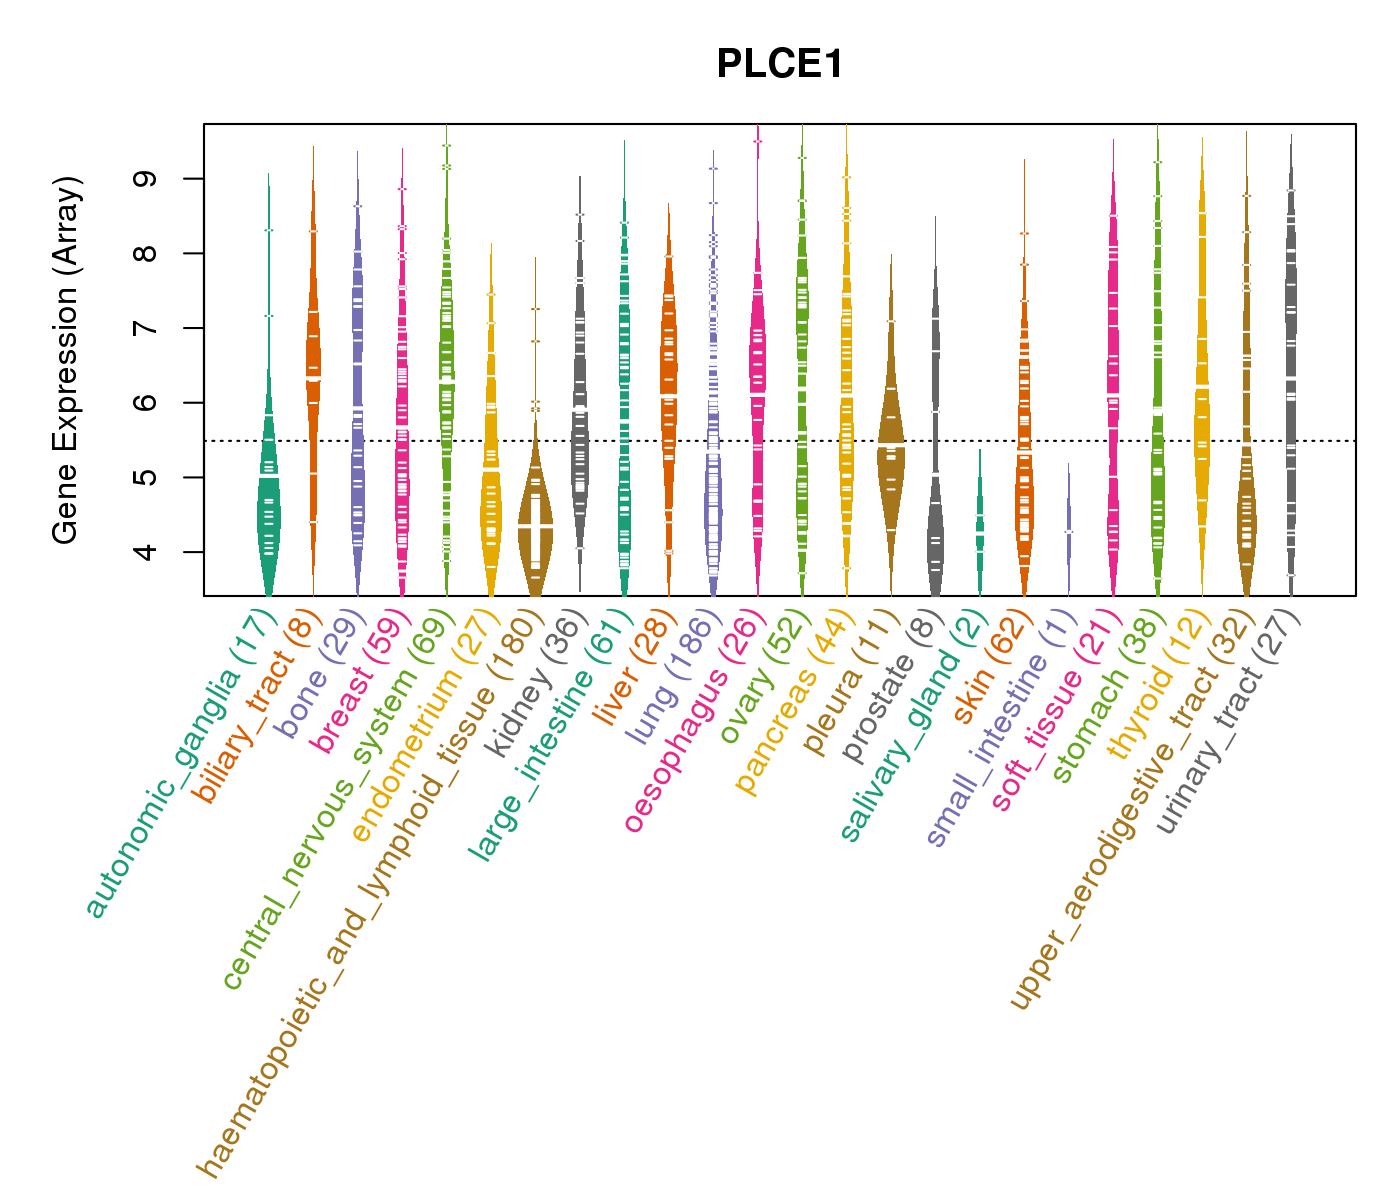
| * CCLE gene expression data were extracted from CCLE_Expression_Entrez_2012-10-18.res: Gene-centric RMA-normalized mRNA expression data. |
 |
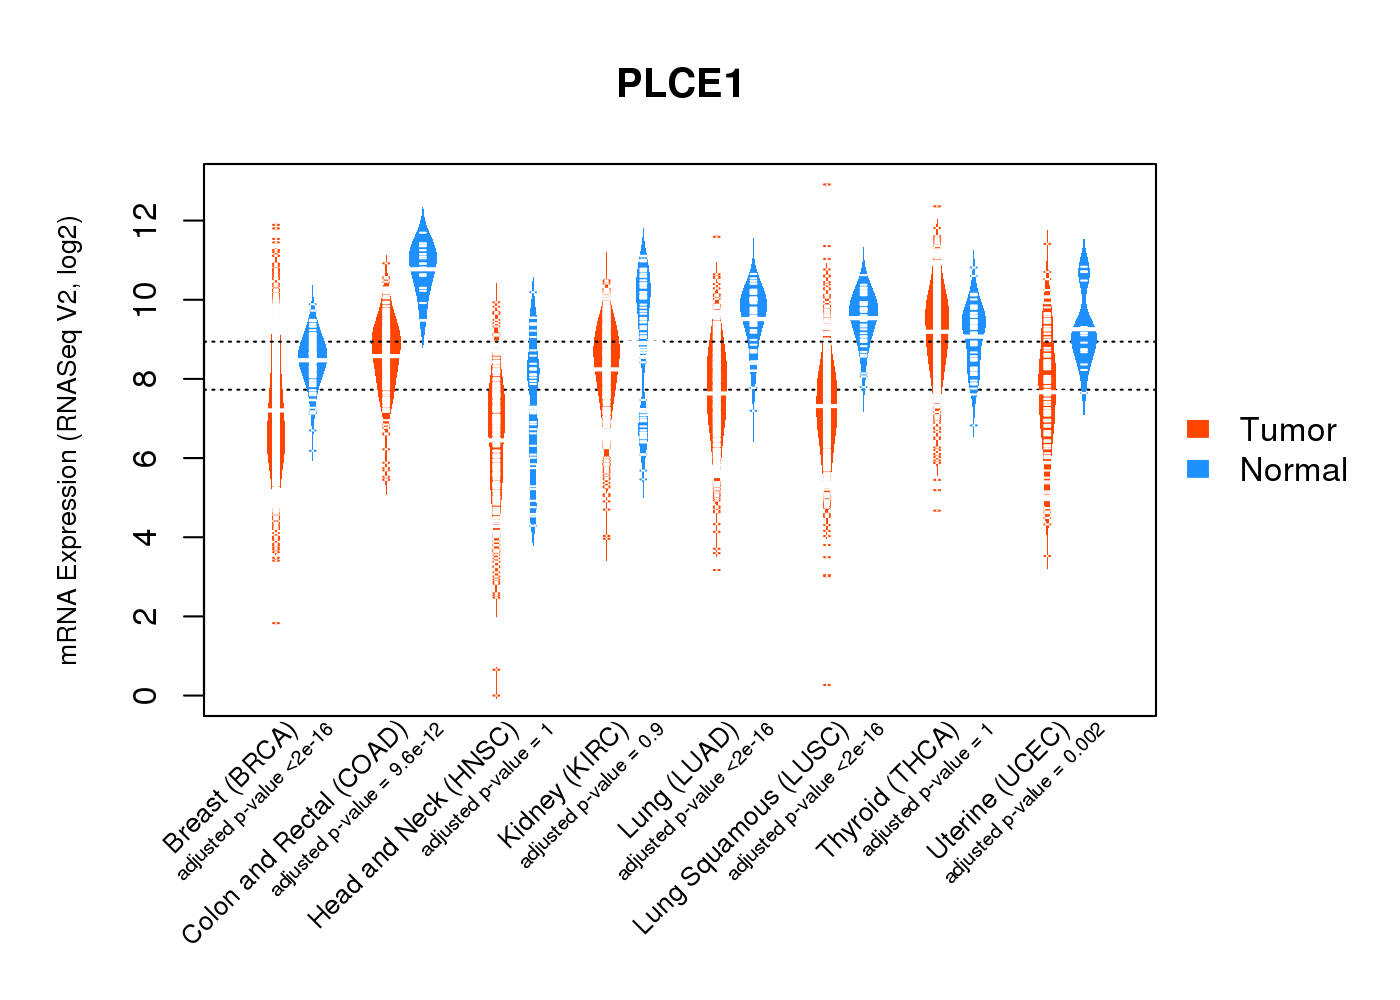
| * Normalized gene expression data of RNASeqV2 was extracted from TCGA using R package TCGA-Assembler. The URLs of all public data files on TCGA DCC data server were gathered at Jan-05-2015. Only eight cancer types have enough normal control samples for differential expression analysis. (t test, adjusted p<0.05 (using Benjamini-Hochberg FDR)) |
 |
| Top |
| * This plots show the correlation between CNV and gene expression. |
: Open all plots for all cancer types
 |
|
 |
|
| Top |
| Gene-Gene Network Information |
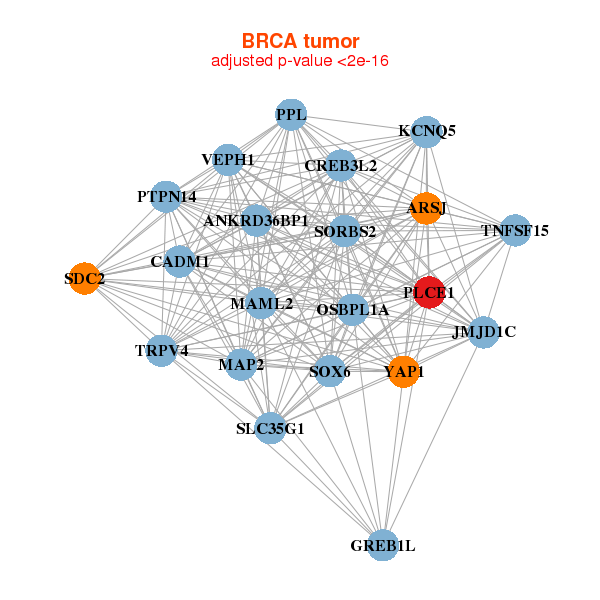
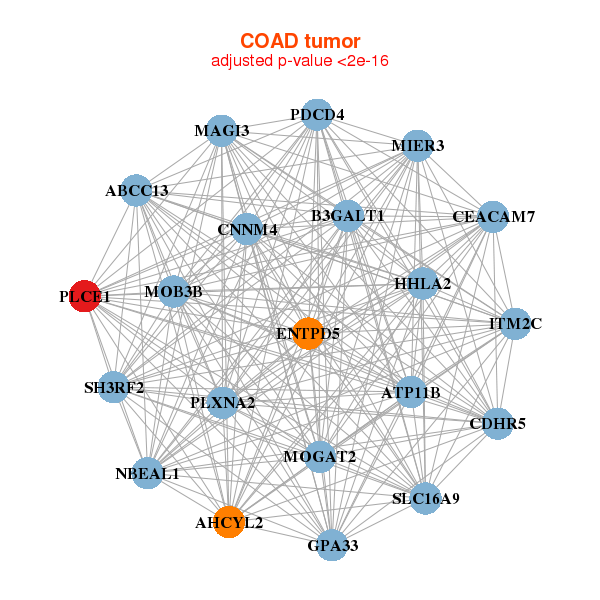
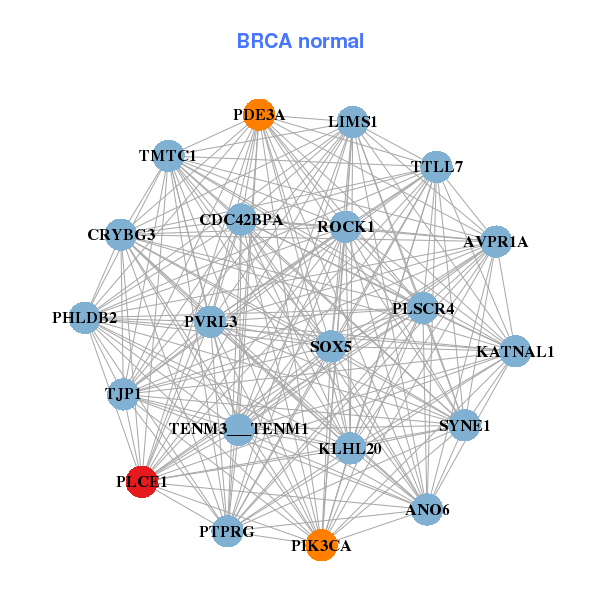
| * Co-Expression network figures were drawn using R package igraph. Only the top 20 genes with the highest correlations were shown. Red circle: input gene, orange circle: cell metabolism gene, sky circle: other gene |
: Open all plots for all cancer types
 |
| ||||
| ANKRD36BP1,ARSJ,CADM1,CREB3L2,GREB1L,JMJD1C,KCNQ5, MAML2,MAP2,OSBPL1A,PLCE1,PPL,PTPN14,SDC2, SORBS2,SOX6,SLC35G1,TNFSF15,TRPV4,VEPH1,YAP1 | ANO6,AVPR1A,CDC42BPA,CRYBG3,KATNAL1,KLHL20,LIMS1, TENM3___TENM1,PDE3A,PHLDB2,PIK3CA,PLCE1,PLSCR4,PTPRG, PVRL3,ROCK1,SOX5,SYNE1,TJP1,TMTC1,TTLL7 | ||||
 |
| ||||
| ABCC13,AHCYL2,ATP11B,B3GALT1,CDHR5,CEACAM7,CNNM4, ENTPD5,GPA33,HHLA2,ITM2C,MAGI3,MIER3,MOB3B, MOGAT2,NBEAL1,PDCD4,PLCE1,PLXNA2,SH3RF2,SLC16A9 | ABCC3,ATP8B1,PRR14L,CLMN,DNAJC16,FRYL,FZD5, HIPK2,LARP4B,MAGI3,MAVS,MED14,NBEAL1,PLCE1, PLEKHA6,PRSS12,RREB1,SATB2,TMEM131,TRPM4,ZDHHC23 |

| * Co-Expression network figures were drawn using R package igraph. Only the top 20 genes with the highest correlations were shown. Red circle: input gene, orange circle: cell metabolism gene, sky circle: other gene |
: Open all plots for all cancer types
| Top |
: Open all interacting genes' information including KEGG pathway for all interacting genes from DAVID
| Top |
| Pharmacological Information for PLCE1 |
| DB Category | DB Name | DB's ID and Url link |
| Organism-specific databases | PharmGKB | PA33391; -. |
| Organism-specific databases | PharmGKB | PA33391; -. |
| Organism-specific databases | CTD | 51196; -. |
| Organism-specific databases | CTD | 51196; -. |
| * Gene Centered Interaction Network. |
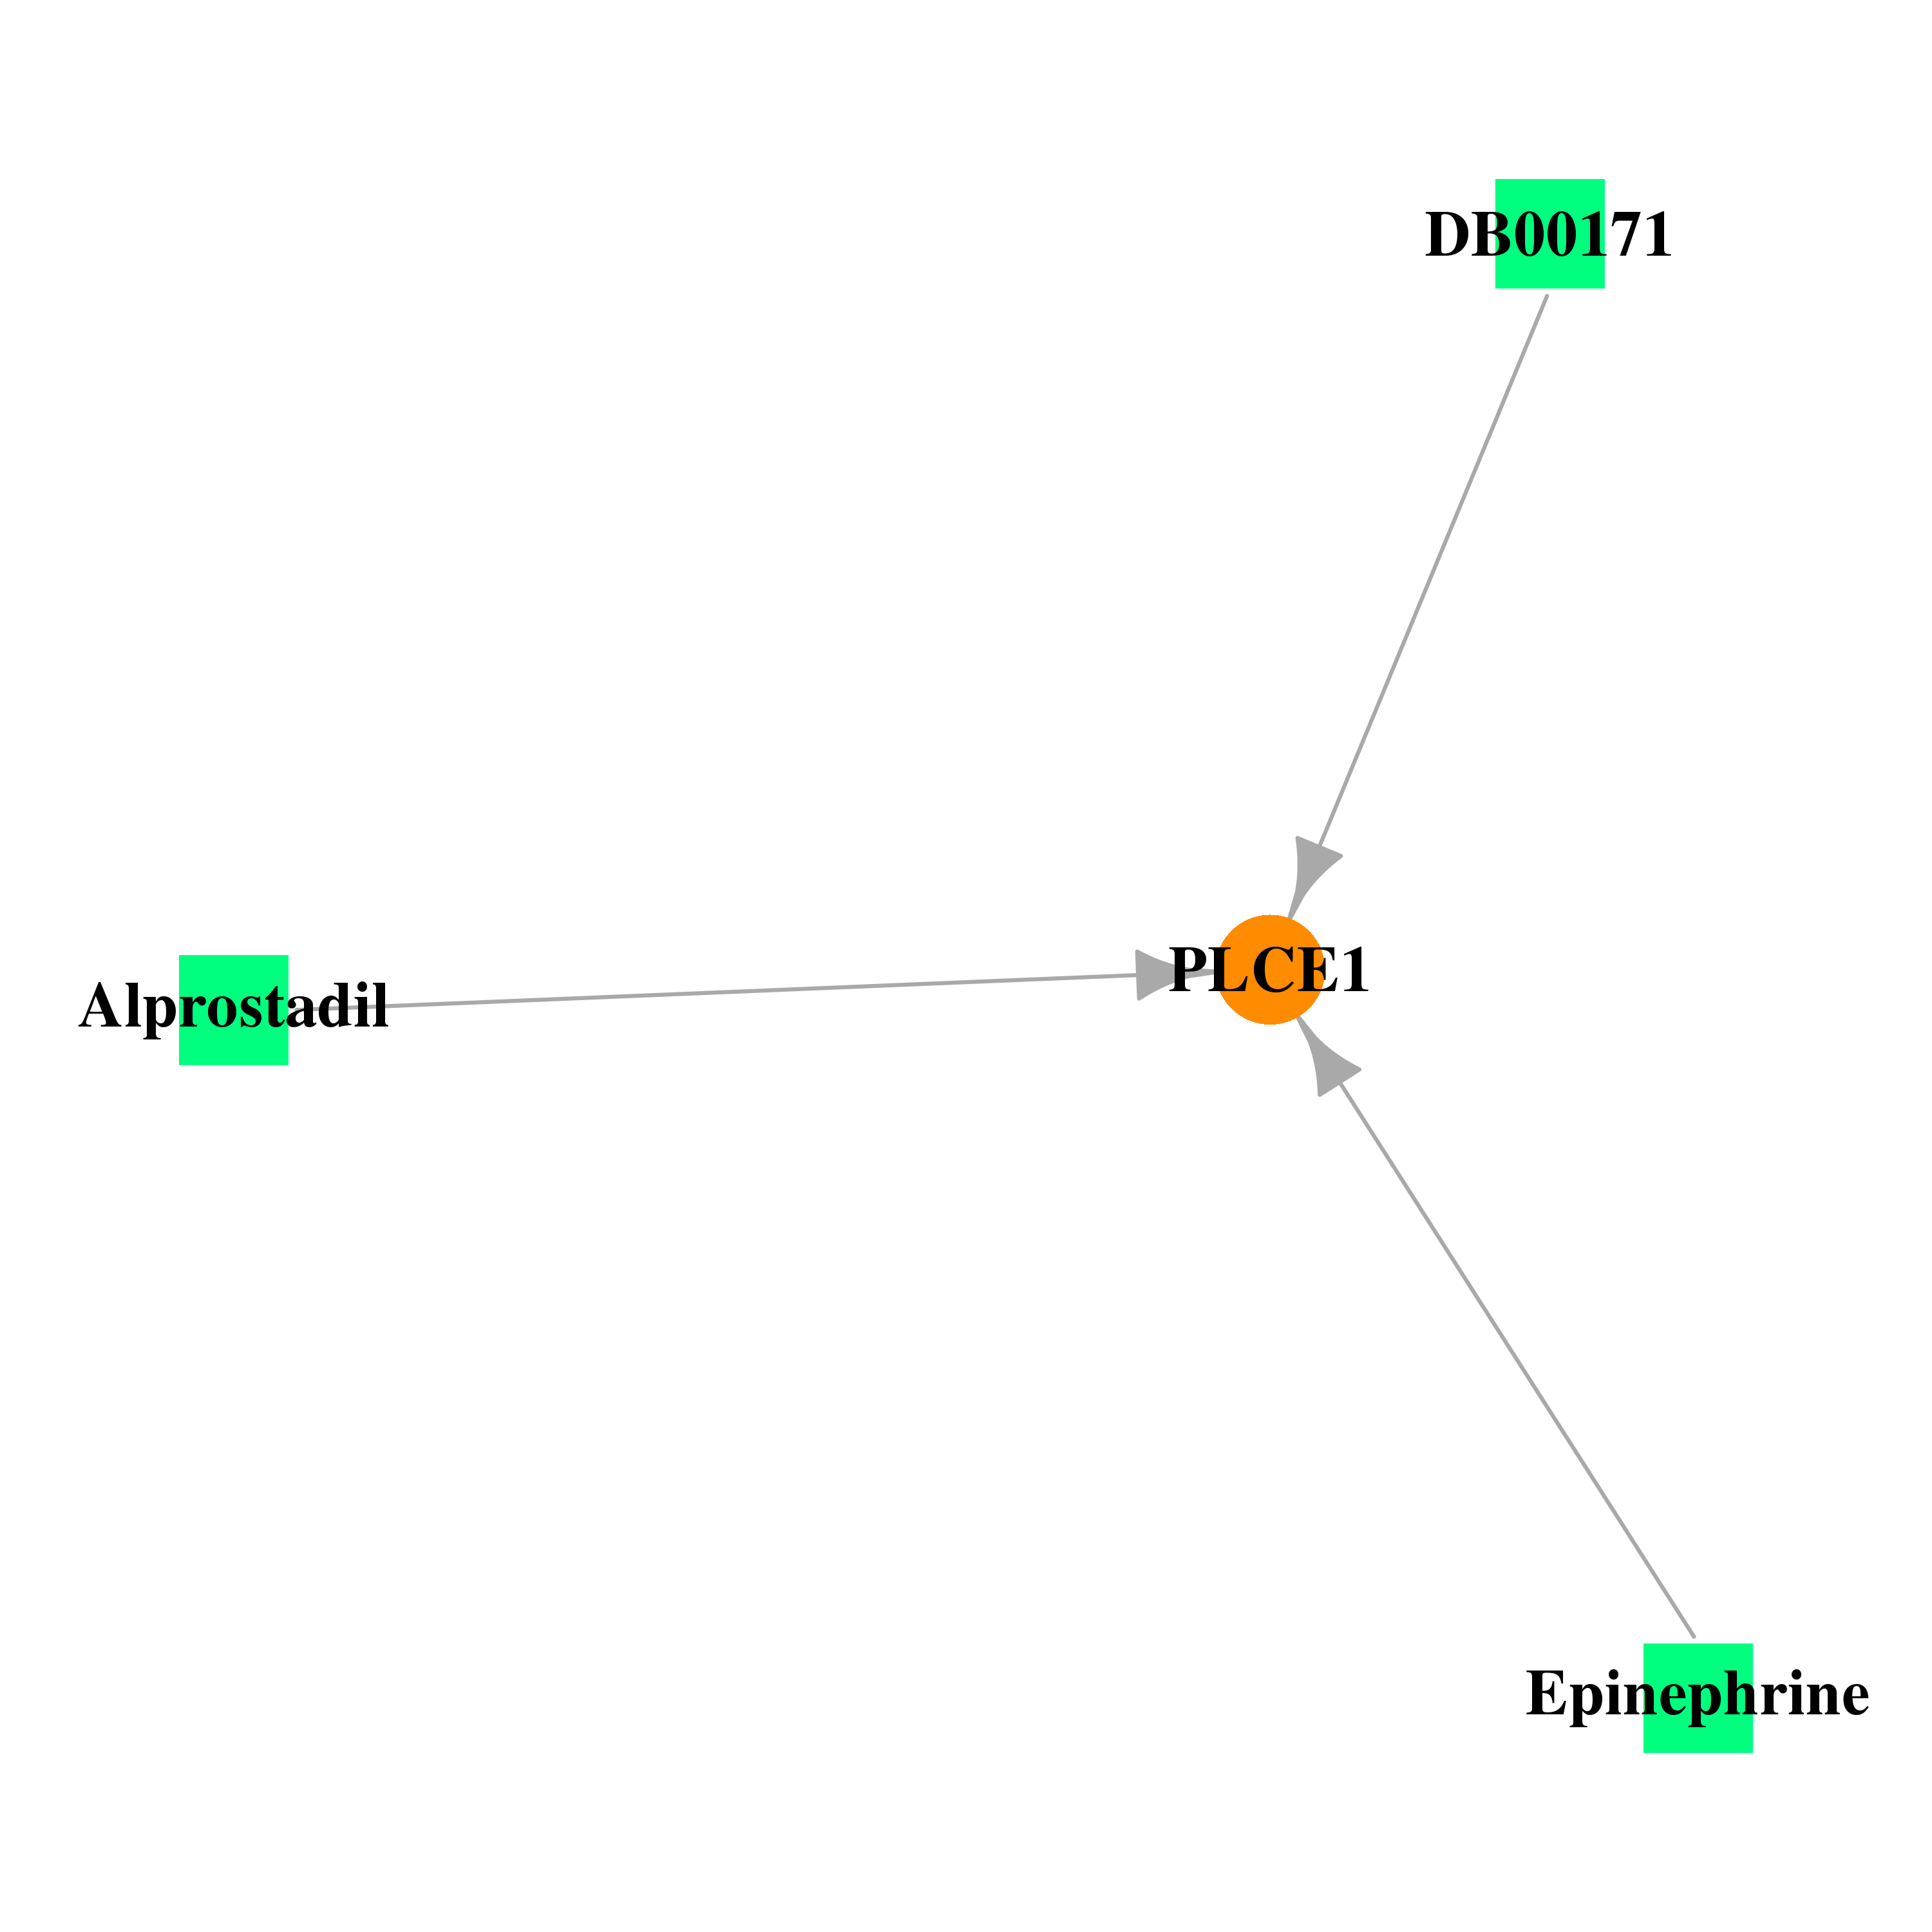 |
| * Drug Centered Interaction Network. |
| DrugBank ID | Target Name | Drug Groups | Generic Name | Drug Centered Network | Drug Structure |
| DB00171 | phospholipase C, epsilon 1 | approved; nutraceutical | Adenosine triphosphate |  |  |
| DB00770 | phospholipase C, epsilon 1 | approved; investigational | Alprostadil | 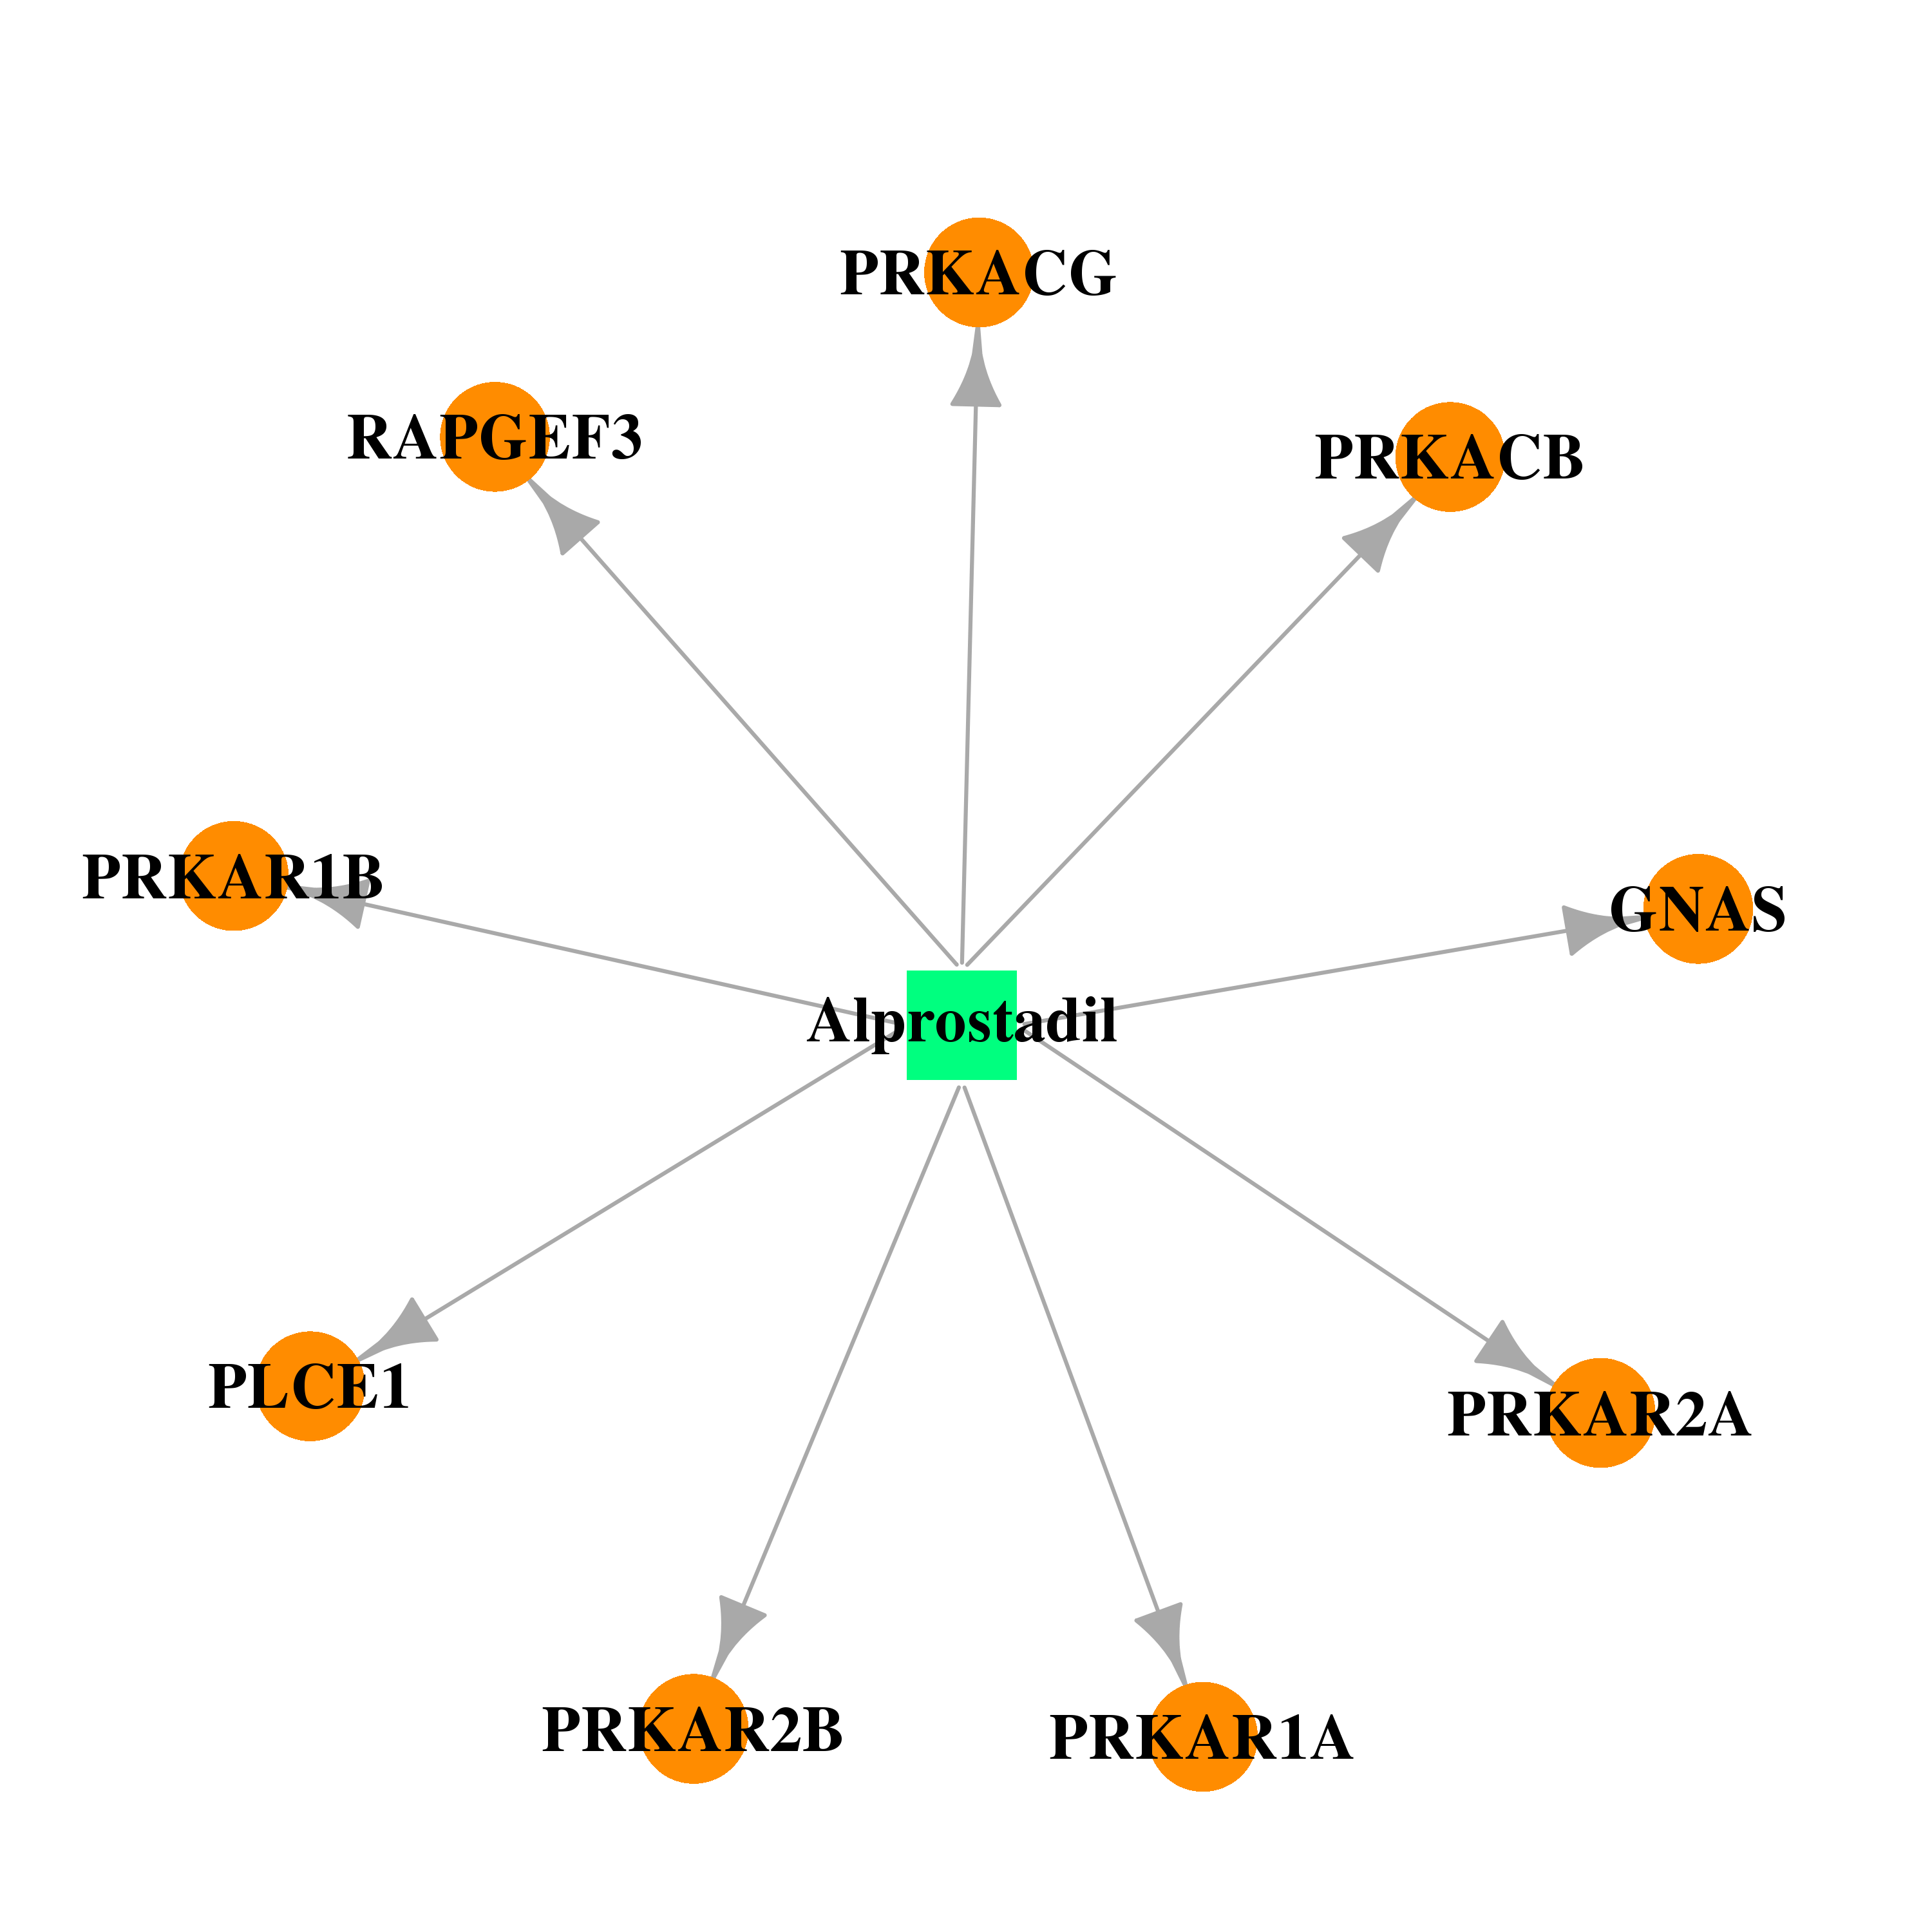 | 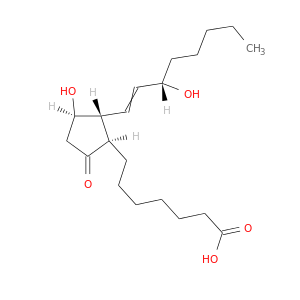 |
| DB00668 | phospholipase C, epsilon 1 | approved | Epinephrine | 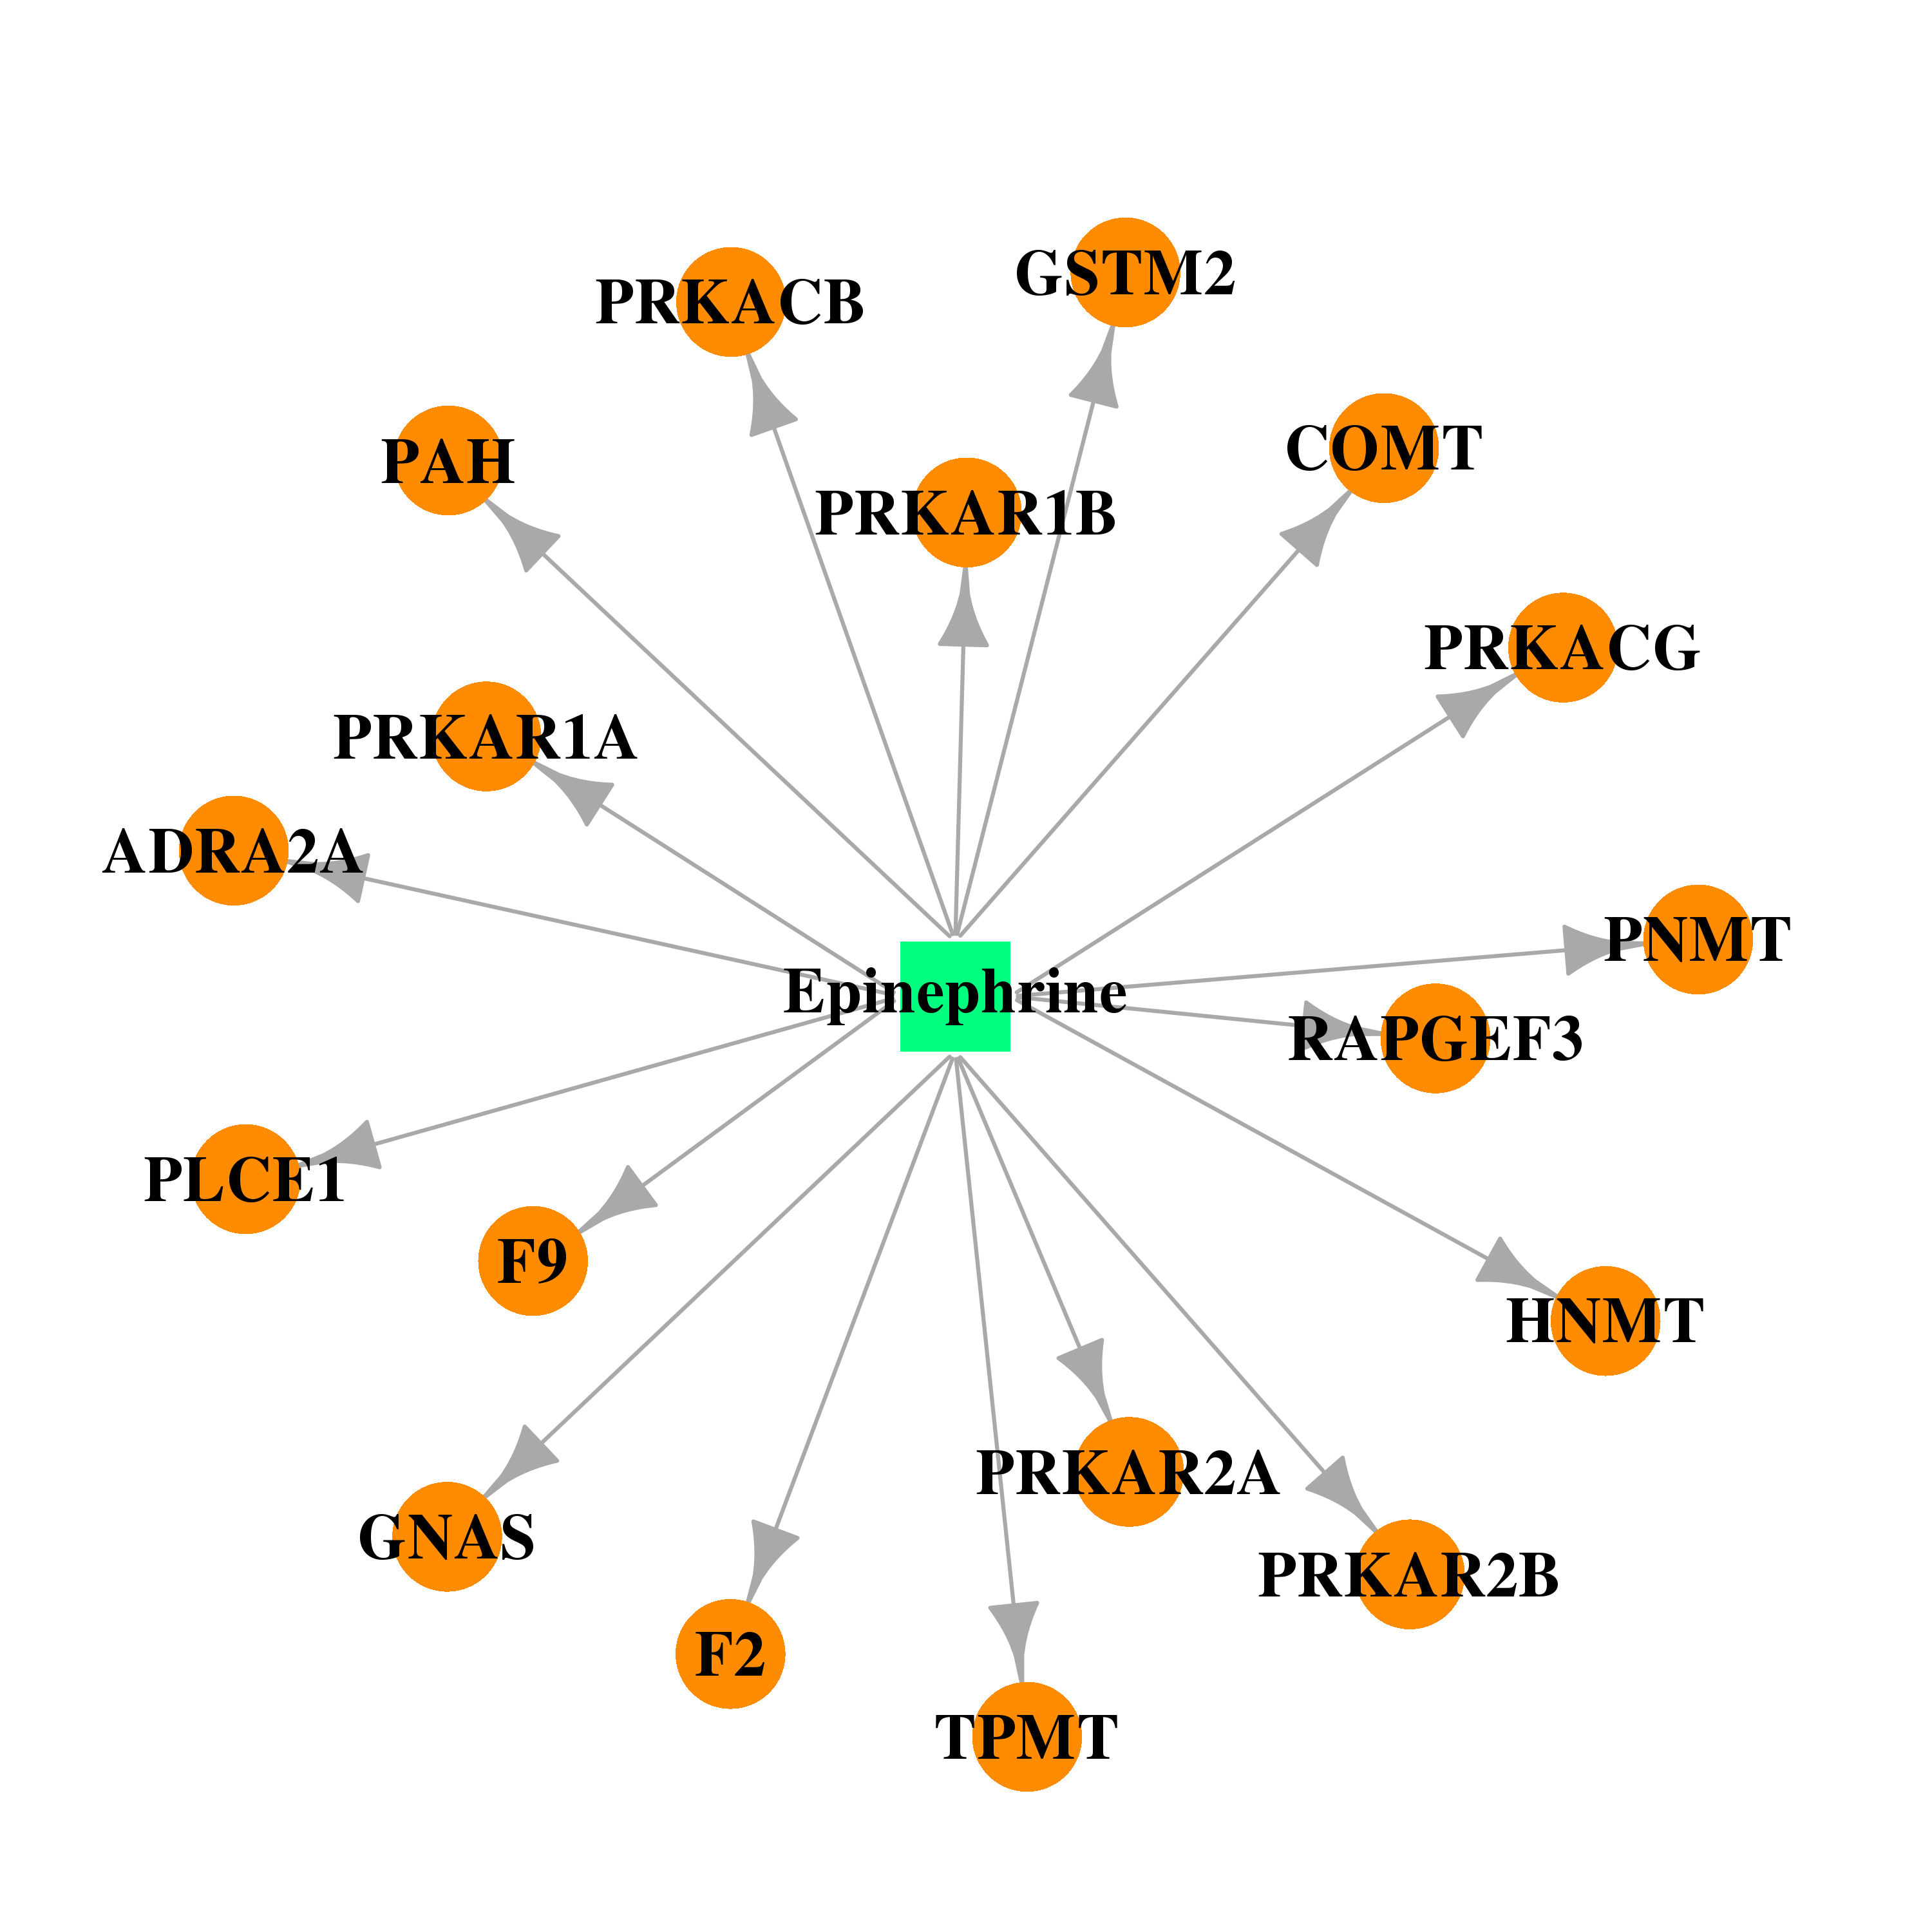 |  |
| Top |
| Cross referenced IDs for PLCE1 |
| * We obtained these cross-references from Uniprot database. It covers 150 different DBs, 18 categories. http://www.uniprot.org/help/cross_references_section |
: Open all cross reference information
|
Copyright © 2016-Present - The Univsersity of Texas Health Science Center at Houston @ |